Embed Size (px)
Citation preview
1
Abstract— Recent heavy ion measurements of the Single-Event Upset (SEU) cross-section for 65nm embedded B lock RAM are presented. Results of initial investigation into the on-chip Error Detection and Correction (EDAC) are also discussed.
Index Terms—Single Event Ef fects, Field Programmable Gate Arrays, Error Detect and Correct, Upset Mitigation
I. INTRODUCTION
TATIC Random Access Memory (SRAM) Field Programmable Gate Arrays (FPGA) have gained interest in
recent years as an enabling technology in the aerospace arena [1]-[4]. SRAM-based FPGAs are composed of configurable logic blocks (CLBs) surrounded by programmable input/output blocks (IOBs) interconnected by programmable routing resources. The CLBs contain look-up tables (LUTs), multiplexors, and flip-flops (FFs). When programmed, the configuration logic defines the functionality of the FPGAs building blocks. While the high density and ability to reconfigure the device are desirable, it has historically come at the cost of highly single-event upset (SEU) sensitive cells, which required additional mitigation to achieve SEU robustness.
The Xilinx XQR5VFX130 [also known as the single event immune reconfigurable FPGA (SIRF)] is a high-density radiation hardened by design (RHBD) FPGA. The 1.0V devices are manufactured on a 65nm UMC process. While the majority of the device’s fabric consists of RHBD SRAM configuration logic, other components, including the block RAM (BRAM) and clocking features, are unhardened by design. In order to mitigate the inherent SEU sensitivity of
Manuscript received September 9, 2010. Parts of this work were carried out by the Jet Propulsion Laboratory, California Institute of Technology under contract with the National Aeronautic and Space Administration (NASA) with funding from the NASA Electronics Parts Program (NEPP). Copyright 2010. All rights reserved.
G. R. Allen is with the Jet Propulsion Laboratory, Pasadena, CA 91109 USA. (phone: 818-393-7558; fax: 818-393-4559; e-mail: [email protected]).
L. D. Edmonds is with the Jet Propulsion Laboratory, Pasadena, CA 91109 USA. (e-mail: [email protected]).
C. W. Tseng, G M. Swift, and C. Carmichael are with Xilinx Inc., San Jose, CA 95124 USA.
the BRAM, an embedded error detect and correct (EDAC) scheme is implemented within the FPGA.
In this paper we present the first published radiation data on the XQR5VFX130. Specifically, we show data on the SEU susceptibility of the internal BRAM and the relative effectiveness of the EDAC scheme. We also present a previously unpublished analysis of EDAC word error rates [5].
II. EXPERIMENTAL PROCEDURE
A. Device Description and Experimental Preparation The XQR5VFX130 used for these experiments were a
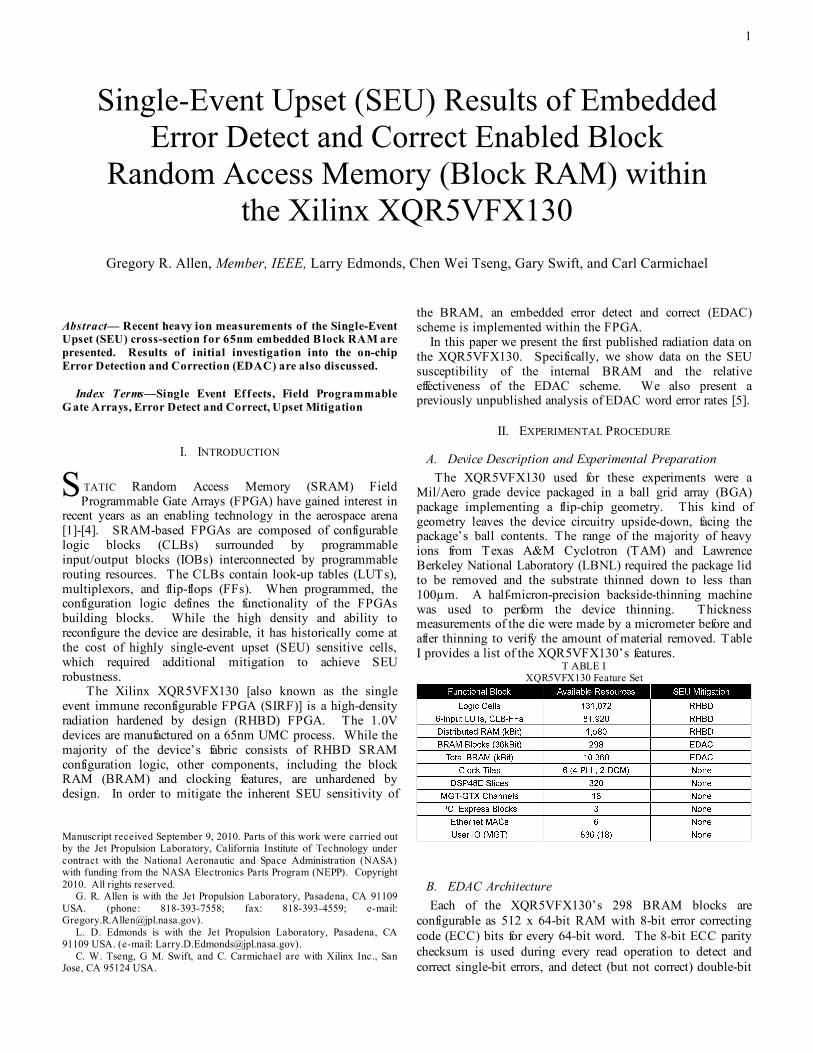
Mil/Aero grade device packaged in a ball grid array (BGA) package implementing a flip-chip geometry. This kind of geometry leaves the device circuitry upside-down, facing the package’s ball contents. The range of the majority of heavy ions from Texas A&M Cyclotron (TAM) and Lawrence Berkeley National Laboratory (LBNL) required the package lid to be removed and the substrate thinned down to less than 100µm. A half-micron-precision backside-thinning machine was used to perform the device thinning. Thickness measurements of the die were made by a micrometer before and after thinning to verify the amount of material removed. Table I provides a list of the XQR5VFX130’s features.
T ABLE I XQR5VFX130 Feature Set
B. EDAC Architecture Each of the XQR5VFX130’s 298 BRAM blocks are
configurable as 512 x 64-bit RAM with 8-bit error correcting code (ECC) bits for every 64-bit word. The 8-bit ECC parity checksum is used during every read operation to detect and correct single-bit errors, and detect (but not correct) double-bit
Single-Event Upset (SEU) Results of Embedded Error Detect and Correct Enabled Block
Random Access Memory (Block RAM) within the Xilinx XQR5VFX130
Gregory R. Allen, Member, IEEE, Larry Edmonds, Chen Wei Tseng, Gary Swift, and Carl Carmichael
S
2
errors. During a write condition, the parity checksum is generated and stored. For every word read, the 72-bits are fed into an ECC decoder which generates status bits indicating: no error, single-bit error detected and corrected, or double-bit error detected. The BRAM words are implemented with an interleaved bit separation scheme such that every bit in the word is in a separate BRAM block.
C. Test Setup and Facility The devices under test (DUTs) were tested using a custom
FPGA-based motherboard and custom daughter cards. Two laptops were used to interface with the motherboard via digital IO interfaces. The laptops monitored and recorded the DUT’s configuration and functional status. Power was supplied to the DUT and motherboard supplies separately and recorded via a laptop and custom software. Heavy ion testing was performed in air at TAM, in vacuum at LBNL, and both in air and vacuum at UC Davis.
D. Experimental Methods There have been various methodologies over the years to
quantify and extrapolate the failure rate of EDAC mitigation schemes for space environments [5]-[8]. Such methodologies require EDAC failures counted as a function of raw bit-flip rates and scrub (word refresh) times. The theoretical model presented in this paper requires the per-bit flip rate (RBF), cycle (or refresh) time (TC), total number of words (NW), and the number of bits in the word (NB/W) and checksum. After a series of bounds are calculated and found to be in agreement, an EDAC word error rate (EWER) can be calculated from (1). The derivation of (1) is provided in the appendices.
€
EWER =12TCNWNBW (NBW −1)RBF
2 (1) The underlying per‐bit upset rate (bit‐errors per bit‐
second), RBF, is a product of two measurement parameters: the per‐bit SEU cross‐section and the ion flux. A per‐bit cross section is calculated based on the effective LET selected by the test engineer and the given static cross‐section. See Fig. 1. This information is needed to assign a numerical value to RBF in a given environment so that the EWER in that environment can be calculated from (1). However, when (1) is interpreted as expressing the EWER as a function of RBF, then (1) becomes a device characteristic that is independent of the environment and that can be tested in the laboratory. Two types of tests were performed. The first type, with results given in Section III-A, measures the cross section data (e.g., Fig. 1 for heavy ions) needed to calculate RBF in a given environment. The second type, with results given in Section III-B, measures the EWER as a function of RBF. For the second test, once a convenient effective LET is selected, only the flux is varied to achieve data that is plotted against the theoretical prediction. While either parameter, LET or flux, can be varied to achieve various values of RBF, the flux is generally varied to save time at the accelerator. For each run, the system‐error cross‐section (per device) is calculated in the usual manner (the number of system errors divided by the total fluence). The system‐error cross‐section is multiplied by the recorded flux and the EWER is the product. Then, the raw bit-flip rate is calculated by multiplying the flux by the raw bit-flip cross section corresponding to the test ion. Finally, the EWER is plotted
against the raw bit‐flip rate showing an experimental determination of EWER as a function of RBF.
It is critically important to record the instantaneous flux provided by the facility. While a sudden burst in flux may not drastically change the end of run calculated average flux, the majority of the EDAC Word Errors (EWE) may result from an instantaneous flux increase. The test engineer may choose to either add error bars along the abscissa ordinate to account for flux fluctuation, or discount the events that occurred during the flux increase, while adjusting the total fluence and average flux measurements.
Another important note concerns the selection of the LET (assuming the test engineer chooses to vary flux at a given LET). An LET should be chosen from the saturated region of the static cross-section curve (unless there are range limitations requiring a lower LET). The reason for this is twofold: first, selecting an LET in the saturated region of the curve will provide a more consistent data set as the underlying bit-flip rate won’t vary significantly due to minor fluctuations in LET. Secondly, MBUs are more probabilistic with higher LET ions [9], so the selection of a high LET ion serves as a worst-case for the EWER.
III. TEST RESULTS
A. Static BRAM Testing 1) Heavy Ion Results
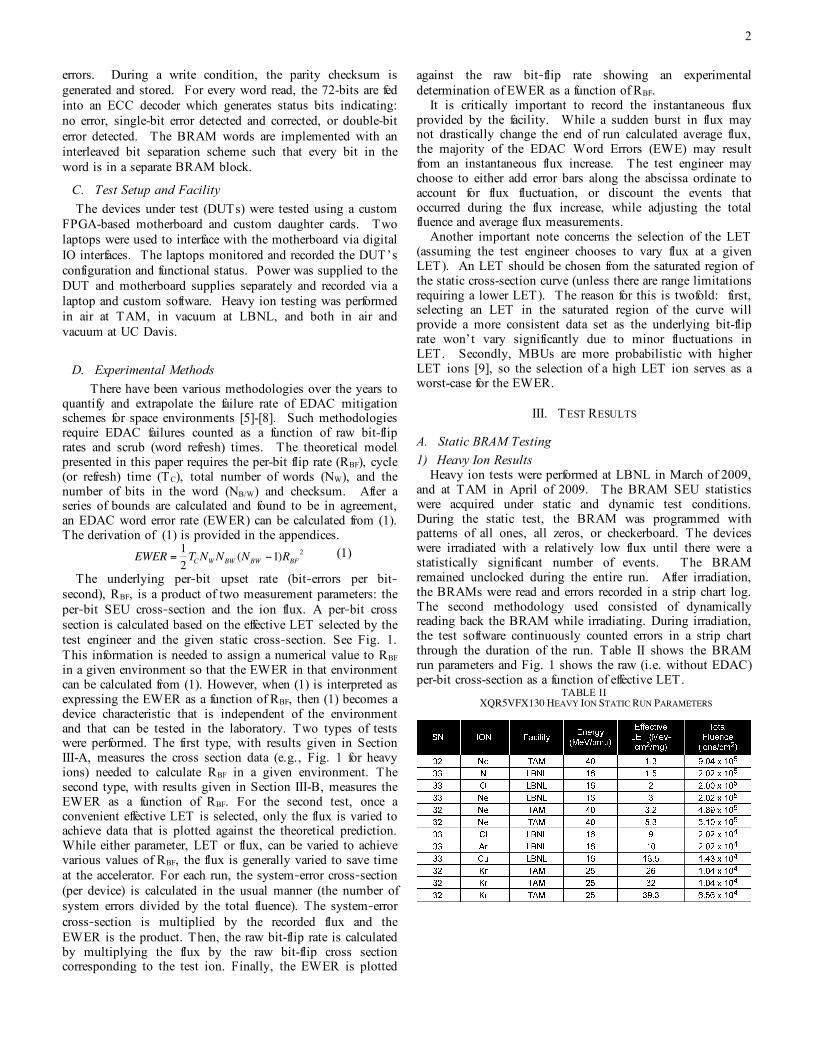
Heavy ion tests were performed at LBNL in March of 2009, and at TAM in April of 2009. The BRAM SEU statistics were acquired under static and dynamic test conditions. During the static test, the BRAM was programmed with patterns of all ones, all zeros, or checkerboard. The devices were irradiated with a relatively low flux until there were a statistically significant number of events. The BRAM remained unclocked during the entire run. After irradiation, the BRAMs were read and errors recorded in a strip chart log. The second methodology used consisted of dynamically reading back the BRAM while irradiating. During irradiation, the test software continuously counted errors in a strip chart through the duration of the run. Table II shows the BRAM run parameters and Fig. 1 shows the raw (i.e. without EDAC) per-bit cross-section as a function of effective LET.
TABLE II XQR5VFX130 HEAVY ION STATIC RUN PARAMETERS
3
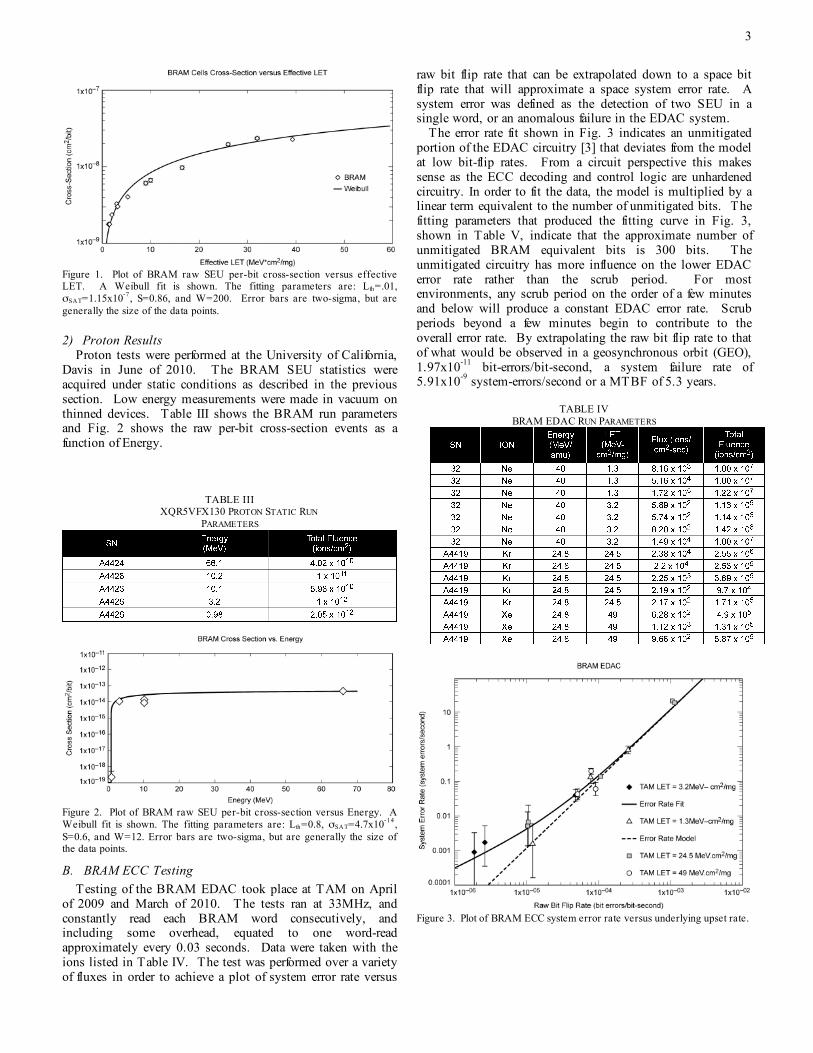
Figure 1. Plot of BRAM raw SEU per-bit cross-section versus effective LET. A Weibull fit is shown. The fitting parameters are: Lth=.01, σSAT=1.15x10⁻⁷, S=0.86, and W=200. Error bars are two-sigma, but are generally the size of the data points. 2) Proton Results Proton tests were performed at the University of California, Davis in June of 2010. The BRAM SEU statistics were acquired under static conditions as described in the previous section. Low energy measurements were made in vacuum on thinned devices. Table III shows the BRAM run parameters and Fig. 2 shows the raw per-bit cross-section events as a function of Energy.
TABLE III XQR5VFX130 PROTON STATIC RUN
PARAMETERS
Figure 2. Plot of BRAM raw SEU per-bit cross-section versus Energy. A Weibull fit is shown. The fitting parameters are: Lth=0.8, σSAT=4.7x10⁻¹⁴, S=0.6, and W=12. Error bars are two-sigma, but are generally the size of the data points.
B. BRAM ECC Testing Testing of the BRAM EDAC took place at TAM on April
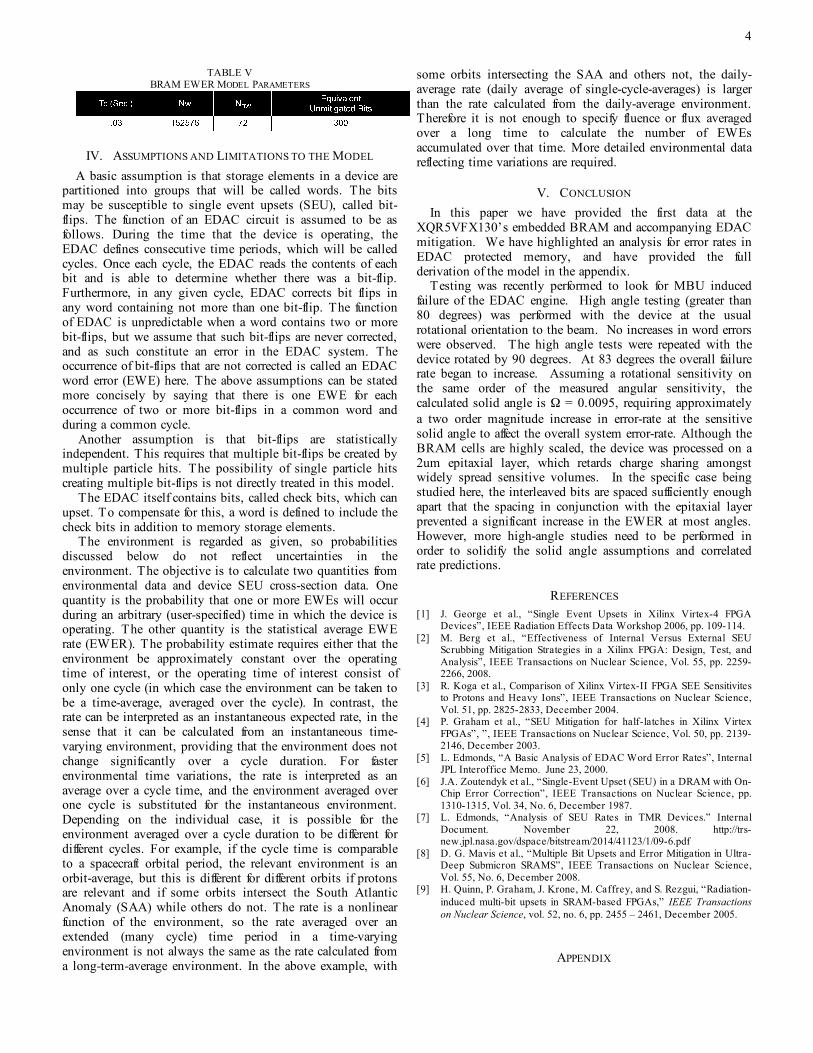
of 2009 and March of 2010. The tests ran at 33MHz, and constantly read each BRAM word consecutively, and including some overhead, equated to one word-read approximately every 0.03 seconds. Data were taken with the ions listed in Table IV. The test was performed over a variety of fluxes in order to achieve a plot of system error rate versus
raw bit flip rate that can be extrapolated down to a space bit flip rate that will approximate a space system error rate. A system error was defined as the detection of two SEU in a single word, or an anomalous failure in the EDAC system. The error rate fit shown in Fig. 3 indicates an unmitigated portion of the EDAC circuitry [3] that deviates from the model at low bit-flip rates. From a circuit perspective this makes sense as the ECC decoding and control logic are unhardened circuitry. In order to fit the data, the model is multiplied by a linear term equivalent to the number of unmitigated bits. The fitting parameters that produced the fitting curve in Fig. 3, shown in Table V, indicate that the approximate number of unmitigated BRAM equivalent bits is 300 bits. The unmitigated circuitry has more influence on the lower EDAC error rate rather than the scrub period. For most environments, any scrub period on the order of a few minutes and below will produce a constant EDAC error rate. Scrub periods beyond a few minutes begin to contribute to the overall error rate. By extrapolating the raw bit flip rate to that of what would be observed in a geosynchronous orbit (GEO), 1.97x10-11 bit-errors/bit-second, a system failure rate of 5.91x10⁻⁹ system-errors/second or a MTBF of 5.3 years.
TABLE IV BRAM EDAC RUN PARAMETERS
Figure 3. Plot of BRAM ECC system error rate versus underlying upset rate.
4
TABLE V BRAM EWER MODEL PARAMETERS
IV. ASSUMPTIONS AND LIMITATIONS TO THE MODEL A basic assumption is that storage elements in a device are
partitioned into groups that will be called words. The bits may be susceptible to single event upsets (SEU), called bit-flips. The function of an EDAC circuit is assumed to be as follows. During the time that the device is operating, the EDAC defines consecutive time periods, which will be called cycles. Once each cycle, the EDAC reads the contents of each bit and is able to determine whether there was a bit-flip. Furthermore, in any given cycle, EDAC corrects bit flips in any word containing not more than one bit-flip. The function of EDAC is unpredictable when a word contains two or more bit-flips, but we assume that such bit-flips are never corrected, and as such constitute an error in the EDAC system. The occurrence of bit-flips that are not corrected is called an EDAC word error (EWE) here. The above assumptions can be stated more concisely by saying that there is one EWE for each occurrence of two or more bit-flips in a common word and during a common cycle. Another assumption is that bit-flips are statistically independent. This requires that multiple bit-flips be created by multiple particle hits. The possibility of single particle hits creating multiple bit-flips is not directly treated in this model. The EDAC itself contains bits, called check bits, which can upset. To compensate for this, a word is defined to include the check bits in addition to memory storage elements. The environment is regarded as given, so probabilities discussed below do not reflect uncertainties in the environment. The objective is to calculate two quantities from environmental data and device SEU cross-section data. One quantity is the probability that one or more EWEs will occur during an arbitrary (user-specified) time in which the device is operating. The other quantity is the statistical average EWE rate (EWER). The probability estimate requires either that the environment be approximately constant over the operating time of interest, or the operating time of interest consist of only one cycle (in which case the environment can be taken to be a time-average, averaged over the cycle). In contrast, the rate can be interpreted as an instantaneous expected rate, in the sense that it can be calculated from an instantaneous time-varying environment, providing that the environment does not change significantly over a cycle duration. For faster environmental time variations, the rate is interpreted as an average over a cycle time, and the environment averaged over one cycle is substituted for the instantaneous environment. Depending on the individual case, it is possible for the environment averaged over a cycle duration to be different for different cycles. For example, if the cycle time is comparable to a spacecraft orbital period, the relevant environment is an orbit-average, but this is different for different orbits if protons are relevant and if some orbits intersect the South Atlantic Anomaly (SAA) while others do not. The rate is a nonlinear function of the environment, so the rate averaged over an extended (many cycle) time period in a time-varying environment is not always the same as the rate calculated from a long-term-average environment. In the above example, with
some orbits intersecting the SAA and others not, the daily-average rate (daily average of single-cycle-averages) is larger than the rate calculated from the daily-average environment. Therefore it is not enough to specify fluence or flux averaged over a long time to calculate the number of EWEs accumulated over that time. More detailed environmental data reflecting time variations are required.
V. CONCLUSION In this paper we have provided the first data at the
XQR5VFX130’s embedded BRAM and accompanying EDAC mitigation. We have highlighted an analysis for error rates in EDAC protected memory, and have provided the full derivation of the model in the appendix.
Testing was recently performed to look for MBU induced failure of the EDAC engine. High angle testing (greater than 80 degrees) was performed with the device at the usual rotational orientation to the beam. No increases in word errors were observed. The high angle tests were repeated with the device rotated by 90 degrees. At 83 degrees the overall failure rate began to increase. Assuming a rotational sensitivity on the same order of the measured angular sensitivity, the calculated solid angle is Ω = 0.0095, requiring approximately a two order magnitude increase in error-rate at the sensitive solid angle to affect the overall system error-rate. Although the BRAM cells are highly scaled, the device was processed on a 2um epitaxial layer, which retards charge sharing amongst widely spread sensitive volumes. In the specific case being studied here, the interleaved bits are spaced sufficiently enough apart that the spacing in conjunction with the epitaxial layer prevented a significant increase in the EWER at most angles. However, more high-angle studies need to be performed in order to solidify the solid angle assumptions and correlated rate predictions.
REFERENCES
[1] J. George et al., “Single Event Upsets in Xilinx Virtex-4 FPGA Devices”, IEEE Radiation Effects Data Workshop 2006, pp. 109-114.
[2] M. Berg et al., “Effectiveness of Internal Versus External SEU Scrubbing Mitigation Strategies in a Xilinx FPGA: Design, Test, and Analysis”, IEEE Transactions on Nuclear Science, Vol. 55, pp. 2259-2266, 2008.
[3] R. Koga et al., Comparison of Xilinx Virtex-II FPGA SEE Sensitivites to Protons and Heavy Ions”, IEEE Transactions on Nuclear Science, Vol. 51, pp. 2825-2833, December 2004.
[4] P. Graham et al., “SEU Mitigation for half-latches in Xilinx Virtex FPGAs”, ”, IEEE Transactions on Nuclear Science, Vol. 50, pp. 2139-2146, December 2003.
[5] L. Edmonds, “A Basic Analysis of EDAC Word Error Rates”, Internal JPL Interoffice Memo. June 23, 2000.
[6] J.A. Zoutendyk et al., “Single-Event Upset (SEU) in a DRAM with On-Chip Error Correction”, IEEE Transactions on Nuclear Science, pp. 1310-1315, Vol. 34, No. 6, December 1987.
[7] L. Edmonds, “Analysis of SEU Rates in TMR Devices.” Internal Document. November 22, 2008. http://trs-new.jpl.nasa.gov/dspace/bitstream/2014/41123/1/09-6.pdf
[8] D. G. Mavis et al., “Multiple Bit Upsets and Error Mitigation in Ultra-Deep Submicron SRAMS”, IEEE Transactions on Nuclear Science, Vol. 55, No. 6, December 2008.
[9] H. Quinn, P. Graham, J. Krone, M. Caffrey, and S. Rezgui, “Radiation- induced multi-bit upsets in SRAM-based FPGAs,” IEEE Transactions on Nuclear Science, vol. 52, no. 6, pp. 2455 – 2461, December 2005.
APPENDIX
5
A.1 Probabilities and Rates Expressed in Terms of the Single Word-Cycle Probability This section expresses probabilities and rates in terms of the "single word-cycle" probability. The latter probability, which is calculated in the next section, is the probability of an EWE in a device containing only one word and operated for only one cycle. The probabilities calculated below from this quantity apply to a device containing multiple words and operated over a user-specified time period containing multiple cycles. The user-specified time period is relevant to the probability estimate, but is not relevant to the rate estimate EWER, because the EWER is defined in terms of a single cycle. The analysis will show that the EWER defined this way is a meaningful quantity, in the sense that it is also equal to the EWE rate averaged over multiple cycles, providing that the environment is constant (caveats regarding time-varying environments were given in Section IV). The following symbols are defined for future use:
T ≡ A user-specified time period that probability estimates refer to.
TC ≡ Cycle duration.
NW ≡ Number of words in the device.
NC ≡ T/TC (i.e., the number of cycles contained in T).
NWC ≡ NW×NC
P1WC ≡ Probability of an EWE in a single word during a
single cycle.
PEWE(K) ≡ Probability that exactly K EWEs will occur in the device over the time duration T.
PEWE(≥1) ≡ Probability that one or more EWEs will occur in
the device over the duration T.
Nexp ≡ Expected (statistical average) number of EWEs in the device over the duration T.
EWER ≡ Expected number of EWEs in the device over one
cycle, divided by the cycle duration. The objective of this section is to express PEWE(≥1) and EWER each in terms of P1WC. For grammatical brevity, we will say that a given word during a given cycle is a corrupted word-cycle if the word accumulated two or more bit-flips during that cycle. The counting convention used here is such that there is one EWE for each occurrence of a corrupted word-cycle. This convention counts multiple corrupted word-cycles as multiple EWEs, even when the corruptions are in the same cycle. An alternate convention counts only one EWE when corruptions occur in the same cycle. Both counting conventions must imply the same result for the probability of one or more EWEs, but the analysis used to derive this result is simpler for the selected
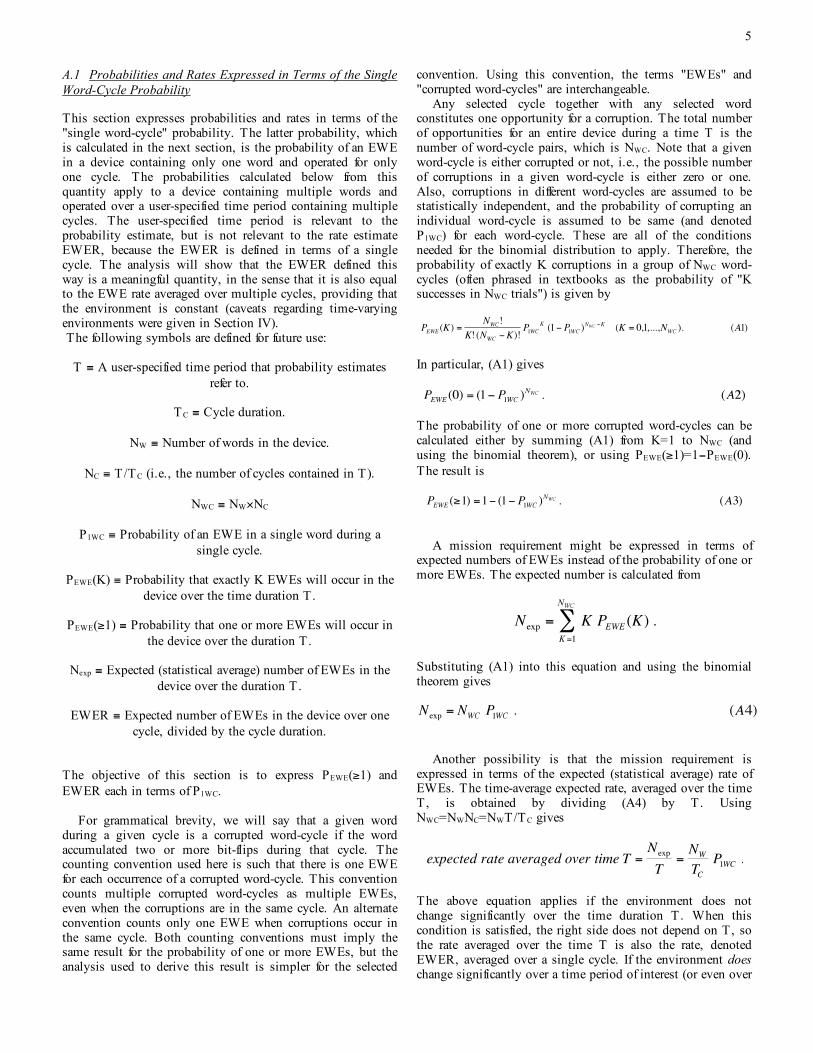
convention. Using this convention, the terms "EWEs" and "corrupted word-cycles" are interchangeable. Any selected cycle together with any selected word constitutes one opportunity for a corruption. The total number of opportunities for an entire device during a time T is the number of word-cycle pairs, which is NWC. Note that a given word-cycle is either corrupted or not, i.e., the possible number of corruptions in a given word-cycle is either zero or one. Also, corruptions in different word-cycles are assumed to be statistically independent, and the probability of corrupting an individual word-cycle is assumed to be same (and denoted P1WC) for each word-cycle. These are all of the conditions needed for the binomial distribution to apply. Therefore, the probability of exactly K corruptions in a group of NWC word-cycles (often phrased in textbooks as the probability of "K successes in NWC trials") is given by
In particular, (A1) gives
The probability of one or more corrupted word-cycles can be calculated either by summing (A1) from K=1 to NWC (and using the binomial theorem), or using PEWE(≥1)=1-PEWE(0). The result is
A mission requirement might be expressed in terms of expected numbers of EWEs instead of the probability of one or more EWEs. The expected number is calculated from
Substituting (A1) into this equation and using the binomial theorem gives
Another possibility is that the mission requirement is expressed in terms of the expected (statistical average) rate of EWEs. The time-average expected rate, averaged over the time T, is obtained by dividing (A4) by T. Using NWC=NWNC=NWT/T C gives
€
expected rate averaged over time T =Nexp
T=NW
TCP1WC .
The above equation applies if the environment does not change significantly over the time duration T. When this condition is satisfied, the right side does not depend on T, so the rate averaged over the time T is also the rate, denoted EWER, averaged over a single cycle. If the environment does change significantly over a time period of interest (or even over
6
one cycle), (A4) is still valid when applied to a single cycle because the same P1WC applies to all trials (all trials now refer to all words during the same cycle instead of all word-cycles). When (A4) is applied to this case we use NWC=NW. Dividing by the cycle time to obtain the EWER gives
A.2. Single Word-Cycle Probability Expressed in Terms of Bit-Flip Rates The objective of this section is to express P1WC in terms of bit-flip rates. In addition to the quantities previously defined, we define the following quantities for future use: NB/W ≡ Number of bits per word (includes check bits). P1B ≡ Probability that one selected bit will flip during a single cycle. RBF ≡ Bip-flip rate (per bit) in the relevant environment. PBF(K) ≡ Probability of exactly K bit-flips in a single word during a single cycle. PBF(≥2) ≡ Probability of two or more bit-flips in a single word during a single cycle. Recall that P1WC is the probability of two or more bit-flips in a single word during a single cycle. Therefore P1WC=PBF(≥2). To calculate PBF(≥2), note that a bit is either flipped or not flipped. We assume that the flipping of one bit is statistically independent of the flipping of another (this assumption is invalid if one particle hit can flip several bits). We also assume that the probability of flipping a bit is the same (and denoted P1B) for all bits (this assumption is invalid if different bits have different susceptibilities). These are all of the conditions needed for the binomial distribution to apply. Therefore the probability of exactly K bit-flips in a group of NB/W bits is given by
Using P1WC=PBF(≥2)=1-PBF(0)-PBF(1) gives
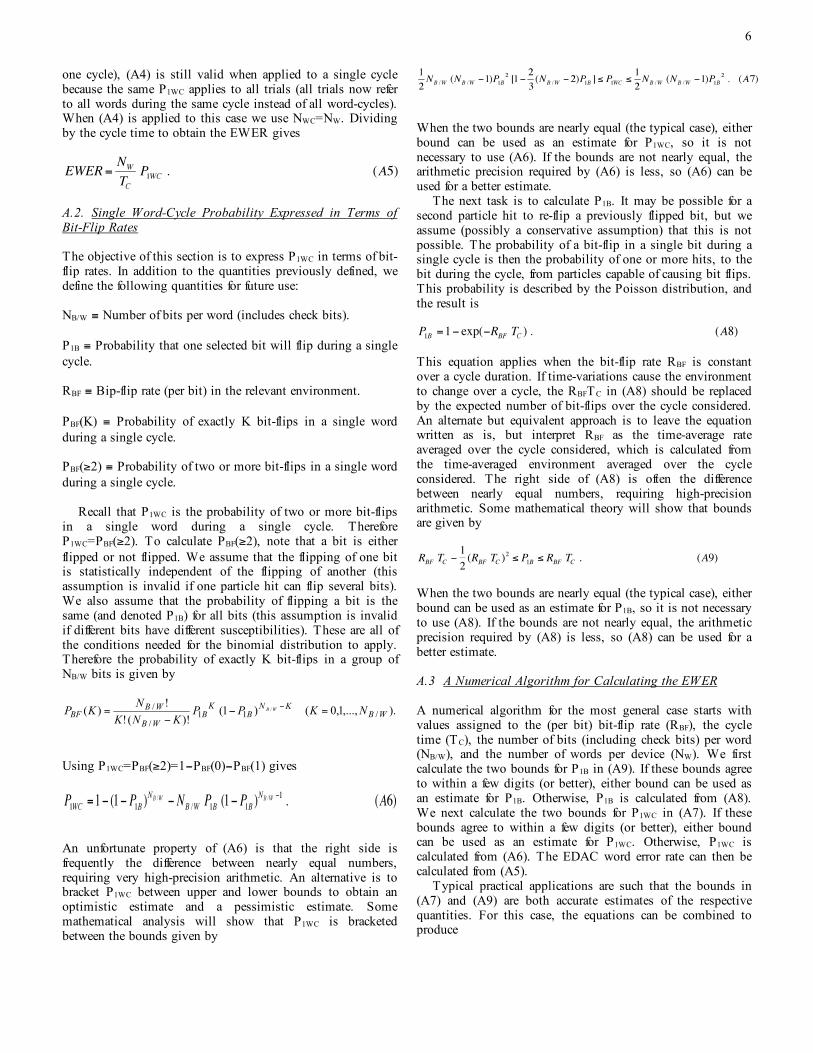
An unfortunate property of (A6) is that the right side is frequently the difference between nearly equal numbers, requiring very high-precision arithmetic. An alternative is to bracket P1WC between upper and lower bounds to obtain an optimistic estimate and a pessimistic estimate. Some mathematical analysis will show that P1WC is bracketed between the bounds given by
When the two bounds are nearly equal (the typical case), either bound can be used as an estimate for P1WC, so it is not necessary to use (A6). If the bounds are not nearly equal, the arithmetic precision required by (A6) is less, so (A6) can be used for a better estimate. The next task is to calculate P1B. It may be possible for a second particle hit to re-flip a previously flipped bit, but we assume (possibly a conservative assumption) that this is not possible. The probability of a bit-flip in a single bit during a single cycle is then the probability of one or more hits, to the bit during the cycle, from particles capable of causing bit flips. This probability is described by the Poisson distribution, and the result is
This equation applies when the bit-flip rate RBF is constant over a cycle duration. If time-variations cause the environment to change over a cycle, the RBFTC in (A8) should be replaced by the expected number of bit-flips over the cycle considered. An alternate but equivalent approach is to leave the equation written as is, but interpret RBF as the time-average rate averaged over the cycle considered, which is calculated from the time-averaged environment averaged over the cycle considered. The right side of (A8) is often the difference between nearly equal numbers, requiring high-precision arithmetic. Some mathematical theory will show that bounds are given by
€
RBF TC −12(RBF TC )
2 ≤ P1B ≤ RBF TC . (A9)
When the two bounds are nearly equal (the typical case), either bound can be used as an estimate for P1B, so it is not necessary to use (A8). If the bounds are not nearly equal, the arithmetic precision required by (A8) is less, so (A8) can be used for a better estimate. A.3 A Numerical Algorithm for Calculating the EWER A numerical algorithm for the most general case starts with values assigned to the (per bit) bit-flip rate (RBF), the cycle time (TC), the number of bits (including check bits) per word (NB/W), and the number of words per device (NW). We first calculate the two bounds for P1B in (A9). If these bounds agree to within a few digits (or better), either bound can be used as an estimate for P1B. Otherwise, P1B is calculated from (A8). We next calculate the two bounds for P1WC in (A7). If these bounds agree to within a few digits (or better), either bound can be used as an estimate for P1WC. Otherwise, P1WC is calculated from (A6). The EDAC word error rate can then be calculated from (A5). Typical practical applications are such that the bounds in (A7) and (A9) are both accurate estimates of the respective quantities. For this case, the equations can be combined to produce
7
€
EWER ≈ 12TC NW NB /W (NB /W −1) RBF
2 (A10)
This approximation is accurate for nearly all practical applications, and conservative when not accurate. Note that a simpler derivation of (A10) could have been given if it is simply assumed that the rates are small enough to justify various approximations, but the longer derivation given here has two advantages over the simpler derivation. The first is that it quantifies how small is small enough in the sense of providing an error estimate. For example, the two bounds in (A9) show that using the upper bound RBFTC as an estimate for P1B produces less than 1% error if RBFTC is less than 0.02. Similarly, the two bounds in (A7) show that using the upper bound as an estimate for P1WC produces less than 1% error if P1B is less than 0.015/(NB/W-2). The second advantage is that it shows that the final rate estimate (A10) is conservative when not accurate.