Embed Size (px)
Citation preview

arX
iv:1
707.
0376
1v1
[as
tro-
ph.H
E]
12
Jul 2
017
MNRAS 000, 1–13 (2017) Preprint 13 July 2017 Compiled using MNRAS LATEX style file v3.0
Single-dish and VLBI observations of Cygnus X-3 during
the 2016 giant flare episode
E. Egron1⋆, A. Pellizzoni1, M. Giroletti2, S. Righini2, M. Stagni2, A. Orlati2,
C. Migoni1, A. Melis1, R. Concu1, L. Barbas3, S. Buttaccio4, P. Cassaro4,
P. De Vicente3, M.P. Gawronski5, M. Lindqvist6, G. Maccaferri2, C. Stanghellini2,
P. Wolak5, J. Yang6, A. Navarrini1, S. Loru1, M. Pilia1, M. Bachetti1, M.N. Iacolina7,1,
M. Buttu1, S. Corbel8,9, J. Rodriguez8, S. Markoff10, J. Wilms11, K. Pottschmidt12,13,
M. Cadolle Bel14, E. Kalemci15, T. Belloni16, V. Grinberg17, M. Marongiu18,1,
G.P. Vargiu1, A. Trois1
1INAF, Osservatorio Astronomico di Cagliari, Via della Scienza 5, 09047 Selargius, Italy2INAF, Istituto di Radio Astronomia di Bologna, Via P. Gobetti 101, 40129 Bologna, Italy3Centro Nacional de Tecnologıas Radioastronomicas y Aplicaciones Geoespaciales(CNTRAG), Observatorio de Yebes (IGN), Spain4INAF, Istituto di Radioastronomia, Sezione di Noto, Contrada Renna Bassa, 96017 Noto, Italy5Torun Centre for Astronomy, N. Copernicus University, Gagarina 11, 87-100 Torun, Poland6Department of Earth and Space Sciences, Chalmers University of Technology, Onsala Space Observatory, 439 92 Onsala, Sweden7Agenzia Spaziale Italiana - Via del Politecnico snc 00133 Roma, Italy8Laboratoire AIM, UMR 7158, CEA/CNRS/Universite Paris Diderot, CEA DRF/IRFU/DAp, 91191 Gif-sur-Yvette, France9Station de Radioastronomie de Nancay, Observatoire de Paris, PSL Research University, CNRS, Univ. Orleans, 18330 Nancay, France10Anton Pannekoek Institute for Astronomy, University of Amsterdam, PO Box 94249, 1090 GE Amsterdam, The Netherlands11Dr.Karl-Remeis-Sternwarte and Erlangen Centre for Astroparticle Physics (ECAP), Friedrich Alexander Universitat Erlangen-Nurnberg,Sternwartstr. 7, 96049 Bamberg, Germany12CRESST and NASA Goddard Space Flight Center, Astrophysics Science Division, Code 661, Greenbelt, MD 20771, USA13Center for Space Science and Technology, University of Maryland Baltimore County, 1000 Hilltop Circle, Baltimore, MD 21250, USA14Max Planck Computing and Data Facility, 85748 Garching, Germany15Faculty of Engineering and Natural Sciences, Sabancı University, Orhanlı -Tuzla, 34956 Istanbul, Turkey16INAF, Osservatorio Astronomico di Brera, via E. Bianchi 46, 23807 Merate, Italy17ESA/ESTEC, Keplerlaan 1, 2201 AZ Noordwijk, The Netherlands18Department of Physics and Earth Sciences, University of Ferrara, via Saragat 1, 44122 Ferrara, Italy
Accepted XXX. Received YYY; in original form ZZZ
ABSTRACTIn September 2016, the microquasar Cygnus X-3 underwent a giant radio flare, whichwas monitored for 6 days with the Medicina Radio Astronomical Station and theSardinia Radio Telescope. Long observations were performed in order to follow theevolution of the flare on a hourly scale, covering six frequency ranges from 1.5 GHzto 25.6 GHz. The radio emission reached a maximum of 13.2 ± 0.7 Jy at 7.2 GHz and10±1 Jy at 18.6 GHz. Rapid flux variations were observed at high radio frequencies atthe peak of the flare, together with rapid evolution of the spectral index: α steepenedfrom 0.3 to 0.6 (with Sν ∝ ν−α) within 5 hours. This is the first time that suchfast variations are observed, giving support to the evolution from optically thick tooptically thin plasmons in expansion moving outward from the core. Based on theItalian network (Noto, Medicina and SRT) and extended to the European antennas(Torun, Yebes, Onsala), VLBI observations were triggered at 22 GHz on five differentoccasions, four times prior to the giant flare, and once during its decay phase. Fluxvariations of 2-hour duration were recorded during the first session. They correspondto a mini-flare that occurred close to the core ten days before the onset of the giantflare. From the latest VLBI observation we infer that four days after the flare peakthe jet emission was extended over 30 mas.
Key words: radio continuum: stars – X-rays: binaries – stars: individual: Cyg X-3 –stars: flare – stars: jets
© 2017 The Authors

2 Egron et al.
1 INTRODUCTION
Galactic X-ray binaries with jets are called microquasars,in analogy to the phenomena seen in quasars but on muchsmaller scales (Mirabel & Rodrıguez 1999). Most micro-quasars host a stellar-mass black hole as the compact ob-ject. They spend most of their time in a dormant stateand suddenly enter into periods of outburst activity. Ma-jor progress has been made in the understanding of the ac-cretion/ejection connections thanks to multi-wavelength ob-servations. However, the formation of relativistic jets, theircomposition and exact launching mechanisms are still poorlyknown.
Discovered by Giacconi et al. (1967) at the dawnof X-ray astronomy, Cygnus X-3 (Cyg X-3) is a rarehigh-mass X-ray binary consisting of a compact objectwind-fed by a Wolf-Rayet star (van Kerkwijk et al. 1996;Fender et al. 1999; Koch-Miramond et al. 2002). The na-ture of the compact object is still uncertain, but a blackhole seems to be favored considering X-ray and radio emis-sions (Hjalmarsdotter et al. 2009; Shrader et al. 2010, andreferences therein). Located in the Galactic plane at adistance of 7–9 kpc (Predehl et al. 2000; Ling et al. 2009;McCollough et al. 2016), Cyg X-3 has a short orbital pe-riod of 4.8 hr (Parsignault et al. 1972). It is a reasonablystrong persistent radio source with a typical flux of about100–200 mJy in the quiescent state (Waltman et al. 1996).Flares of various amplitudes are frequently detected, classi-fied as minor or major flares according to the flux densitybelow or above 1 Jy. Quenched radio states (< 30 mJy;Waltman et al. 1996) are occasionally observed for Cyg X-3. They are usually followed by major radio flares on a scaleof a few days or weeks (Waltman et al. 1994, 1995). Radiofluxes of 10–20 Jy associated with giant flare events havebeen measured, with an increasing flux of a factor ∼ 1000
in a few days (Waltman et al. 1995; Mioduszewski et al.2001; Miller-Jones et al. 2004; Corbel et al. 2012). No otherX-ray binary has shown such strong and uncommon fluxdensities up to 20 Jy, which makes Cyg X-3 the bright-est X-ray binary at radio frequencies. One- and two-sidedrelativistic jets with a complex structure were clearly re-solved during these episodes using the Very Long Ar-ray (VLA), the Very Long Baseline Array (VLBA) andthe European Very Long Baseline Interferometry Net-work (e-EVN) (Martı et al. 2001; Mioduszewski et al. 2001;Miller-Jones et al. 2004; Tudose et al. 2007).
X-ray data from Cyg X-3 is more complex com-pared to other X-ray binaries (Bonnet-Bidaud & Chardin1988; Szostek & Zdziarski 2008; Koljonen et al. 2010).Strong X-ray absorption at low energies is likely as-sociated with the dense wind of the companion star(Szostek & Zdziarski 2008). Despite the complex spec-tral behaviour, observations have demonstrated that thesource exhibits the canonical X-ray states (hard, intermedi-ate, and soft states; McClintock & Remillard 2006; Belloni2010) in addition to the very high state and the ultra-soft state (Szostek & Zdziarski 2004; Hjalmarsdotter et al.2009). The connections between the X-ray (accretion) andradio (ejections) emission of Cyg X-3 have been widelystudied (Watanabe et al. 1994; McCollough et al. 1999;Gallo et al. 2003; Hjalmarsdotter et al. 2008; Szostek et al.2008; Zdziarski et al. 2016). In particular, giant radio flares
correspond to the transition from the ultra-soft state to aharder X-ray state (Koljonen et al. 2010).
Cyg X-3 was also the first microquasar detected ingamma rays with AGILE and Fermi/LAT (Tavani et al.2009; Fermi LAT Collaboration et al. 2009), providingunique insight into the particle acceleration up to GeVenergies during the ejection. Gamma-ray emission wasdetected by Fermi-LAT during the 2011 giant flare episode(Corbel et al. 2012). The high-energy emission (> 100MeV) corresponds to transitions in and out of ultra-softX-ray state.
The Sardinia Radio Telescope (SRT1) has carried outa large-monitoring program of several X-ray binaries dur-ing the Early Science Program (ESP2), from February toJuly 2016 (PI: Egron). The weekly monitoring performedat 7.2 and 22 GHz has shown that Cyg X-3 was in thequiescent state during this period. A quenched radio statewas detected by the RATAN-600 on 23–25 August 2016(Trushkin et al. 2016b), five and a half years after its lastquenched episode. The ultra-soft X-ray state was confirmedby Swift/BAT3, which registered a strong decrease of a fac-tor 25 of the hard X-ray emission in the 15–50 keV bandin less than 10 days, from 15 August to 24 August. TheAGILE-GRID detector revealed gamma-ray emission above100 MeV consistent with the position of Cyg X-3 on 28–30August (Piano et al. 2016). The strong increase of the radioflux occurred from 14 September, three weeks after the tran-sition to the quenched radio state (Trushkin et al. 2016b,c).A gamma-ray flare was detected by Fermi/LAT the samedays, on 15–16 September (Cheung & Loh 2016).
In this paper, we present single-dish and Very LongBaseline Interferometry (VLBI) observations of Cyg X-3 cor-responding to the 2016 September giant flare episode. Wepresent the details of the observations and data reduction inSection 2, the evolution of the flux density and spectral indexin Section 3, and discuss the results we obtained, in particu-lar the jet characteristics and morphologies associated withthe mini and giant flares in Section 4.
2 OBSERVATIONS AND DATA REDUCTION
We initially planned to perform VLBI observations to catchthe source during the rising and declining phases of the flarein order to track the evolution of the relativistic jets. Dueto the difficulty to trigger VLBI observations in a very shorttime (considering the availability of the antennas), we con-ducted single-dish observations at the moment of the peakof the flare (Egron et al. 2016a). The recently commisioned64m-SRT (Bolli et al. 2015; Prandoni et al. 2017) partici-pated in both single-dish and VLBI observations, togetherwith the 32m-Medicina radio telescope. VLBI observationsincluded SRT, Medicina, Noto, Torun, Yebes and Onsala inorder to provide a larger coverage of the (u, v)-plane.
1 www.srt.inaf.it2 www.srt.inaf.it/astronomers/early-science-program-FEB-2016/3 see Krimm et al. 2013 for a description of the Swift/BAT tran-sient monitor
MNRAS 000, 1–13 (2017)

Cyg X-3 during the 2016 giant flare 3
Table 1. Beam sizes at the observed frequencies using SRT andMedicina as single-dish radio telescopes.
Radio Frequency Beam sizeTelescope (GHz) (arcmin)
SRT 1.5 12.27.2 2.6322.7 0.816
Medicina 8.5 4.5518.6 2.0825.6 1.51
2.1 Single-dish observations
A Target-Of-Opportunity program for Cyg X-3 was trig-gered by the Italian Medicina Radio Astronomical Stationand SRT single dishes. The outburst was followed from 17 to23 September 2016. Both antennas were equipped with thesame control software designed to optimize single-dish obser-vations (Orlati et al. 2016). The frequency agility (switchingthe observing frequencies in only a few minutes) coupledwith the different SRT and Medicina receivers enabled alarge frequency coverage of Cyg X-3 during the flare, from1.5 GHz to 25.6 GHz.
SRT observations were carried out at 1.5 GHz (L-band),7.2 GHz (C-band), and 22.7 GHz (K-band) using the To-tal Power and SARDARA (Melis et al. in prep.) back-ends in piggy-back mode. Observations consist of rectangu-lar and perpendicular On-The-Fly (OTF) maps performedin the Right Ascension (RA) and Declination (DEC) di-rections (forming a Greek cross map), at constant velocity(4′/sec). The dimensions of the maps were chosen accordingto the beam size (see Table 1) at the observed frequencies:1.5◦×0.6◦ at 1.55 GHz, 0.5◦×0.12◦ at 7.2 GHz and 0.2◦×0.05◦
at 22.7 GHz. This method has been applied during the EarlyScience Program dedicated to the monitoring of X-ray bi-nary systems. The observing strategy has the advantage ofproviding a direct image of the sources in the vicinity of thetarget and a better estimate of the flux density. The dataanalysis was accomplished with the SRT Single-Dish-Imager(SDI; Egron et al. 2016b), a software designed to performautomated baseline subtraction, radio interference rejection,and calibration. The spectral flux density of the target wasreconstructed by observing three calibrators (3C286, 3C295and 3C48) at all frequencies, by applying the values andpolynomial expressions proposed by Perley & Butler (2013).
Cyg X-3 was observed with Medicina at 8.5 GHz (X-band), 18.6 GHz and 25.6 GHz (K-band), using the OTFcross-scan technique in RA and DEC directions. In X-band,the bandwidth was 680 MHz with a scan length and ve-locity of 0.6◦ and 2.4′/sec respectively, while in K-band weselected a bandwidth of 1200 MHz, scans of 0.2◦ length anda scan velocity of 0.8′/sec. We applied gain curve and point-ing offset corrections to the measurements. Additional opac-ity and atmospheric corrections were added in the case ofK-band data (18.6 GHz and 25.6 GHz). The flux calibra-tion was performed with observations of 3C286, 3C48 andNGC7027. The flux of 3C286 was calculated according toPerley & Butler (2013), while the fluxes of the other cali-brators were reckoned on the basis of Ott et al. (1994). Thesingle-dish observations are reported in Table 2.
Table 2. Single-dish observations of Cyg X-3 performed withMedicina at 8.5, 18.6 and 25.6 GHz, and with SRT at 1.5, 7.2and 22.7 GHz.
Obs date MJD Frequency Flux density(GHz) (Jy)
17 Sept 2016 57648.86 8.5 13.1 ± 0.457648.88 12.9 ± 0.457648.90 13.0 ± 0.457648.92 12.9 ± 0.457648.95 18.6 7.5 ± 0.857648.97 25.6 7.0± 0.7
19 Sept 2016 57650.62 7.2 12.0 ± 0.657650.65 8.5 12.9 ± 0.457650.67 12.9 ± 0.457650.67 7.2 12.6 ± 0.657650.70 13.1 ± 0.757650.70 18.6 8.9 ± 0.957650.71 7.2 12.8 ± 0.657650.72 22.7 9.5 ± 0.957650.73 18.6 10 ± 157650.77 7.2 13.2 ± 0.757650.88 12.8 ± 0.657650.91 12.9 ± 0.657650.91 25.6 6.1 ± 0.657650.93 5.6 ± 0.657650.95 22.7 6.4 ± 0.6
20 Sept 2016 57651.54 7.2 11.4 ± 0.657651.61 8.5 12.1 ± 0.457651.63 7.2 11.8 ± 0.657651.65 18.6 7.2 ± 0.757651.68 25.6 7.3 ± 0.7
21 Sept 2016 57652.67 7.2 6.9 ± 0.3
57652.72 22.7 3.6 ± 0.457652.76 1.5 14.4 ± 0.5
22 Sept 2016 57653.97 8.5 3.2 ± 0.157653.99 3.1 ± 0.1
23 Sept 2016 57654.00 8.5 3.1 ± 0.1
2.2 VLBI observations
We triggered five VLBI observations on Cyg X-3, from thequenched radio state until the end of the strong flare episode.Our aim was to catch the target in the rising and fadingphases of the predicted giant flare (Trushkin et al. 2016b) inorder to follow the evolution of the relativistic jets. The firsttwo VLBI observations were triggered on 1 and 3 September2016, right after the first increase of the hard X-ray emissionrecorded by the Swift/BAT on 29 August 2016. It turned outthat the X-ray flux decreased three days later and the giantflare did not occur at that time. We triggered other VLBIobservations a few days later, on 9 and 10 September 2016,after a second increase of the X-ray flux on 8 September. Thelast observation was carried out on 23 September, duringthe declining phase of the giant radio flaring episode. Theobserving sessions are indicated in the bottom panel of theFigure 1.
The VLBI observations were performed at 22 GHz withthe following radio telescopes, according to their availabil-ity: SRT (Sr), Medicina (Mc), Noto (Nt, 32m, Italy), Torun(Tr, 32m, Poland), Yebes (Ys, 40m, Spain) and Onsala (On,20m, Sweden). We alternately observed Cyg X-3 and thecalibrators 3C345, BL Lac, J2007+4029, and J2015+3710,resulting in sessions of 7–15.5 hrs each. The data were
MNRAS 000, 1–13 (2017)

4 Egron et al.
Figure 1. From the top to the bottom: a) Swift/BAT 15–50 keV (Hard X-rays) light curve of Cyg X-3 in Crab units from 31 July to 09October 2016. The gamma-ray detections with AGILE and Fermi/LAT are also reported; b) MAXI 2–4 keV (Soft X-rays) light curve inCrab units; c) Hardness ratio corresponding to (Hard-Soft)/(Hard+Soft); d) Single-dish (cross: 8.5 GHz; diamond: 7.2 GHz) and VLBIdata at 22 GHz (asterisk). The dashed line and the dotted line indicate the first VLBI observation and the first single-dish observation,respectively. The vertical arrows represent the VLBI upper limits at 5σ confidence.
processed with the DiFX correlator (Deller et al. 2011) in-stalled and operated in Bologna. The VLBI analysis wasperformed with the Astronomical Image Processing System(AIPS; Greisen 2003). The calibrator J2007+4029 was usedto perform the phase referencing. The phase-referencing cy-cle was 4min: 2.5min on the target and 1.5min on phase-cal. Since the calibrator-target separation was quite large(d = 4.7◦), and the region is subject to significant scatter,
we also observed the check source J2015+3710 every 30min.This source was also phase-referenced to J2007+4029 and itwas used to confirm that the phase solutions were trans-ferred correctly. We also tried to fringe-fit the Cyg X-3 datadirectly, in order to estimate its signal-to-noise ratio in each2.5min long scan. However, these results were rather usedfor data quality assessment than for further analysis.
MNRAS 000, 1–13 (2017)

Cyg X-3 during the 2016 giant flare 5
Figure 2. Top panel: Medicina and SRT observations coveringthe peak of the giant flare (see Table 2 for more details). Lowerfrenquencies are indicated in red while higher frequencies are in
blue. Bottom panel: Evolution of the spectral index α.
3 RESULTS
3.1 Single-dish monitoring of the giant flare
Medicina and SRT provided the monitoring of Cyg X-3 from17 September to 23 September at 1.5, 7.2, 8.5, 18.6, 22.7 and25.6 GHz, which was complementary to the daily monitor-ing of the source performed with the RATAN-600 (coveringthe 2.3, 4.6, 8.2, 11.2, 21.7 GHz frequencies; Trushkin et al.2016a). Our observations are summarized in Table 2 andrepresented in Fig. 1, together with the X-ray light curvesobtained with data daily averages from Swift/BAT at 15–50keV and MAXI at 2–4 keV in Crab units4. The hardnessratio obtained from Swift/BAT and MAXI data is also re-ported despite the lack of MAXI data during most of theultra-soft X-ray state, even though present in the Swift/BATlight curve.
The giant radio flare reached its highest brightness on19 September 2016 (MJD 57650.7). While the flux densityremained quite stable (∼ 13 Jy) at 7.2–8.5 GHz during thepeak maximum, we observed flux variations on the timescaleof a few hours in K-band, as shown in Fig. 2 and 3 (note that
4 1 Crab = 0.22 ct/cm2/sec for the Swift/BAT rate and 1 Crab= 1.67 ct/cm2/sec for the MAXI rate.
Figure 3. Zoom of the light curve and spectral index evolutionpresented in Fig. 2 during the maximum of the giant flare peak,on 19 September 2016.
1 10Frequency (GHz)
1
10
Flu
x de
nsity
(Jy
)
Figure 4. Optically thin spectrum obtained from SRT data at1.5, 7.2 and 22.7 GHz two days after the maximum of the giantflare.
all error bars are at the 1σ level). The 18.6, 22.7 and 25.6GHz observations performed independently (observationaland data reduction techniques) with Medicina and SRT areperfectly consistent, demonstrating a decrease of the fluxwithin less than 5 hours before it increased again the dayafter, on 20 September. On the other hand, the radio emis-sion at 7.2–8.5 GHz severely weakened from 20 September;
MNRAS 000, 1–13 (2017)

6 Egron et al.
Figure 5. Cyg X-3 visibility amplitude and phase vs. time for baselines to SRT for the 1 September 2016 (MJD 57632) observations at22 GHz. Four pairs of panels are shown; from top to bottom: Sr-Mc, Sr-Nt, Sr-Tr, Sr-Ys; in each pair, the top panel shows amplitudes(in Jy) and the bottom phases (in degrees). Data are missing at around UT 21 for these baselines, due to SRT elevation limits (sourcetransiting at zenith), but are in general present on other baselines. Note that the first part of the observation was missed by Yebes dueto technical problems.
a reduction of ∼ 9 Jy is detected within 2.4 days. Observa-tions carried out with the SRT on 21 September at 1.5, 7.2and 22.7 GHz indicated that the ejection is optically thin,as shown in Figure 4.
The evolution of the spectral index α (with Sν ∝ ν−α) isshown in Figure 2. The spectral indexes were calculated byconsidering all couples of flux density measurements avail-able at low and high frequencies (7.2–8.5 GHz and 18.6–25.6GHz) within 1 hr from each other. Spectral index errors werederived from error propagation of flux density errors for eachcouple. The time tag of the reported spectral index valuescorresponds to the mid time between the epochs of eachflux density measurement couple. The error bars on the x-axis (time) reflects the epoch separation for each couple offlux density measurements. We clearly observed a spectralsteepening from α = 0.34 ± 0.08 to 0.61 ± 0.03 within ∼ 5 hrsat the moment of the peak maximum of the flare. In Fig-ure 3, we show a zoom of the light curve and spectral indexevolution for the observation of 19 September 2016 (MJD57650).
3.2 VLBI results
Compact (milliarcsecond scale) radio emission was detectedfrom Cyg X-3 during the first VLBI observation, on 1September 2016. This detection was confirmed both forthe phase-referenced visibilities, whose amplitude and phaseshowed well-defined coherence, and from a run of fringe fit-ting directly to the source itself, which produced good solu-tions for all the intervals with valid data.
In Fig. 5, we show visibility amplitude and phase ver-sus time for all the baselines to SRT. Other baselines showsimilar behaviour but with increased scatter due to lowerbaseline sensitivity. We note a variable total flux density: theamplitudes are in general higher in the first half of the ses-sion than in the second. Moreover, there is clear variabilityon hour-scale in the initial four hours of the observation. Weexclude the possibility that this variability is instrumental:we present in Fig. 6 the visibility amplitudes (Mc-Sr, Nt-Sr,Sr-Tr baselines) for Cyg X-3 and J2007+4920 for the firstfour hours of observations. The comparison source showsthe stability of the system, which allows us to infer that
MNRAS 000, 1–13 (2017)

Cyg X-3 during the 2016 giant flare 7
Table 3. VLBI observations of Cyg X-3 performed at 22 GHz with SRT, Medicina, Noto, Torun, Yebes and Onsala. MJD start and endindicate the beginning and the end of each session while the effective time is related to the observation time on Cyg X-3. Upper limitsare given at 5σ when the source was not detected at the known position.
Radio telescopes Obs. date MJD MJD Flux density(start) (end) (mJy)
Sr, Mc, Nt, Tr, Ys 1 Sept 2016 57632.67 57632.79⋆ 44057632.79⋆ 57633.21 250
Sr, Mc, Nt, Tr, Ys 3 Sept 2016 57634.67 57635.21 < 8
Sr, Mc, Nt, Tr 9 Sept 2016 57640.67 57641.19 < 8
Sr, Mc, Nt, Tr 10 Sept 2016 57641.54 57641.83 < 8
Mc, Nt, Tr, On 23 Sept 2016 57654.50 57655.15 < 20
⋆ The observations are split to report the different flux density values but they correspond to the same run.
IF 1 CHAN 1 STK IAmplitude vs Time
600
500
400
300
200
100
0
MC-SR (1-3)
Mill
iJan
skys
350
300
250
200
150
100
50
0
NT-SR (2-3)
Time (hours)16 30 17 00 30 18 00 30 19 00 30 20 00
140
120
100
80
60
40
20
0
SR-TR (3-4)
1.2
0.8
0.4
0.0
1.2
0.8
0.4
0.0
Jan
skys
1.2
0.8
0.4
0.0
Figure 6. Visibility amplitudes of Cyg X-3 (red) andJ2007+4029 (green) during the four first hours of the 1 September2016 observation (MJD 57632). Variability is observed on the Mc-Sr, Nt-Sr, Sr-Tr baselines for Cyg X-3 within two hours whereasthe comparison source remains stable.
the amplitude variation is intrinsic to Cyg X-3. Moreover,the variations follow the same pattern on baselines of verydifferent orientations in the (u, v)-plane (including those notshown: Mc-Nt, Mc-Tr, Nt-Tr). This behaviour indicates thatthe amplitude variability is not due to the source structurebut rather to intrinsic flux density variations.
The short-scale time variability prevents us from ob-taining a meaningful average image for the whole observa-tion, as the imaging algorithms in interferometry producea Fourier transform of the visibility amplitude and phasein the (u, v)-plane to the brightness in the sky combiningall visibilities together. Different portions of the (u, v)-planeare therefore sampled at different times. When the sourcevaries during the duration of the observation, the transformof the (u, v)-plane consequently becomes ill-posed. For thisreason, it is not possible to produce a meaningful image ofthe source from the entire dataset during our VLBI observa-tion. A possibility would be to produce images for short timeintervals, during which we can assume that variability plays
a negligible role. However, in this case we can only use thevisibilities acquired during that time interval, which meansthat we only sample a small portion of the (u, v)-plane. Asa result, the image quality becomes very poor (in particularfor our sparse array of only 4–5 stations). This is the reasonwhy we resorted to model-fitting in the (u, v)-plane ratherthan to images. We model-fit the visibility within each timebin of 15min by using a circular Gaussian model of 1.5 masHPBW (the beam would naturally be elliptical; note thatthe real beam size during this observation was 1.50 mas ×
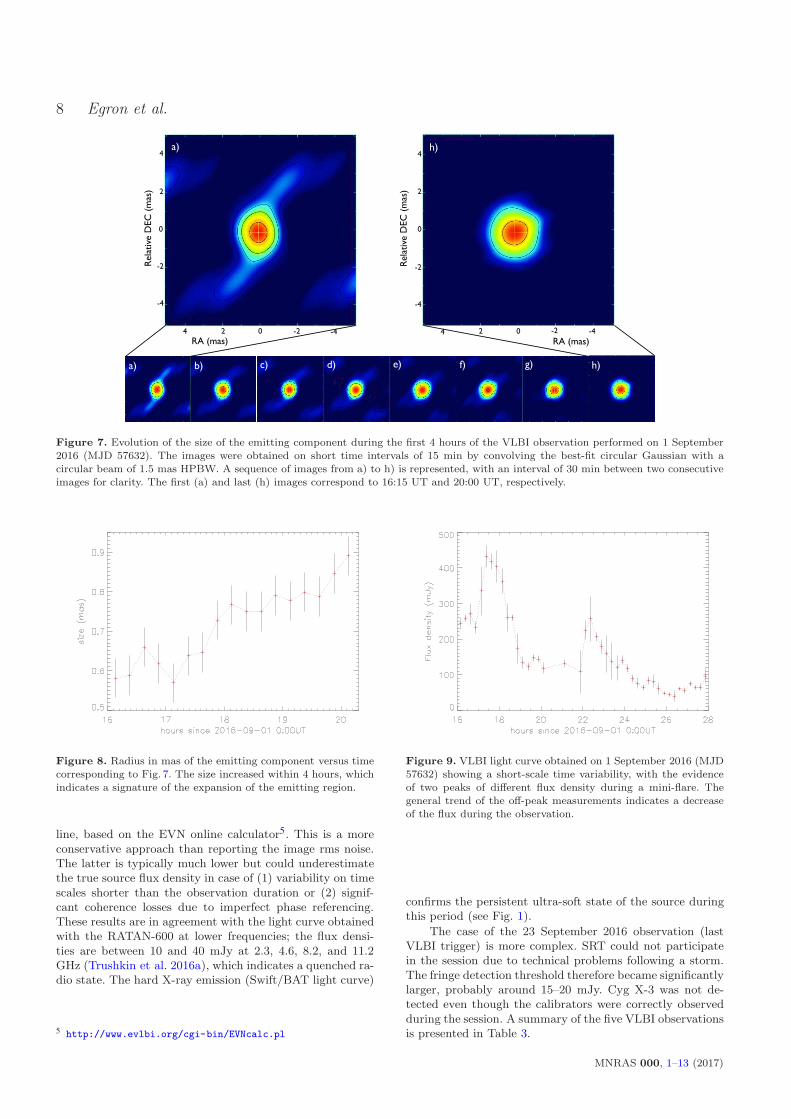
0.97 mas) in which we let position, amplitude, and widthfree to vary. It is therefore possible to study the evolution ofthe size of the emitting component, at least during the first 4hours of the observation when we had a better signal-to-noiseratio to constrain the fit. The size of the emitting region in-creased with time from 0.6 to 0.9mas radius, as shown inFig. 7 and 8. After 20.00UT on 1 September 2016, the sizebecomes smaller. This shrinking is most likely an artefactdue to the low signal-to-noise-ratio. Another intriguing pos-sibility is that the beam position angle is rotating from adirection aligned with the jet axis to a transverse one, so wesee a narrower size.
We have created both clean images and visibility datamodels for each time bin of 15min and determined the tar-get’s flux density using both methods. The resulting overalltrends are entirely consistent. We report in Figure 9 thenumbers provided by visibility model fits. Two small peaksof ∼ 440 mJy and ∼ 250 mJy flux density are clearly vis-ible in the light curve, both with a 2-hour duration. Wecatched a mini-flare of Cyg X-3 instead of the expected giantflare event. The flux density variability on sub-hour scales ishowever clearly present and it is intrinsic to the source, asdemonstrated in Figure 6.
The following VLBI observations triggered on 3, 9, and10 September 2016 did not provide any detection of Cyg X-3(upper limit of 8 mJy at 5σ), as confirmed by the analysis inboth the visibility and the image domains. In the visibilitydomain, after transferring phase solutions from the calibra-tor, we tried to fringe fit the source visibilities, finding nosolution. After directly imaging the phase-referenced data,we did not find any significant peak in the image plane.Upper limits are reported in Table 3. Conservatively, we de-termined upper limits from the lack of fringe detections at5σ significance in 2.5 minutes on the most sensitive base-
MNRAS 000, 1–13 (2017)
8 Egron et al.
Rel
ativ
e D
EC
(m
as)
4
2
0
-2
-4
Rel
ativ
e D
EC
(m
as)
4
2
0
-2
-4
RA (mas)4 2 0 -2 -4 4 2 0 -2 -4
RA (mas)
b)
h)
a)
a)
h)
h)b) c) d) e)e) f) g)
Figure 7. Evolution of the size of the emitting component during the first 4 hours of the VLBI observation performed on 1 September2016 (MJD 57632). The images were obtained on short time intervals of 15 min by convolving the best-fit circular Gaussian with acircular beam of 1.5 mas HPBW. A sequence of images from a) to h) is represented, with an interval of 30 min between two consecutiveimages for clarity. The first (a) and last (h) images correspond to 16:15 UT and 20:00 UT, respectively.
Figure 8. Radius in mas of the emitting component versus timecorresponding to Fig. 7. The size increased within 4 hours, whichindicates a signature of the expansion of the emitting region.
line, based on the EVN online calculator5. This is a moreconservative approach than reporting the image rms noise.The latter is typically much lower but could underestimatethe true source flux density in case of (1) variability on timescales shorter than the observation duration or (2) signif-cant coherence losses due to imperfect phase referencing.These results are in agreement with the light curve obtainedwith the RATAN-600 at lower frequencies; the flux densi-ties are between 10 and 40 mJy at 2.3, 4.6, 8.2, and 11.2GHz (Trushkin et al. 2016a), which indicates a quenched ra-dio state. The hard X-ray emission (Swift/BAT light curve)
5 http://www.evlbi.org/cgi-bin/EVNcalc.pl
Figure 9. VLBI light curve obtained on 1 September 2016 (MJD57632) showing a short-scale time variability, with the evidenceof two peaks of different flux density during a mini-flare. Thegeneral trend of the off-peak measurements indicates a decreaseof the flux during the observation.
confirms the persistent ultra-soft state of the source duringthis period (see Fig. 1).
The case of the 23 September 2016 observation (lastVLBI trigger) is more complex. SRT could not participatein the session due to technical problems following a storm.The fringe detection threshold therefore became significantlylarger, probably around 15–20 mJy. Cyg X-3 was not de-tected even though the calibrators were correctly observedduring the session. A summary of the five VLBI observationsis presented in Table 3.
MNRAS 000, 1–13 (2017)

Cyg X-3 during the 2016 giant flare 9
4 DISCUSSION
4.1 X-ray and radio connections inAugust/September 2016
Ejection processes are closely linked to accretion in X-raybinaries, but the mechanisms at the origin of the launch ofrelativistic jets are not well established (Fender et al. 2004;Markoff et al. 2005).
The hard X-ray light curve (15–50 keV) extracted fromSwift/BAT indicated that the flux of Cyg X-3 dramati-cally dropped starting from 15 August 2016 (MJD 57615)to reach an ultra-soft state (∼ 0.01 Crab flux) a few dayslater (see Fig. 1). The hardness ratio and X-ray light curvesobtained with MAXI (2–4 keV) and Swift/BAT highlightchanges of states in Cyg X-3, from the ultra-soft to the softstate during the giant flare (maximum of the peak on MJD57650), then from the soft to the hard state at the end ofthe event (MJD 57660). This favors changes in the accre-tion rate, likely related to variations in the mass-loss fromthe dense stellar wind associated with the Wolf-Rayet com-panion star (Kitamoto et al. 1994; Watanabe et al. 1994;Gies et al. 2003).
The quenching of the jet in the ultra-soft X-ray statecould be a direct consequence of high accretion rates, withthe inner radius of the disc approaching very close to thecompact object (Hjalmarsdotter et al. 2009). Giant flaresmark the end of this state and the transition to the soft state(Corbel et al. 2012). In this way, they became predictableevents (Koljonen et al. 2010; Trushkin et al. 2016b).
A correlation may be present between the duration ofthe ultra-soft state and the strength of the subsequent radioflare. The two last giant flares in March 2011 and September2016 had an extensive radio and X-ray monitoring that cov-ered the full duration of the events. The March 2011 flarefollowed a very long ultra-soft state of ∼ 36 days, reacheda peak flux density of ∼ 20 Jy at 15 GHz, doubling theSeptember 2016 flare flux density (∼ 10 Jy at 18.6 GHz) thatoccurred after a much shorter ultra-soft state (∼ 23 days).Even for the multiple flares in 2006, the stronger double ra-dio event in May peaking at ∼14 Jy at 15 GHz is preceededby a longer ultra-soft state (∼ 41 days) with respect to theJuly event (∼7 Jy at 11.2 GHz and <20 days ultra-soft state).
4.2 A small flare precursor to the giant flare
While Cyg X-3 was in the ultra-soft state, the hard X-rayflux suddenly increased for the three days following 29 Au-gust 2016 (∼ 0.05 Crab flux), before decreasing again on 1September (see Fig. 1). Fast variations of the flux densitywere detected at 22 GHz during the first VLBI session trig-gered on the same day (MJD 57632.7). Figure 9 shows thepresence of two peaks of ∼ 440 mJy and ∼ 250 mJy with aduration of two hours each, while the off-peaks indicate ageneral diminution of the flux density. Images of the emit-ting component obtained during the first four hours of theobservation highlighted an increase of the emission size from0.6 to 0.9 mas (radius), as shown in Fig. 7 and Fig. 8 at themoment of the first peak at ∼ 440 mJy during the mini-flare.We measured an expansion of 0.3 mas in radius in 4 hours,equivalent to a velocity of 0.07–0.09c, assuming a distanceto the source at 7–9 kpc. This velocity appears to be slower
than the sound speed in mildly relativistic plasma and couldbe associated with the presence of a wind rather than a jet.The source was not detected during the VLBI observationperformed a few days later, on 3, 9, and 10 September (upperlimit of 8 mJy at 22 GHz).
The RATAN-600 light curve confirmed the presence of amini-flare (Trushkin et al. 2016a) that started on 30 Augustand lasted for ∼ 4 days before Cyg X-3 came back to thequenched state (∼ 30 mJy at 11.2 GHz). The peak reacheda maximum of ∼ 600–700 mJy at 8.2–11.2 GHz and ∼ 300
mJy at 4.6 GHz on 1 September (Trushkin et al. 2016a).Our VLBI data obtained on 1 September 2016 correspondto the very beginning of the declining phase of the smallflare, about 10 days before the onset of the rising phase ofthe giant flare. The short-duration flare occurred close to thecore, with an evidence of a very slight extension of the windor jet. Similar small radio flares have often been observedprior to giant flare events of Cyg X-3 (Waltman et al. 1994,1995; Newell et al. 1998; Kim et al. 2013). In particular, aVLBI observation performed in 2007 during a short-live flare(3 hours) with a flux density of 1.6 Jy gives similar results.The analysis of the Gaussian fits to the visibility amplitudeswith time bin of 10min have shown an increase of the sourcesize or a structural change during the mini-flare (Kim et al.2013). In both cases, we note that the emitting size slightlyincreases from the peak of the mini-flare until the end ofthe flare. As a consequence, the maximum of the flux den-sity is reached before the small expansion of the wind or jetoccured.
4.3 Spectral index evolution during the giant flare
Single-dish observations of Cyg X-3 show evidence of fluxdensity variations on a timescale of a few hours. The varia-tions observed in the 7.2–8.5 GHz and 18.6–25.6 GHz lightcurves do not follow the same trend, in particular at the peakmaximum, on 19 September 2016. While the flux density atlower frequencies remains quite stable, fast changes are ob-served at higher frequencies. The evolution of the spectralindex testifies the high variability of the source. The spectralindex flattens (α ∼ 0.3) during the rise of the source flux,while it steepens (α ∼ 0.6) when the source flux declines athigh frenquencies. We note that the values of the spectralindex are very similar to the ones associated with previousgiant flares (Miller-Jones et al. 2004, and references therein)and with low-level flare events (Miller-Jones et al. 2009).However, the spectral steepening over a timescale of hours isfor the first time highlighted. Miller-Jones et al. (2004) stud-ied several hypotheses based on energy-dependent loss mech-anisms to explain the steepening on the scale of a few days.Synchrotron, bremsstrahlung, inverse Compton and leakage(diffusive escape) losses have been ruled out because of thetoo long timescales. The only mechanism capable of produc-ing such a spectral evolution is related to light-travel timeeffects in plasmons (van der Laan 1966). Plasmons wouldevolve from optically thick to optically thin as they moveoutward from the core and expand. A flat-spectrum corecomponent dominates the flux density initially but fadesover time. A steep spectral index would be reached whenthe plasmons become optically thin.
MNRAS 000, 1–13 (2017)
10 Egron et al.
4.4 Comparison between the small and the giantflares
Cyg X-3 was not detected during the last VLBI observationperformed at 22 GHz, four days after the peak of the giantflare. Medicina recorded a flux density of 3.1 ± 0.1 Jy at 8.5GHz the same day, while the RATAN-600 detected a radioemission of ∼ 2 Jy at 21.7 GHz on 22 September 2016 and∼ 0.8 Jy on 24 September 2016 (Trushkin et al. 2016a). Wecan estimate the expected flux density at 22 GHz on 23September, considering that the fading of the flare followsan exponential law ∝ exp[−(t− tm)/2days], where tm = 57650.7
the day of the peak maximum. This results in a flux densityestimated at ∼ 1.4 Jy, much higher than the upper limitwe infered for this observation. The source was thereforestrongly resolved out at mas scales.
In this way, our VLBI observations give us a directcomparison between the decay phases of the small/short-duration flare and the giant/longer flare in September 2016.Multi-frequency observations carried out with SRT on 21September indicated that the spectrum of Cyg X-3 was opti-cally thin two days after the peak of the flare. Trushkin et al.(2016a) confirm this statement and find a clear transitionfrom optically thick to optically thin spectra right after theflare reached its highest brightness. Similar conclusions weredrawn in the case of small flares (Miller-Jones et al. 2009).Optically thick spectra are most likely attributed to syn-chrotron self-absorption or thermal electrons mixed with rel-ativistic ones, whereas optically thin spectra are probablyassociated with ejecta in expansion moving outwards fromthe core (Miller-Jones et al. 2009).
The results we obtained with the single-dish andVLBI observations are consistent with the shock-in-jet sce-nario supported by Lindfors et al. (2007), Miller-Jones et al.(2009) and Turler (2011). These authors suggest that the dif-ferences in shape, amplitude, timescale and frequency rangeof the flares are related to the strength of the shocks alongthe jet. Weaker and faster flares are produced closer to thecore (Turler et al. 1999) whereas brighter flares evolve onlonger time scales, peak at lower frequencies, and are theconsequence of shocks forming further downstream in thejet. Shocks could provide a mechanism for the continuousreplenishment of relativistic particles (Atoyan & Aharonian1999). However, shocks generally give an index of the power-law energy distribution of relativistic particles p > 2 orα > 0.5 with α = (p − 1)/2. While it may be possible toproduce a p < 2 in shocks, magnetic reconnection in rela-tivistic plasmas with a relatively high magnetization couldalso explain the change from p = 1.6 to 2.2 or α = 0.3 to0.6 (Guo et al. 2014; Sironi & Spitkovsky 2014; Sironi et al.2016).
The gamma-ray flares detected just before the mini ra-dio flare with AGILE (Piano et al. 2016) and at the very on-set of the giant radio flare with Fermi/LAT (Cheung & Loh2016) are also in agreement with our results and withthe conclusions drawn from Corbel et al. (2012) during theMarch 2011 giant flare. The gamma-ray activity is mostlikely related to shocks appearing at different distances alongthe jet. Particle acceleration (thanks to shocks or recon-nection) happening closer to the core is consistent with abrighter gamma-ray emission than that observed in shocksproduced further downstream where the energy density in
seed photon decreases, reducing inverse-Compton emission(Dubus et al. 2010).
4.5 Comparison with previous giant flares
In the following, we try to infer some constraints on thegeometry and structure of the jet associated with the fad-ing giant flare on 23 September 2016, based on a compari-son with previous giant flares of Cyg X-3. Since the discov-ery of the first major radio flares by Gregory & Kronberg(1972), Cyg X-3 has gone through a dozen of giant flareepisodes exceeding 10 Jy (Waltman et al. 1995, and ref-erence therein). The last five giant flares occurred inFebruary 1997 (Mioduszewski et al. 2001), September 2001(Miller-Jones et al. 2004), May-July 2006 (Pal et al. 2009;Koljonen et al. 2013), March 2011 (Corbel et al. 2012) andthe last one in September 2016 (Trushkin et al. 2016a).
High-resolution images obtained with the VLBA clearlydemonstrated the complex jet-like structures during the1997 and 2001 flares. A one-sided jet was detected in thesouth direction during the 1997 flare, with a speed ≥ 0.81c
and a precession period ≥ 60 days (Mioduszewski et al.2001). The jet emission extended over 50 mas two days af-ter the peak of the flare (10 Jy at 15 GHz), and over 120mas two days later. The corresponding synthesized beamswere ∼ 3–5 mas while the proper motion of the jet was > 20
mas/day. This implies a movement by at least 2 beams dur-ing the ∼ 12 hrs of the observations, which did not affect theimages. VLBA images obtained at 22 GHz during the peakmaximum of the 2001 flare revealed a strong core emission(Miller-Jones et al. 2004). The corresponding flux densitywas measured at 7.4 Jy with the VLA. A two-sided jet in analmost north-south orientation then appeared the followingday, consisting of several discrete knots. A successive obser-vation was triggered two days after the peak maximum andconfirmed the expansion of the knot sequence with the fad-ing flux density of ∼ 5 Jy. The proper motions of individualknots, whose initial diameters are ∼ 8 mas, were measuredfor the first time and showed evidence of a 5-day jet preces-sion period with a jet speed ∼ 0.63c.
The angular scale associated with our VLBI observationon 23 September 2016 was ∼ 1 mas, depending on the pro-jected baseline in the (u, v)-plane. In particular, we estimatea 5σ sensitivity of 20 mJy beam−1, with a beam of 1.4 mas× 0.8 mas full-width at half maximum (FWHM). This corre-sponds to a beam area of 0.88 mas2. The total flux density ofthe source estimated from the RATAN-600 light curve is 1.4Jy. If we assume a symmetric, two-sided ejection, our nondetection therefore implies that each of the two S = 0.7 Jyfeatures is distributed over a sky area A such that S/A ≤ 5σ;i.e. A ≥ (700 mJy)/(20 mJybeam−1) ∼ 35 beam ∼ 30 mas2. Fora circular component, we thus determine the size of eachregion to be πr2 ≥ 30 mas2, or r ≥ 3 mas. If we further as-sume that the separation from the core is about 10× fasterthan the blob expansion, that implies a distance from theblack hole of ≥ 30 mas, or 3–4 ×1015 cm (67 AU), consid-ering a location at 7–9 kpc. Depending on when we assumethe time of ejection, it is straightforward to determine alower limit to the projected jet knot velocity. For example,assuming a blob formation at the peak radio emission assuggested by the change in the spectral index we observedand the clear transition from optically thick to optically thin
MNRAS 000, 1–13 (2017)

Cyg X-3 during the 2016 giant flare 11
jet (Trushkin et al. 2016a) at that epoch (on 19 September),we would obtain a jet speed > 0.3c. This is consistent withthe plasmon expansion speed derived from previous giantflares. Instead, a later blob formation (≤ 1 day from thisVLBI observation) would imply a superluminal motion.
4.6 The peculiar case of Cyg X-3
A comparison with well-known microquasars shows us thatCyg X-3 represents a unique and somehow very particu-lar source for different reasons. No other X-ray binarieshave shown radio flux densities up to ∼ 20 Jy during giantflare events. Major flares of 1–10 Jy have been observed insome transient black hole X-ray binaries, such as in SS433,V404 Cyg, GRO J1655−40 and A0620−00, all associatedwith hard-to-soft X-ray transitions. Based on spectral, ve-locity and morphological characteristics, two types of radiojets have been identified during outbursts, corresponding todifferent X-ray states (Fender et al. 2009) and so differentaccretion regimes. A steady jet appearing as a bright core(Dhawan et al. 2000), with a flat or inverted spectrum indi-cating optically thick self-absorbed synchrotron emission isassociated with the hard state (Fender et al. 2004). A tran-
sient jet, corresponding to the ejection of optically thin radioplasmons moving away from the core of the system at rela-tivistic speeds (Mirabel & Rodrıguez 1994), is instead asso-ciated with the transition between two types of intermediatestates, which are themselves in between the hard and thesoft state (Fender et al. 2004). Transitions from steady totransient jet occurs during outbursts, corresponding to aninversion of the spectrum from inverted to optically thin, asalso seen in GRS 1915+105 and LS I +61◦303.
In the case of Cyg X-3, giant flares occur at the endof the ultra-soft X-ray state (Watanabe et al. 1994) also de-fined as hyper-soft state by Koljonen et al. (2010), duringthe transition to a harder state. The jet is found to beoptically thick during the rising phase of the giant flare,corresponding to the soft X-ray state, while the jet be-comes optically thin at the peak and declining phase ofthe flare, which corresponds to soft-to-hard state transition(Miller-Jones et al. 2004; Trushkin et al. 2016a). A similartransition from the steady to transient jet is therefore ob-served, however the association with X-ray states is clearlydifferent from other transient X-ray binaries. The presenceof strong stellar wind from the companion star could be atthe origin of these differences.
GRO J1655−40 shows interesting similarities with CygX-3, in particular the presence of the hyper-soft X-raystate that could be associated with very high and unusualrate of accretion close to or above the Eddington limit(Uttley & Klein-Wolt 2015), and strong radio flares up to10 Jy. GRO J1655−40 is a black hole low-mass X-ray bi-nary, that presents the most powerful (possibly magneticallydriven) disk wind among the other microquasars. Hard X-ray flares have been detected during the transition from thesoft to the ultra-soft X-ray state, and also in the ultra-softstate. The first flare observed in 2005 during the transitionfrom the soft to the ultra-soft state is coincident with anoptically thin radio flare which is relatively weak comparedto transitional radio flares observed from GRO J1655−40in earlier outbursts (Kalemci et al. 2016). However, no gi-
ant flare has been observed after the 2005 ultra-soft X-raystate6.
5 CONCLUSIONS
Cyg X-3 represents an exceptional target that offers the pos-sibility to better understand the relationship between accre-tion state and jet launching mechanisms, and to comparethe effect of accretion geometry (companion star, orbital pa-rameters) to other sources with more typical behaviour, inparticular in the extreme cases of giant flares. These verybright and spectacular radio events are rare, clearly associ-ated with the ultra-soft X-ray state and gamma-ray emis-sion. After 5.5 years of quiescence, a giant flare occurredin September 2016. Single-dish observations performed withMedicina and SRT followed the evolution of the peak over6 days in six frequency ranges. The observed frequenciesare complementary with the ones used in the RATAN-600.Moreover, the long exposures provided with the Italian radiotelescopes allowed us to infer variation of the radio emissionon short timescale. In particular, we highlighted a decline ofthe flux density at high radio frequency with a steepeningof the spectrum from ν−0.3 to ν−0.6 within ∼ 5 hours at thepeak of the flare. It is the first time that such a steepening isobserved on the hour scale, which gives support to plasmonevolution from optically thick to optically thin as they moveoutward from the core and expand.
VLBI observations were triggered at 22 GHz at differ-ent phases of the 2016 flare episode. Flux variations weredetected within 2 hours ten days before the onset of the gi-ant radio flare. They are associated with the declining phaseof a mini and short-lived flare produced close to the core. Wemeasured a slight increase of the source size at the momentof the highest peak of the mini-flare. A VLBI observationperformed 4 days after the peak of the giant flare allows usto infer constraints on the size and velocity of the jet. Thejet emission was most likely extended over 30 mas with a jetknot velocity > 0.3c assuming a blob formation at the peakemission as suggested by the change in the spectral indexwe observed.
The complementarity between single-dish and VLBI ob-servations is essential in order to better understand ejectionmechanisms during giant flare episodes. The data recordedwith the recently commissioned SRT confirm its excellentcapabilities operating as single-dish and VLBI antenna. Theselection of a few EVN telescopes as a EVN lite is very use-ful to provide VLBI observations of such rare events. For thenext giant flares, it would be interesting to perform multi-frequency single-dish observations in parallel to VLBI ob-servations from the peak of the flare in order to better trackthe plasmon evolution from optically thick to optically thin,and directly see the link between changes in the spectral in-dex and jet morphology on relative short time scales (a fewhours). Moreover, it would be more fitted to consider EVN-lite observations at lower frequency during the decay phaseof the flare in order to study the morphology, velocity andevolution of the jet.
6 www.aoc.nrao.edu/~mrupen/XRT/GRJ1655-40/grj1655-40.shtml
MNRAS 000, 1–13 (2017)

12 Egron et al.
ACKNOWLEDGEMENTS
The authors would like to thank S. Trushkin for the use-ful discussions about Cyg X-3. M.P. acknowledges finan-cial support from the RAS (CRP-25476). S.C. acknowledgesthe financial support from the UnivEarthS Labex programof Sorbonne Paris Cite (ANR-10-LABX-0023 and ANR-11-IDEX-0005-02). E.K. acknowledges support from TUBITAKGrant 115F488. The Sardinia Radio Telescope is funded bythe Department of University and Research (MIUR), theItalian Space Agency (ASI), and the Autonomous Region ofSardinia (RAS), and is operated as a National Facility bythe National Institute for Astrophysics (INAF). Based onobservations with the Medicina telescope operated by INAF- Istituto di Radioastronomia.
REFERENCES
Atoyan A. M., Aharonian F. A., 1999, MNRAS, 302, 253Belloni T. M., 2010, in Belloni T., ed., Lecture Notes in
Physics, Berlin Springer Verlag Vol. 794, Lecture Notes inPhysics, Berlin Springer Verlag. p. 53 (arXiv:0909.2474),doi:10.1007/978-3-540-76937-8 3
Bolli P., et al., 2015, Journal of Astronomical Instrumentation,4, 1550008
Bonnet-Bidaud J. M., Chardin G., 1988, Phys. Rep., 170, 325Cheung C. C., Loh A., 2016, The Astronomer’s Telegram, 9502Corbel S., et al., 2012, MNRAS, 421, 2947Deller A. T., et al., 2011, PASP, 123, 275
Dhawan V., Mirabel I. F., Rodrıguez L. F., 2000, ApJ, 543, 373Dubus G., Cerutti B., Henri G., 2010, MNRAS, 404, L55Egron E., Pellizzoni A., Iacolina M. N., Loru S., Righini S., Trois
A., SRT Astrophysical Validation Team 2016a, INAF - Osser-vatorio Astronomico di Cagliari. Internal Report N.59,
Egron E., et al., 2016b, The Astronomer’s Telegram, 9508Fender R. P., Hanson M. M., Pooley G. G., 1999, MNRAS,
308, 473
Fender R. P., Belloni T. M., Gallo E., 2004, MNRAS, 355, 1105Fender R. P., Homan J., Belloni T. M., 2009, MNRAS, 396, 1370Fermi LAT Collaboration et al., 2009, Science, 326, 1512Gallo E., Fender R. P., Pooley G. G., 2003, MNRAS, 344, 60Giacconi R., Gorenstein P., Gursky H., Waters J. R., 1967, ApJ,
148, L119
Gies D. R., et al., 2003, ApJ, 583, 424Gregory P. C., Kronberg P. P., 1972, Nature, 239, 440Greisen E.W., 2003, Information Handling in Astronomy - Historical Vistas,
285, 109Guo F., Li H., Daughton W., Liu Y.-H., 2014,
Physical Review Letters, 113, 155005Hjalmarsdotter L., Zdziarski A. A., Larsson S., Beckmann V.,
McCollough M., Hannikainen D. C., Vilhu O., 2008, MNRAS,384, 278
Hjalmarsdotter L., Zdziarski A. A., Szostek A., HannikainenD. C., 2009, MNRAS, 392, 251
Kalemci E., Begelman M. C., Maccarone T. J., Dincer T., RussellT. D., Bailyn C., Tomsick J. A., 2016, MNRAS, 463, 615
Kim J.-S., Kim S.-W., Kurayama T., Honma M., Sasao T., KimS. J., 2013, ApJ, 772, 41
Kitamoto S., Miyamoto S., Waltman E. B., Fiedler R. L., John-ston K. J., Ghigo F. D., 1994, A&A, 281, L85
Koch-Miramond L., Abraham P., Fuchs Y., Bonnet-Bidaud J.-M.,Claret A., 2002, A&A, 396, 877
Koljonen K. I. I., Hannikainen D. C., McCollough M. L., PooleyG. G., Trushkin S. A., 2010, MNRAS, 406, 307
Koljonen K. I. I., McCollough M. L., Hannikainen D. C., DroulansR., 2013, MNRAS, 429, 1173
Krimm H. A., et al., 2013, ApJS, 209, 14
Lindfors E. J., Turler M., Hannikainen D. C., Pooley G., TammiJ., Trushkin S. A., Valtaoja E., 2007, A&A, 473, 923
Ling Z., Zhang S. N., Tang S., 2009, ApJ, 695, 1111
Markoff S., Nowak M. A., Wilms J., 2005, ApJ, 635, 1203
Martı J., Paredes J. M., Peracaula M., 2001, A&A, 375, 476
McClintock J. E., Remillard R. A., 2006, Black hole binaries. pp157–213
McCollough M. L., et al., 1999, ApJ, 517, 951
McCollough M. L., Corrales L., Dunham M. M., 2016, ApJ,830, L36
Miller-Jones J. C. A., Blundell K. M., Rupen M. P., MioduszewskiA. J., Duffy P., Beasley A. J., 2004, ApJ, 600, 368
Miller-Jones J. C. A., Rupen M. P., Turler M., Lindfors E. J.,Blundell K. M., Pooley G. G., 2009, MNRAS, 394, 309
Mioduszewski A. J., Rupen M. P., Hjellming R. M., Pooley G. G.,Waltman E. B., 2001, ApJ, 553, 766
Mirabel I. F., Rodrıguez L. F., 1994, Nature, 371, 46
Mirabel I. F., Rodrıguez L. F., 1999, ARA&A, 37, 409
Newell S. J., Garrett M. A., Spencer R. E., 1998, MNRAS,293, L17
Orlati A., Bartolini M., Buttu M., Fara A., Migoni C., PoppiS., Righini S., 2016, in Society of Photo-Optical Instru-mentation Engineers (SPIE) Conference Series. p. 991310,doi:10.1117/12.2232581
Ott M., Witzel A., Quirrenbach A., Krichbaum T. P., StandkeK. J., Schalinski C. J., Hummel C. A., 1994, A&A, 284, 331
Pal S., Ishwara-Chandra C. H., Rao A. P., 2009, in Saikia D. J.,Green D. A., Gupta Y., Venturi T., eds, Astronomical Societyof the Pacific Conference Series Vol. 407, The Low-FrequencyRadio Universe. p. 277
Parsignault D. R., et al., 1972, Nature Physical Science, 239, 123
Perley R. A., Butler B. J., 2013, ApJS, 204, 19
Piano G., et al., 2016, The Astronomer’s Telegram, 9429
Prandoni I., et al., 2017, ArXiv e-prints, accepted for publicationin A&A,
Predehl P., Burwitz V., Paerels F., Trumper J., 2000, A&A,357, L25
Shrader C. R., Titarchuk L., Shaposhnikov N., 2010, ApJ,718, 488
Sironi L., Spitkovsky A., 2014, ApJ, 783, L21
Sironi L., Giannios D., Petropoulou M., 2016, MNRAS, 462, 48
Szostek A., Zdziarski A. A., 2004, ArXiv Astrophysics e-prints,
Szostek A., Zdziarski A. A., 2008, MNRAS, 386, 593
Szostek A., Zdziarski A. A., McCollough M. L., 2008, MNRAS,388, 1001
Tavani M., et al., 2009, Nature, 462, 620
Trushkin S. A., Nizhelskij N. A., Tsybulev P. G., Zhekanis G. V.,2016a, preprint, (arXiv:1612.00634)
Trushkin S. A., Nizhelskij N. A., Tsybulev P. G., Zhekanis G. V.,2016b, The Astronomer’s Telegram, 9416
Trushkin S. A., Nizhelskij N. A., Tsybulev P. G., Zhekanis G. V.,2016c, The Astronomer’s Telegram, 9501
Tudose V., et al., 2007, MNRAS, 375, L11
Turler M., 2011, Mem. Soc. Astron. Italiana, 82, 104
Turler M., Courvoisier T. J.-L., Paltani S., 1999, A&A, 349, 45
Uttley P., Klein-Wolt M., 2015, MNRAS, 451, 475
Waltman E. B., Fiedler R. L., Johnston K. J., Ghigo F. D., 1994,AJ, 108, 179
Waltman E. B., Ghigo F. D., Johnston K. J., Foster R. S., FiedlerR. L., Spencer J. H., 1995, AJ, 110, 290
Waltman E. B., Foster R. S., Pooley G. G., Fender R. P., GhigoF. D., 1996, AJ, 112, 2690
Watanabe H., Kitamoto S., Miyamoto S., Fielder R. L., WaltmanE. B., Johnston K. J., Ghigo F. D., 1994, ApJ, 433, 350
Zdziarski A. A., Segreto A., Pooley G. G., 2016, MNRAS,456, 775
MNRAS 000, 1–13 (2017)

Cyg X-3 during the 2016 giant flare 13
van Kerkwijk M. H., Geballe T. R., King D. L., van der Klis M.,
van Paradijs J., 1996, A&A, 314, 521van der Laan H., 1966, Nature, 211, 1131
This paper has been typeset from a TEX/LATEX file prepared bythe author.
MNRAS 000, 1–13 (2017)