Embed Size (px)
Citation preview
* Earlier versions of the article were presented at the 1995 annual conference of the Multinational Finance Society in Philadelphia and at the 1994 annual meeting of the Financial Management Association in St. Louis. I thank the session participants, two anonymous reviewers of the Journal and the editor in charge of the manuscript for helpful comments and Villanova University for financial support. Any errors remaining are my responsibility.
(Multinational Finance Journal, 1997, vol. 1, no. 1, pp. 23–46)© by the Multinational Finance Society, a nonprofit corporation. All rights reserved.DOI: 10.17578/1-1-2
1
Single and Multiple Portfolio Cross-Hedgingwith Currency Futures*
Andrea L. DeMaskeyVillanova University, U.S.A.
This article presents empirical evidence on the effectiveness of currencyfutures cross-hedging with the portfolio model. Single and multiple cross-hedges for three minor European and three minor Asian currencies areexamined. The performance of the cross-hedged portfolios is measured interms of maximum possible variance reduction. Realistic simulations of cross-hedging effectiveness are used to determine how well the optimal portfoliostrategy performs relative to not hedging or a naive cross-hedge. Results showthat Asian currency risk cannot be minimized with single or multiple currencyfutures cross-hedges. Indeed, both the naive and portfolio strategies increaseexchange rate risk to the hedger. Because of the diversification benefit, themultiple currency cross-hedge is superior in hedging performance to the singlecurrency cross-hedge. However, a cross-hedge constructed with two differentcurrency futures positions is as effective as one with five different futurescontracts. While the cross-hedge ratios of the European currencies are unstableover time, cross-hedging effectiveness appears not to have been affectedsignificantly.
I. Introduction
To remain cost-competitive at home and abroad, many companies have beenforced to increase their global sourcing and shift production overseas. Themost promising markets today are in third-world countries that offer a largehuman resource base and, most importantly, labor at relatively low costs. Ascompanies exploit the advantages offered by these countries, the nature and
Multinational Finance Journal24
1. The information was gathered from various supplemental issues of Euromoney (1995,1996).
2. A single cross-hedge involves covering a single currency spot position with a singlefutures position in a different currency. In a multiple cross-hedge, the single currency spot positionis hedged with multiple futures positions in different currencies.
volume of their third-world trade and capital flows increase. At the same time,traders and investors engaged in international transactions with less developedcountries find themselves exposed to exchange rate risk that cannot easily behedged in the international financial markets. While forward contracts up to sixmonths may be available in these minor currencies, forward markets tend to bethin and less liquid at increasing contract maturity. Exchange-tradedderivatives, such as currency futures and options, interbank options, and swaparrangements, are either limited or nonexistent.1 In addition, exchange controlsand other regulations can severely restrict the activities of the foreign exchangemarket. To cope with these challenges, market participants are forced to takea more dynamic attitude to managing foreign exchange rate risk.
Cross-hedging is a risk management tool that is used to minimize exchangerate risk when the expected cash flows are denominated in a minor currency.For example, a company with a contractual obligation to take a long positionin the Spanish peseta or South Korean won may want to protect its cashposition with a currency hedge. Since derivative instruments on thesecurrencies are not available, the currency spot position can be covered with afutures contract in a different currency, e.g., the German mark or the Japaneseyen. The effectiveness of structuring this cross-hedge depends on fourinterrelated issues: (1) the degree to which the spot and futures currencies arepositively correlated; (2) the accuracy of estimated risk-minimizing cross-hedgeparameters; (3) the stability of the optimal cross-hedge ratios over time; and (4)the potential risk reduction from portfolio cross-hedging.
The objective of the article is to present empirical evidence on cross-hedging with the portfolio model in the currency futures market. Single andmultiple cross-hedges for spot currencies without futures contracts areexamined.2 Hedging effectiveness is measured as the percentage reduction inthe variance of a hedged portfolio relative to that of an unhedged spot position.Based on simulations of hedging performance, the results of the portfoliostrategy are compared with those of a naive hedge strategy and an unhedgedposition. Ex ante cross-hedging effectiveness is emphasized using a relativelylarge sample size.
Numerous studies of currency futures hedging and cross-hedging havegenerally adopted the mean-variance methodology developed by Markowitz(1952) and applied to futures by Ederington (1979), Johnson (1960) and Stein(1961). The single futures hedge approach was extended to a multivariate
25Portfolio Cross-Hedging with Currency Futures
framework by Anderson and Danthine (1981), who also examined cross-hedging strategies. Results of earlier studies focused on ex post measures ofoptimal hedge ratios and hedging effectiveness (e.g., Dale 1981; Grammatikosand Saunders 1983; and Hill and Schneeweis 1981, 1982). Although most ofthese studies suggested currency futures hedging strategies to be effective, theirapproach offered little guidance to the actual hedger who needs to know theminimum risk hedge ratio a priori. Of course, it is not possible to implementoptimal hedge ratio estimates ex ante. Thus, it was reasonable to expect thatreal world hedging effectiveness would be lower.
The need to conduct tests under more realistic hedging conditions promptedseveral researchers to examine least-risk hedge ratios and hedging performancefor currency futures hedging and cross-hedging on an ex ante basis (e.g.,Marmer 1986; Eaker and Grant 1987, 1989; Park, Lee and Lee 1987; Lypny1988; Braga, Martin and Meilke 1989; Braga and Martin 1990; Malliaris andUrrutia 1991; Benet 1990a, 1990b, 1992). The results reported by Eaker andGrant (1987, 1989) and Benet (1990a, 1990b, 1992) showed a significantdifference between ex post and ex ante hedging effectiveness measures. Sucha discrepancy in performance was greatest in the presence of intertemporalhedge ratio instability. In fact, many researchers found the hedge ratiovariability problem to be significant, particularly when cross-hedging foreignexchange rate risk (e.g., Grammatikos and Saunders 1983; Marmer 1986; Eakerand Grant 1987, 1989; Kwok 1987; Park, Lee and Lee 1987; Braga, Martin andMeilke 1989; Benet 1990b; Malliaris and Urrutia 1991). In this case, theeconomic relation between the currency and the cross-hedging instrument maybe weak and less stable, thereby causing the estimated least-risk hedge ratio tobe unreliable on an ex ante basis.
Even if the optimal hedge ratio is stable over time, the portfolio modelhedge strategy must be evaluated for its ability to minimize foreign currencyexposure. Superior hedge performance is attainable only as long as theportfolio model yields least-risk hedge parameters for a given hedge period.Based on realistic simulations of hedging performance, Marmer (1986), Kwok(1987), Eaker and Grant (1989), and Braga and Martin (1990) compared theportfolio hedge with a naive hedge rule and no hedge. Their findings offeroverwhelming support for the usefulness of the portfolio model strategy forout-of-sample currency futures and currency cross-hedges.
This article extends the evidence on the effectiveness of currency cross-hedging in several ways. First, it examines minor European and Asiancurrencies that are identified as having a strong positive correlation withcurrency futures contracts. Second, it examines single and multiple currencyfutures cross-hedges within a mean-variance framework. And third, asimulation is run to compare the ex ante hedging effectiveness of the portfoliomodel strategy with a naive hedge strategy and an unhedged position.
Multinational Finance Journal26
The article is organized as follows. Section II describes the data andstatistical method used in this study. The empirical results are presented insection III. Section IV provides a summary of the study and a conclusion forpolicy makers.
II. Data and Method
The data include monthly spot prices for the Italian lira, Spanish peseta,Greek drachma, Singapore dollar, South Korean won, and Hong Kong dollarand are obtained from the International Financial Statistics and the Trade DataBank. British pound, Canadian dollar, German mark, Japanese yen, and Swissfranc futures prices are provided by the Futures Industry Institute Data Center.Prices are all closing or settlement prices in U.S. dollar per foreign currencycollected monthly for the last day of the month. The data cover the periodJanuary 31, 1983, through December 31, 1992. Currency futures are availablewith four maturity months: March, June, September, and December. Thus, foreach contract, as suggested by Eaker and Grant (1987, 1989), the holdingperiods run for the three months prior to the maturity date with 12 monthly(non-overlapping) holding periods during each of the ten years (120observations each for the currency futures).
A hedger is defined as one who minimizes the variance of expected dollarreturns on a currency spot position with respect to a position in the currency’scorresponding future contract (e.g., Ederington 1979; Johnson 1960; Stein1961). If a particular foreign currency cannot be hedged directly, mainlybecause of the nonexistence of forward and/or futures markets in that currency,exchange rate risk may still be reduced with a cross-hedge. Within the mean-variance framework, the general cross hedging model is based on the hedger’sobjective function (see Benet 1990a, 1990b)
min
i j
var(dHt) ' var(dSt) %ji
2i var(dFi,t) % 2j
ii cov(dSt,dFi,t)
(1)% 2jij
ji j cov(dFi,t,dFj,t)
subject to (2)E(dHt) ' E(dSt) %j
ii E(dFi,t)
wheredSt = the difference in spot price during period t,
27Portfolio Cross-Hedging with Currency Futures
3. Disagreement arises on the best procedure to estimate the least-risk hedge ratio; namely,whether to use cash and futures price levels, price changes, or percentage changes in the analyticalapproach. Witt, Schroeder, and Hayenga (1987) have compared all three estimation techniques andconcluded that the proper statistical method (at least theoretically) depends on the hedger’sobjective function and the type of hedge being considered. In the present study, the objectivefunction of the hedger is to minimize the variance of returns. The hedge is a storage hedge. Thus,the current spot price is relevant to the hedging decision. In this case, “the price change modelseems appropriate,” as suggested by Witt, Schroeder, and Hayenga (1987, p. 145).
4. While the Ederington methodology is simple and easy to use, the optimal hedge parameterestimates from the OLS technique will yield unbiased results only when the data satisfies theassumptions of homoskedasticity and no serial correlation. Preliminary regressions performed onthe data reveal the presence of heteroskedasticity and autocorrelation. The first problem iseliminated by taking the natural logarithm of the data. The problem of autocorrelation amongresiduals is corrected with an autocorrelation-corrected model. The Cochran-Orcutt technique wasused ex post and ex ante.
dFi,t = the difference in the prices of the ith futures contracts duringperiod t,
dHt = the target expected change in value of a portfolio invested in afixed level of spot currency and n futures contracts, each inproportion i during period t,
i = the proportion of integer number of future contracts. Thus, i
would equal the hedge ratio with i < 0 representing a shortposition and i > 0 representing a long position in futures.
Ederington (1979), Anderson and Danthine (1981), and others have shownthat this approach reduces to an ordinary least squares (OLS) regression of asingle spot position on single or multiple futures positions. The empiricalcross-hedging regression equation is of the general form:
dSt = + 1 dF1,t + 2 dF2,t + ... + n dFn,t + gt (3)
The optimal or least-risk hedge ratio, b*, is simply obtained from the parameterestimates, i, of the above multivariate regression equation.3 The degree ofhedging effectiveness, e, for the minimum-risk hedge is measured by theregression coefficient of determination, R2.
The model in its empirically-testable form (equation 3) is used to examinethe performance of single and multiple cross-hedging strategies. The specificmodel form adopted for this study is logarithmic; that is, the natural log of thecash and futures prices is taken first before computing the price differences.4
Since the variance and covariance terms are now expressed in returns formrather than prices, the cross-hedge ratio estimates are interpretable as elasticitymeasures (Benet 1990a). A “naive” out-of-sample hedging approach is
Multinational Finance Journal28
5. The subperiods were chosen on the basis of adequate sample size for statistical purposesusing monthly data (Benet 1990a, 1990b, 1992).
6. Actual participants in futures markets probably use more sophisticated hedging strategiesin establishing hedge ratios. The “naive” approach, however, offers a convenient performancebenchmark for comparison purposes, (Benet 1992).
7. The construction of dummy variable tests following Gujarati (1978) allows for testingdirectly if and when significant structural shifts occurred in hedge ratios (Grammatikos andSaunders, 1983; Park, Lee and Lee, 1987; Benet, 1990b).
employed where the total sample data is divided into three subsamples.5 Leastrisk hedge ratios are estimated for each subsample separately, and then priorsubperiod optimal hedge ratios are used to construct a hedge for the subsequent(holding) period (e.g., the hedge ratio estimated in subperiod 1 is implementedinto subperiod 2, subperiod’s 2 into 3).6
The hedging results obtained from ex post data are useful only to a hedgeron an ex ante basis if the estimated optimal cross-hedge ratios are stable overtime. In fact, intertemporal hedge ratio variability causes a general failure ofthe “naive” hedging approach because of structural shifts between changes inthe spot and futures prices. Hedge ratio stability is particularly important forcross-hedging since the underlying structural factors of a currency used in thecross-hedge may not be well-developed. Gujarati (1978) suggested a formalstability test of the following form:7
(4)dSt ' % i ji
dFi,t % 1 ji
D1 dFi,t % 2 ji
D2 dFi,t % gt
where
dSt = the difference in spot price during period t,dFi,t = the difference in the prices of the ith futures contracts during
period t, D1 = 1 for the period June 1986 to September 1989, and 0 otherwise, D2 = 1 for the period October 1989 to December 1992, and 0
otherwise.
In regression equation 4, 1 represents the optimal hedge ratio for the periodJanuary 1983 to May 1986. The coefficients 1 and 2 represent changes (orstructural shifts) in the hedge ratio over the corresponding period. Thus, theestimated hedge ratio is expected to be stable over time if 1 = 2 = 0.
The pre-specification of the subperiods in the above test is based on equalsample size. However, particular economic events that impact the foreignexchange markets or shifts in the exchange rate regimes during one of thesubperiods could bias the estimated hedge ratio instability. Thus, the hedge
29Portfolio Cross-Hedging with Currency Futures
ratio stability test is repeated with the full sample period divided into threesubperiods reflecting changes in the international exchange rate regimes; thatis, the first period ends just before the Plaza Agreement in September 1985, thesecond period before the Louvre Accord in February 1987, and the third periodwith the end of the study period.
Finally, simulation analysis is used to compare the effectiveness of portfoliomodel hedging with naive hedging rules. The simulation is run as follows.Assume a hedger who is long in futures and who has a predeterminedestimation (or base) period (January 1983 to September 1989) and a hedgeperiod (October 1989 to December 1992). These period divisions coincidewith the subperiods used in the Gujarati hedge ratio stability test to make directinferences between optimal hedge ratio stability and hedging effectiveness.Furthermore, the hedger is assumed to be continuously cross-hedged over anon-overlapping hedge length of four weeks; that is, as one hedge is lifted,another hedge with comparable characteristics is placed.
For the portfolio strategy, optimal hedge parameters over the estimationperiod are derived using equation 3. These hedge ratios are then applied overthe hedge period and given hedge length. For the naive strategy, the cross-hedge ratios are set equal to one. Expected portfolio returns are computedunder each hedging strategy. Based on this approach, hedging effectiveness ismeasured as the percentage reduction in the variance of returns on a hedgedportfolio (optimal or naive) relative to an unhedged position. If the portfoliomodel cross-hedge results in risk reduction performance superior to the naivecross-hedge, the variance of the cross-hedged portfolio’s returns should beminimized.
III. Empirical Results
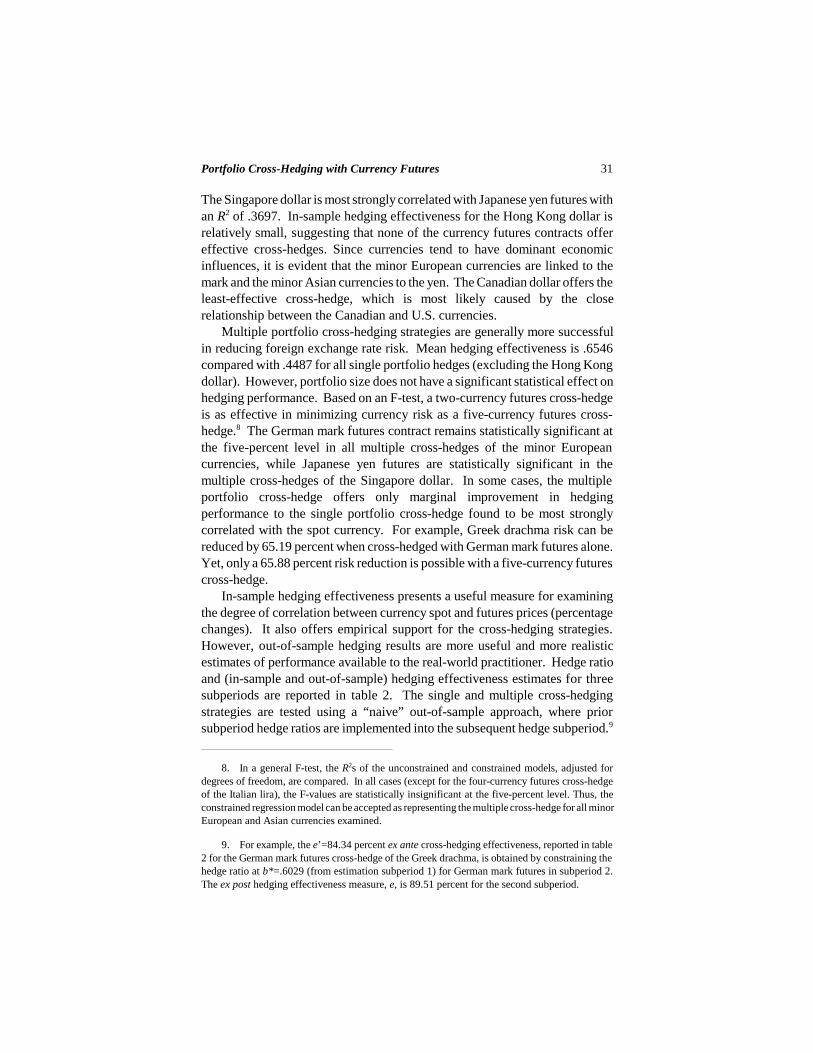
Table 1 reports ex post estimates of risk minimizing OLS regression cross-hedge ratios, b* (regression coefficient), and hedging effectiveness, e(regression coefficient of determination) for six minor currencies. The fivecurrency futures contracts most actively traded on the IMM are used to createsingle and multiple portfolio cross hedges. Although hedging performancevaries across countries, in-sample hedging effectiveness results support thecross-hedging strategies of all minor currencies except the Hong Kong dollar.For single portfolio hedges (excluding the Hong Kong dollar), the R2s rangefrom .0147 for a Canadian dollar futures cross-hedge of the Singapore dollarto .7996 for the German mark futures cross-hedge of the Italian lira. Themajority of cross-hedges are significantly different from the naive hedge ratioof one at the five-percent level.
Multinational Finance Journal30
TABLE 1. Optimal Hedge Ratios and in-Sample Hedging Effectiveness for Singleand Multiple Currency Futures Cross-Hedges
Greek Italian Spanish Hong Kong S. Korean SingaporeFutures drachma lira peseta dollar Won dollar
Single cross–hedge BP b* .5848* .6779* .7098* .0035 .0422* .1802*
e .4387 .5901 .6615 .0002 .5417 .3031CD b* .5031* .8363* .6965* –.0279 .0737 .1267
e .0318 .0880 .0624 .0012 .4994 .0147DM b* .7547* .8353* .8083* –.0050 .0444* .2045*
e .6519 .7996 .7654 .0004 .5468 .3481JY b* .6270* .6548* .6615* –.0127 .0388* .2379*
e .3529 .3854 .4020 .0018 .5184 .3697SF b* .6824* .7333* .7203* –.0023 .0431* .1992*
e .5876 .6795 .6702 .0001 .5455 .3643Mean effectiveness .4126 .5085 .5123 .0007 .5304 .2800
Multiple cross–hedgeBP b* .1036 .1867* .3076* .0155 .0347 .0950*DM/JY** .6715* .6854* .5613* –.0238 .0141 .1698*
e .6577 .8186 .8181 .0043 .5450 .4236BP b* .1009 .2045* .3202* .0189 .0206 .0648DM .6459* .8551* .6817* –.0071 .0280 .0627SF/JY** .0282 –.1866 –.1324 –.0205 .0006 .1403*
e .6578 .8236 .8207 .0045 .5532 .4338BP b* .1006 .2066* .3206* .0167 .0204 .0625DM .6459* .8550* .6817* –.0303 .0138 .0370JY .0063 –.0467 –.0086 –.0266 –.0038 .1336*SF .0243 –.1578 –.1271 .0293 .0179 .0324
e .6578 .8244** .8207 .0059 .5543 .4348BP b* .0887 .1636 .3023* .0219 .0162 .0594CD .0935 .3388 .1439 –.0412 .0522 .0240DM .6415* .7390* .6749* –.0284 .0041 .0359JY .0117 –.0273 –.0003 –.0290 –.0007 .1349*SF .0298 –.1379 –.1187 .0269 .0262 .0338
e .6588 .8374 .8231 .0083 .5646 .4103Mean effectiveness .6580 .8260 .8207 .0058 .5543 .4256
Note: Sampling period is January 1983 to December 1992. The Japanese yen futurescontact is used in constructing the multiple cross–hedges for the Asian currencies. e denotesin-sample hedging effectiveness; b* is the optimal hedge ratio; *Statistically significant from zeroat the 5% level. **Statistically significant at the 5% level for an F-test.
Strong evidence appears to exist that the three minor European currencies(Italian lira, Spanish peseta, Greek drachma) and the South Korean won aremost effectively cross-hedged with German mark futures. The degree ofcorrelation ranges from .5468 for the Korean won to .7996 for the Italian lira.
31Portfolio Cross-Hedging with Currency Futures
8. In a general F-test, the R2s of the unconstrained and constrained models, adjusted fordegrees of freedom, are compared. In all cases (except for the four-currency futures cross-hedgeof the Italian lira), the F-values are statistically insignificant at the five-percent level. Thus, theconstrained regression model can be accepted as representing the multiple cross-hedge for all minorEuropean and Asian currencies examined.
9. For example, the e’=84.34 percent ex ante cross-hedging effectiveness, reported in table2 for the German mark futures cross-hedge of the Greek drachma, is obtained by constraining thehedge ratio at b*=.6029 (from estimation subperiod 1) for German mark futures in subperiod 2.The ex post hedging effectiveness measure, e, is 89.51 percent for the second subperiod.
The Singapore dollar is most strongly correlated with Japanese yen futures withan R2 of .3697. In-sample hedging effectiveness for the Hong Kong dollar isrelatively small, suggesting that none of the currency futures contracts offereffective cross-hedges. Since currencies tend to have dominant economicinfluences, it is evident that the minor European currencies are linked to themark and the minor Asian currencies to the yen. The Canadian dollar offers theleast-effective cross-hedge, which is most likely caused by the closerelationship between the Canadian and U.S. currencies.
Multiple portfolio cross-hedging strategies are generally more successfulin reducing foreign exchange rate risk. Mean hedging effectiveness is .6546compared with .4487 for all single portfolio hedges (excluding the Hong Kongdollar). However, portfolio size does not have a significant statistical effect onhedging performance. Based on an F-test, a two-currency futures cross-hedgeis as effective in minimizing currency risk as a five-currency futures cross-hedge.8 The German mark futures contract remains statistically significant atthe five-percent level in all multiple cross-hedges of the minor Europeancurrencies, while Japanese yen futures are statistically significant in themultiple cross-hedges of the Singapore dollar. In some cases, the multipleportfolio cross-hedge offers only marginal improvement in hedgingperformance to the single portfolio cross-hedge found to be most stronglycorrelated with the spot currency. For example, Greek drachma risk can bereduced by 65.19 percent when cross-hedged with German mark futures alone.Yet, only a 65.88 percent risk reduction is possible with a five-currency futurescross-hedge.
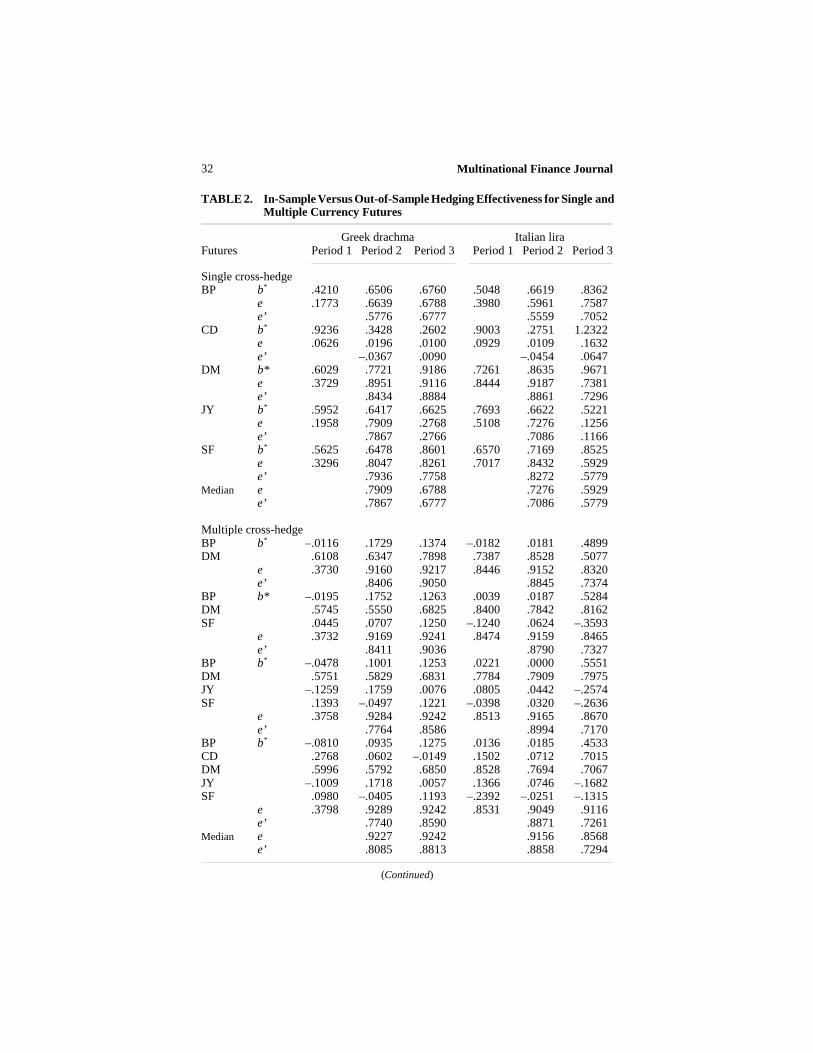
In-sample hedging effectiveness presents a useful measure for examiningthe degree of correlation between currency spot and futures prices (percentagechanges). It also offers empirical support for the cross-hedging strategies.However, out-of-sample hedging results are more useful and more realisticestimates of performance available to the real-world practitioner. Hedge ratioand (in-sample and out-of-sample) hedging effectiveness estimates for threesubperiods are reported in table 2. The single and multiple cross-hedgingstrategies are tested using a “naive” out-of-sample approach, where priorsubperiod hedge ratios are implemented into the subsequent hedge subperiod.9
Multinational Finance Journal32
TABLE 2. In-Sample Versus Out-of-Sample Hedging Effectiveness for Single andMultiple Currency Futures
Greek drachma Italian liraFutures Period 1 Period 2 Period 3 Period 1 Period 2 Period 3
Single cross-hedgeBP b* .4210 .6506 .6760 .5048 .6619 .8362
e .1773 .6639 .6788 .3980 .5961 .7587e’ .5776 .6777 .5559 .7052
CD b* .9236 .3428 .2602 .9003 .2751 1.2322e .0626 .0196 .0100 .0929 .0109 .1632e’ –.0367 .0090 –.0454 .0647
DM b* .6029 .7721 .9186 .7261 .8635 .9671 e .3729 .8951 .9116 .8444 .9187 .7381
e’ .8434 .8884 .8861 .7296JY b* .5952 .6417 .6625 .7693 .6622 .5221
e .1958 .7909 .2768 .5108 .7276 .1256e’ .7867 .2766 .7086 .1166
SF b* .5625 .6478 .8601 .6570 .7169 .8525e .3296 .8047 .8261 .7017 .8432 .5929e’ .7936 .7758 .8272 .5779
Median e .7909 .6788 .7276 .5929e’ .7867 .6777 .7086 .5779
Multiple cross-hedgeBP b* –.0116 .1729 .1374 –.0182 .0181 .4899DM .6108 .6347 .7898 .7387 .8528 .5077
e .3730 .9160 .9217 .8446 .9152 .8320e’ .8406 .9050 .8845 .7374
BP b* –.0195 .1752 .1263 .0039 .0187 .5284DM .5745 .5550 .6825 .8400 .7842 .8162SF .0445 .0707 .1250 –.1240 .0624 –.3593
e .3732 .9169 .9241 .8474 .9159 .8465 e’ .8411 .9036 .8790 .7327
BP b* –.0478 .1001 .1253 .0221 .0000 .5551DM .5751 .5829 .6831 .7784 .7909 .7975JY –.1259 .1759 .0076 .0805 .0442 –.2574SF .1393 –.0497 .1221 –.0398 .0320 –.2636
e .3758 .9284 .9242 .8513 .9165 .8670e’ .7764 .8586 .8994 .7170
BP b* –.0810 .0935 .1275 .0136 .0185 .4533CD .2768 .0602 –.0149 .1502 .0712 .7015DM .5996 .5792 .6850 .8528 .7694 .7067JY –.1009 .1718 .0057 .1366 .0746 –.1682SF .0980 –.0405 .1193 –.2392 –.0251 –.1315
e .3798 .9289 .9242 .8531 .9049 .9116e’ .7740 .8590 .8871 .7261
Median e .9227 .9242 .9156 .8568e’ .8085 .8813 .8858 .7294
(Continued)
33Portfolio Cross-Hedging with Currency Futures
TABLE 2. (Continued)
Spanish peseta Hong-Kong dollarFutures Period 1 Period 2 Period 3 Period 1 Period 2 Period 3
Single cross-hedgeBP b* .5746 .7288 .8138 .0159 .0006 –.0065
e .4964 .6894 .8017 .0014 .0003 .0345e’ .6542 .7926 –.2204 –.0076
CD b* .8536 .3655 .8064 –.2230 –.0009 .0097e .0804 .0185 .0780 .0206 .0001 .0078e’ –.0145 .0547 –4.9187 –.0015
DM b* .6988 .7848 .9615 –.0162 .0073 –.0104e .7530 .7549 .8138 .0015 .0474 .0656e’ .7432 .7863 –.4478 –.1237
JY b* .6845 .6639 .6543 –.0428 .0029 .0021e .3893 .7031 .2200 .0057 .0098 .0016e’ .7024 .2200 –2.3888 .0014
SF b* .6627 .6539 .8810 –.0119 .0053 –.0059e .6873 .6478 .7063 .0008 .0326 .0217e’ .6561 .6593 –.3087 –.0564
Median e .6894 .7063 .0098 .0217e’ .6561 .6593 –.4478 –.0076
Multiple cross-hedgeBP b* .1560 .3358 .4386 .0395 –.0061 –.0096DM .5910 .5141 .5503 –.0677 .0074 .0096
e .7717 .8147 .8978 .0126 .0214 .0585e’ .7855 .8777 –2.6072 .0503
BP b* .1535 .3125 .4475 .0488 –.0111 –.0002DM .5793 .8164 .6361 –.0208 .0220 –.0153SF .0143 –.2646 –.0999 –.0520 –.0058 .0127
e .7717 .8219 .8990 .0133 .1178 .1068e’ .7842 .8768 –2.4421 –.2607
BP b* .1320 .2278 .4577 .0412 –.0121 –.0017DM .5797 .8141 .6303 –.0413 .0309 –.0334JY –.0953 .2205 –.0795 –.0657 –.0035 .0099SF .0861 –.3994 –.0704 .0354 –.0095 .0218
e .7739 .8350 .9011 .0139 .1248 .1458e’ .7505 .8014 –2.4843 –.3025
BP b* .1589 .2264 .4033 .0875 –.0122 –.0055CD –.2240 .0275 .3753 –.3866 .0006 .0259DM .5599 .8106 .5817 –.0756 .0308 –.0367JY –.1155 .2182 –.0318 –.1006 –.0036 .0132SF .1196 –.3937 .0003 .0932 –.0094 .0267
e .7778 .8351 .9154 .0577 .1248 .1920e’ .7323 .8048 –18.6229 –.2994
Median e .8285 .9001 .1213 .1263e’ .7674 .8408 –2.5458 –.2801
(Continued)
Multinational Finance Journal34
TABLE 2. (Continued)
South Korean won Singapore dollarFutures Period 1 Period 2 Period 3 Period 1 Period 2 Period 3
Single cross-hedgeBP b* .0697 .0520 –.0203 .1490 .1647 .2124
e .3032 .3614 .3221 .1544 .4897 .4688e’ .0483 –.5243 .4624 .4451
CD b* .1690 .1066 .0329 .1612 .1756 .0225e .1534 .0342 .3036 .0133 .0511 .0005e’ .0214 –.1070 .0508 –.0236
DM b* .0707 .0430 –.0246 .1842 .1652 .2625e .3758 .3261 .3274 .2420 .4083 .5209e’ –.1072 –.2544 .4028 .4492
JY b* .0869 .0298 –.0121 .3348 .1501 .3477e .2740 .3066 .2971 .4307 .4304 .5334e’ –.1287 .0089 –.2974 .3611
SF b* .0642 .0362 –.0194 .2025 .1512 .2498e .3118 .3169 .3115 .2968 .4379 .4874e’ –.1308 –.1933 .3875 .4114
Median e .3169 .3115 .4304 .4874e’ –.1072 –.1933 .3875 .4114
Multiple cross-hedgeBP b* .0526 .0693 –.0247 .0414 .1146 .1313JY .0542 –.0192 .0100 .3087 .0655 .2456
e .3890 .3672 .3237 .4400 .4994 .6665e’ –.0581 –.7633 –.2883 .4999
BP b* .0346 .0625 –.0118 .0684 .1062 .0568DM .0340 .0278 –.0186 –.0608 .0368 .1213JY .0275 –.0350 .0113 .3545 .0434 .2207
e .4132 .3727 .3309 .4471 .5039 .7046e’ –.0531 –.9477 –.4585 .5156
BP b* .0473 .0630 –.0110 .0727 .1219 .0592DM .0917 .0220 –.0345 –.0492 –.0982 .1509JY .0615 –.0364 .0060 .3623 .0083 .2253SF –.0872 .0067 .0201 –.0200 .1445 –.0358
e .4487 .3729 .3346 .4474 .5306 .7059e’ –.0643 –.9618 –.4896 .4620
BP b* .0387 .0635 –.0625 .0821 .1151 .0578CD .0718 .0216 .0550 –.0787 .1308 .0098DM .0906 .0175 –.0027 –.0562 –.1148 .1496JY .0713 –.0382 .0709 .3552 –.0025 .2265SF –.0942 .0119 .0034 –.0082 .1716 –.0339
e .4664 .3750 .2252 .4496 .5570 .7060e’ –.0681 –.9964 –.5263 –2.1686
Median e .3728 .3273 .5173 .7053e’ –.0612 –.9548 –.4741 .4810
Note: e denotes ex post hedging effectiveness, e’ denotes ex ante hedging effectiveness,and b* denotes optimal hedge ratio. Sampling period is January 1983 to December 1992.
35Portfolio Cross-Hedging with Currency Futures
10. These results are consistent with those reported by Eaker and Grant (1987) and Benet(1990a, 1990b, 1992), who examined both commodity and currency cross-hedges.
11. Results are available from the author upon request.
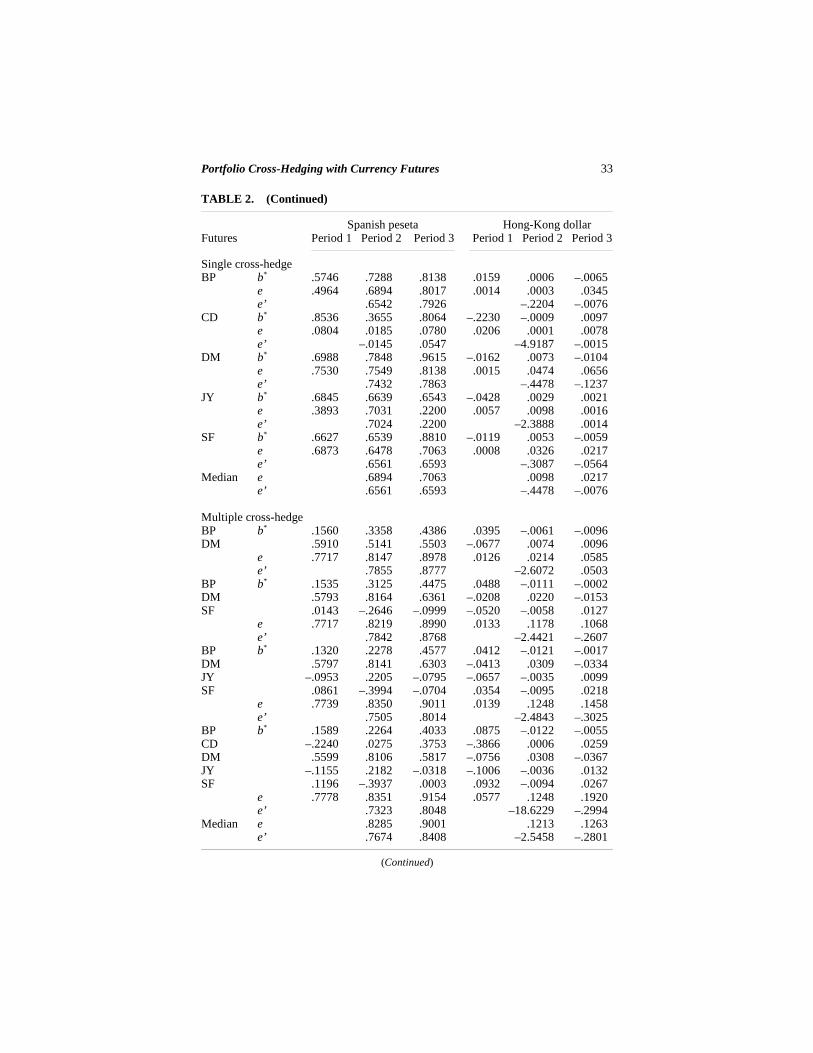
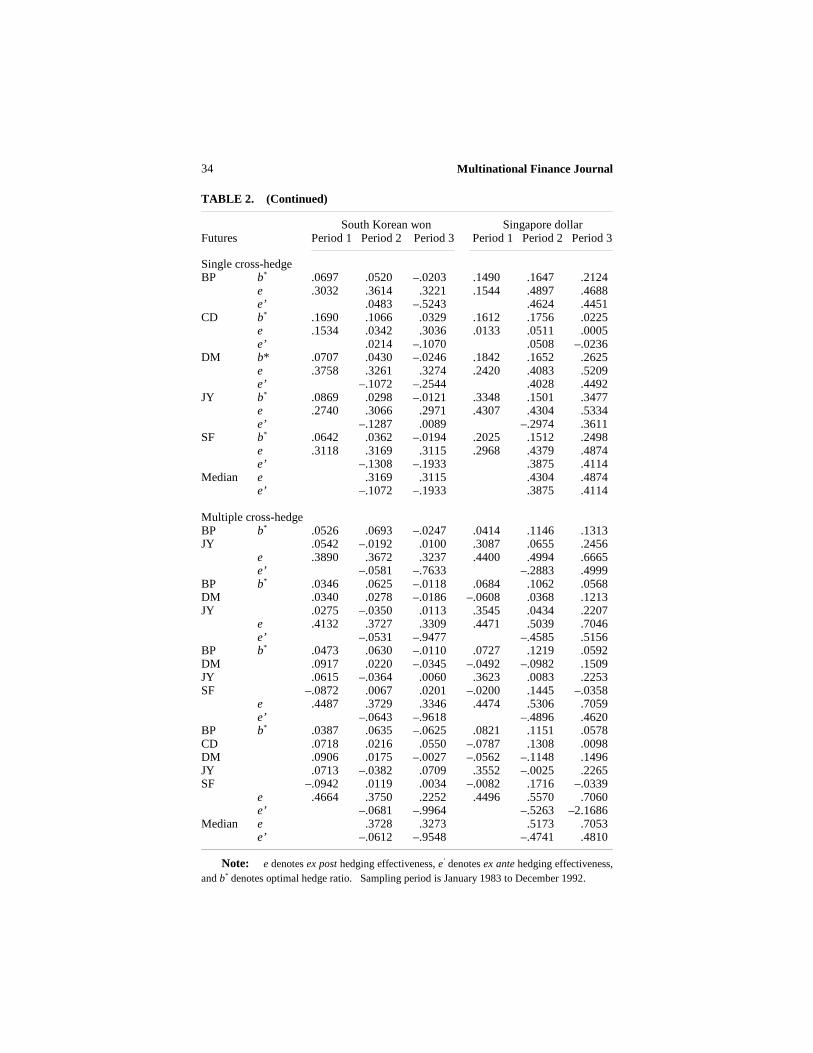
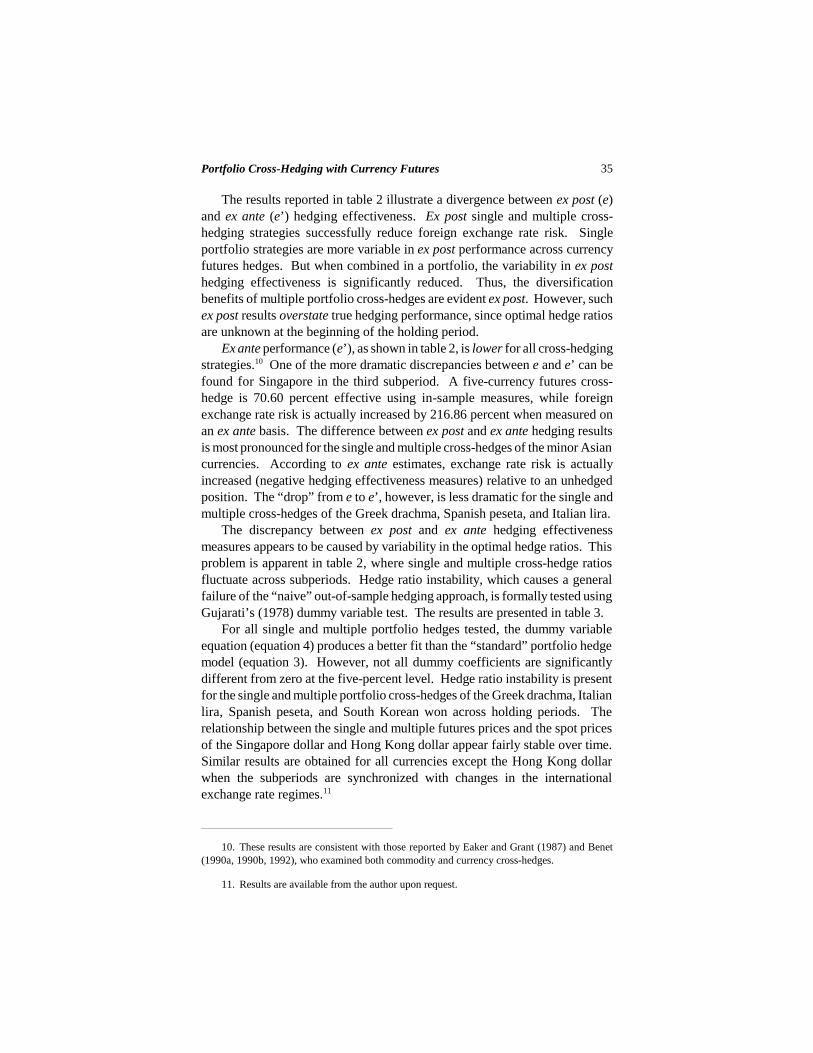
The results reported in table 2 illustrate a divergence between ex post (e)and ex ante (e’) hedging effectiveness. Ex post single and multiple cross-hedging strategies successfully reduce foreign exchange rate risk. Singleportfolio strategies are more variable in ex post performance across currencyfutures hedges. But when combined in a portfolio, the variability in ex posthedging effectiveness is significantly reduced. Thus, the diversificationbenefits of multiple portfolio cross-hedges are evident ex post. However, suchex post results overstate true hedging performance, since optimal hedge ratiosare unknown at the beginning of the holding period.
Ex ante performance (e’), as shown in table 2, is lower for all cross-hedgingstrategies.10 One of the more dramatic discrepancies between e and e’ can befound for Singapore in the third subperiod. A five-currency futures cross-hedge is 70.60 percent effective using in-sample measures, while foreignexchange rate risk is actually increased by 216.86 percent when measured onan ex ante basis. The difference between ex post and ex ante hedging resultsis most pronounced for the single and multiple cross-hedges of the minor Asiancurrencies. According to ex ante estimates, exchange rate risk is actuallyincreased (negative hedging effectiveness measures) relative to an unhedgedposition. The “drop” from e to e’, however, is less dramatic for the single andmultiple cross-hedges of the Greek drachma, Spanish peseta, and Italian lira.
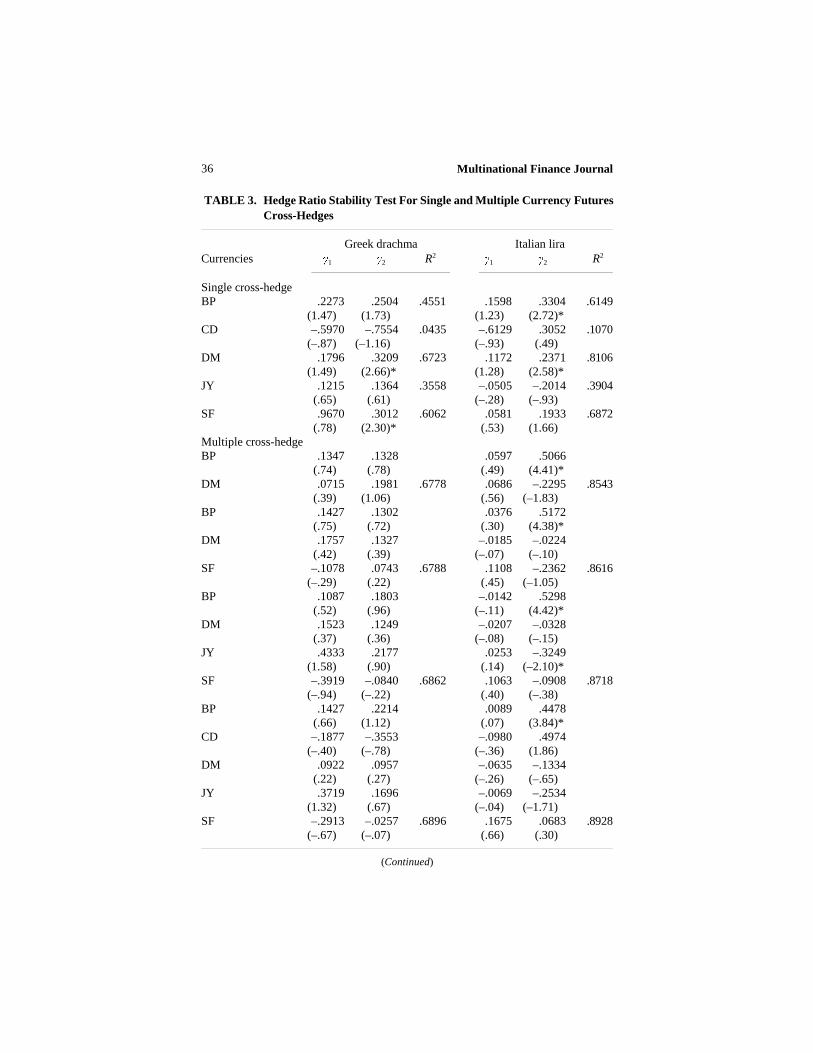
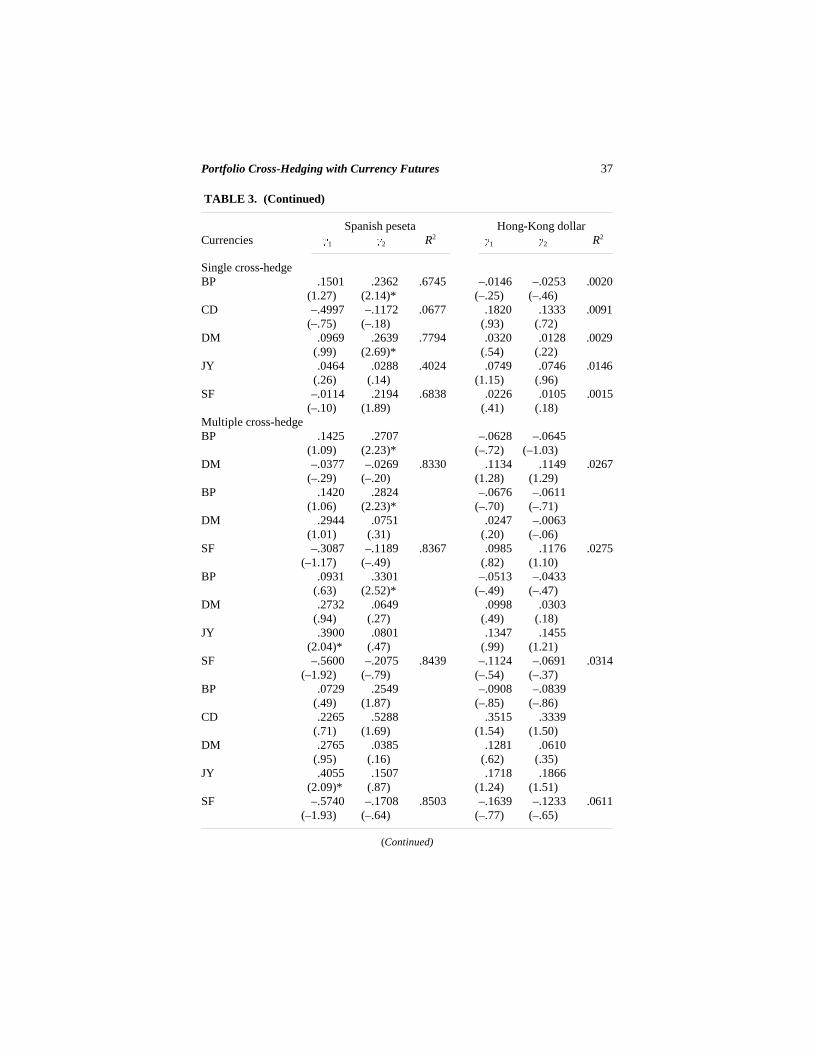
The discrepancy between ex post and ex ante hedging effectivenessmeasures appears to be caused by variability in the optimal hedge ratios. Thisproblem is apparent in table 2, where single and multiple cross-hedge ratiosfluctuate across subperiods. Hedge ratio instability, which causes a generalfailure of the “naive” out-of-sample hedging approach, is formally tested usingGujarati’s (1978) dummy variable test. The results are presented in table 3.
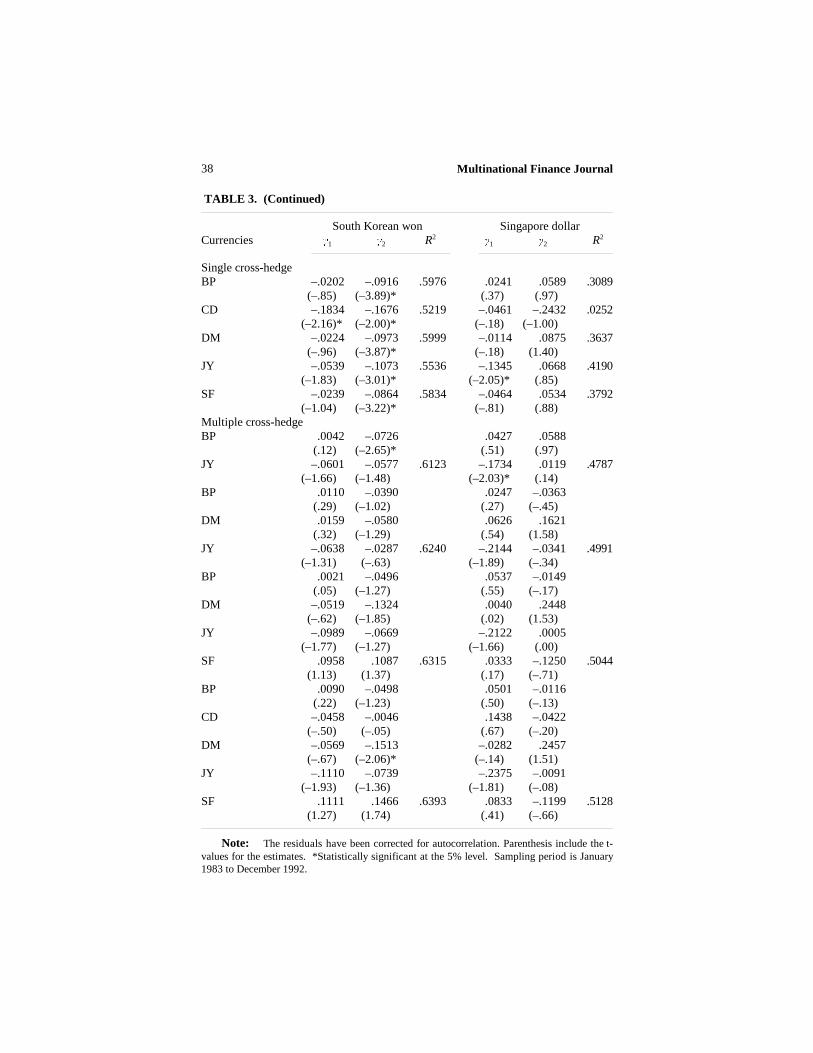
For all single and multiple portfolio hedges tested, the dummy variableequation (equation 4) produces a better fit than the “standard” portfolio hedgemodel (equation 3). However, not all dummy coefficients are significantlydifferent from zero at the five-percent level. Hedge ratio instability is presentfor the single and multiple portfolio cross-hedges of the Greek drachma, Italianlira, Spanish peseta, and South Korean won across holding periods. Therelationship between the single and multiple futures prices and the spot pricesof the Singapore dollar and Hong Kong dollar appear fairly stable over time.Similar results are obtained for all currencies except the Hong Kong dollarwhen the subperiods are synchronized with changes in the internationalexchange rate regimes.11
Multinational Finance Journal36
TABLE 3. Hedge Ratio Stability Test For Single and Multiple Currency FuturesCross-Hedges
Greek drachma Italian liraCurrencies 1 2 R2
1 2 R2
Single cross-hedgeBP .2273 .2504 .4551 .1598 .3304 .6149
(1.47) (1.73) (1.23) (2.72)*CD –.5970 –.7554 .0435 –.6129 .3052 .1070
(–.87) (–1.16) (–.93) (.49)DM .1796 .3209 .6723 .1172 .2371 .8106
(1.49) (2.66)* (1.28) (2.58)*JY .1215 .1364 .3558 –.0505 –.2014 .3904
(.65) (.61) (–.28) (–.93)SF .9670 .3012 .6062 .0581 .1933 .6872
(.78) (2.30)* (.53) (1.66)Multiple cross-hedgeBP .1347 .1328 .0597 .5066
(.74) (.78) (.49) (4.41)*DM .0715 .1981 .6778 .0686 –.2295 .8543
(.39) (1.06) (.56) (–1.83)BP .1427 .1302 .0376 .5172
(.75) (.72) (.30) (4.38)*DM .1757 .1327 –.0185 –.0224
(.42) (.39) (–.07) (–.10)SF –.1078 .0743 .6788 .1108 –.2362 .8616
(–.29) (.22) (.45) (–1.05)BP .1087 .1803 –.0142 .5298
(.52) (.96) (–.11) (4.42)*DM .1523 .1249 –.0207 –.0328
(.37) (.36) (–.08) (–.15)JY .4333 .2177 .0253 –.3249
(1.58) (.90) (.14) (–2.10)*SF –.3919 –.0840 .6862 .1063 –.0908 .8718
(–.94) (–.22) (.40) (–.38)BP .1427 .2214 .0089 .4478
(.66) (1.12) (.07) (3.84)*CD –.1877 –.3553 –.0980 .4974
(–.40) (–.78) (–.36) (1.86)DM .0922 .0957 –.0635 –.1334
(.22) (.27) (–.26) (–.65)JY .3719 .1696 –.0069 –.2534
(1.32) (.67) (–.04) (–1.71)SF –.2913 –.0257 .6896 .1675 .0683 .8928
(–.67) (–.07) (.66) (.30)
(Continued)
37Portfolio Cross-Hedging with Currency Futures
TABLE 3. (Continued)
Spanish peseta Hong-Kong dollarCurrencies 1 2 R2
1 2 R2
Single cross-hedgeBP .1501 .2362 .6745 –.0146 –.0253 .0020
(1.27) (2.14)* (–.25) (–.46)CD –.4997 –.1172 .0677 .1820 .1333 .0091
(–.75) (–.18) (.93) (.72)DM .0969 .2639 .7794 .0320 .0128 .0029
(.99) (2.69)* (.54) (.22)JY .0464 .0288 .4024 .0749 .0746 .0146
(.26) (.14) (1.15) (.96)SF –.0114 .2194 .6838 .0226 .0105 .0015
(–.10) (1.89) (.41) (.18)Multiple cross-hedgeBP .1425 .2707 –.0628 –.0645
(1.09) (2.23)* (–.72) (–1.03)DM –.0377 –.0269 .8330 .1134 .1149 .0267
(–.29) (–.20) (1.28) (1.29)BP .1420 .2824 –.0676 –.0611
(1.06) (2.23)* (–.70) (–.71)DM .2944 .0751 .0247 –.0063
(1.01) (.31) (.20) (–.06)SF –.3087 –.1189 .8367 .0985 .1176 .0275
(–1.17) (–.49) (.82) (1.10)BP .0931 .3301 –.0513 –.0433
(.63) (2.52)* (–.49) (–.47)DM .2732 .0649 .0998 .0303
(.94) (.27) (.49) (.18)JY .3900 .0801 .1347 .1455
(2.04)* (.47) (.99) (1.21)SF –.5600 –.2075 .8439 –.1124 –.0691 .0314
(–1.92) (–.79) (–.54) (–.37)BP .0729 .2549 –.0908 –.0839
(.49) (1.87) (–.85) (–.86)CD .2265 .5288 .3515 .3339
(.71) (1.69) (1.54) (1.50)DM .2765 .0385 .1281 .0610
(.95) (.16) (.62) (.35)JY .4055 .1507 .1718 .1866
(2.09)* (.87) (1.24) (1.51)SF –.5740 –.1708 .8503 –.1639 –.1233 .0611
(–1.93) (–.64) (–.77) (–.65)
(Continued)
Multinational Finance Journal38
TABLE 3. (Continued)
South Korean won Singapore dollarCurrencies 1 2 R2
1 2 R2
Single cross-hedgeBP –.0202 –.0916 .5976 .0241 .0589 .3089
(–.85) (–3.89)* (.37) (.97)CD –.1834 –.1676 .5219 –.0461 –.2432 .0252
(–2.16)* (–2.00)* (–.18) (–1.00)DM –.0224 –.0973 .5999 –.0114 .0875 .3637
(–.96) (–3.87)* (–.18) (1.40)JY –.0539 –.1073 .5536 –.1345 .0668 .4190
(–1.83) (–3.01)* (–2.05)* (.85)SF –.0239 –.0864 .5834 –.0464 .0534 .3792
(–1.04) (–3.22)* (–.81) (.88)Multiple cross-hedgeBP .0042 –.0726 .0427 .0588
(.12) (–2.65)* (.51) (.97)JY –.0601 –.0577 .6123 –.1734 .0119 .4787
(–1.66) (–1.48) (–2.03)* (.14)BP .0110 –.0390 .0247 –.0363
(.29) (–1.02) (.27) (–.45)DM .0159 –.0580 .0626 .1621
(.32) (–1.29) (.54) (1.58)JY –.0638 –.0287 .6240 –.2144 –.0341 .4991
(–1.31) (–.63) (–1.89) (–.34)BP .0021 –.0496 .0537 –.0149
(.05) (–1.27) (.55) (–.17)DM –.0519 –.1324 .0040 .2448
(–.62) (–1.85) (.02) (1.53)JY –.0989 –.0669 –.2122 .0005
(–1.77) (–1.27) (–1.66) (.00)SF .0958 .1087 .6315 .0333 –.1250 .5044
(1.13) (1.37) (.17) (–.71)BP .0090 –.0498 .0501 –.0116
(.22) (–1.23) (.50) (–.13)CD –.0458 –.0046 .1438 –.0422
(–.50) (–.05) (.67) (–.20)DM –.0569 –.1513 –.0282 .2457
(–.67) (–2.06)* (–.14) (1.51)JY –.1110 –.0739 –.2375 –.0091
(–1.93) (–1.36) (–1.81) (–.08)SF .1111 .1466 .6393 .0833 –.1199 .5128
(1.27) (1.74) (.41) (–.66)
Note: The residuals have been corrected for autocorrelation. Parenthesis include the t-values for the estimates. *Statistically significant at the 5% level. Sampling period is January1983 to December 1992.
39Portfolio Cross-Hedging with Currency Futures
TABLE 4. Simulation Results of Estimated Hedge Ratios and In-Sample HedgingEffectiveness for Single and Multiple Currency Futures Cross-Hedges
Greek Italian Spanish Hong Kong S. Korean SingaporeFutures drachma lira peseta dollar Won dollar
Single cross–hedge BP HR .7993 .7932 .8595 .1059 .1191 .2578
HE .5986 .7040 .7390 .3173 .4855 .5566CD HR .7225 .6321 .6830 –.0231 .1084 .2372
HE .8060 .7917 .8172 .2425 .7335 .7245DM HR .6972 .8238 .7620 –.0191 .0681 .1850
HE .9052 .9879 .9585 .0962 .6472 .7994JY HR .7344 .7753 .7563 .0256 .0784 .2506
HE .6107 .7779 .7275 .0868 .2974 .5977SF HR .5797 .6671 .6301 –.0131 .0510 .1664
HE .9961 .9990 .9978 .4217 .9750 .9921Multiple cross-hedgeBP HR .3135 .0925 .3693 .1246 .1103 .1520DM/JY** .6174 .8182 .5630 –.0042 .0297 .2015
HE .9049 .9888 .9618 .3797 .5070 .6369BP HR .3218 .0939 .3878 .1315 .0935 .1490DM .5880 .7979 .6626 –.0040 .0434 .0222SF/JY** –.0004 .0100 –.1263 –.0112 –.0006 .1792
HE .8989 .9883 .9893 .4980 .6885 .6903BP HR .3097 .0876 .3792 .1784 .0975 .1490DM .5873 .7945 .6611 –.0378 .0566 –.0411JY .1161 .0976 .1033 –.0417 –.0091 .1349SF –.0703 –.0557 –.1912 .0214 –.0239 .0698
HE .9411 .9915 .9944 .7247 .9446 .9749BP HR .2653 .0579 .3651 .1800 .0929 .1310CD .3045 .1707 .0864 –.0365 .0335 .1235DM .5829 .8049 .6585 –.0404 .0537 –.0428JY .1226 .0986 .1018 –.0504 –.0090 .1375SF –.0729 –.0574 –.1919 .0220 –.0237 .0688
HE .9517 .9929 .9952 .7900 .9498 .9806
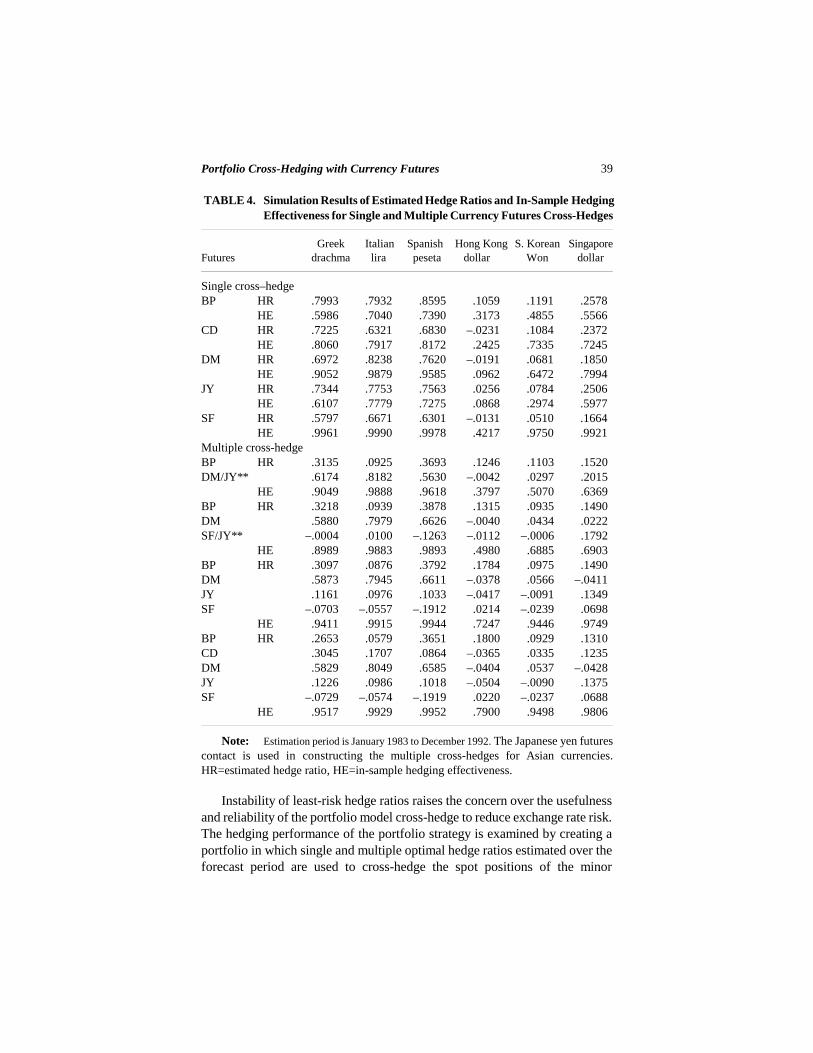
Note: Estimation period is January 1983 to December 1992. The Japanese yen futurescontact is used in constructing the multiple cross-hedges for Asian currencies.HR=estimated hedge ratio, HE=in-sample hedging effectiveness.
Instability of least-risk hedge ratios raises the concern over the usefulnessand reliability of the portfolio model cross-hedge to reduce exchange rate risk.The hedging performance of the portfolio strategy is examined by creating aportfolio in which single and multiple optimal hedge ratios estimated over theforecast period are used to cross-hedge the spot positions of the minor
Multinational Finance Journal40
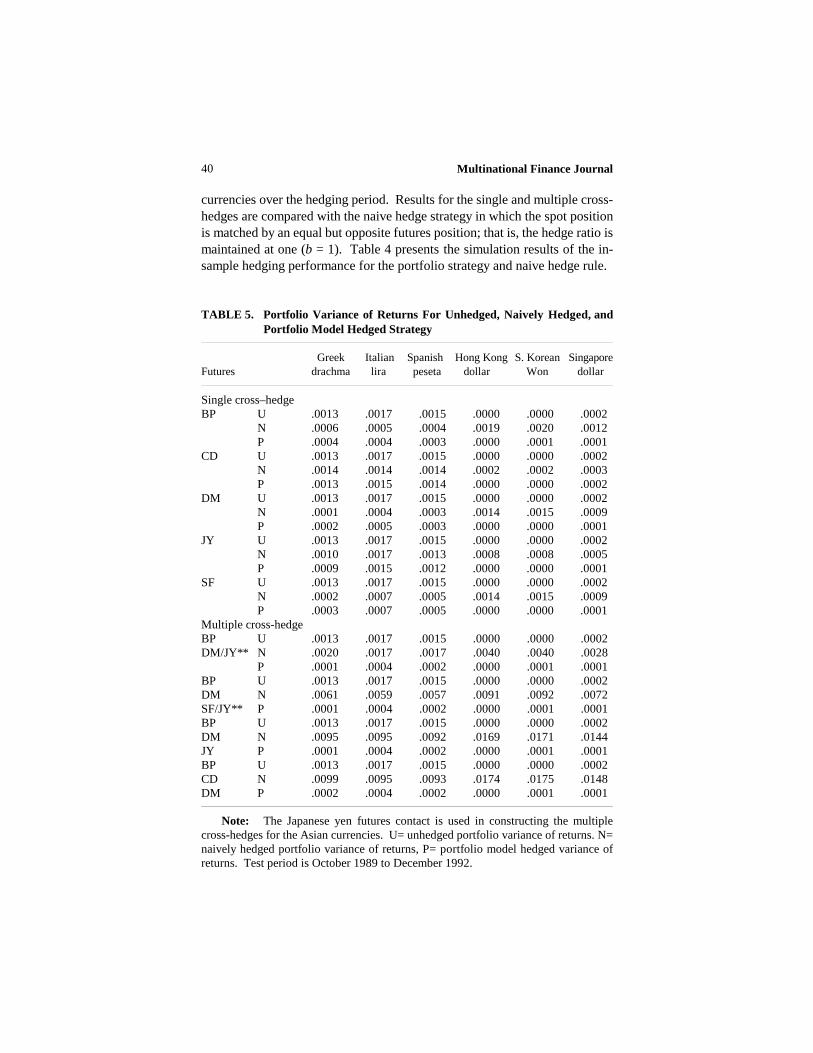
currencies over the hedging period. Results for the single and multiple cross-hedges are compared with the naive hedge strategy in which the spot positionis matched by an equal but opposite futures position; that is, the hedge ratio ismaintained at one (b = 1). Table 4 presents the simulation results of the in-sample hedging performance for the portfolio strategy and naive hedge rule.
TABLE 5. Portfolio Variance of Returns For Unhedged, Naively Hedged, andPortfolio Model Hedged Strategy
Greek Italian Spanish Hong Kong S. Korean SingaporeFutures drachma lira peseta dollar Won dollar
Single cross–hedge BP U .0013 .0017 .0015 .0000 .0000 .0002
N .0006 .0005 .0004 .0019 .0020 .0012P .0004 .0004 .0003 .0000 .0001 .0001
CD U .0013 .0017 .0015 .0000 .0000 .0002N .0014 .0014 .0014 .0002 .0002 .0003P .0013 .0015 .0014 .0000 .0000 .0002
DM U .0013 .0017 .0015 .0000 .0000 .0002N .0001 .0004 .0003 .0014 .0015 .0009P .0002 .0005 .0003 .0000 .0000 .0001
JY U .0013 .0017 .0015 .0000 .0000 .0002N .0010 .0017 .0013 .0008 .0008 .0005P .0009 .0015 .0012 .0000 .0000 .0001
SF U .0013 .0017 .0015 .0000 .0000 .0002N .0002 .0007 .0005 .0014 .0015 .0009P .0003 .0007 .0005 .0000 .0000 .0001
Multiple cross-hedgeBP U .0013 .0017 .0015 .0000 .0000 .0002DM/JY** N .0020 .0017 .0017 .0040 .0040 .0028
P .0001 .0004 .0002 .0000 .0001 .0001BP U .0013 .0017 .0015 .0000 .0000 .0002DM N .0061 .0059 .0057 .0091 .0092 .0072SF/JY** P .0001 .0004 .0002 .0000 .0001 .0001BP U .0013 .0017 .0015 .0000 .0000 .0002DM N .0095 .0095 .0092 .0169 .0171 .0144JY P .0001 .0004 .0002 .0000 .0001 .0001BP U .0013 .0017 .0015 .0000 .0000 .0002CD N .0099 .0095 .0093 .0174 .0175 .0148DM P .0002 .0004 .0002 .0000 .0001 .0001
Note: The Japanese yen futures contact is used in constructing the multiplecross-hedges for the Asian currencies. U= unhedged portfolio variance of returns. N=naively hedged portfolio variance of returns, P= portfolio model hedged variance ofreturns. Test period is October 1989 to December 1992.
41Portfolio Cross-Hedging with Currency Futures
For all minor currencies, the estimated hedge ratios are significantlydifferent from one at the five-percent level. For example, Italian lira risk isminimized by going long .8238 German mark futures. Similarly, going long.1664 Swiss franc futures reduces Singapore dollar risk. Thus, a full hedge isnot necessarily the best strategy for minimizing risk, which is consistent withEderington’s (1979) finding. In-sample hedging effectiveness is high for bothsingle and multiple portfolio cross-hedges which clearly benefit from thediversification effect. In more than 80% of all portfolio cross-hedges (i.e., 45out of 54), the coefficient of determination, HE, is greater than .5000.
Based on the variance of portfolio returns, as shown in table 5, the naiveand portfolio strategies are equally effective in reducing foreign exchange raterisk of the three minor European currencies with a single futures currencycross-hedge relative to an unhedged position.
However, a multiple currency futures cross-hedge results in risk reductionperformance under a portfolio strategy superior to that of simply following anaive hedging rule. Failure of the naive strategy with a hedge ratio of one maybe directly linked to the optimal cross-hedge ratios estimated under theportfolio model, which were found to be significantly different from one (seetable 4). On the other hand, the greater variability of multiple hedge ratios,verified by the hedge ratio stability test (see table 3) and the fluctuating ex posthedge ratios seen across currencies and subperiods (see table 2), does not seemto significantly impact the cross-hedging performance.
For the single currency futures cross-hedges of the South Korean won andthe Hong Kong dollar, neither the naive strategy nor the portfolio strategy resultin significant risk reduction. In these two cases, the portfolio variance ofreturns is minimized by remaining unhedged. For the multiple currency futurescross-hedges, only Singapore dollar risk is significantly reduced under theportfolio strategy.
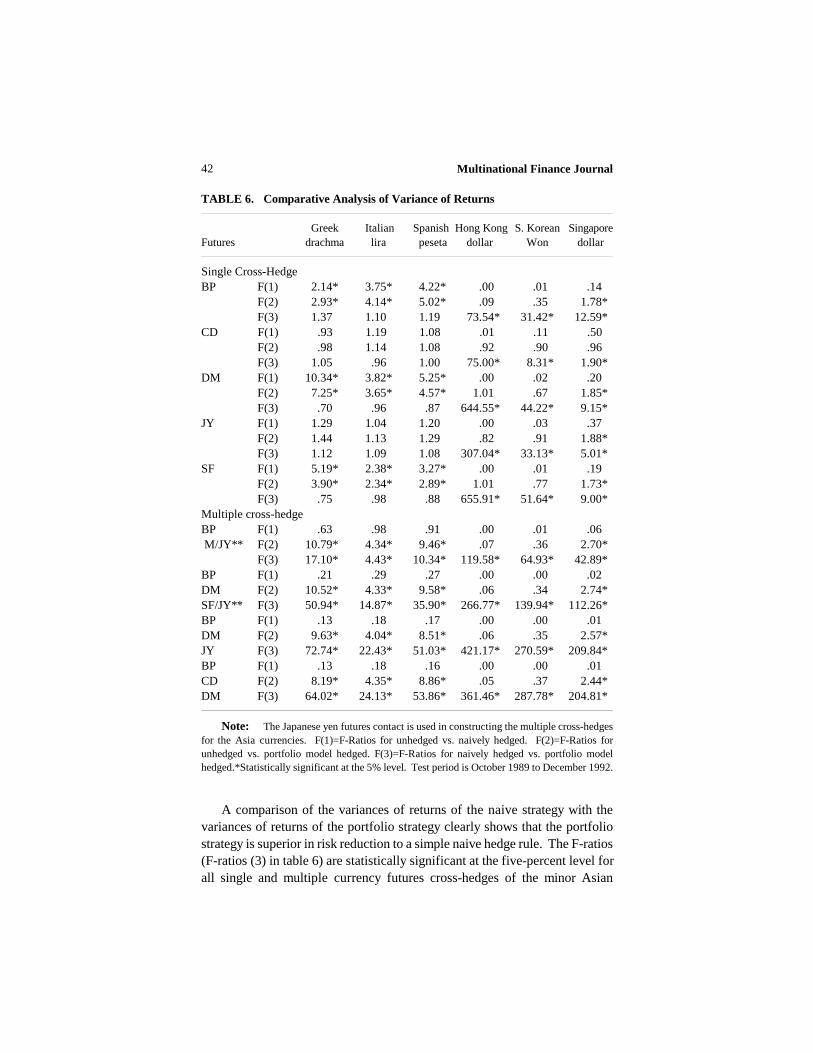
The significance of risk-reduction effectiveness of single and multiplecurrency cross-hedging is evaluated by comparing the variances of returns ofnot hedging with the variances of returns from the naive and portfolio strategy,respectively. According to the computed F ratios in table 6 (F-ratios (1) and F-ratios (2)), both hedging strategies reduce risk relative to an unhedged positionfor single currency cross-hedges of the European currencies.
Risk reduction is statistically significant only when the portfolio strategy isemployed to create multiple currency futures cross-hedges (F-ratios (2)). Thesingle and multiple currency cross-hedges of the South Korean won and theHong Kong dollar under the naive and portfolio strategies actually increasedrisk.
Multinational Finance Journal42
TABLE 6. Comparative Analysis of Variance of Returns
Greek Italian Spanish Hong Kong S. Korean SingaporeFutures drachma lira peseta dollar Won dollar
Single Cross-HedgeBP F(1) 2.14* 3.75* 4.22* .00 .01 .14
F(2) 2.93* 4.14* 5.02* .09 .35 1.78*F(3) 1.37 1.10 1.19 73.54* 31.42* 12.59*
CD F(1) .93 1.19 1.08 .01 .11 .50 F(2) .98 1.14 1.08 .92 .90 .96 F(3) 1.05 .96 1.00 75.00* 8.31* 1.90*DM F(1) 10.34* 3.82* 5.25* .00 .02 .20 F(2) 7.25* 3.65* 4.57* 1.01 .67 1.85* F(3) .70 .96 .87 644.55* 44.22* 9.15*JY F(1) 1.29 1.04 1.20 .00 .03 .37 F(2) 1.44 1.13 1.29 .82 .91 1.88* F(3) 1.12 1.09 1.08 307.04* 33.13* 5.01*SF F(1) 5.19* 2.38* 3.27* .00 .01 .19 F(2) 3.90* 2.34* 2.89* 1.01 .77 1.73* F(3) .75 .98 .88 655.91* 51.64* 9.00*Multiple cross-hedgeBP F(1) .63 .98 .91 .00 .01 .06 M/JY** F(2) 10.79* 4.34* 9.46* .07 .36 2.70* F(3) 17.10* 4.43* 10.34* 119.58* 64.93* 42.89*BP F(1) .21 .29 .27 .00 .00 .02DM F(2) 10.52* 4.33* 9.58* .06 .34 2.74*SF/JY** F(3) 50.94* 14.87* 35.90* 266.77* 139.94* 112.26*BP F(1) .13 .18 .17 .00 .00 .01DM F(2) 9.63* 4.04* 8.51* .06 .35 2.57*JY F(3) 72.74* 22.43* 51.03* 421.17* 270.59* 209.84*BP F(1) .13 .18 .16 .00 .00 .01CD F(2) 8.19* 4.35* 8.86* .05 .37 2.44*DM F(3) 64.02* 24.13* 53.86* 361.46* 287.78* 204.81*
Note: The Japanese yen futures contact is used in constructing the multiple cross-hedgesfor the Asia currencies. F(1)=F-Ratios for unhedged vs. naively hedged. F(2)=F-Ratios forunhedged vs. portfolio model hedged. F(3)=F-Ratios for naively hedged vs. portfolio modelhedged.*Statistically significant at the 5% level. Test period is October 1989 to December 1992.
A comparison of the variances of returns of the naive strategy with thevariances of returns of the portfolio strategy clearly shows that the portfoliostrategy is superior in risk reduction to a simple naive hedge rule. The F-ratios(F-ratios (3) in table 6) are statistically significant at the five-percent level forall single and multiple currency futures cross-hedges of the minor Asian
43Portfolio Cross-Hedging with Currency Futures
12. In February 1980, the Bank of Korea introduced a multi-currency basket peg system(MCBP). Under this mechanism, the U.S. dollar/Korean won exchange rate was “determined asthe weighted average of two basket rates - an SDR basket and a trade-weighted basket, with anadditional influence of an adjustment factor determined by the Bank of Korea” (Euromoney, June1995, p. 10). As of March 1990, Korea operates under a market average rate system (MAR) whichgives market forces a greater role in determining the exchange rate.
currencies examined. European currency risk is reduced in a statistical senseonly with multiple currency futures cross-hedges under the portfolio strategy.
In summary, the results presented here for cross-hedging the currencies ofminor European and Asian nations are generally consistent with the results forcross-hedging foreign exchange exposure of minor currencies. These findingsalso present empirical evidence for the cross-hedging strategies which areclosely related to the institutional characteristics of the currency hedged. Thatis, the Greek drachma and the Singapore dollar are managed floatingcurrencies, while the Spanish peseta and the Italian lira, for a portion of thesample period, belong to the Exchange Rate Mechanism of the EuropeanMonetary System. Those currencies pegged to a basket of various currencies,such as the South Korean won (until 1990), are most effectively cross-hedgedwith a basket hedge that reflects this policy.12 And foreign exchange rateswhich are linked to the U.S. dollar experience limited value change. Thus,there is no need to hedge the currency exposure, especially if the country’seconomy is relatively strong and a currency devaluation is highly unlikely.
IV. Summary and Conclusions
This study presents empirical evidence on portfolio model cross-hedgingwith currency futures contracts. Single and multiple cross-hedges for Europeanand Asian currencies, for which organized futures and forward markets arelimited or nonexistent, were examined over the 1983 to 1992 sample period.Following Ederington’s methodology, cross-hedging effectiveness wasmeasured ex post, by using the OLS parameter estimates, and ex ante, byimplementing prior least risk hedge ratios in subsequent hedge periods. The expost results generally support the cross-hedging strategy for all minorcurrencies examined, except the Hong Kong dollar. Comparison of hedgingeffectiveness measures shows a discrepancy between in-sample and out-of-sample performance. While the “drop” in cross-hedging effectiveness has notbeen determined to present a large problem for the minor European currencies,it is significant when cross-hedging the minor Asian currencies with currencyfutures. Here, the effectiveness measures are negative indicating that Asiancurrency risk is actually increased by the single and multiple currency futures
Multinational Finance Journal44
cross-hedges relative to an unhedged position. These results, in turn, indicatethat in-sample effectiveness measures overstate real-world hedgingperformance.
The cause for the lower ex ante hedging effectiveness appears to be hedge-ratio variability. Examination of cross-hedge ratios across currencies andsubperiods suggest that currency futures cross-hedging strategies would besomewhat susceptible to swings in performance. However, a formal hedgeratio stability test finds only the cross-hedge ratios for the minor Europeancurrencies to be unstable over time; the currency futures cross-hedge ratios forthe Asian currencies are relatively stable. Yet, the intertemporal cross-hedgeratio instability does not appear to have a substantial impact on the cross-hedging performance of currency futures for the European currencies.
Comparison of simulated currency futures cross-hedging strategies showsthat the portfolio model yields superior risk reduction performance. Thevariance of hedged portfolio returns is minimized when cross-hedging theEuropean currencies and the Singapore dollar. Application of the portfolio andnaive hedge strategies to managing Hong Kong dollar and South Korean wonrisk, however, increases exposure to the hedger. Because of the diversificationeffect, multiple-currency futures cross-hedges outperform single-currencyfutures cross-hedges. Moreover, cross-hedging a single spot position with two-currency futures positions is as effective as with five-currency futurespositions.
The empirical results obtained from this study have important policyimplications for international businesses that find themselves exposed toexchange rate risk which cannot be laid off directly in the currency futures andforward markets. In general, cross-hedging provides opportunities to minimizeexchange rate risk at relatively low cost for the single non-traded currency.However, hedgers may have to accept lower cross-hedging performance exante. Moreover, Asian currency risk cannot be effectively cross-hedged withcurrency futures even if the optimal cross-hedge ratios are stable over time. Onthe other hand, hedge-ratio instability may not necessarily affect cross-hedgingperformance. And optimal hedge parameters derived from the portfolio modelappear to be quite useful, particularly in the case of multiple-currency futurescross-hedges. Although portfolio risk and return and statistical relationshipsare important, the currency hedger must also pay close attention to institutionaldetails as well as strong economic relationships to create a “good” cross-hedge.
45Portfolio Cross-Hedging with Currency Futures
References
Anderson, R. W., and Danthine, J.–P. 1981. Cross-hedging. Journal of PoliticalEconomy 89:1182–1196.
Benet, B. A. 1990a. Commodity futures cross-hedging of foreign exchange exposure.Journal of Futures Markets 10:287–306.
Benet, B. A. 1990b. Ex ante reduction of foreign exchange exposure via hedge-ratioadjustment. Review of Futures Markets 9:418–435.
Benet, B. A. 1992. Hedge period length and ex-ante futures hedging effectiveness: thecase of foreign-exchange risk cross-hedges. Journal of Futures Markets12:163–175.
Braga, F. S.; Martin, L. J.; and Meilke, K. D. 1989. Cross-hedging the Italian lira/USdollar exchange rate with deutsch mark futures. Journal of Futures Markets9:87–99.
Braga, F. S., and Martin, L. J. 1990. Out of sample effectiveness of a joint commodityand currency hedge: The case of soybean meal in Italy. Journal of Futures Markets10:229–245.
Dale, C. 1981. The hedging effectiveness of currency futures markets. Journal ofFutures Markets 1:77–88.
Eaker, M. R., and Grant, D. M. 1987. Cross-hedging foreign currency risk. Journal ofInternational Money and Finance 8:85–105.
Eaker, M. R., and Grant, D. M. 1989. Complex hedges: How well do they work?”Journal of Futures Markets 9:15–27.
Ederington, L. 1979. The hedging performance of the new futures markets. Journal ofFinance 34:157–170.
Grammatikos, T., and Saunders, A. 1983. Stability and the hedging performance offoreign currency futures. Journal of Futures Markets 3:295–305.
Gujarati, D. 1978. Basic Econometrics. New York: McGraw-Hill.Hill, J., and Schneeweis, T. 1981. A note on the hedging effectiveness of foreign
currency futures markets. Journal of Futures Markets 1:660-663.Hill, J., and Schneeweis, T. 1982. The hedging effectiveness of foreign currency futures.
Journal of Financial Research 5:95-104.Johnson, L. L. 1960. The theory of hedging and speculation in commodity futures.
Review of Economic Studies 27:139-151.Kwok, C. Y. 1987. Hedging foreign exchange exposures: Independent vs integrative
approaches. Journal of International Business Studies (Summer): 33–51.Lypny, G. J. 1988. Hedging foreign exchange risk and currency futures: Portfolio
effects. Journal of Futures Markets 8:703–715.Malliaris, A. G., and Urrutia, J. L. 1991. The impact of the lengths of estimation periods
and hedging horizons on the effectiveness of a hedge: Evidence from foreigncurrency futures. Journal of Futures Markets 11:271-289.
Markowitz, H. 1952. Portfolio selection. Journal of Finance 7:77–91.Marmer, H. S. 1986. Portfolio model hedging with Canadian dollar futures: A
framework for analysis. Journal of Futures Markets 6:83–92.Park, H.Y.; Lee, A.; and Lee, H.W. 1987. Cross-hedging performance of the U.S.
Multinational Finance Journal46
currency futures market: The European monetary system currencies. Advances inFutures and Options Research 2:223-241.
Stein, J. L. 1961. The simultaneous determination of spot and futures prices. AmericanEconomic Review 1012-1025.
The 1995 Guide to Italy. 1995. Euromoney (January). London: Euromoney PublicationsPLC.
The 1995 Guide to Emerging Currencies. 1995. Euromoney (June). London: EuromoneyPublications PLC.
The 1995 Guide to Greece. 1995. Euromoney (September). London: EuromoneyPublications.
The 1996 Guide to Eemerging Market Currencies. 1996. Euromoney (June). London:Euromoney Publications PLC.
Witt, H. J.; Schroeder, T. C.; and Hayenga, M. L. 1987. Comparison of analyticalapproaches for estimating hedge ratios for agricultural commodities. Journal ofFutures Markets 7:135-146.