Embed Size (px)
Citation preview

FIBER BRAGG GRATING (FBG) SENSORS FOR THE SIMULTANEOUS
MEASUREMENTS OF STRAIN AND TEMPERATURE
by
ABHAY KUMAR SINGH
Presented to the Faculty of the Graduate School of
The University of Texas at Arlington in Partial Fulfillment
of the Requirements
for the Degree of
MASTER OF SCIENCE IN MECHANICAL ENGINEERING
THE UNIVERSITY OF TEXAS AT ARLINGTON
December 2016

ii
Copyright © by Abhay Kumar Singh 2016
All Rights Reserved

iii
Acknowledgements
I would like to express my sincere gratitude to my advisor Prof. Haiying Huang for
the continuous support throughout my graduate study and research: for her patience,
motivation, enthusiasm, and immense knowledge.
Besides my advisor, I would like to thank my thesis committee: Dr. Ankur Jain and
Dr. Bo. P. Wang for their encouragement, insightful comments, and support.
My sincere thanks also goes to the program manager Dr. Ignacio Perez, office of
Naval research, for his supports, suggestions, and for funding this project.
I thank my fellow labmates in Advance Sensor and Technology Laboratory (ASTL):
Franck Tchafa, Kranthi Balusu, and Jalal Fathi Sola for the stimulating discussions, working
together before deadlines, and for all the fun we have had.
Finally, I must express my very profound gratitude to my parents for providing me
with unfailing support and continuous encouragement throughout my years of study. This
accomplishment would not have been possible without them. Thank you.
Nov. 30, 2016

iv
Abstract
This research presents a single fiber Bragg grating (FBG) sensor that is capable
of measuring the axial load and temperature simultaneously. The FBG sensor is coated
with a block of recrystallized Lophine, which introduces the bandwidth modulation of the
FBG reflectance spectrum. Thermal-mechanical testing of the Lophine-coated FBG sensor
under different load and temperature combinations was carried out. It was discovered that
the FBG bandwidth is linearly proportional to the applied load and temperature. By fitting
the measured FBG bandwidths and central Bragg wavelengths as linear functions of the
axial load and temperature, we demonstrated that the axial load and temperature can be
inversely determined from the measured reflectance spectrum of a single Lophine-coated
FBG sensor. The measurement errors for the axial load and the temperature were found
to be ±4 gm and ±4 °C, respectively.

v
Table of Contents
Acknowledgements ............................................................................................................. iii
Abstract .............................................................................................................................. iv
List of Illustrations ............................................................................................................. viii
Chapter 1 Introduction ......................................................................................................... 1
Challenges ...................................................................................................................... 2
Current Research Efforts and Limitations....................................................................... 3
Proposed Technique....................................................................................................... 5
Addressing the long-standing limitation of FBG sensors (i.e. their cross-
sensitivity to strain and temperature): ........................................................................ 5
Thesis Objective ............................................................................................................. 6
Chapter 2 Background ........................................................................................................ 7
Fiber structure and Physics ............................................................................................ 7
Classification of Optical Fiber ......................................................................................... 9
Single-mode fiber (SMF): ........................................................................................... 9
Multi-mode fiber (MMF): ........................................................................................... 10
Bragg Grating ............................................................................................................... 11
Types of Fiber Bragg Gratings ..................................................................................... 12
Common Bragg Grating............................................................................................ 13
Blazed Bragg Grating ............................................................................................... 13
Chirped Bragg Grating.............................................................................................. 13
Apodized Bragg Grating ........................................................................................... 14
Chapter 3 Principle of Operation ....................................................................................... 15
Effect of coating absorption on FBG spectrum ............................................................. 17
Thermochromic materials for optical absorption .......................................................... 18

vi
Chapter 4 Sensor Fabrication ........................................................................................... 21
Grating inscription ......................................................................................................... 21
Coating Process ........................................................................................................... 21
Lophine: .................................................................................................................... 22
Solder Paste: ............................................................................................................ 24
NOA-61: .................................................................................................................... 24
Chapter 5 Characterization of FBG sensor ....................................................................... 25
Experimental Set-up ..................................................................................................... 25
Thermo-Mechanical Testing ......................................................................................... 26
Result ............................................................................................................................ 28
Data Processing ........................................................................................................... 30
Error Estimation ............................................................................................................ 31
Chapter 6 Discussion ........................................................................................................ 33
Thermochromic Effect (TFBG) ..................................................................................... 33
Principle of operation ................................................................................................ 33
Thermal response ..................................................................................................... 36
Study the effect of coating thickness ................................................................... 38
Use non-thermochromic material as coating ....................................................... 40
Mechanical response ................................................................................................ 42
Birefringence ................................................................................................................. 44
Principle of operation ................................................................................................ 44
Sensor Response ..................................................................................................... 47
Chapter 7 Conclusion and Future Work ............................................................................ 50
Appendix A MATLAB Code ............................................................................................... 51
References ........................................................................................................................ 55

vii
Biographical Information ................................................................................................... 61

viii
List of Illustrations
Figure 2-1 Cross section view of optical fiber and single fiber cable [48]. .......................... 7
Figure 2-2 Propagation of light in optical fiber [28]. ............................................................ 8
Figure 2-3 Two types of step index SMF; (a) Matched cladding fiber and (b) Depressed
cladding fiber. .................................................................................................................... 10
Figure 2-4 Two types of MMF; (a) Step index and (b) Gradient index. ............................ 10
Figure 2-5 Schematic of fiber Bragg grating with uniform index-modulation, amplitude and
period [29]. ........................................................................................................................ 11
Figure 2-6 Schematic of light coupling between core and cladding of a blazed fiber Bragg
grating [29]. ....................................................................................................................... 13
Figure 2-7 Schematic diagram of a chirped grating with a non-periodic pitch [29]. .......... 14
Figure 2-8 Apodized Bragg grating (source: Internet). ..................................................... 14
Figure 3-1 Schematic of the proposed strain - temperature sensor; a) configuration of the
sensor; b) an FBG with an enlarged core mode. .............................................................. 16
Figure 3-2 Spectral bandwidth increase of a cladding mode resonance as the absorption
of the coating material increases [30]. .............................................................................. 17
Figure 3-3 Temperature-dependent transmission spectrum of a pure vanadium dioxide
(VO2) film [35]. ................................................................................................................... 18
Figure 3-4 Absorbance of Lophine as a function of temperature (a) from 350 nm to 1550
nm and (b) at 1310 and 1550 nm [38]. .............................................................................. 19
Figure 4-1. Inscribing Bragg gratings in the core of a photosensitive fiber [40]................ 21
Figure 4-2. Coating Fiber Bragg Grating with recrystallized Lophine: (a) mold for
thickness control; (b) melt Lophine in a beaker using a hot plate; (c) recrystallize Lophine
in the mold; (d) recrystallized Lophine block with FBG encapsulated inside; (e) reduce the

ix
height of the recrystallized Lophine block using a heated plate; (f) final Lophine – coated
FBG sample. ..................................................................................................................... 23
Figure 4-3. a) Solder gun used for coating process; b) FBG sensor coated with solder
paste.................................................................................................................................. 24
Figure 4-4. FBG sensor coated with NOA-61 epoxy. ....................................................... 24
Figure 5-1 Experimental setup for measuring the reflectance spectrum of FBG sensor. . 25
Figure 5-2 Reflectance spectra of the FBG before and after Lophine coating. ................ 26
Figure 5-3 Experimental set-up for thermal-mechanical testing of Lophine-coated FBG
sensor. .............................................................................................................................. 27
Figure 5-4 Change of FBG spectrum with temperature under two different loads; (a) 0gm;
(b) 20gm; (c) 40gm; (d) 60gm; (e) 80gm. .......................................................................... 28
Figure 5-5 The shift in (a) central Bragg wavelength and (b) bandwidth with the applied
weight under different temperatures ................................................................................. 29
Figure 5-6 The shift in (a) central Bragg wavelength and (b) bandwidth with change in
temperature under different weight. .................................................................................. 29
Figure 5-7 Curve fitting for the change in (a) bandwidth and (b) central Bragg wavelength
under simultaneous load and temperature varriations ...................................................... 30
Figure 5-8 Differences between the measurements and the actual values: (a)
temperature; (b) applied weight. ....................................................................................... 32
Figure 6-1 Schematic of a tilted FBG sensor that promotes LP01-LP11 mode coupling and
is coated with the thermochromic material. ....................................................................... 34
Figure 6-2 Transmission spectrum of a tilted FBG with the LP01 and LP11 resonances
shown and the shorter wavelength cladding modes suppressed [45]. ............................. 34
Figure 6-3 Controlling the mode couplings through the tilt angle; (a) coupling strengths of
the LP01-LP01 and LP01-LP11 mode coupling as a function of the FBG tilt angle; b)

x
suppression of the LP01-LP01 resonance in the transmission spectrum using an FBG with
a tilt angle of 6.1° [45]. ...................................................................................................... 35
Figure 6-4 Experimental set-up for thermal response of Lophine coated TFBG sensors. 36
Figure 6-5 Spectral shift of Lophine – coated TFBG sensor. ............................................ 37
Figure 6-6 Shift in (a) central Bragg wavelength (b) bandwidth with temperature change.
.......................................................................................................................................... 37
Figure 6-7 Change in bandwidth with temperature for three different thickness of coating;
(a) 0.5 mm, (b) 1 mm and (c) 3 mm. ................................................................................. 39
Figure 6-8 TFBG sensor coated with; (a) NOA-61 epoxy and (b) Solder paste ............... 40
Figure 6-9 Change in (a) Bragg wavelength and (b) bandwidth of NOA-61 coated TFBG
sensor versus temperature ............................................................................................... 41
Figure 6-10 Change in (a) Bragg wavelength and (b) bandwidth of TFBG sensor coated
with solder paste versus temperature. .............................................................................. 42
Figure 6-11 Experimental set-up for measuring mechanical-loading response of Lophine
coated TFBG sensors. ...................................................................................................... 43
Figure 6-12 Spectral shift of Lophine – coated TFBG sensor with mechanical loading. .. 43
Figure 6-13 Shift in (a) central Bragg wavelength (b) bandwidth with applied mechanical
load. ................................................................................................................................... 44
Figure 6-14 Schematic of externally induced birefringence in an FBG sensor and
polarization of guided light. ............................................................................................... 45
Figure 6-15 Spectral response of the polarized FBG sensor with two axes: fast axis and
slow axis [49]. .................................................................................................................... 45
Figure 6-16 Change in FBG spectrum at different polarization state of the signal [31]. ... 46
Figure 6-17 Schematics of transversely loaded-FBG sensor for inducing birefringence. 47

xi
Figure 6-18 Experimental set-up for measuring externally induced birefringence in an
FBG sensor (or transversely loaded sensor). ................................................................... 47
Figure 6-19 Shift in FBG spectrum of (a) normal FBG and (b) transversely-loaded FBG
sensor by varying polarization state of the signal. ............................................................ 48
Figure 6-20 Shift in central Bragg wavelength with angle of polarization. ........................ 48
Figure 6-21 (a) Spectrum of Lophine-coated FBG sensor and (b) its central Bragg
wavelength at different angle of polarization. ................................................................... 49
Figure 7-1 FBG embedded in cross ply composite laminate. ........................................... 50

1
Chapter 1
Chapter 2
Introduction
Optical fiber sensors are the sensor of choice for Structural Health Monitoring
(SHM), primarily due to their light weight, compact size, inexpensive cost, and immunity to
electro-magnetic interference (EMI) etc.[1–3]. Fiber Bragg grating (FBG) based sensors
are the most widely accepted optical fiber sensors in the SHM community [4–6]. One of
the unique advantages of the FBG sensors is that the FBG is directly inscribed into a
conventional optical fiber. As such, the interface between the sensing element (i.e. the FBG
section) and the optical fiber for signal transmission is seamless. Incorporating FBG
sensors in an optical fiber therefore does not require labor intensive integration and does
not compromise the mechanical strength or compactness of the optical fiber. In addition,
the physical measurands are extracted from the spectral parameter of the FBG, which
renders the measurements more reliable, more robust, and more sensitive to minute
changes. An added advantage of this wavelength encoded sensing mechanism is that the
sensor is self-referencing and can provide absolute measurements. Maybe one of the most
attractive features of the FBG sensors is their capability to be multiplexed in the wavelength
domain. Since the reflectance spectrum of an FBG has a very narrow bandwidth of a
fraction of nanometers, multiple FBG sensors can be implemented in a single strand of
optical fiber based on the principle of wavelength division multiplexing. This unique feature
enables deploying a large number of sensors without incurring substantial cost or weight
penalties.

2
Challenges
One of the long standing challenges of the FBG based sensors is their cross-
sensitivity to strain and temperature [7,8]. Strain is one of the most important physical
parameters that can reveal a structure’s loading, boundary, fatigue, and material
conditions. Strain measurement, therefore, is an indispensable capability for any SHM
system. When bonded on a structure, an FBG sensor is expected to experience the same
strain as the host structure. Since the Bragging wavelength, λB, is related to the effective
refractive index (R.I.) of the core mode neff and the fiber grating period Λ as:
effB n2 . (1-1)
The sensitivity of the Bragging wavelength λB to the applied strain ε can be derived by
taking the total derivative of equation 1-1 with respect to the applied strain ε, i.e.
2 2 1 , (1-2)
in which represents the photo-elastic constant of the optical fiber. The strain sensitivity
for a typical FBG strain sensor is 1.2 pm με-1 [9] which means 1000 με will shift the Bragging
wavelength by 1.2 nm. Unfortunately, temperature variations have similar effects on the
Bragging wavelength. The temperature sensitivity of the Bragging wavelength λB can be
derived following the same procedure, which results in
2 2 , (1-3)
where is the thermo-optical constant of the fiber and is the thermal expansion
coefficient of the fiber material. The temperature induced FBG wavelength shift is typically
13 pm °C-1, i.e. every 1 °C change in temperature will cause the Bragg wavelength λB to
shift by 13 pm [9]. Without any temperature compensation, a 5 °C temperature changes
would then result in a misreading of the applied strain by 55 με. Due to this cross-sensitivity

3
to strain and temperature, it is critical to differentiate the effects of strain and temperature
on the FBG wavelength shifts.
Current Research Efforts and Limitations
Many techniques have been developed to address the cross-sensitivity limitation
of the FBG sensors [5]. The most common approach is to implement two FBG sensors with
one bonded on the structure and the other being free standing[10]. Because the free
standing FBG sensor is not subjected to strain, it can be used for temperature sensing
solely. The strain experienced by the bonded FBG sensor can then be inferred from the
wavelength shift once the temperature is known. Ensuring the free-standing FBG sensor
to satisfy the strain-free condition, however, requires special packaging techniques [10].
Other researchers addressed the FBG cross-sensitivity problem by combining one FBG
sensor with a sensor of different types, such as an extrinsic Fabry-Perot interferometer
[11], a long period fiber grating [12,13], an etched FBG [14] etc. Adding the reference
sensor, in general, increases the sensor length and thus reduces the spatial resolution. In
addition, the sensor pair has to be placed in close vicinity to minimize the errors introduced
by the strain and temperature gradients. Combining FBGs with specially doped fibers has
also been studied to differentiate the temperature and strain effects [15,16]. Specialty
fibers, on the other hand, are much more expensive than conventional fibers and thus could
increase the system costs substantially. Besides, the specialty fibers have to be spliced
with conventional communication fibers, which may not be a trivial task.
Techniques using one single FBG sensor for temperature-compensated strain
measurement have also been investigated. One common scheme is to package the FBG
sensors on specially designed structures that introduce uneven deformation of the FBG
sensors when the ambient temperature changes. Structures such as a cantilever beam

4
[17], a polymer taper [18], a bilateral cantilever beam [19] etc. have been studied. The
disadvantage of such methods is that the packaging makes the FBG sensor quite bulky,
which offsets the compact and light weight features of the optical fiber sensors. Recently,
superstructured FBGs have been exploited to minimize the strain-temperature cross-
sensitivity of the FBG sensors [8,20,21]. A superstructured FBG is essentially the
superposition of an FBG and a long period grating induced by micro-bending. The
superstructure (i.e. the long period grating) generates additional spectral peaks (i.e. side
bands) in the reflectance spectrum of the FBG sensor. The reflectivity of the side bands
increases with strain but reduces with temperature. Combining the side band reflectivity
with the FBG wavelength shift therefore enables simultaneous measurement of strain and
temperature. A major disadvantage of this approach is that the wavelength allocation of
each FBG sensor has to be increased due to the side bands introduced by the
superstructure. As a result, the number of FBG sensors that can be accommodated within
a given wavelength band has to be reduced.
Compared to the Bragg wavelength, the bandwidth of the FBG reflectance
spectrum has received very little attention as a measurement parameter for FBG sensor
interrogation. Even though researchers have long observed that embedding FBGs in
composite materials may broaden the FBG spectrum and this effect is temperature
dependent [4,22], this phenomenon is considered as a limitation of the FBG sensors that
need to be minimized instead of exploiting it for sensing purpose. One exception is the
temperature compensated strain sensor presented by [23]. By embedding an FBG sensor
in epoxy and sandwiching it with composite laminates, they attempted using the FBG
bandwidth to compensate for temperature. However, they only obtained consistent
temperature sensitivity using Apodized FBGs. In addition, the measurement errors are
around 900 με. Considering that the strain and temperature sensitivity of a typical FBG is

5
1.2 pm με-1 and 13 pm °C-1 respectively [9], a measurement error of 900 με is equivalent
to a temperature variation of 83 °C, which is substantially higher than the temperature
fluctuation a structural component normally experiences. Besides embedding the FBG
sensor in composites, the bandwidth of an FBG sensor can also be broadened by
subjecting the FBG sensor to non-uniform displacements, such as bonding it to a beam
structure [21,24] or embedding it in composite laminates [25]. These sensors, however,
are rather bulky and thus are only suitable for temperature-compensated displacement
measurement. Chirped FBGs, which has a broader bandwidth as compared to uniform
FBGs, were studied for temperature-independent strain sensing [26,27]. In both work, the
broadening of the FBG reflectance spectrum was measured as the power of the light
reflected by the chirped FBG. As such, only the strain information can be inferred from the
power measurement.
Proposed Technique
Addressing the long-standing limitation of FBG sensors (i.e. their cross-sensitivity
to strain and temperature): Almost all of the FBG sensors developed so far rely on one
spectral parameter, i.e. the Bragging wavelength, to deduce the sensing parameter. Since
the Bragging wavelength is sensitive to both strain and temperature changes, decoupling
the effects of strain and temperature on the Bragging wavelength has been an active
research in the past couple of decades. Despite of the intensity researches carried out in
the past, simultaneous strain and temperature measurement using a single FBG has not
been achieved. We believe this research is the first attempt in introducing the spectral
bandwidth of the FBG as a spectral parameter in addition to the Bragg wavelength.

6
Thesis Objective
The objective of this research is to demonstrate simultaneous strain and
temperature measurement using a single Fiber Bragg Grating (FBG) sensor. The research
hypothesis is that the bandwidth of an FBG spectrum can be modulated as a function of
temperature. This could be achieved through either of the three methods:
(1) An FBG can be designed so that its spectral bandwidth is related to the optical
absorption of the coating material. Adopting a thermochromic coating with a
temperature-dependent absorption, therefore, will cause the FBG spectral bandwidth
to change with temperature.
(2) The presence of externally induced birefringence in an FBG can also modulate
bandwidth. Embedding an FBG into a composite laminates distorts the orthogonal
symmetry of the fiber and polarizes the light, which in turn, splits the unique Bragg
condition and introduces thermal dependent bandwidth change.
(3) When an FBG is exposed to an un-even thermal residual stress, bandwidth of the FBG
spectrum broadens which in turn is a function of temperature change.
The proposed sensor is based on modulating both the spectral parameters of an FBG
spectrum, i.e. Bragg wavelength and bandwidth. By combining the shift in Bragg
wavelength of the FBG spectrum along with the change in its bandwidth we should be able
to measure temperature and strain at the same time and thus solve the problem of cross
sensitivity associated with them.

7
Chapter 3
Background
Fiber structure and Physics
Optical fiber is a circular wave-guide that is used to transport signal in the form of
light. As shown in figure 2-1, it consists of two concentric cylinders. The inner cylindrical
region is called core and it has slightly higher index of refraction. The outer region is called
cladding and its index of refraction is slightly lower (by ≈ 1%) than the core. In general,
optical fibers are made of silica in which index-modifying dopants, such as GeO2, are
added. A protective coating of acrylate is provided at the top of the cladding region, as
shown in figure 2-1, to reduce signal loss that occurs when fibers are pressed against rough
surfaces. For environmental protection, fibers are incorporated into cables by providing a
polyethylene sheath that encases the fiber within a strength member such as steel or
Kevlar strands.
Since the core has a higher index (n1) of refraction than the cladding (n2), light can
be guided in the core following Snell’s law. A typical ray diagram of light propagation in the
optical fiber is shown in the figure 2-2. Before light enters the fiber, it goes under refraction
Figure 3-1 Cross section view of optical fiber and single fiber cable [48].

8
at the interface between fiber and external medium (let’s say air, n0). This refracted ray
acts as an incident ray for the light travelling in the fiber and controls its angle of incidence.
In order to satisfy the criteria of total internal reflection (TIR) for the light travelling in the
fiber, the angle of incident ray (ϕ) should be greater than the critical angle. This angle can
be related to the angle of acceptance (θ1) using snell’s law and is shown by equation 2-1.
The angle of acceptance is simply defined as the maximum angle of incidence (θacc = max
θ1) at air-fiber interface that allows TIR of the light travelling in the fiber and the sine function
of the acceptance angle is referred to the numerical aperture (NA), shown in equation 2-2.
n sin n sin , (2-1)
n sin , (2-2)
where n0, n1 and n2 are the refraction indexes of air, fiber core and cladding, respectively.
In fiber, light travels in two different modes: radiation modes and guided modes. In
radiation modes, energy is coupled out of the core and is quickly dissipated. However
guided modes are confined to the core, and propagate along the fiber, transporting
information and power. For a large fiber core, many simultaneous guided modes can be
supported, each having its own distinct velocity and can be further decomposed into
orthogonal linearly polarized components.
Figure 3-2 Propagation of light in optical fiber [28].

9
Classification of Optical Fiber
Optical fiber is mainly classified on the basis of number of modes of the
propagating signal that a fiber can support, which in turn, depends on the numerical
aperture of the fiber, its core diameter and the wavelength of the guided wave. In general,
there are two types of optical fiber as follows:
1) Single-mode fiber (SMF) and
2) Multi-mode fiber (MMF).
Often normalized frequency parameter (also known as V-number), as shown in equation
2-3, is used to determine if the fiber is SMF or MMF. As long as the value of V-number is
less than 2.405, there would be a single mode travelling in the fiber and the fiber would be
characterized as SMF [28]. However, for a V-number greater than 2.405, fiber behaves as
a MMF.
, (2-3)
where is the wavelength of guided wavelength and ‘a’ is the core radius.
Single-mode fiber (SMF):
An optical fiber having the V-number less than 2.405 is called SMF. It restrict the
transmission signal only to a single mode. The typical core diameter of SMF fiber lies
between 8-10 µm and cladding diameter is 125 μm. Fiber, in its simplest form, has a step
index profile with an abrupt boundary separating a high index core and a lower index
cladding. For most of the fiber, the refractive index differential is 0.36% and is well under
1% in other standard types. Figure 2-3 shows the cross section of two principle types of
step index SMF made from fused silica. The simplest design is the matched-cladding fiber
shown in figure 2-3(a). An alternate design is the depressed cladding fiber shown in the
figure 2-3(b).

10
Multi-mode fiber (MMF):
A multimode fiber can support the propagation of a number of modes (rays) as
long as V-number is greater than 2.405. These fibers are characterized by a large core
diameter (50 or 62.5 microns). The MMF can either have a step index profile with an abrupt
boundary separating a high index core and a lower index cladding or can have a graded
index fiber, as shown in figure 2-4. In the graded-index fiber the refractive index changes
Figure 3-4 Two types of MMF; (a) Step index and (b) Gradient index.
na) Step index
b) Gradient index n
Figure 3-3 Two types of step index SMF; (a) Matched cladding fiber and (b) Depressed
cladding fiber.

11
progressively from the core to the cladding. The refractive index of the core is the highest
in the center of the core and gradually decreases approaching the core-cladding interface.
Bragg Grating
FBG is a longitudinal periodic or semi-periodic variation of the index of refraction
in the core of an optical fiber [29]. These types of uniform fiber gratings, where the phase
fronts are perpendicular to the fiber longitudinal axis and the grating planes are of a
constant period (figure 2-5), are considered the fundamental building blocks for most Bragg
grating structures. Light guided along the core of an optical fiber will be scattered by each
grating plane. If the Bragg condition is not satisfied, the reflected light from each of the
subsequent planes becomes progressively out of phase and will eventually cancel out.
Where the Bragg condition is satisfied, the contributions of reflected light from each grating
plane add constructively in the backward direction to form a back-reflected peak with a
center wavelength defined by the grating parameters. The Bragg grating condition is simply
the requirement that satisfies both energy and momentum conservation. Energy
Figure 3-5 Schematic of fiber Bragg grating with uniform index-modulation, amplitude and
period [29].

12
conservation requires that the frequency of the incident radiation and the reflected radiation
is the same. Momentum conservation requires that the incident wave vector, ki, plus the
grating wave vector, K, equal the wave vector of the scattered radiation kf, this is simply
stated as:
, (2-4)
where the grating wave vector, K, has a direction normal to the grating planes and it has a
magnitude 2Π/Λ, (Λ is the grating spacing shown in figure 2-5). The diffracted wave vector
is equal in magnitude but opposite in direction to the incident wave vector. Hence, the
momentum conservation condition becomes,
2
, (2-5)
which simplifies to the first-order Bragg condition
2 Λ , (2-6)
where the Bragg grating wavelength, λB , is the free-space center wavelength of the input
light that will be back reflected from the Bragg grating, and n is the effective refractive index
of the fiber core at the free-space-center wavelength.
Types of Fiber Bragg Gratings
There are several distinct types of fiber Bragg grating structures such as the
common Bragg reflector, the blazed Bragg grating, and the chirped Bragg grating [29].
These fiber Bragg gratings are distinguished either by their grating pitch (spacing between
grating planes) or tilt (angle between grating planes and fiber axis). The most common fiber
Bragg grating is the Bragg reflector, which has a constant pitch. The blazed grating has
phase fronts tilted with respect to the fiber axis, that is, the angle between the grating
planes and the fiber axis is less than 90°. The chirped grating has an aperiodic pitch, that
is, a monotonic increase in the spacing between grating planes.

13
Common Bragg Grating
The common Bragg grating is the simplest and most used fiber Bragg grating as
shown in the figures 2-5. Depending on the parameters such as grating length and
magnitude of induced index change, the Bragg reflector can function as a narrow-band
transmission or reflection filter or a broadband mirror. In combination with other Bragg
reflectors, these devices can be arranged to function as bandpass filters.
Blazed Bragg Grating
Tilting (or blazing) the Bragg grating planes at angles to the fiber axis (figure 2-6)
will result in light that is otherwise guided in the fiber, to be coupled out of the fiber core
into loosely bound guided cladding modes or into radiation modes outside the fiber. The tilt
of the grating planes and strength of the index modulation determines the coupling
efficiency and bandwidth of the light that is tapped out.
Chirped Bragg Grating
A chirped Bragg grating is a grating that has a monotonically varying grating
period, figure 2-7. This can be realized by axially varying either the period of the grating
or the index of refraction of the core or both.
Figure 3-6 Schematic of light coupling between core and cladding of a blazed fiber Bragg
grating [29].

14
Apodized Bragg Grating
When the profile of the index modulation along the fiber length is given a bell-like
functional shape, it is called Apodized Bragg grating and is shown in figure 2-8. It is
important in the applications to lower or eliminated the reflectivity of the side-lobes and to
get sharp spectral responses.
Figure 3-7 Schematic diagram of a chirped grating with a non-periodic pitch [29].
Figure 3-8 Apodized Bragg grating (source: Internet).

15
Chapter 4
Principle of Operation
An FBG spectrum is characterized by two important parameters, i.e. Bragg
wavelength and bandwidth. Bragg wavelength is very popular and has been continuously
exploited by the researchers to determine the physical quantities. However, the bandwidth
of the FBG reflectance spectrum has received very little attention as a measurement
parameter for FBG sensor interrogation. Even though researchers have long observed that
embedding FBGs in composite materials may broaden the FBG spectrum and this effect
is temperature dependent [4,22], this phenomenon is considered as a limitation of the FBG
sensors that need to be minimized instead of exploiting it for sensing purpose. However,
our research approach is focused on exploiting all those means to modulate the bandwidth
of the reflected FBG spectrum and combine it with Bragg wavelength shift to measure
simultaneous change in temperature and strain. Based on the previous research
[22,30,31], we know that there are three different ways one can introduce bandwidth
change in the FBG spectrum:
(1) Optical absorption of the light interacting with a material of changing
absorptivity;
(2) Externally induced variable birefringence;
(3) Due to un-even thermal residual stress.
Among these three approaches of the bandwidth modulation, we adopted the
method of optical absorption for the development of our sensor. The other two methods
are presented in detail in chapter 6. The proposed optical fiber sensor is shown in figure 3-
1. The sensor is an FBG coated with a thermochromic material (figure 3-1(a)). The purpose
of the thermochromic coating is to introduce the temperature dependent absorption of the

16
guided modes supported by the optical fiber, which in turn causes the spectral bandwidth
of the FBG to vary with temperature [30]. To improve the interaction between the guided
modes and the thermochromic coating the mode profile of the core mode is expanded, as
shown in figure 3-1(b). As such, the evanescent field of the core mode can interact with
the thermochromic coating. Combining the spectral bandwidth with the FBG wavelength
shift will enable us to extract the strain and temperature information simultaneously using
a single FBG.
Figure 4-1 Schematic of the proposed strain - temperature sensor; a) configuration of the
sensor; b) an FBG with an enlarged core mode.
ThermochromicCoating
FBG
Light source
Fiber cladding
Fiber core
a)

17
Effect of coating absorption on FBG spectrum
The effect of the coating material on the bandwidth of the FBG resonances was
studied by [30]. Several strong Bragg gratings were written in different fibers that exhibit
the coupling of the forward propagating LP01 core mode to the backward propagating
cladding modes. The cladding mode attenuation was easily achieved by depositing a thin
lossy layer on the cladding surface. As shown in figure 3-2, the bandwidth of the core-
cladding coupling resonance increased steadily with the optical absorption of the coating
material. Correspondingly, the transmission losses also increased with the bandwidth
broadening but the spectral location of the resonances remained the same. In our case,
the resonant bandwidth will be controlled by the absorption of the thermochromic material.
As long as the optical absorption of the thermochromic material is monotonously related to
the temperature variations, we should be able to extract the temperature information from
the resonant bandwidth changes.
Figure 4-2 Spectral bandwidth increase of a cladding mode resonance as the absorption
of the coating material increases [30].

18
Thermochromic materials for optical absorption
A thermochromic material changes its spectral absorbance with temperature
variations [32]. The most common thermochromic materials include luco dyes, liquid
crystals, and metal oxides. Recently, thermochromic materials that can operate at the near-
infrared (NIR) wavelengths have been under intensive researches due to their potential to
achieve energy efficient windows that can reflect more infrared solar energy as
temperature rises [33,34]. Vanadium dioxide (VO2) is one of the most widely researched
thermochromic materials studied for this purpose [32,35]. As shown in figure 3-3, the
transmission of a pure VO2 film reduces steadily with temperature for wavelengths above
1000 nm. At 1550 nm, the transmission decreased from around 65% to around 40% as the
temperature was increased from 30 °C to 90 °C. The transmission spectrum can be tuned
in a large range by changing the particle size and/or by adding a layer of titanium oxide
(TiO2) on the nanoparticles [35]. Taking these advantages into account, VO2 can also be
used as thermochromic.
Figure 4-3 Temperature-dependent transmission spectrum of a pure vanadium dioxide
(VO2) film [35].

19
One thermochromic material that has been studied for optical fiber temperature
sensors is lophine [36–38]. As shown in figure 3-4(a), lophine has a relatively constant
absorption over a wide wavelength range under a given temperature. The absorption, on
the other hand, decreases steadily with temperature increases. At 1310 and 1550 nm, the
decrease of the absorption with temperature is pretty linear, as shown in figure 3-4(b). For
about 80 °C of temperature change, the absorption of lophine decreased by about 75%
(0.4 vs. 1.5). This rate of change is much higher than the sensitivity of the R.I. or the thermal
expansion of the fiber, which is in the order of 10-5/°C [9]. Both melted lophine [37] and
lophine powder mixed with an epoxy resin [39] were used for fabricating the optical fiber
temperature sensors. The lophine based optical fiber temperature sensors, however, have
very different configurations from the proposed strain and temperature sensors. Lophine
was either directly deposited on a tapered optic fiber [37] or was coated at the distal end
of the fiber [36,38,39]. Even though lophine was combined with an FBG for simultaneous
strain and temperature [36], it was deposited at the distal end of the fiber instead of
functioning as a coating material for the FBG. In addition, all of the aforementioned
temperature sensors infer the temperature information directly from the light intensity
Figure 4-4 Absorbance of Lophine as a function of temperature (a) from 350 nm to 1550
nm and (b) at 1310 and 1550 nm [38].

20
instead of the spectral bandwidth. Since the light intensity can be easily influenced by the
laser power fluctuation and fiber bending losses, intensity based sensing is less reliable
and less precise than the sensing mechanisms based on the spectral parameters. To the
best of our knowledge, coating an FBG with a thermochromic material for simultaneous
strain and temperature measurements has not been reported in the past. In our research,
we have used Lophine (2,4,5-Triphenylimidazole) as the thermochromic coating for the
bandwidth modulation of the proposed sensor.

21
Chapter 5
Sensor Fabrication
Grating inscription
FBGs were inscribed in a step index single-mode photosensitive fiber (corning, NA
= 0.28) using scanning beam technique [40], as shown in figure 4-1. The fabrication
process included a 193 nm excimer laser (Bragg Star Industrial-LN 1000 FT) and a phase
mask (1071.5 nm). The grating was written at a uniform scanning speed of 0.37 mm/sec
while the laser power was controlled at 5 mJ with a repetition of 800 Hz. The phase mask
was set at 0 degree tilt angle for straight FBG whereas 4 degree angle was set for Tilted
FBG (TFBG) and the grating was written in the length of 6.35 mm (0.25 inch). The entire
grating was fabricated by a different lab in collaboration with our project.
Coating Process
The proposed sensor design consists of a coating of a thermochromic material
developed around grating region of the SMF. In our experiments, we have selected 2,4,5-
triphenylimidazole (Lophine) as a transducing element for the sensor. Apart from its
thermochromic property, Lophine is a nontoxic hydrophobic material (immune to water
molecules) with the melting point at 275–277 °C and is also available at a low cost. In
subsequent experiments, we have also used two different non-thermochromic coating
materials (Solder paste and NOA-61 epoxy) for validating the results obtained from
Lophine coating. The individual coating processes are explained below.
Figure 5-1. Inscribing Bragg gratings in the core of a photosensitive fiber [40].

22
Lophine:
The commercial Lophine comes in the powder form which needs proper adhesive
to be used for coating. In our initial approaches we used different solvents and epoxies,
such as THF, PVC, NOA-61, NOA-81 etc., to mix Lophine and apply uniformly over FBGs
but all the efforts were failed. The major challenge was that the Lophine appeared to
change the curing property of the epoxy and was also very little soluble in the solvents
used. This motivated us to fuse the Lophine and use its molten form for coating. A similar
method was also adopted by [37].
Although it is a challenging task to work with Lophine, especially when it has
negligible wettability for glass fiber but having a low melting point of 275–277 °C, it enables
us to coat, un-coat and re-coat the FBGs so that the repeatability of the sensor response
can be evaluated. In addition, it is very easy to machine the sample and control the height
of the coating. In order to coat the FBG sensors with molten Lophine and to control the
coating thickness, a mold was designed. As shown in figure 4-2(a), the mold consists of a
base plate and two vertical plates. The distance between the two vertical plates was
controlled by inserting spacers with the desired thickness. Once the mold was adjusted
properly, an optical fiber was placed at equal distances from the vertical plates with the
help of a microscope and taped in position using high temperature tapes. To melt the
Lophine, a beaker was heated up to 475 °C using a hot plate and Lophine powder was
added slowly to the heated beaker (see figure 4-2(b)). Once sufficient molten Lophine was
obtained, the molten Lophine was poured carefully into the space between the two vertical
plates of the mold. As it cools down, the molten Lophine formed a recrystallized Lophine
block with the FBG encapsulated inside, as shown in figure 4-2(c). The Lophine block
removed from the mold is shown in Figure 4-2(d), which has rough edges and the optical

23
fiber is not centered. To smoothen the edge and produce a Lophine block with the optical
fiber in the center, the edges of the block were brought in contact with a heated metal plate
to remove any excessive Lophine (see figure 4-2(e)). As shown in figure 4-2(f), the FBG
sensor is located at the center of a Lophine block with a uniform thickness of 1.5 mm, a
height of 3.46 mm, and a length of 46 mm.
Figure 5-2. Coating Fiber Bragg Grating with recrystallized Lophine: (a) mold for
thickness control; (b) melt Lophine in a beaker using a hot plate; (c) recrystallize
Lophine in the mold; (d) recrystallized Lophine block with FBG encapsulated inside; (e)
reduce the height of the recrystallized Lophine block using a heated plate; (f) final
Lophine – coated FBG sample.

24
Solder Paste:
One of the non-thermochromic coating materials used to validate the result was a
solder paste. It was coated at the top of FBG sensor using a soldering gun shown in the
figure 4-3(a). A glass slide was used as a base and the FBG was mounted at a distance of
1 mm from it. The solder paste was applied uniformly around the grating length of the SMF
and the soldering gun was moved at its top, with uniform speed, while its temperature was
maintained at 310°C. Once the paste was melted and then solidified, it was left to cool.
The coated block of solder paste is shown in figure 4-3(b).
NOA-61:
NOA-61 is a UV curable optical epoxy and does not contain any thermochromic
property. To apply its coating on FBG, a glass slide was first covered with a layer of Kapton
tape after which fiber was mounted at a height of 1 mm form the base. Then a layer of
NOA-61 epoxy was applied along the length of FBG which was then cured with UV
radiation for 1 hour (4 watt). The coating thus developed is shown in the figure 4-4.
Figure 5-3. a) Solder gun used for coating process; b) FBG sensor coated with solder
paste.
Figure 5-4. FBG sensor coated with NOA-61 epoxy.

25
Chapter 6
Characterization of FBG sensor
Experimental Set-up
The response of the FBG sensors were recorded with the help of experimental set-
up shown in the figure 5-1. The reflectance spectra of the FBG, before and after the coating,
were measured using an OSA with a resolution of 0.2 nm. The output of the OSA light
source, i.e. an edge-emitting LED (EELED), was routed to the FBG sensor through a 50:50
single mode optical fiber coupler so that a portion of the light reflected by the FBG sensor
can be routed to the input of the OSA. An Excel Visual Basic (VB) Program was developed
to record the reflected spectrum from the OSA. The FBG spectra reflected by a Lophine
coated FBG is compared with that of a bare FBG in figure 5-2. The bare FBG produced a
typical reflectance spectrum with a sharp peak while the coated FBG produced a
reflectance spectrum with a much broader peak. In addition, the spectrum produced by the
Lophine-coated FBG also shifted to a shorter wavelength. In order to quantify these
observed changes, a MATLAB program was developed to extract two spectral parameters,
i.e. the central Bragg wavelength and bandwidth, from the measured reflectance spectra.
Two wavelengths, i.e. the low cut-off and high cut-off wavelengths, were determined as the
wavelengths at which the intensity of the spectrum is 8 dB below the peak intensity. The
central Bragg wavelength is then calculated as the average of these two wavelengths while
Figure 6-1 Experimental setup for measuring the reflectance spectrum of FBG sensor.

26
the bandwidth is calculated as the difference between these wavelengths and are shown
in equation 5-1 and 5-2 respectively. For the bare FBG sensor, the central Bragg
wavelength was found to be 1550.255 nm and the bandwidth is 0.447 nm. In contrast, the
Lophine-coated FBG has a central wavelength of 1549.567 nm and a bandwidth of 1.561
nm. The shift of the central wavelength toward a shorter wavelength indicated that the
coating compresses the FBG. The broadening of the reflectance spectrum is likely due to
the non-uniformity of the compressive residual stress introduced by the Lophine coating.
,lhB (5-1)
,lhBW (5-2)
where λB is central Bragg Wavelength, λh is high cut-off wavelength, λl is Low cut-off
wavelength and BW is Bandwidth.
Thermo-Mechanical Testing
The Lophine-coated FBG sensor were tested under simultaneous thermal and
mechanical loadings inside a temperature-controllable incubator, as shown in figure 5-3.
The optical fiber was hung vertically by gluing its top portion on a flat fixture. The lower
Figure 6-2 Reflectance spectra of the FBG before and after Lophine coating.
-75
-70
-65
-60
-55
-50
-45
-40
1548 1549 1550 1551 1552
Inte
nsit
y (d
Bm
)
Wavelength (nm)
Coated FBG Bare FBG
L
BW
hl

27
portion of the optical fiber was reinforced with another flat plate so small weights can be
hung. The weight was increased from 0 to 80 gm in an increment of 20 gm. Therefore, the
axial load experienced by the FBG sensor is the hanging weight plus the weight of the
lower flat plate, which is 15.6 gm. Under each weight, the temperature of the incubator was
heated from 30 to 60°C in an increment of 5°C. The reflectance spectrum of the FBG
sensor was acquired and stored for each weight and temperature combination. The
responses of the FBG spectra to the temperature changes, under various different weights,
is shown in figure 5-4. For all the cases, the reflectance spectrum shifted to the right while
the peak narrowed as temperature was increased.
Figure 6-3 Experimental set-up for thermal-mechanical testing of Lophine-coated FBG
sensor.

28
Result
The behavior of spectral parameters are presented against different thermo-
mechanical loadings in figure 5-5 and figure 5-6. In figure 5-5, the central Bragg
wavelengths and the bandwidths extracted from the reflectance spectra under constant
temperatures are plotted versus the axial load. Both the central wavelength (figure 5-5(a))
and the bandwidth (figure 5-5(b)) appear to be linearly proportional to the temperature as
well as the axial load. Figure 5-6 shows the central Bragg wavelengths and the bandwidths
extracted from the reflectance spectra versus temperature under constant loads. As shown
in figure 5-6(a), the central Bragg wavelength increased linearly with increasing
Figure 6-4 Change of FBG spectrum with temperature under two different loads; (a) 0gm;
(b) 20gm; (c) 40gm; (d) 60gm; (e) 80gm.

29
temperature for all loads. The wavelength- temperature curve under different loads are
parallel to each other, indicating that the temperature sensitivity, measured as the slope of
the wavelength-temperature curve, are similar for all loads. In other words, the applied load
seems to affect the intersection of wavelength-temperature curve but not its slope. The
bandwidth (figure 5-6(b)) , on the other hand, decreased with increasing temperature but
neither the slope nor the intersection of the bandwidth-temperature curve is drastically
affected by the applied load.
Figure 6-5 The shift in (a) central Bragg wavelength and (b) bandwidth with the applied
weight under different temperatures
Figure 6-6 The shift in (a) central Bragg wavelength and (b) bandwidth with change in
temperature under different weight.

30
Data Processing
Since both the central wavelength and the bandwidth are the linear functions of
temperature (T) as well as axial load (W). Therefore, they can be curve fitted using linear
functions, i.e.
559.100073.001591.0),( WTWTBW , (5-3)
155001263.001619.0),( WTWTB , (5-4)
where T is the temperature, W is the axial load, BW is the measured bandwidth, and λB is
the measured Bragg wavelength. The coefficients of linear equations were found using a
Figure 6-7 Curve fitting for the change in (a) bandwidth and (b) central Bragg wavelength
under simultaneous load and temperature varriations.

31
curve fitting tool available in MATLAB and is shown in figure 5-7. Figure 5-7(a) shows
distribution of bandwidth around the fitted curve for temperature and load variations. The
result of bandwidth-fit is presented in equation 5-3. A similar approach is adopted to find
the fitting-curve for Bragg wavelength and is as shown in figure 5-7 (b). The equation of
fitting curve, thus obtained, is presented in equation 5-4.
Error Estimation
Once equations 5-3 and 5-4 are established, the axial load and temperature
corresponding to each FBG spectrum can then be inversely determined from the measured
FBG bandwidth and Bragg wavelength as
gm
CBW
W
T
B 1550
559.1
0.012630.01619
0.000730.01591- 1
. (5-5)
The differences between the axial load and temperature determined using
equation 5-5 and their actual values are presented in figure 5-8. For temperature, the
measurement errors are larger at lower temperatures, which are within 4 oC, but the
errors reduced to around 2 oC for higher temperatures. On the other hand, the
measurement errors for the axial load appear to be independent of the applied load. Except
one outlier that produced an error of -9.7 gm, the measurement errors of the axial load are
within 4 gm. Assume the strain sensitivity of a standard FBG is 1.2 pm/με [9] and the
measured load sensitivity of 13.4 pm/gm from our experiment, we estimated that 1 gm of
axial load is equivalent to 11.2 με. Therefore, the corresponding strain errors are within
44.8 με.
The thermal and mechanical responses of the bare FBG was tested before the
coating process and after the Lophine coating was removed. We found that the FBG

32
responses were repeatable after multiple coating and un-coating processes, which
indicated that the molten Lophine does not cause any irreversible effect on the FBG.
Figure 6-8 Differences between the measurements and the actual values: (a)
temperature; (b) applied weight.
25 30 35 40 45 50 55 60 65-4
-2
0
2
4
Temperature (C)
Mea
sure
men
t E
rro
rs (C
)
(a)
0 20 40 60 80-10
-8
-6
-4
-2
0
2
4
Weight (gm)
Mea
sure
men
t E
rro
rs (
gm
)
Outlier
(b)

33
Chapter 7
Discussion
The response of coated FBG sensor is promising as it is capable of measuring
simultaneous strain and temperature with a high accuracy. The proposed sensor can
measure temperature and strain within the error of 4 °C and 44.8 με respectively. Our initial
research approach was to introduce bandwidth modulation with the help of a
thermochromic coating. However, bandwidth can also be modulated by introducing
birefringence or thermal residual stress in the FBG as mentioned by other authors
[22,41,42,31]. Now, it becomes essential to investigate the real contributor in bandwidth
modulation of our sensor and thus roles of thermochromic coating, Birefringence, and
thermal residual stress have been further studied. To validate our principle stand
(thermochromic), a Tilted FBG is used whereas the presence of birefringence can be tested
by normal FBG sensors.
Thermochromic Effect (TFBG)
Principle of operation
The FBG of proposed sensor is replaced with Tilted FBG (TFBG), also known as
blazed FBG. The purpose of TFBG is to have a better interaction between the guided
modes and the thermochromic coating by promoting the LP01 to LP11 mode coupling. As
shown in figure 6-1, the mode field of the core mode, typically confined within the fiber core,
can be expanded to distribute more optical power into the fiber cladding. As such, the
evanescent field of the core mode can interact with the thermochromic coating. Due to the
interaction between the enlarged core mode or the LP11 cladding mode with the fiber

34
coating, the spectral bandwidth of the FBG resonance will be influenced by the optical
absorbance of the coating material. Coating the TFBG with a thermochromic material,
therefore, will produce temperature dependent bandwidth changes which have higher
sensitivity than normal FBG coated with thermochromic material.
It is well established that an FBG will not only introduce the core to core mode
coupling (i.e. the LP01- LP01 coupling) but also the core to cladding mode coupling (i.e. the
LP01- LPnl coupling) [43]. In general, the symmetrical LP01 core mode will only couple to the
symmetric LP01 cladding modes. The coupling from the LP01 core mode to the asymmetric
LP11 cladding mode can be achieved by titling the FBG [44]. As shown in figure 6-2, the
Figure 7-1 Schematic of a tilted FBG sensor that promotes LP01-LP11 mode coupling and
is coated with the thermochromic material.
ThermochromicCoating
TFBG
LP01
Core mode
LP11
Cladding mode
Figure 7-2 Transmission spectrum of a tilted FBG with the LP01 and LP11 resonances
shown and the shorter wavelength cladding modes suppressed [45].

35
transmission spectrum of a typical tilted FBG has two distinct transmission valleys (i.e.
resonances) with the LP01 resonance corresponds to the LP01-LP01 mode coupling and the
LP11 resonance as a result of the LP01-LP11 coupling. The other cladding modes were
suppressed by using the cladding depressed fibers [45]. The relative coupling strengths of
the LP01-LP01 and LP01-LP11 mode couplings are functions of the tilt angle, as plotted in
figure 6-3(a). At a tilt angle slightly larger than 6°, the LP01-LP01 coupling is minimal while
the LP01-LP11 coupling remains relatively strong. The complete suppression of the LP01
resonance in the transmission spectrum of the FBG with a tilt angle of 6.1° is demonstrated
in figure 6-3(b). By eliminating the LP01 resonance from the FBG transmission spectrum,
the TFBG only displayed a single resonance corresponding to the LP01-LP11 coupling.
Since the LP11 mode will have better interaction than LP01 mode with the thermochromic
coating, the bandwidth of the LP11, transmission resonance, will be affected differently than
the bandwidth of the LP01, reflection resonance, for temperature variation only. Therefore,
by comparing the thermal dependent bandwidth of core mode (LP01) and cladding mode
(LP11) resonance, we can verify the effect of thermochromic material.
Figure 7-3 Controlling the mode couplings through the tilt angle; (a) coupling strengths of
the LP01-LP01 and LP01-LP11 mode coupling as a function of the FBG tilt angle; b)
suppression of the LP01-LP01 resonance in the transmission spectrum using an FBG with
a tilt angle of 6.1° [45].

36
Thermal response
The Lophine coated TFBG sensors were fabricated following the procedure
mentioned in chapter-4. The experimental set-up for the thermal response of the sensor is
presented in figure 6-4. It consists of a broadband light source guided into the core of a
SMF, a portion of which is reflected back after its encounter with the TFBG, and is routed
to the OSA through a coupler and an optical switch. The transmitted light signal was also
sent to the OSA via the same optical switch. The presence of an optical switch provides
the flexibility to toggle between the two spectral responses, i.e. reflected and transmitted
signal, recorded by the OSA . Sensor was placed in an airtight digital incubator for which
the temperature was varied from 30 °C to 60 °C in an interval of 5 °C. Both transmission
and reflection spectra of the sensor at each temperature were recorded, with the help of a
Visual Basic (VB) Program developed in Excel, and is shown in figure 6-5. The recorded
data is then interrogated in the same way as it was done for the normal FBG in chapter-5.
The behavior of the core mode in reflection and the cladding mode in transmission, not
only displayed similar spectral characteristics, i.e. Bragg wavelength and bandwidth, but
were also highly repeatable. We can clearly see a red shift in the Bragg wavelength with
increase in temperature while the bandwidth keeps on decreasing. Further, in order to
quantify the spectral parameters, and to have a better understanding of their behavior, the
Figure 7-4 Experimental set-up for thermal response of Lophine coated TFBG sensors.

37
data is processed in MATLAB at a distance of 10 dB from the peak of the reflected signal
for which the result is shown in figure 6-6. In figure 6-6(a), central Bragg wavelength of the
TFBG sensor, before and after coating, is shown at various temperature. The Bragg
wavelength of both the sensors, i.e. Lophine-coated TFBG and bare TFBG, increased
linearly with increasing temperature, however the sensitivity of the coated TFBG is found
to be nearly five times the bare TFBG sensors (sensitivity of coated TFBG = 51.1 pm/°C
and bare TFBG = 10.8 pm/°C). The bandwidth, on the other hand, decreased with increase
in temperature for the coated TFBG sensor having a sensitivity of -13.6 pm/°C whereas
Figure 7-5 Spectral shift of Lophine – coated TFBG sensor.
Figure 7-6 Shift in (a) central Bragg wavelength (b) bandwidth with temperature change.

38
the bare TFBG sensor maintain a constant bandwidth at all temperature values, and is
shown in figure 6-6(b).
The spectral characteristics of the coated TFBG sensor displayed the result similar
to what we have obtained earlier with the coated FBG sensors. With this result, it is difficult
to give credit to the thermochromic effect for the bandwidth modulation of the proposed
sensor. This motivated us to execute the following experiments:
1. Study the effect of coating thickness
2. Use non-thermochromic material as coating
a. NOA-61 epoxy
b. Solder paste
Study the effect of coating thickness
The effect of coating thickness on the bandwidth modulation of TFBG sensor was
studied for three different values, i.e. 0.5 mm, 1 mm and 3 mm. Thickness less than 0.5
mm could not be achieved due to fabrication issues. The fabrication process and
experimental set-up are the same as used in the previous experiments, and its result is
shown in figure 6-7. The sensitivity of bandwidth against temperature change for different
thickness is shown in figure 6-7. Irrespective of the coating thickness, we observed a linear
decrease in bandwidth with increase in temperature, and the result is highly repeatable.
However, as we move from smallest coating thickness to the largest one, two important
observation can be made. One, the sensitivity of the bandwidth kept on decreasing with its
values -32.3 pm/°C, -18.7 pm/°C and -13.6 pm/°C respectively, and two, the linearity region
for the sensor has increased to 60 °C, 65 °C, and 80 °C respectively for the coating
thickness of 0.5 mm, 1 mm and 3 mm.

39
Figure 7-7 Change in bandwidth with temperature for three different thickness of coating;
(a) 0.5 mm, (b) 1 mm and (c) 3 mm.

40
Use non-thermochromic material as coating
In addition to Lophine, the TFBG sensor was also coated with two different non-
thermochromic material, i.e. NOA-61 epoxy and solder paste, and their spectral responses
were examined. The coating process for both the materials are already explained in
chapter-4. The NOA-61 coated TFBG sensor is shown in figure 6-8(a), and its spectral
parameters are characterized for the temperature change in figure 6-9. In figure 6-9(a),
central Bragg wavelength is presented both for the core and the cladding mode.
Irrespective of the modes, identical results are obtained which varies linearly with changing
temperature, and their sensitivity is more than 2.5 times in comparison with the normal
TFBG sensors (27 pm/°C > 2.5*10.5 pm/°C). However, we could not achieve bandwidth
modulation by using this coating. As shown in the figure 6.9(b), bandwidth of the coated
TFBG sensor remained constant at all the temperature values for both the modes.
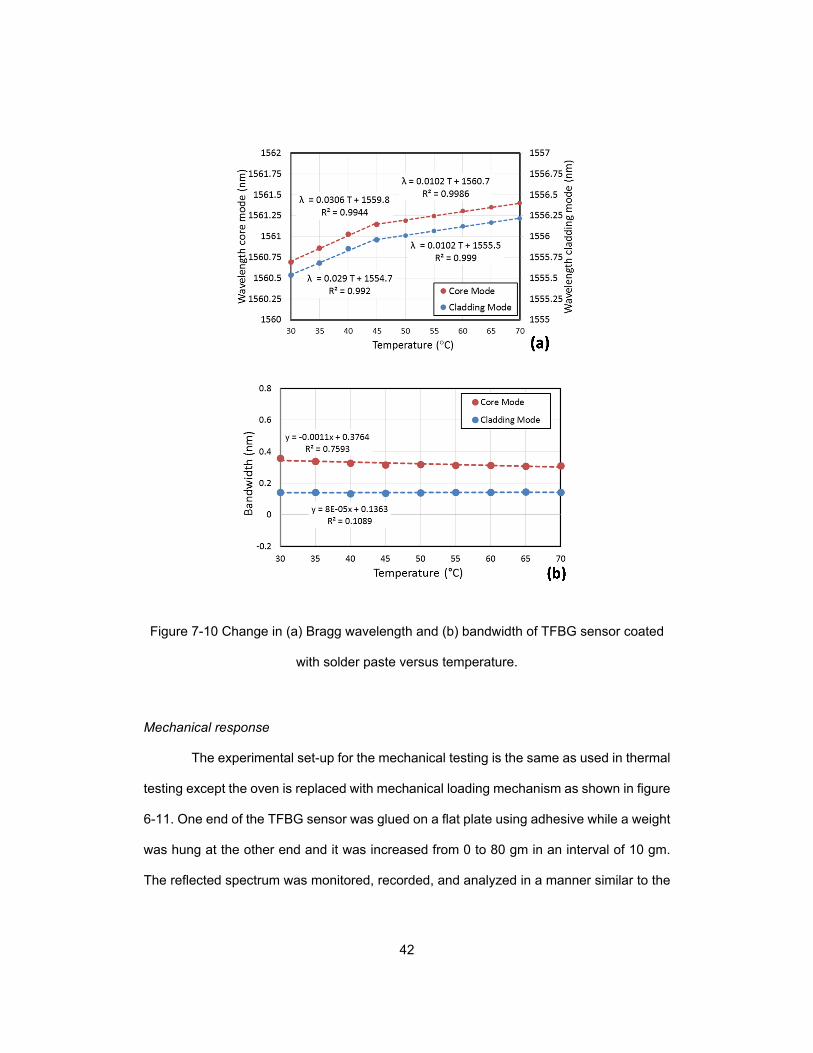
Solder paste is another non-thermochromic material, coated around TFBG sensor
(as shown in figure 6-8(b)), to characterize the modulation of bandwidth as well as Bragg
wavelength for which result is shown in figure 6-10. In figure 6-10(a), response of Bragg
wavelength is presented both for the core mode and the cladding mode, which can be well
divided in two linear regions having different sensitivity, i.e. before 45 °C and after 45 °C.
Figure 7-8 TFBG sensor coated with; (a) NOA-61 epoxy and (b) Solder paste

41
It is important to note that both the core and the cladding modes showed similar
characteristics. This trend was also continued to the bandwidth response against change
in temperature, and is shown in figure 6-10(b). Bandwidth, irrespective of the change in
temperature, remained constant throughout experiment and could not be modulated.
Two important observations can be made in this section which is:
1. Neither NOA-61 nor solder paste coating is capable of introducing bandwidth
modulation.
2. The thermochromic coating, Lophine, though is able to modulate bandwidth
which is consistent with the prediction but the thickness dependent sensitivity
of bandwidth suggest the involvement of some other factors.
Figure 7-9 Change in (a) Bragg wavelength and (b) bandwidth of NOA-61 coated TFBG
sensor versus temperature
42
Mechanical response
The experimental set-up for the mechanical testing is the same as used in thermal
testing except the oven is replaced with mechanical loading mechanism as shown in figure
6-11. One end of the TFBG sensor was glued on a flat plate using adhesive while a weight
was hung at the other end and it was increased from 0 to 80 gm in an interval of 10 gm.
The reflected spectrum was monitored, recorded, and analyzed in a manner similar to the
Figure 7-10 Change in (a) Bragg wavelength and (b) bandwidth of TFBG sensor coated
with solder paste versus temperature.

43
thermal sensor discussed earlier in this chapter. Figure 6-12 shows the spectral response
of Lophine-coated TFBG sensor when exposed to mechanical loading. Since, the cladding
mode of the transmitted spectrum follows the same behavior as of the core mode of the
reflected spectrum, we have narrowed down our experiment to the study of the core mode
only. The spectral response thus obtained were processed, and the result is presented in
figure 6-13. In figure 6-13(a), the central Bragg wavelengths of both the bare and the coated
FBG sensors are presented which shows a linear red-shift with applied external load. In
Figure 7-11 Experimental set-up for measuring mechanical-loading response of Lophine
coated TFBG sensors.
Figure 7-12 Spectral shift of Lophine – coated TFBG sensor with mechanical loading.

44
addition, the wavelength sensitivity showed an insignificant difference between the bare
and the coated TFBG sensors having their values 13.6 pm/gm and 12.9 pm/gm
respectively. However, bandwidth did not show any practical change when exposed to the
external loads either for the bare or coated TFBG sensor (figure 6-13(b)).
Birefringence
Principle of operation
The conventional SMF has low birefringence. Thus, when a broadband light
travelling in such a fiber encounters an FBG in its path, a narrow band pass spectrum is
reflected. Due to its geometric symmetry, the reflected signal contains degenerate Eigen
modes and the spectrum carries single resonance peak centered at a wavelength, known
as “Bragg wavelength”, λb. However, when the same grating is inscribed in a high
birefringent fiber, due to the presence of two different Refractive indices, the Eigen modes
are no longer degenerate and the reflected spectrum witnesses two resonance peaks, one
corresponding to each Eigen value. The resonance peak at shorter wavelength
Figure 7-13 Shift in (a) central Bragg wavelength (b) bandwidth with applied mechanical
load.
.

45
corresponds to smaller index and is called fast mode, while the one at longer wavelength
corresponds to larger RI and is called slow mode.
Birefringence, in traditional SMF, can be developed by distorting its circular
symmetry. A common practice is to apply externally – induced stress, confined within a
small region. The magnitude of such birefringence is proportional to the stress applied in
transverse direction and is shown by equation 6-1.
)()( 00 yxyxyx CnnnnB , (6-1)
Figure 7-14 Schematic of externally induced birefringence in an FBG sensor and
polarization of guided light.
Figure 7-15 Spectral response of the polarized FBG sensor with two axes: fast axis and
slow axis [49].

46
where the first term of birefringence, B, in the expanded form, is the direct result of fiber
geometry and arises due to the asymmetry in fiber core [46]. The second term is introduced
by stress-induced birefringence, in which ‘C’ is the stress-optic coefficient whereas ‘σx‘ and
‘σy‘ represent principal stresses. In case of conventional fiber, effect of first term is
negligible and the stress-induced birefringence dominates. Thus, when an FBG is exposed
to localized transverse stress (figure 6-14), the uniqueness of Bragg condition no longer
exists and the spectrum is characterized by two single peaked spectra centered at two
Bragg wavelengths [47] (figure 6-15).and are expressed as:
.2,2 ,,,, fefffbseffsb nn (6-2)
In addition to birefringence, non-uniform strain distribution or thermal residual
strain can also produce similar result with splitting of central Bragg wavelength. However,
both these effects, i.e. birefringence and residual strain, can be verified using a common
experiment. At this moment, we presume birefringence is the sole reason behind such a
behavior of FBG sensor having two distinct modes: fast axis and slow axis. If our
assumption is correct, the magnitude of reflected intensity of two peaks will change in
opposite direction as the polarization of the signal is changed (Figure 6-16). But if the
intensity of both reflected peaks vary in the same way, our initial assumption about
Figure 7-16 Change in FBG spectrum at different polarization state of the signal [31].

47
birefringence is incorrect and then residual strain can be held accountable for the spectral
behavior of the sensor.
Sensor Response
First of all, we have deliberately introduced birefringence in a regular FBG sensor
by applying transverse load as shown in the figure 6-17 and have validated the principle
using the experimental set-up shown in figure 6-18. Two additional polarization elements,
i.e. Polarizer controller (PC) and polarizer filter (PF), were placed in front of an OSA before
light is allowed to enter into it. In figure 6-19, the reflected spectrums of the FBG sensors
at different angles of polarization (90°, 135° and 180°) were shown for the free and the
transversely loaded FBG sensors. As the angle of polarization varied from 0° to 180°, the
Figure 7-17 Schematics of transversely loaded-FBG sensor for inducing birefringence.
Figure 7-18 Experimental set-up for measuring externally induced birefringence in an
FBG sensor (or transversely loaded sensor).
OSA
Light
Coated FBG
CouplerPCPF
FiberTerminator

48
value of central Bragg wavelength kept oscillating for the transversely – loaded FBG sensor
while it remained constant for the free FBG sensor, and is shown in figure 6-20. After
establishing the relation between the polarized signal and the reflected spectrum of the
birefringent FBG sensor, the role of birefringence in the Lophine-coated FBG sensor was
investigated, and is shown in figure 6-21. It is clear that irrespective of the polarization of
light, the reflected FBG spectrum has constant Bragg wavelength (figure 6-21(a)) and
bandwidth (figure 6-21(b)). This violates our initial assumption that the splitting of the peak
Figure 7-19 Shift in FBG spectrum of (a) normal FBG and (b) transversely-loaded FBG
sensor by varying polarization state of the signal.
Figure 7-20 Shift in central Bragg wavelength with angle of polarization.

49
is due to birefringence and thus we can claim thermal residual stress for bandwidth
modulation of Lophine-coated FBG sensor.
Figure 7-21 (a) Spectrum of Lophine-coated FBG sensor and (b) its central Bragg
wavelength at different angle of polarization.

50
Chapter 8
Conclusion and Future Work
In this research, we demonstrated that coating the FBG sensor with recrystallize
Lophine can introduce temperature-dependent bandwidth changes of the FBG reflectance
spectrum. Combining the bandwidth change with the central wavelength shift, the axial
load and temperature can be simultaneously measured from a single Lophine-coated FBG
sensor. The sensor has produced promising result with measurement errors within ±44.8
με for strain and ±4 °C for temperature. Also, Bragg wavelength sensitivity of this sensor
against thermal change has increased to 2.5 times normal FBG sensor. On the other hand,
the actual reason behind bandwidth modulation could not be validated. Out of the three
possible ways, i.e. optical absorption, birefringence and thermal residual stress, it appears
that the thermal residual stress developed during the coating process is the reason behind
bandwidth modulation of the proposed sensor.
In the future, we will investigate packaging of the Lophine-coated FBG sensor to
produce a more robust sensor so that it can be surface mounted on structural components
for simultaneous strain and temperature measurements. The other direction worth
investigating is the use of composites to embed FBG (figure 7-1). The use of cross ply
laminates can introduce birefringence into the FBG and its bandwidth can also be
modulated with thermal variation. The advantage of this sensor lies in the fact that it can
directly be used for surface mounting application.
Figure 8-1 FBG embedded in cross ply composite laminate.
Optical fiber
Composite cross-ply

51
Appendix A
MATLAB Code

52
function [WLC, BW]=f_FBG_BW(WL, FBG, BWP);
% this function find the FBG bandwidth at a given power level
% Inputs:
% WL: wavelength
% FBG: FBG power
% BWP: power level at which the BW is calculated
% Output
% WLC: center wavelength
% BW: Bandwidth
% First created by Prof. Haiying Huang at Univeristy of Texas Arlington
MM=length(FBG);
plot(WL, FBG,'b', WL, BWP*ones(size(WL)), 'r'); grid on; hold on;
FBG=FBG-BWP;
FBGM=FBG(1:MM-1,1).*FBG(2:MM,1);
WL0=[];
index=find(FBGM==0); % find data point with zero value
if(~isempty(index))
index0=find(FBG(index)==0);
if (~isempty(index0))
WL0=[WL0; WL(index(index0))];
end
index0=find(FBG(index+1)==0);
if(~isempty(index0))
WL0=[WL0; WL(index(index0)+1)];
end
plot(WL0, BWP(size(WL0)), 'kd');
end
index=find(FBGM<0); % find zero-crossings
if(~isempty(index))
WL_Zc=[WL(index), WL(index+1)];
FBG_Zc=[FBG(index), FBG(index+1)];
WL0=[WL0;WL_Zc(:,1)-FBG_Zc(:,1).*(WL_Zc(:,2)-WL_Zc(:,1))./(FBG_Zc(:,2)-
FBG_Zc(:,1))];
plot(WL0, BWP*ones(size(WL0)), 'k*');
end
% if(length(WL0)~=2)
% disp('warning: more than two intersection, take first & last for BW
calculation');
% end
% WLC=(WL0(2)+WL0(1))/2;
% BW=WL0(2)-WL0(1);

53
WLC=(max(WL0)+ min(WL0))/2;
BW= max(WL0)- min(WL0);
return
% this program process the FBG transmission spectrum to produce the frequency
shift and
% bandwidth changes
clear all
close all
clc
[filename, pathname] = uigetfile({'*.xlsm'},'Open File','Multiselect','off'); %
choose file to open
addpath(pathname); % add path to the matlab search path
FBGT=xlsread(filename, 'Reflection', 't4:ad8195'); %transmission
FBGR=xlsread(filename, 'Reflection', 't4:ad8195'); %reflection
CaseNum=[1:10]; %[num, Case, raw]=xlsread(filename, 'Air', 'E2:H2');
rmpath(pathname); % remove path
[MM, NN]=size(FBGT);
WL=FBGT(:,1);
figure(5); subplot(2,1,1); plot(WL, FBGT(:,2:NN));title('Transmission');grid on;
subplot(2,1,2); plot(WL, FBGR(:, 2:NN));title('Reflection');grid on;
%process resonance
proceed=input('process resonant (Y/N)? ', 's');
kk=0;
figure(10);
while(proceed=='Y')
clf(10);
kk=kk+1;
WLstart=input('Starting wavelength: ');
WLend=input('Ending wavelength: ');
index=find(WL>=WLstart & WL<=WLend);
WL1=WL(index);
FBG1=FBGT(index, 2:NN);
FBG2=FBGR(index, 2:NN);
figure(10); plot(WL1, FBG1);grid on; title('Transmission');
BW_offsetT=input('Offset from min for BW measurement - Transmission (enter 0
if no resonance): ');
plot(WL1, FBG2);grid on; title('Reflection');
BW_offsetR=input('Offset from min for BW measurement - Reflection (enter 0 if
no resonance): ');
for ii=1:NN-1
if (BW_offsetT==0) % no obvious peak

54
WL_T(ii,kk)=(WLstart+WLend)/2;
BW_T(ii,kk)=0;
else
[WL_T(ii, kk), BW_T(ii, kk)]=f_FBG_BW(WL1, FBG1(:,ii),
min(FBG1(:,ii))+BW_offsetT);
end
if (BW_offsetR==0) % no obvious peak
WL_R(ii,kk)=(WLstart+WLend)/2;
BW_R(ii,kk)=0;
else
[WL_R(ii, kk), BW_R(ii, kk)]=f_FBG_BW(WL1, FBG2(:,ii),
max(FBG2(:,ii))-BW_offsetR);
end
end
proceed=input('process resonant (Y/N)? ', 's');
end
figure(20);
subplot(2,2,1); plot(CaseNum, WL_T); title('Wavelength shift-Transmission');
xlabel('Case'); ylabel('Wavelength (nm)');
subplot(2,2,2); plot(CaseNum, BW_T); title('FBG BW-Transmission'); xlabel('Case');
ylabel('Wavelength (nm)');
subplot(2,2,3); plot(CaseNum, WL_R); title('Wavelength shift-Reflection');
xlabel('Case'); ylabel('Wavelength (nm)');
subplot(2,2,4); plot(CaseNum, BW_R); title('FBG BW-Reflection'); xlabel('Case');
ylabel('Wavelength (nm)');
% print the output
fid=fopen('FBG_WL_BW.txt', 'w');
for jj=1:kk % loop over number of resonance
fprintf(fid, '%s\n', ['Resonant No. ', num2str(jj)]);
fprintf(fid, '%s \t %s \t %s \t %s \t %s \n','Case', 'Transmission-Freq.',
'Transmission-BW', 'Reflection-Freq.', 'Reflection-BW');
fprintf(fid, '%10.4f \t %10.4f \t %10.4f \t %10.4f \t %10.4f\n', [CaseNum.',
WL_T(:,jj), BW_T(:,jj), WL_R(:,jj), BW_R(:,jj)].');
end
fclose(fid);
type FBG_WL_BW.txt; % displace the output data

55
References
[1] Lopez-Higuera J M, Rodriguez Cobo L, Quintela Incera A and Cobo A 2011 Fiber
Optic Sensors in Structural Health Monitoring J. Light. Technol. 29 587–608
[2] Chan T H T, Yu L, Tam H Y, Ni Y Q, Liu S Y, Chung W H and Cheng L K 2006
Fiber Bragg grating sensors for structural health monitoring of Tsing Ma bridge:
Background and experimental observation Eng. Struct. 28 648–59
[3] Guo H, Xiao G, Mrad N and Yao J 2011 Fiber optic sensors for structural health
monitoring of air platforms Sensors 11 3687–705
[4] Kahandawa G C, Epaarachchi J, Wang H and Lau K T 2012 Use of FBG sensors
for SHM in aerospace structures Photonic Sensors 2 203–14
[5] Majumder M, Gangopadhyay T K, Chakraborty A K, Dasgupta K and Bhattacharya
D K 2008 Fibre Bragg gratings in structural health monitoring-Present status and
applications Sensors Actuators, A Phys. 147 150–64
[6] TODD M D, NICHOLS J M, TRICKEY S T, SEAVER M, NICHOLS C J and VIRGIN
L N 2006 Bragg grating-based fibre optic sensors in structural health monitoring
Philos. Trans. R. Soc. A 365 317–43
[7] Mahakud R, Kumar J, Prakash O and Dixit S K 2013 Study of the nonuniform
behavior of temperature sensitivity in bare and embedded fiber Bragg gratings:
experimental results and analysis. Appl. Opt. 52 7570–9
[8] Alemohammad H and Toyserkani E 2009 Simultaneous measurement of
temperature and tensile loading using superstructure FBGs developed by laser
direct writing of periodic on-fiber metallic films Smart Mater. Struct. 18 95048
[9] Rao Y J 1997 In-fibre Bragg grating sensors Meas. Sci. Technol. 8 355–75
[10] Baldwin C S, Poloso T, Chen P C, Niemczuk J B, Kiddy J S and Ealy C 2001
Structural monitoring of composite marine piles using fiber optic sensors SPIE’s 8th

56
Annu. Int. Symp. Smart Struct. Mater. 4330 487–97
[11] Rao Y J 2006 Recent progress in fiber-optic extrinsic Fabry-Perot interferometric
sensors Opt. Fiber Technol. 12 227–37
[12] Abi Kaed Bey S K, Sun T and Grattan K T V 2008 Simultaneous measurement of
temperature and strain with long period grating pairs using low resolution detection
Sensors Actuators A Phys. 144 83–9
[13] Triollet S, Robert L, Marin E and Ouerdane Y 2011 Discriminated measures of
strain and temperature in metallic specimen with embedded superimposed long and
short fibre Bragg gratings Meas. Sci. Technol. 22 15202
[14] Xiaohong L, Dexiang W, Fujun Z and Enguang D 2004 Simultaneous independent
temperature and strain measurement using one fiber Bragg grating based on the
etching technique Microw. Opt. Technol. Lett. 43 478–81
[15] Dong Y, Chen L and Bao X 2010 High-Spatial-Resolution Time-Domain
Simultaneous Strain and Temperature Sensor Using Brillouin Scattering and
Birefringence in a Polarization-Maintaining Fiber Photonics Technol. Lett. IEEE 22
1364–6
[16] Cavaleiro P M, Ara�jo F M, Ferreira L A, Santos J L and Farahi F 1999
Simultaneous measurement of strain and temperature using Bragg gratings written
in germanosilicate and boron codoped germanosilicate fibers IEEE Phot. Technol.
Lett. 11 1635–7
[17] Dong X, Liu Y, Liu Z and Dong X 2001 Simultaneous displacement and
temperature measurement with cantilever-based fiber Bragg grating sensor Opt.
Commun. 192 213–7
[18] Jin L, Zhang W, Zhang H, Liu B, Zhao J, Tu Q, Kai G and Dong X 2006 An
embedded FBG sensor for simultaneous measurement of stress and temperature

57
IEEE Photonics Technol. Lett. 18 154–6
[19] Zhang W, Dong X, Zhao Q, Kai G and Yuan S 2001 FBG-type sensor for
simultaneous measurement of force (or displacement) and temperature based on
bilateral cantilever beam IEEE Photonics Technol. Lett. 13 1340–2
[20] Dennison C R and Wild P M 2012 Superstructured fiber-optic contact force sensor
with minimal cosensitivity to temperature and axial strain Appl. Opt. 51 1188
[21] Sheng H-J and Tien C-L 2006 High-sensitivity simultaneous pressure and
temperature sensor using a superstructure fiber grating IEEE Sens. J. 6 691–6
[22] Okabe Y, Yashiro S, Tsuji R, Mizutani T and Takeda N 2002 Effect of thermal
residual stress on the reflection spectrum from fiber Bragg grating sensors
embedded in CFRP laminates Compos. - Part A Appl. Sci. Manuf. 33 991–9
[23] Tanaka N, Okabe Y and Takeda N 2003 Temperature-compensated strain
measurement using fiber Bragg grating sensors embedded in composite laminates
Smart Mater. Struct. 12 940–6
[24] Guo T, Zhao Q, Zhang H, Xue L, Li G, Dong B, Liu B, Zhang W, Kai G and Dong
X 2006 Temperature-insensitive fiber Bragg grating force sensor via a bandwidth
modulation and optical-power detection technique J. Light. Technol. 24 3797–802
[25] Ng J H, Zhou X, Yang X and Hao J 2007 A simple temperature-insensitive fiber
Bragg grating displacement sensor Opt. Commun. 273 398–401
[26] Kim S, Kwon J, Kim S and Lee B 2000 Temperature-independent strain sensor
using a chirped grating partially embedded in a glass tube IEEE Photonics Technol.
Lett. 12 678–80
[27] Xu M G, Dong L, Reekie L, Tucknott J A and Cruz J L 1995 Temperature-
independent strain sensor using a chirped Bragg grating in a tapered optical fibre
Electron. Lett. 31 823–5

58
[28] Hadjifotiou T 2008 The Cable and Telecommunications Professional’s Reference
Physics ed H Goff pp 111–44
[29] Othonos A and Introduction I 1997 Fiber Bragg gratings Rev. Sci. Instrum. 68
4309–41
[30] Zervas M N, Ibsen M and Laming R I 1997 Short-wavelength transmission-loss
suppression in fibre Bragg gratings 39–41
[31] Lee J R, Tsuda H and Koo B Y 2007 Single-mode fibre optic Bragg grating sensing
on the base of birefringence in surface-mounting and embedding applications Opt.
Laser Technol. 39 157–64
[32] Kiri P, Warwick M E A, Ridley I and Binions R 2011 Fluorine doped vanadium
dioxide thin films for smart windows Thin Solid Films 520 1363–6
[33] Karlessi T, Santamouris M, Apostolakis K, Synnefa A and Livada I 2009
Development and testing of thermochromic coatings for buildings and urban
structures Sol. Energy 83 538–51
[34] Qian G and Wang Z Y 2012 Near-infrared thermochromic diazapentalene dyes
Adv. Mater. 24 1582–8
[35] Xu G, Huang C M, Tazawa M, Jin P, Chen D M and Miao L 2008 Electron injection
assisted phase transition in a nano-Au-VO2 junction Appl. Phys. Lett. 93 96–9
[36] Fernández-Valdivielso C, Matı́as I R and Arregui F J 2002 Simultaneous
measurement of strain and temperature using a fiber Bragg grating and a
thermochromic material Sensors Actuators A Phys. 101 107–16
[37] Díaz-Herrera N, Navarrete M C, Esteban O and González-Cano A 2004 A fibre-
optic temperature sensor based on the deposition of a thermochromic material on
an adiabatic taper Meas. Sci. Technol. 15 353–8
[38] Fernández-Valdivielso C, Egozkue E, Matı́as I R, Arregui F J and Bariáin C 2003

59
Experimental study of a thermochromic material based optical fiber sensor for
monitoring the temperature of the water in several applications Sensors Actuators
B Chem. 91 231–40
[39] Yoo W J, Seo J K, Jang K W, Heo J Y, Moon J S, Park J Y, Park B G and Lee B
2011 Fabrication and comparison of thermochromic material-based fiber-optic
sensors for monitoring the temperature of water Opt. Rev. 18 144–8
[40] Loh W H, Cole M J, Zervas M N, Barcelos S and Laming R I 1995 Complex grating
structures with uniform phase masks based on the moving fiber-scanning beam
technique. Opt. Lett. 20 2051–3
[41] Kuang K S C, Kenny R, Whelan M P, Cantwell W J and Chalker P R 2001
Embedded fibre Bragg grating sensors in advanced composite materials Compos.
Sci. Technol. 61 1379–87
[42] Kuang K S C, Kenny R, Whelan M P, Cantwell W J and Chalker P R 2001 Residual
strain measurement and impact response of optical fibre Bragg grating sensors in
fibre metal laminates Smart Mater. Struct. 10 338–46
[43] Erdogan T 1997 Fiber grating spectra J. Light. Technol. 15 1277–94
[44] Dong X, Zhang H, Liu B and Miao Y 2011 Tilted fiber bragg gratings: Principle and
sensing applications Photonic Sensors 1 6–30
[45] Strasser T A, Pedrazzani J R and Andrejco M J 1997 Reflective-mode conversion
with UV-induced phase gratings in two-mode fiber Proc. Conf. Opt. Fiber
Communation 348–9
[46] Okamoto K, Hosaka T and Edahiro T 1981 Stress analysis of optical fibers by a
finite element method IEEE J. Quantum Electron. 17 2123–9
[47] Chen G C G, Liu L L L, Jia H J H, Yu J Y J, Xu L X L and Wang W W W 2004
Simultaneous strain and temperature measurements with fiber Bragg grating

60
written in novel Hi-Bi optical fiber IEEE Photonics Technol. Lett. 16 221–223
[48] Newport Fiber Optic Basics
[49] Sorensen L, Botsis J, Gmür T and Cugnoni J 2007 Delamination detection and
characterisation of bridging tractions using long FBG optical sensors Compos. Part
A Appl. Sci. Manuf. 38 2087–96

61
Biographical Information
Mr. Abhay was born in Bihar, India in 1990. He obtained his bachelor’s degree in
Mechanical engineering from Panjab University, Chandigarh, in 2013. Thereafter, he joined
the design and research team of Oceaneering, an oil and gas industry. In 2014, he decided
to pursue further education by joining The University of Texas at Arlington as a graduate
research assistant. His research lies in the field of structural health monitoring. He primarily
designs optical fiber sensors for simultaneous measurement of temperature and strain. His
research work was published in Smart Materials and Structures journal of IOP and in
SMASIS conference of American Society of Mechanical Engineer (ASME) before his
graduation in 2016. He is a recipient of multiple awards and honors such as travel grant
award from University of Texas at Arlington, Tau Beta Pi recognition for academic
excellence and ASME membership. He is also certified as professional design engineer, a
certificate issued by Dassault Systèmes. Among other extracurricular activities, he served
as an executive member and social liaison of ASME UT Arlington chapter.


![[XLS] · Web viewABHA SINGH C/O DR.SHALIGRAM SINGH , P/369 , N SECTOR ,EAST OF KENDRIYA VIDYALAYA KANKARBAGH , PATNA 0000IN30088813185296 ABHAY TANAJIRAO YADAV KANDIVALI PRIYADARSHINI](https://img.pdfslide.us/doc/110x75/5aad1bbb7f8b9a8f498dd5e9/xls-viewabha-singh-co-drshaligram-singh-p369-n-sector-east-of-kendriya.jpg)


![[Abhay K. Singh] Solutions to Irodov's Problems in(BookFi.org)](https://img.pdfslide.us/doc/110x75/577ccf4f1a28ab9e788f6c76/abhay-k-singh-solutions-to-irodovs-problems-inbookfiorg.jpg)