Embed Size (px)
Citation preview

SINGAPORE1
Key findings
Compared with adults (16-65 year-olds) in the OECD countries that participated in the survey, adults in Singapore show below-average proficiency in literacy and numeracy, but above-average proficiency in problem solving in technology-rich environments. The high prevalence of adults whose native language is different from that of the assessment (English) contributed significantly to below-average proficiency.
In Singapore, young adults aged 16-24 performed better than the OECD average in literacy, and had the highest average score among participating countries in numeracy. By contrast, older adults, particularly 55-65 year-olds, attained some of the lowest scores in literacy and numeracy among all participating countries/economies.
The disadvantage of older adults is partly explained by the higher prevalence of non-native English speakers and by their relatively low levels of educational attainment.
The dispersion of proficiency scores is wider in Singapore than in most other participating countries/economies.
Workers in Singapore frequently use their reading, numeracy and especially ICT skills at work. Their proficiency in literacy and numeracy is rewarded with higher wages to a larger extent than in OECD countries. More proficient adults generally report to be in better health and are more likely to engage in volunteer activities.
The Survey of Adult Skills
The Survey of Adult Skills, a product of the OECD Programme for the International Assessment of Adult Competencies (PIAAC), provides a picture of adults’ proficiency in three key information-processing skills:
- literacy – the ability to understand and respond appropriately to written texts - numeracy – the ability to use numerical and mathematical concepts - problem solving in technology-rich environments – the capacity to access, interpret and analyse information found, transformed and communicated in digital environments.
Proficiency is described on a scale of 500 points divided into levels. Each level summarises what a person with a particular score can do. Six proficiency levels are defined for literacy and numeracy (Levels 1 through 5 plus below Level 1) and four are defined for problem solving in technology-rich environments (Levels 1 through 3 plus below Level 1).
The survey also provides a wide range of information about respondents’ use of skills at work and in everyday life, their education, their linguistic and social backgrounds, their participation in adult education and training programmes and in the labour market, and other aspects of their well-being.
The reference population included adults aged 16-65 residing in the country (Singapore citizens and permanent residents).
The Survey of Adult Skills was conducted in Singapore from 1 April 2014 to 31 January 2015. A total of 5 468 adults aged 16-65 were surveyed.
1The statistical data for Israel are supplied by and are under the responsibility of the relevant Israeli authorities. The use of such data by the OECD is without prejudice to the status of the Golan Heights, East Jerusalem and Israeli settlements in the West Bank under the terms of international law.

Singapore – Country Note – Skills Matter: Further Results from the Survey of Adult Skills
2 © OECD 2016
The share of adults in Singapore who scored at the highest levels of proficiency in literacy is similar to the OECD average, and the share of adults who scored at those levels in numeracy and in problem solving in technology-rich environments is above average.
About one in ten 16-65 year-olds in Singapore attained the highest levels of proficiency (Level 4 or 5) in literacy, roughly in line with the average across OECD countries/economies that participated in the survey (10.6%). The share of adults with the highest levels of proficiency varies by age. It rises to 16.5% among 16-24 year-olds (5 percentage points above the average), and decreases to 2.4% among 55-65 year-olds (half of the OECD average). At Level 4, adults can integrate, interpret and synthesise information from complex or lengthy texts that contain conditional and/or competing information. (For more details on what adults can do at each proficiency level, see the table at the end of this note.) Just fewer than one in three adults (32.3%) attained Level 3 in literacy, slightly less than the OECD average of 35.4%. Adults performing at this level can understand and respond appropriately to dense or lengthy texts, and can identify, interpret, or evaluate one or more pieces of information and make appropriate inferences using knowledge text structures and rhetorical devices.
In numeracy, 13.3% of adults attained Level 4 or 5, slightly above the OECD average of 11.2%. Some 19% of 16-24 year-olds scored at Level 4 or 5, almost double the proportion observed on average (10.1%), but only 3.4% of 55-65 year-olds attained those levels, compared to the OECD average of 6.4%. At Level 4, adults understand a broad range of mathematical information that may be complex, abstract or found in unfamiliar contexts. Around one in three adults (31.4%) attained Level 3 in numeracy, about the same as the OECD average of 31.8%. At this level, adults have a good sense of number and space; can recognise and work with mathematical relationships, patterns, and proportions expressed in verbal or numerical form; and can interpret and perform basic analyses of data and statistics in texts, tables and graphs.
Some 7.7% of adults attained Level 3, the highest proficiency level, in problem solving in technology-rich environments. This is one of the highest percentages across all participating countries/economies and significantly higher than the OECD average of 5.4%. Some 15.7% of 16-24 year-olds attained this level – nearly double the OECD average of 8%. Adults at Level 3 can complete tasks involving multiple computer applications, a large number of steps, and the discovery and use of ad hoc commands in a novel environment. Around one in three adults (29.3%) attained proficiency Level 2 in problem solving, compared with the average of 25.7%. At Level 2, adults can complete problems that involve a small number of computer applications, and require completing several steps and operations to reach a solution.
A larger-than-average proportion of adults in Singapore have poor literacy and numeracy skills.
More than one in four adults (26.1%) in Singapore are proficient at or below Level 1 in literacy (compared to the OECD average of 18.9%) and almost 28.0% scored at or below Level 1 in numeracy (5 percentage points higher than the OECD average of 22.7%). Low proficiency is particularly prevalent among 55-65 year-olds. In both literacy and numeracy, about one in two adults in this age group scored at or below Level 1 compared to an average of nearly one in three (around 30%) across participating OECD countries/economies. Among 16-24 year-olds, 7.7% are low performers in literacy and 9.7% are low performances in numeracy – about half the OECD average in both domains. At Level 1 in literacy, adults can read brief texts on familiar topics and locate a single piece of specific information identical in form to information in the question or directive. In numeracy, adults at Level 1 can perform basic mathematical processes in common, concrete contexts, for example, one-step or simple processes involving counting, sorting, basic arithmetic operations and understanding simple percentages.

Singapore – Country Note – Skills Matter: Further Results from the Survey of Adult Skills
© OECD 2016 3
Figure 1 Literacy proficiency among adults
Percentage of adults scoring at each proficiency level in literacy
Note: Adults in the missing category were not able to provide enough background information to impute proficiency scores because of language difficulties, or learning or mental disabilities (referred to as literacy-related non-response). 1. Note by Turkey: The information in this document with reference to “Cyprus” relates to the southern part of the Island. There is no single authority representing both Turkish and Greek Cypriot people on the Island. Turkey recognises the Turkish Republic of Northern Cyprus (TRNC). Until a lasting and equitable solution is found within the context of the United Nations, Turkey shall preserve its position concerning the “Cyprus issue”.
Note by all the European Union Member States of the OECD and the European Union: The Republic of Cyprus is recognised by all members of the United Nations with the exception of Turkey. The information in this document relates to the area under the effective control of the Government of the Republic of Cyprus. 2. The sample for the Russian Federation does not include the population of the Moscow municipal area. Countries and economies are ranked in descending order of the combined percentages of adults scoring at Level 3 and at Level 4 or 5. Source: Survey of Adult Skills (PIAAC) (2012, 2015), Table A2.1 (http://dx.doi.org/10.1787/888933366458).
Japan
Finland
Netherlands
Sweden
Australia
New Zealand
Norway
Estonia
Russian Federation²
Slovak Republic
Flanders (Belgium)
Canada
Czech Republic
Denmark
Korea
England (UK)
Germany
OECD average
United States
Austria
Poland
Ireland
Northern Ireland (UK)
Singapore
France
Lithuania
Cyprus¹
Israel
Slovenia
Spain
Greece
Italy
Chile
Turkey
Jakarta (Indonesia)
Percentage of adults scoring at each proficiency level in literacy
0.0
2.0
0.3
0.7
1.0
0.8
0.6
2.4
17.7
4.5
0.8
1.0
2.2
0.5
0.0
1.8
4.2
1.4
1.5
1.4
0.3
0.4
0.6
0.9
5.2
0.3
0.0
0.4
2.2
1.9
1.9
0.0
2.3
0.0
1.2
100 80 60 40 20 0 20 40 60 80 100
Missing Below Level 1 Level 1 Level 2 Level 3 Level 4 or 5
%

Singapore – Country Note – Skills Matter: Further Results from the Survey of Adult Skills
4 © OECD 2016
Figure 2 Numeracy proficiency among adults
Percentage of 16-65 year-olds scoring at each proficiency level in numeracy
Note: Adults in the missing category were not able to provide enough background information to impute proficiency scores because of language difficulties, or learning or mental disabilities (referred to as literacy-related non-response). 1. See note 1 under Figure 1. 2. The sample for the Russian Federation does not include the population of the Moscow municipal area. Countries and economies are ranked in descending order of the combined percentage of adults scoring at Level 3 and at Level 4 or 5. Source: Survey of Adult Skills (PIAAC) (2012, 2015), Table A2.4 (http://dx.doi.org/10.1787/888933366458).
Japan
Finland
Sweden
Netherlands
Norway
Denmark
Slovak Republic
Flanders (Belgium)
Czech Republic
Austria
Germany
Estonia
New Zealand
Russian Federation²
Australia
Canada
Singapore
OECD average
Lithuania
Korea
England (UK)
Slovenia
Poland
Northern Ireland (UK)
France
Ireland
Israel
Cyprus¹
United States
Greece
Italy
Spain
Turkey
Chile
Jakarta (Indonesia)
Percentage of 16-65 year-olds scoring at each proficiency level in numeracy
0.0
0.3
2.0
0.8
0.7
1.0
4.2
17.7
2.4
0.5
0.8
2.2
0.0
0.6
1.4
0.3
4.5
1.4
1.0
0.9
1.9
0.0
1.9
0.4
1.5
1.8
0.6
5.2
0.3
0.4
2.2
2.3
0.0
0.0
1.2
100 80 60 40 20 0 20 40 60 80 100
Missing Below Level 1 Level 1 Level 2 Level 3 Level 4 or 5
%
Singapore – Country Note – Skills Matter: Further Results from the Survey of Adult Skills
© OECD 2016 5
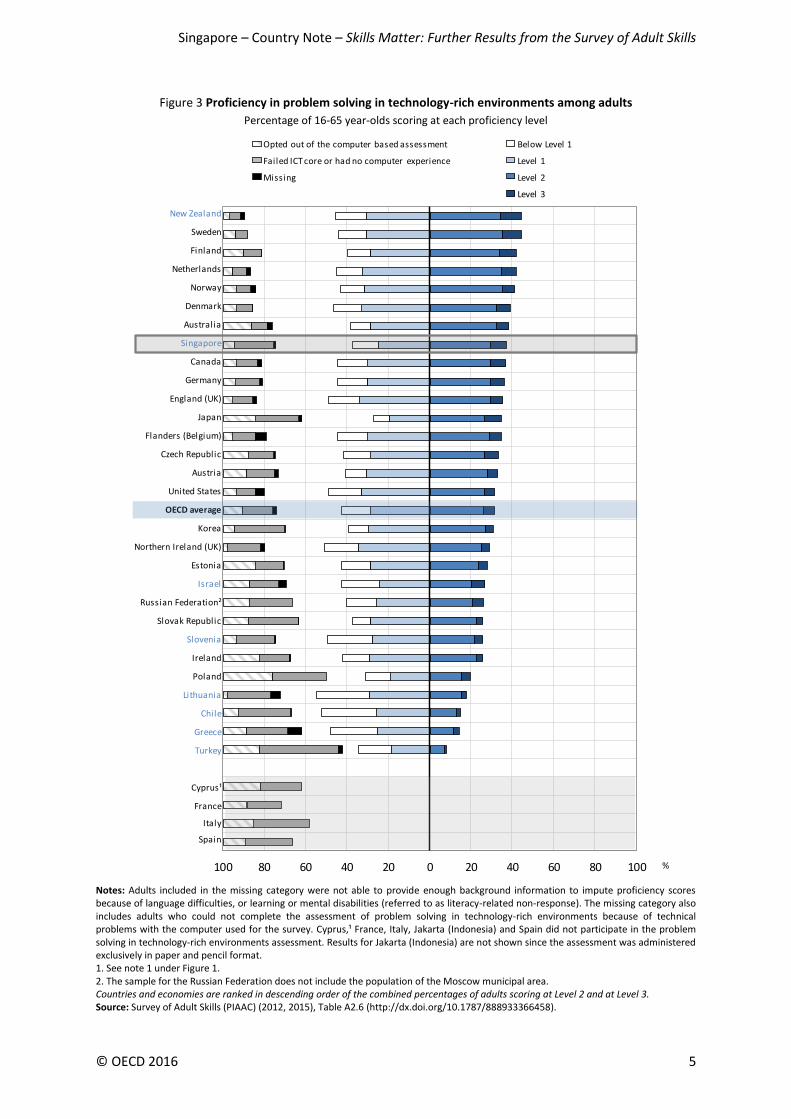
Figure 3 Proficiency in problem solving in technology-rich environments among adults
Percentage of 16-65 year-olds scoring at each proficiency level
Notes: Adults included in the missing category were not able to provide enough background information to impute proficiency scores because of language difficulties, or learning or mental disabilities (referred to as literacy-related non-response). The missing category also includes adults who could not complete the assessment of problem solving in technology-rich environments because of technical problems with the computer used for the survey. Cyprus,¹ France, Italy, Jakarta (Indonesia) and Spain did not participate in the problem solving in technology-rich environments assessment. Results for Jakarta (Indonesia) are not shown since the assessment was administered exclusively in paper and pencil format. 1. See note 1 under Figure 1. 2. The sample for the Russian Federation does not include the population of the Moscow municipal area. Countries and economies are ranked in descending order of the combined percentages of adults scoring at Level 2 and at Level 3. Source: Survey of Adult Skills (PIAAC) (2012, 2015), Table A2.6 (http://dx.doi.org/10.1787/888933366458).
New Zealand
Sweden
Finland
Netherlands
Norway
Denmark
Australia
Singapore
Canada
Germany
England (UK)
Japan
Flanders (Belgium)
Czech Republic
Austria
United States
OECD average
Korea
Northern Ireland (UK)
Estonia
Israel
Russian Federation²
Slovak Republic
Slovenia
Ireland
Poland
Lithuania
Chile
Greece
Turkey
Cyprus¹
France
Italy
Spain
100 80 60 40 20 0 20 40 60 80 100
Opted out of the computer based assessment
Failed ICT core or had no computer experience
Missing
Below Level 1
Level 1
Level 2
Level 3
%

Singapore – Country Note – Skills Matter: Further Results from the Survey of Adult Skills
6 © OECD 2016
Some 11.8% of adults in Singapore reported no prior experience with computers (compared to the OECD average of 10.0%) and 7.1% failed the ICT core test (compared to the OECD average of 4.7%). By contrast, fewer adults decided to opt out of the computer-based assessment (5.5%, compared to an average of 9.6%). As a result, about three out of four participants obtained a score in the assessment of problem solving in technology-rich environments, close to the OECD average. Some 37.5% of adults scored at or below Level 1 in problem solving in technology-rich environments, significantly below the OECD average of 42.9%. At Level 1, adults can use only widely available and familiar technology applications, such as e-mail software or a web browser, to solve problems involving few steps, simple reasoning and little or no navigation across applications. Older adults (aged 55-65) were much more likely than average to report no prior computer experience or to fail the ICT test (42.9%, compared to an average of 31.8%), although they were slightly less likely to opt out of the computer assessment (13.5% compared to an average of 17.6%).
In Singapore, the gap between the most and least proficient adults is wide.
In all countries/economies participating in the survey, the variability of adults’ scores in literacy – defined as the difference between the score of an adult who performs better than 75% of survey participants, and the score of an adult who performs better than only 25% of respondents – tends to be large (more than one standard deviation) in all countries/economies. Singapore stands out as the country in which variability in literacy is largest, at 77 score points (compared to the OECD average of 62 score points). In addition, variability in literacy proficiency is much greater than would be predicted given the average literacy score of adults living in Singapore.
Variability is even more striking in numeracy. Even though average numeracy proficiency is high, Singapore shows greater variability in individual proficiency scores: 88 score points separate adults in the top and in the bottom 25% of the proficiency distribution, compared to an average of 68 score points across OECD countries and economies participating in the survey.

Singapore – Country Note – Skills Matter: Further Results from the Survey of Adult Skills
© OECD 2016 7
Figure 4 Average and distribution of numeracy scores
Relationship between mean numeracy proficiency score and variability
Note: The measure of variability used is the interquartile range (third quartile minus first quartile). 1. See note 1 under Figure 1. 2. The sample for the Russian Federation does not include the population of the Moscow municipal area. Source: Survey of Adult Skills (PIAAC) (2012, 2015), Table A2.5 (http://dx.doi.org/10.1787/888933366458).
Low proficiency among Singapore’s older populations can be attributed to the effects of age, educational attainment and language barriers.
Large differences in proficiency related to age, educational attainment, and immigrant and language background are found in most countries/economies; but the differences observed in Singapore (especially those related to age and educational attainment) are much larger than in most other countries/economies. Adults aged 55 to 65 scored 66 points lower than 25-34 year-olds in literacy (compared to the OECD average of 29 score points lower), and the likelihood of scoring at or below Level 1 in either literacy or numeracy is 41.2 percentage points higher among older adults (compared to the OECD average of 16.5 percentage points higher).
In Singapore, tertiary-educated adults aged 25 and older scored 103 points in literacy above adults that had not attained an upper-secondary qualification (the OECD average is 61 score points) and are 75.7 percentage points less likely to score at or below Level 1 in either literacy or numeracy (the OECD average is 43.6 percentage points less likely). But older adults have lower levels of education than their younger counterparts: 40.1% of 55-65 year-olds did not complete upper secondary education, compared to only 4.7% of 25-34 year-olds, and only 21.4% of 55-65 year-olds have a tertiary qualification, compared to 74.1% of 25-34 year-olds.
In addition, almost 80% of older adults in Singapore reported that they are not native speakers in the language of the assessment (English) - i.e. they have not learned English at home in their
Relationship between mean numeracy proficiency score and variability
Australia
Austria
Canada
Cyprus¹
Czech Republic
Denmark
England (UK)
Estonia
Finland
Flanders (Belgium)
France
Germany
IrelandItaly
JapanKorea
Netherlands
Northern Ireland (UK)
Norway
Poland
Russian Federation²
Slovak Republic
Spain
Sweden
United States
Chile
Greece
Israel
Jakarta (Indonesia)
Lithuania
New Zealand
Singapore
Slovenia
Turkey
50
55
60
65
70
75
80
85
90
200 210 220 230 240 250 260 270 280 290 300
Mean numeracy score
Var
iab
ility
High
Low

Singapore – Country Note – Skills Matter: Further Results from the Survey of Adult Skills
8 © OECD 2016
childhood - compared to 67.4% of 25-34 year-olds who so reported. Once differences in educational attainment, immigrant and language background, and parents’ level of education are taken into account, the gap in literacy scores between 55-65 and 25-34 year-olds shrinks to 22 points (still above the OECD average difference of 16 score points). But the gap between high- and low-educated adults remains wide – 91 score points compared to the OECD average gap of 48 score points – even after accounting for differences in socio-demographic characteristics.
Singapore has attracted a pool of highly skilled immigrants.
Some 22.8% of adults who participated in the survey in Singapore were foreign-born, a share much larger than the average across participating OECD countries and economies (12.1%). In Singapore, only 4 points separate the average literacy score of a native-born adult from the average score of a foreign-born adult, much less than the 24 points that separate these two groups on average across participating OECD countries/economies. While the average score of native-born adults (259 points) is more than 10 points below the OECD average (271 points), foreign-born adults in Singapore are more proficient in literacy (scoring 254 points, on average) than immigrants across OECD countries/economies (scoring 247 points, on average). And recent immigrants in Singapore (those who have been living in the country for less than five years) are at least as proficient as native-born adults, and have the second-highest average score in literacy among all countries and economies participating in the survey (262 points compared to the OECD average of 234 points; only New Zealand does better, at 269 points).
The better performance among foreign-born adults relative to native-born adults in Singapore is linked to the language of the assessment. Only 30.8% of native-born participants reported that they are native speakers in the language of the assessment, which was English (the OECD average share is 97.5%). In other words, a large portion of both foreign- and native-born adults in Singapore were tested in a language different from the one they learned at home in their childhood. With an average score of about 280 points in both literacy and numeracy (and with very little differences between native- and foreign-born adults’ performance), native-language speakers in Singapore performed significantly above the OECD average, but they represent only 27.4% of the entire population (while on average across participating OECD countries/economies, native-language speakers make up 89.2% of the population). In Singapore the average literacy score of native-born, native-language adults (i.e. adults born in Singapore and whose mother tongue is English) is 277 points, about 6 points above the OECD average and more than 25 points above the average score of adults who, although born in Singapore, are not native English speakers (native-born, foreign-language).
Compared to adults in other English-speaking countries, both native-born, native-language and foreign-born, foreign-language adults in Singapore performed worse in literacy than their counterparts in Australia and New Zealand, and at about the same level as adults surveyed in Canada. Native-born, native-language adults in Singapore scored about the same as their counterparts in England (United Kingdom) and the United States, and better than their counterparts in Ireland and Northern Ireland (United Kingdom). Foreign-born foreign-language adults in Singapore scored better than their counterparts in the United States and not significantly different from their counterparts in England (United Kingdom), Ireland and Northern Ireland (United Kingdom).

Singapore – Country Note – Skills Matter: Further Results from the Survey of Adult Skills
© OECD 2016 9
Figure 5 Synthesis of socio-demographic differences in literacy proficiency
Difference in literacy scores between contrast categories within various socio-demographic groups
Notes: Statistically significant differences are marked in a darker tone. The estimates show the differences between the two means for each contrast category). The differences are: tertiary minus less than upper secondary (educational attainment), at least one parent attained tertiary minus neither parent attained upper secondary (parents' educational attainment), native born and native language minus foreign born and foreign language (immigrant background) and 25-34 year-olds minus 55-65 year-olds (age). Source: Survey of Adult Skills (PIAAC) (2012, 2015), Tables A3.2(L), A3.5 (L), A3.9 (L), A3.12 (L) and A3.14 (L) (http://dx.doi.org/10.1787/888933366463).
The majority of workers in Singapore are well-matched with their jobs.
The survey collected information about the frequency with which information-processing and various generic skills are used in the workplace. Adults in Singapore read, write, work with mathematics, solve problems and use computers in their jobs slightly more frequently than the OECD average. The degree of mismatch between workers’ literacy skills and the level of proficiency demanded of their jobs is lower than in participating OECD countries and economies: 9.9% of workers can be identified as overskilled (i.e. as having a level of proficiency above that required in their job), below the OECD average of 10.8%. Some 2.9% of workers in Singapore can be considered as underskilled (i.e. workers whose proficiency is below that required in their job), similar to the OECD average of 3.8%.
While almost one in two workers (44.7%, compared to an average of 39.6%) is employed in a different field than the one in which they earned their highest educational qualification, such field-of-study mismatch is less strongly associated with overskilling and overqualification (i.e. working in a position for which a lower educational qualification is usually required) than it is in other countries or economies. This suggests that in Singapore skills and qualifications are recognised even if the workers are employed outside their original field of study, which could explain why field-of-study mismatch does not entail a wage penalty. Similarly, overskilled workers do not earn lower wages than well-matched workers who have similar skills proficiency, which implies that their skills are recognised and valued, even if they are employed in jobs that usually require less proficiency. This suggests that work organisation and pay schemes are flexible enough to allow workers to use their full set of skills and to be rewarded for that.
Difference in literacy scores between contrast categories within various socio-demographic groups
0
10
20
30
40
50
60
70
80
90
100
110
Educationalattainment
Parents'educationalattainment
Immigrantbackground
Age Gender
Singapore OECD averageScore-point difference

Singapore – Country Note – Skills Matter: Further Results from the Survey of Adult Skills
10 © OECD 2016
Figure 6 Average use of information-processing skills at work
Notes: For reading, writing, numeracy and ICT skills, skills use indicators are scales between 1 "Never" and 5 "Every day". Problem-solving skills use refers to respondents' answers to “How often are you usually confronted with more complex problems that take at least 30 minutes to find a good solution?”. The set of possible answers also ranges between 1 "Never" and 5 "Every day". Source: Survey of Adult Skills (PIAAC) (2012, 2015), Table A4.1 (http://dx.doi.org/10.1787/888933366479).
In Singapore, even more so than in OECD countries and economies, higher proficiency in literacy and numeracy is rewarded with higher wages.
In all participating countries/economies, there is a positive relationship between proficiency in literacy and numeracy and hourly wages. This relationship is even stronger in Singapore. The median hourly wage of a worker at Level 4 or 5 on the literacy scale is about USD 15 higher than the median wage of a worker scoring at or below Level 1 (the difference is USD 7 on average across participating OECD countries/economies). Clearly, literacy and numeracy proficiency are not the only determinants of hourly wages. As in all countries/economies, there is a significant overlap in wage distributions across different proficiency levels, so that, for example, the best-paid among workers at Level 3 proficiency earn USD 20 more than the worst-paid workers who score at Level 4 or 5. Still, even after taking into account differences in educational attainment, use of reading skills at work, and a range of other socio-demographic characteristics (like age, gender, and immigrant and language background), in Singapore, the association between literacy proficiency and hourly wages is stronger than in other countries/economies. An increase of one standard deviation in literacy proficiency (about 49 points) is associated with an 11.7% increase in hourly wages – almost double the average estimated effect across participating OECD countries and economies (6.1%).
1
1.5
2
2.5
3
3.5
Reading at work Writing at work Numeracy at work ICT at work Problem solving
Singapore OECD averageMean use

Singapore – Country Note – Skills Matter: Further Results from the Survey of Adult Skills
© OECD 2016 11
Figure 7 Distribution of wages, by literacy proficiency level
25th, 50th and 75th percentiles of the wage distribution
Notes: Employees only. Hourly wages, including bonuses, in purchasing-power-parity-adjusted USD (2012). Source: Survey of Adults Skills (PIAAC) (2012, 2015), Table 5.3 (L) (http://dx.doi.org/10.1787/888933366489).
Proficiency in information-processing skills is associated with a wide range of non-economic outcomes that affect well-being: trust, political efficacy, participation in volunteer activities and self-reported health.
In Singapore, the relationship between proficiency and participation in volunteer activities is particularly strong: 53.4% of adults who scored at Level 4 or 5 in literacy reported that they participate in volunteer activities; only 17.9% of adults who scored at or below Level 1 so reported. The difference in participation rates between these two groups of adults (35.6 percentage points) is much larger than that observed on average across participating OECD countries and economies (22.4 percentage points).
The association between literacy proficiency and both trust and political efficacy (the belief that one has an impact on the political process) is weaker than average in Singapore, although positive and statistically significant. Adults who scored at the highest levels of proficiency are 7.4 percentage points more likely than adults who scored at or below Level 1 to have reported high levels of trust (the OECD average is 16.1 percentage points), and 18.0 percentage points more likely to have reported high levels of political efficacy (the OECD average is 24.5 percentage points). But moving from Level 1 or below to Level 4 or 5 is associated with an increase of 23.2 percentage points in the likelihood of reporting good health, a value close to the OECD average of 22.0 percentage points.
OECD average
Singapore
0 5 10 15 20 25 30 35 40
Hourly wages in USD
25th percentile
50th percentile75th percentile
Literacy Level 1 or below Literacy Level 2Literacy Level 3 Literacy Level 4 or 5

Singapore – Country Note – Skills Matter: Further Results from the Survey of Adult Skills
12 © OECD 2016
Figure 8 Literacy proficiency and positive social outcomes
Difference between the percentage of adults with high proficiency (Level 4 or 5) and the percentage of adults with low proficiency (Level 1 or below) who reported high levels of trust and political efficacy, good to excellent health, or
participating in volunteer activities
Note: All differences are statistically significant. Source: Survey of Adult Skills (PIAAC) (2012, 2015), Table A5.14(L) (http://dx.doi.org/10.1787/888933366489).
Difference between the percentage of adults with high proficiency (Level 4 or 5) and the percentage of adults with low
proficiency (Level 1 or below) who reported high levels of trust and political efficacy, good to excellent health, or
participating in volunteer activities
0
5
10
15
20
25
30
35
40
High levels of politicalefficacy
Participation involunteer activities
High levels of health High levels of trust
Singapore OECD AveragePercentage-point change

Singapore – Country Note – Skills Matter: Further Results from the Survey of Adult Skills
© OECD 2016 13
Key facts about the Survey of Adult Skills (PIAAC)
What is assessed
The Survey of Adult Skills (PIAAC) assesses the proficiency of adults from age 16 in literacy, numeracy and problem solving in technology-rich environments. These skills are “key information-processing competencies” that are relevant to adults in many social contexts and work situations, and necessary for fully integrating and participating in the labour market, education and training, and social and civic life.
In addition, the survey collects a range of information on the reading- and numeracy-related activities of respondents, the use of information and communication technologies at work and in everyday life, and on a range of generic skills, such as collaborating with others and organising one’s time, that are required of individuals in their work. Respondents are also asked whether their skills and qualifications match their work requirements and whether they have autonomy over key aspects of their work.
Methods
The Survey of Adults Skills was conducted over two rounds of data collection.
In the first round, around 166 000 adults aged 16-65 years in 24 countries were surveyed – Australia, Austria, Belgium, Canada, Cyprus,* the Czech Republic, Denmark, Estonia, Finland, France, Germany, Ireland, Italy, Japan, Korea, the Netherlands, Norway, Poland, the Russian Federation,** the Slovak Republic, Spain, Sweden, the United Kingdom and the United States. In all but three countries, data collection covered the entire national population. In Belgium, data were collected in Flanders; in the United Kingdom, data were collected in England and Northern Ireland (data are reported separately for England and Northern Ireland in the report). In the Russian Federation, the data do not cover the Moscow municipal area.
Data collection for Round 1 of the Survey of Adult Skills took place from 1 August 2011 to 31 March 2012 in most participating countries. In Canada, data were collected from November 2011 to June 2012; and France collected data from September to November 2012.
Nine countries took part in the second round of the assessment: Chile, Greece, Indonesia, Israel, Lithuania, New Zealand, Singapore, Slovenia and Turkey. A total of 50 250 adults were surveyed. In all countries except Indonesia the entire national population was covered. In Indonesia, data were collected in the Jakarta municipal area only.
Data collection for Round 2 of the Survey of Adult Skills took place from April 2014 to end-March 2015. The duration of fieldwork varied from around 100 to 330 days, depending on the country.
The language of assessment was the official language(s) of each participating country/economy. In some countries, the assessment was also conducted in widely spoken minority or regional languages.
The target population for the survey was the non-institutionalised population of 16-65 year-olds residing in the country or region at the time of the data collection, irrespective of nationality, citizenship or language status. The achieved national samples ranged from a minimum of approximately 4 000 persons to a maximum of nearly 27 300 persons.
The survey was conducted under the supervision of trained interviewers usually in the respondent’s home. The time taken to complete the questionnaire ranged between 30 and 45 minutes.
After having answered the background questionnaire, the respondent completed the assessment either on a laptop computer or by completing a paper version using printed test booklets, depending on the respondent’s computer skills. Respondents could take as much

Singapore – Country Note – Skills Matter: Further Results from the Survey of Adult Skills
14 © OECD 2016
or as little time as needed to complete the assessment. On average, respondents took 50 minutes to complete the cognitive assessment.
Identical instruments were used in Rounds 1 and 2 of the survey. The one exception was in Jakarta (Indonesia) where, since only paper-based instruments were used, additional test items were added to the paper-based instruments used in the other countries.
Comparing the results of countries/economies in Round 1 and Round 2
Identical data-collection instruments and methodology were used in Rounds 1 and 2 of the survey. The one difference is that data collection for Rounds 1 and 2 occurred some three years apart. The difference in reference dates for the two rounds of the study is unlikely to have an impact on the proficiency of the adult populations in Round 1 countries/economies compared to that of adults in Round 2 countries/economies. However, data were collected at different points in the economic cycle in the two rounds; this may have some effect on the relationships observed between proficiency and labour market outcomes and jobs characteristics, in particular, in the countries/economies in the two different rounds.
Notes
* See note 1 under Figure 1.
** The data from the Russian Federation are preliminary and may be subject to change. Readers should note that the
sample for the Russian Federation does not include the population of the Moscow municipal area. The data published,
therefore, do not represent the entire resident population aged 16-65 in Russia but rather the population of Russia
excluding the population residing in the Moscow municipal area.
More detailed information regarding the data from the Russian Federation as well as that of other countries can be found
in the Technical Report of the Survey of Adult Skills, Second Edition (OECD, forthcoming).
References and further reading
OECD (forthcoming), Technical Report of the Survey of Adult Skills, Second Edition.
OECD (2016a), Skills Matter: Further Results from the Survey of Adult Skills, OECD Skills Studies, OECD Publishing, Paris, http://dx.doi.org/10.1787/9789264258051-en.
OECD (2016b), The Survey of Adult Skills: Reader's Companion, Second Edition, OECD Skills Studies, OECD Publishing, Paris, http://dx.doi.org/10.1787/9789264258075-en.
OECD (2016c), Survey of Adult Skills (PIAAC) (Database 2012, 2015), www.oecd.org/site/piaac/public
dataandanalysis.htm.
This work is published under the responsibility of the Secretary-General of the OECD. The opinions expressed and
arguments employed herein do not necessarily reflect the official views of OECD member countries.
This document and any map included herein are without prejudice to the status of or sovereignty over any territory, to the
delimitation of international frontiers and boundaries and to the name of any territory, city or area.
You can copy, download or print OECD content for your own use, and you can include excerpts from OECD publications,
databases and multimedia products in your own documents, presentations, blogs, websites and teaching materials,
provided that suitable acknowledgment of OECD as source and copyright owner is given. All requests for public or
commercial use and translation rights should be submitted to [email protected]. Requests for permission to photocopy
portions of this material for public or commercial use shall be addressed directly to the Copyright Clearance Center (CCC) at
[email protected] or the Centre français d’exploitation du droit de copie (CFC) at [email protected].

Singapore – Country Note – Skills Matter: Further Results from the Survey of Adult Skills
© OECD 2016 15
Description of proficiency levels in literacy and numeracy
Level Score range
Literacy Numeracy
Below Level
1
Below 176 points
Tasks at this level require the respondent to read brief texts on familiar topics and locate a single piece of specific information. There is seldom any competing information in the text. Only basic vocabulary knowledge is required, and the reader is not required to understand the structure of sentences or paragraphs or make use of other text features.
Tasks at this level require the respondent to carry out simple processes such as counting, sorting, performing basic arithmetic operations with whole numbers or money, or recognising common spatial representations.
1 176 to less than 226
points
Tasks at this level require the respondent to read relatively short digital or print texts to locate a single piece of information that is identical to or synonymous with the information given in the question or directive. Knowledge and skill in recognising basic vocabulary, determining the meaning of sentences, and reading paragraphs of text is expected.
Tasks at this level require the respondent to carry out basic mathematical processes in common, concrete contexts where the mathematical content is explicit. Tasks usually require one-step or simple processes involving counting; sorting; performing basic arithmetic operations; and identifying elements of simple or common graphical or spatial representations.
2 226 to less than 276
points
Tasks at this level require the respondent to make matches between the text, either digital or printed, and information, and may require paraphrasing or low-level inferences.
Tasks at this level require the application of two or more steps or processes involving calculation with whole numbers and common decimals, percents and fractions; simple measurement and spatial representation; estimation; and interpretation of relatively simple data and statistics in texts, tables and graphs.
3 276 to less than 326
points
Texts at this level are often dense or lengthy. Understanding text and rhetorical structures is often required, as is navigating complex digital texts.
Tasks at this level require the application of number sense and spatial sense; recognising and working with mathematical relationships, patterns, and proportions expressed in verbal or numerical form; and interpreting data and statistics in texts, tables and graphs.
4 326 to less than 376
points
Tasks at this level often require the respondent to perform multiple-step operations to integrate, interpret, or synthesise information from complex or lengthy texts. Many tasks require identifying and understanding one or more specific, non-central idea(s) in the text in order to interpret or evaluate subtle evidence-claim or persuasive discourse relationships.
Tasks at this level require analysis and more complex reasoning about quantities and data; statistics and chance; spatial relationships; and change, proportions and formulas. They may also require understanding arguments or communicating well-reasoned explanations for answers or choices.
5 Equal to or higher
than 376 points
Tasks at this level may require the respondent to search for and integrate information across multiple, dense texts; construct syntheses of similar and contrasting ideas or points of view; or evaluate evidence based arguments. They often require respondents to be aware of subtle, rhetorical cues and to make high-level inferences or use specialised background knowledge.
Tasks at this level may require the respondent to integrate multiple types of mathematical information where considerable translation or interpretation is required; draw inferences; develop or work with mathematical arguments or models; and critically reflect on solutions or choices.

Singapore – Country Note – Skills Matter: Further Results from the Survey of Adult Skills
16 © OECD 2016
Description of proficiency levels in problem solving in technology-rich environments
Level Score range The types of tasks completed successfully at each level of proficiency
No computer experience
Not applicable
Adults in this category reported having no prior computer experience; therefore, they did not take part in the computer-based assessment but took the paper-based version of the assessment, which does not include the problem solving in technology-rich environment domain.
Failed ICT core Not applicable
Adults in this category had prior computer experience but failed the ICT core test, which assesses basic ICT skills, such as the capacity to use a mouse or scroll through a web page, needed to take the computer-based assessment. Therefore, they did not take part in the computer-based assessment, but took the paper-based version of the assessment, which does not include the problem solving in technology-rich environment domain.
“Opted out” of taking
computer-based
assessment
Not applicable
Adults in this category opted to take the paper-based assessment without first taking the ICT core assessment, even if they reported some prior experience with computers. They also did not take part in the computer-based assessment, but took the paper-based version of the assessment, which does not include the problem solving in technology-rich environment domain.
Below Level 1 Below 241 points
Tasks are based on well-defined problems involving the use of only one function within a generic interface to meet one explicit criterion without any categorical or inferential reasoning, or transforming of information. Few steps are required and no sub-goal has to be generated.
1 241 to less than 291
points
At this level, tasks typically require the use of widely available and familiar technology applications, such as e-mail software or a web browser. There is little or no navigation required to access the information or commands required to solve the problem. The tasks involve few steps and a minimal number of operators. Only simple forms of reasoning, such as assigning items to categories, are required; there is no need to contrast or integrate information.
2 291 to less than 341
points
At this level, tasks typically require the use of both generic and more specific technology applications. For instance, the respondent may have to make use of a novel online form. Some navigation across pages and applications is required to solve the problem. The task may involve multiple steps and operators. The goal of the problem may have to be defined by the respondent, though the criteria to be met are explicit.
3 Equal to or higher than 341 points
At this level, tasks typically require the use of both generic and more specific technology applications. Some navigation across pages and applications is required to solve the problem. The task may involve multiple steps and operators. The goal of the problem may have to be defined by the respondent, and the criteria to be met may or may not be explicit. Integration and inferential reasoning may be needed to a large extent.
Singapore – Country Note – Skills Matter: Further Results from the Survey of Adult Skills
© OECD 2016 17
Contacts: Andreas Schleicher Director Directorate for Education and Skills Email: [email protected] Telephone: +33 6 07 38 54 64 Stefano Scarpetta Director Directorate for Employment Labour and Social Affairs Email: [email protected] Telephone: +33 1 45 24 19 88 Marco Paccagnella Analyst, Skills Beyond School Division Directorate for Education and Skills Email: [email protected] Telephone: +33 1 45 24 99 40
For more information on the Survey of Adult Skills (PIAAC) visit:
www.oecd.org/site/piaac