Embed Size (px)
Citation preview
1
SMART WATER – SINGAPORE CASE STUDYPuah Aik NumDeputy Director
Technology and Water Quality OfficePUB, Singapore
2
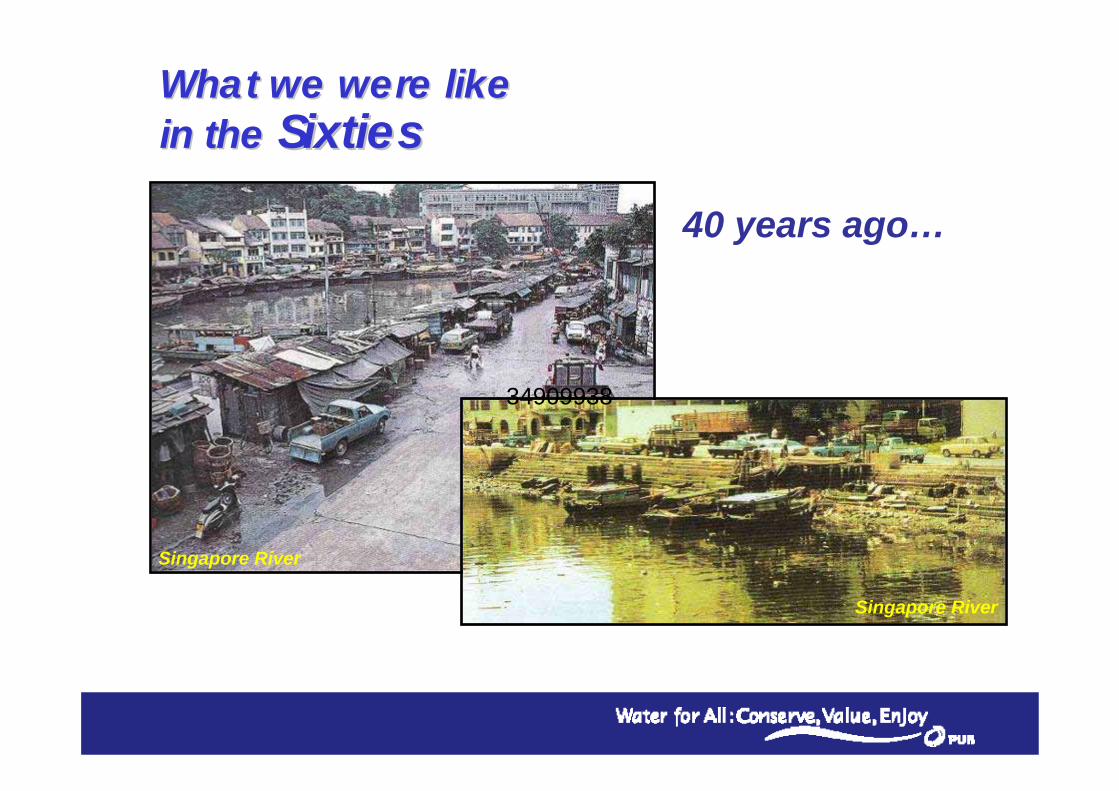
40 years ago…
What we were like What we were like in thein the SixtiesSixties
Singapore River
Singapore River
34909938

3
40 years ago…
What we were like What we were like in thein the SixtiesSixties
Singapore River
Singapore River
34909938
4
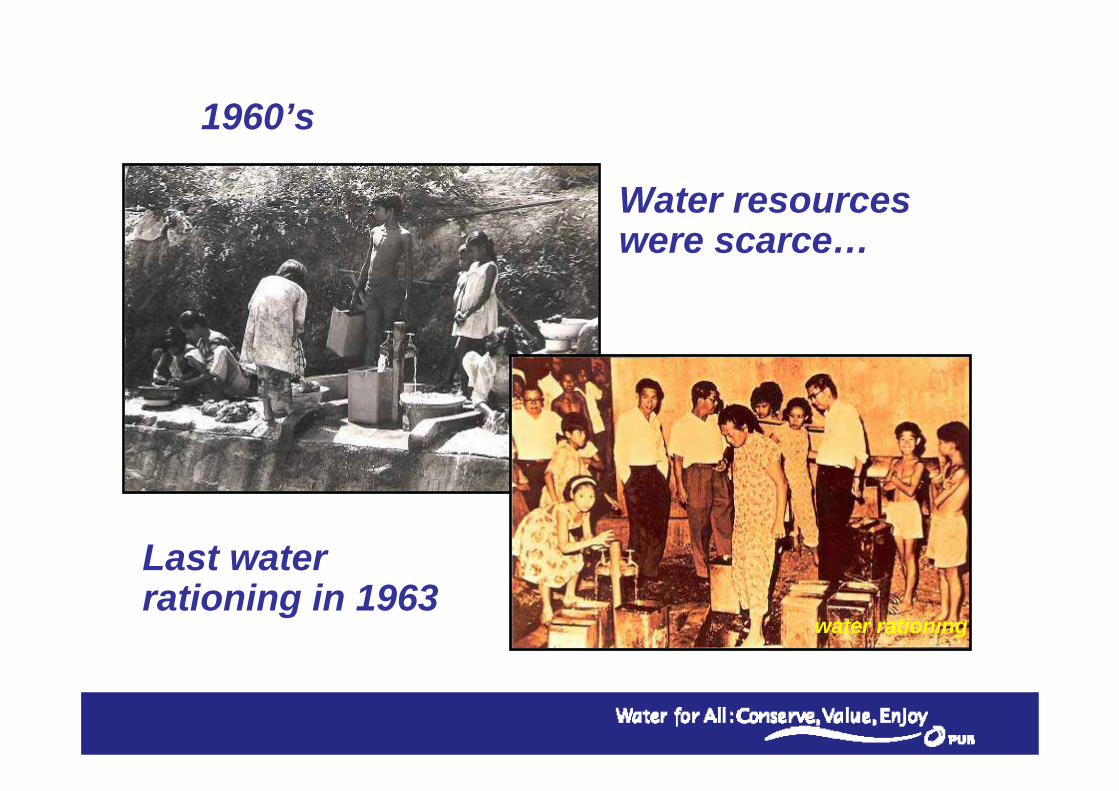
Water resources were scarce…
1960’s
Last water rationing in 1963
water rationing
5
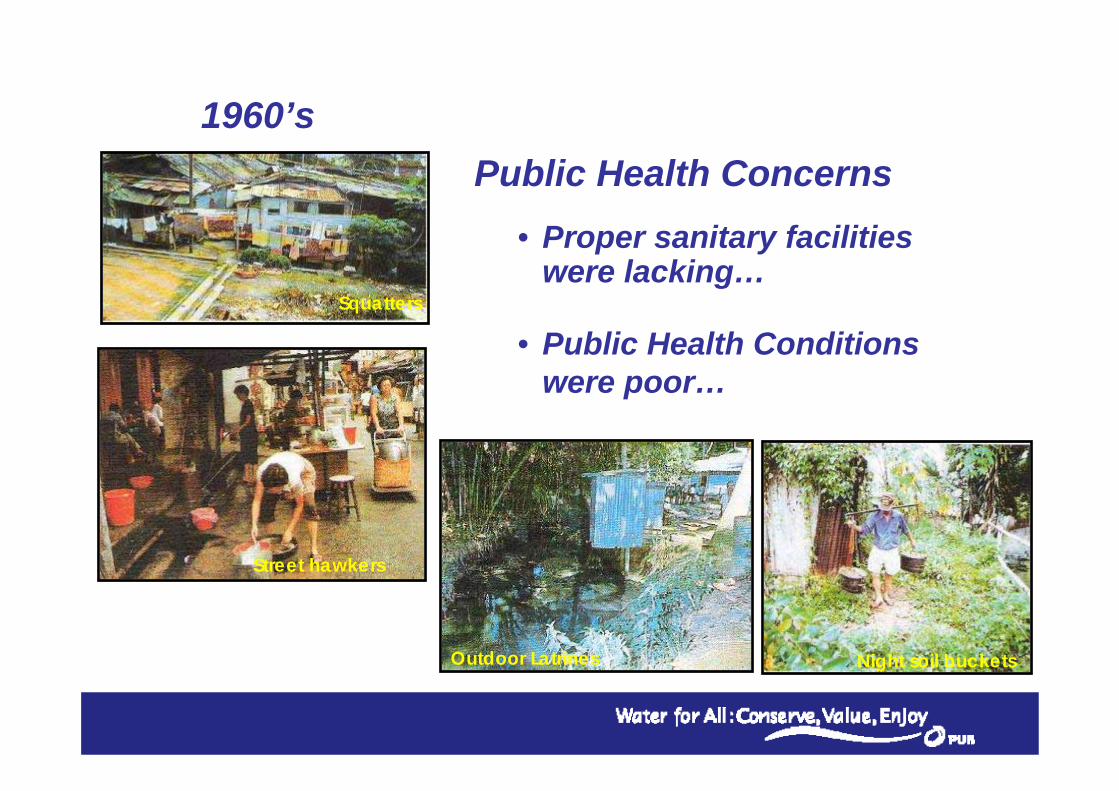
Public Health Concerns1960’s
• Public Health Conditions were poor…
• Proper sanitary facilities were lacking…
Street hawkers
Night soil bucketsOutdoor Latrines
Squatters
6
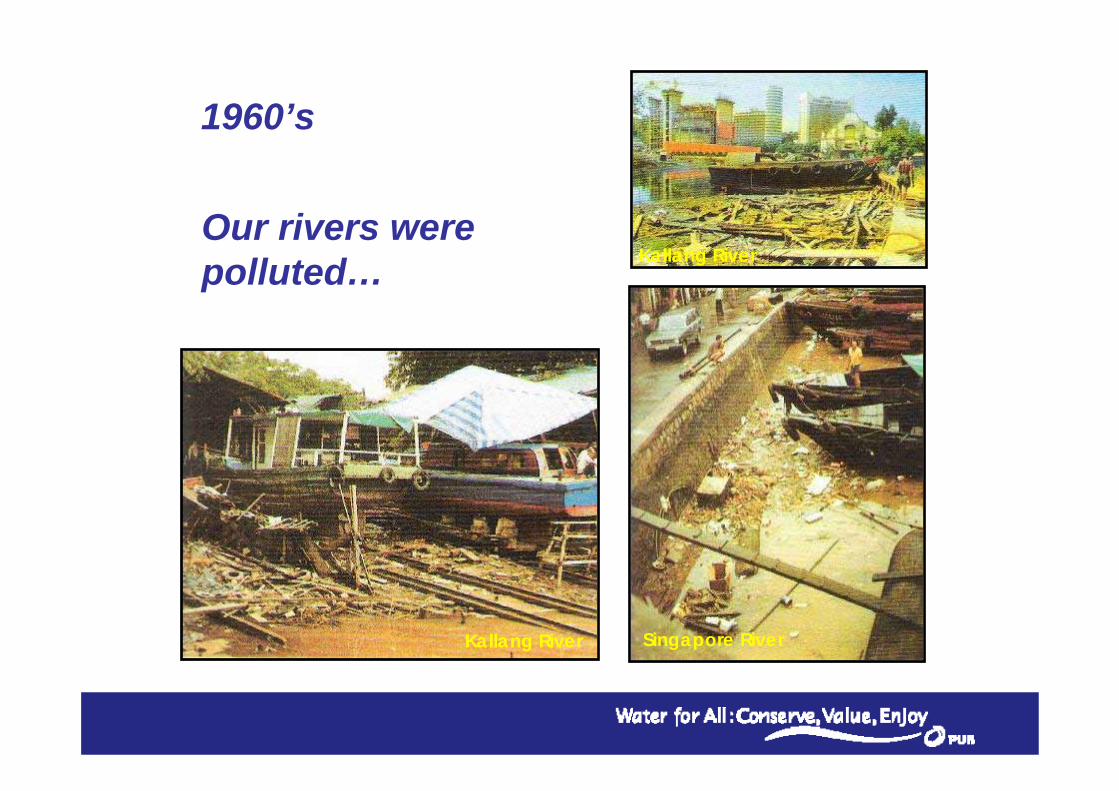
Our rivers were polluted…
1960’s
Kallang River Singapore River
Kallang River
7
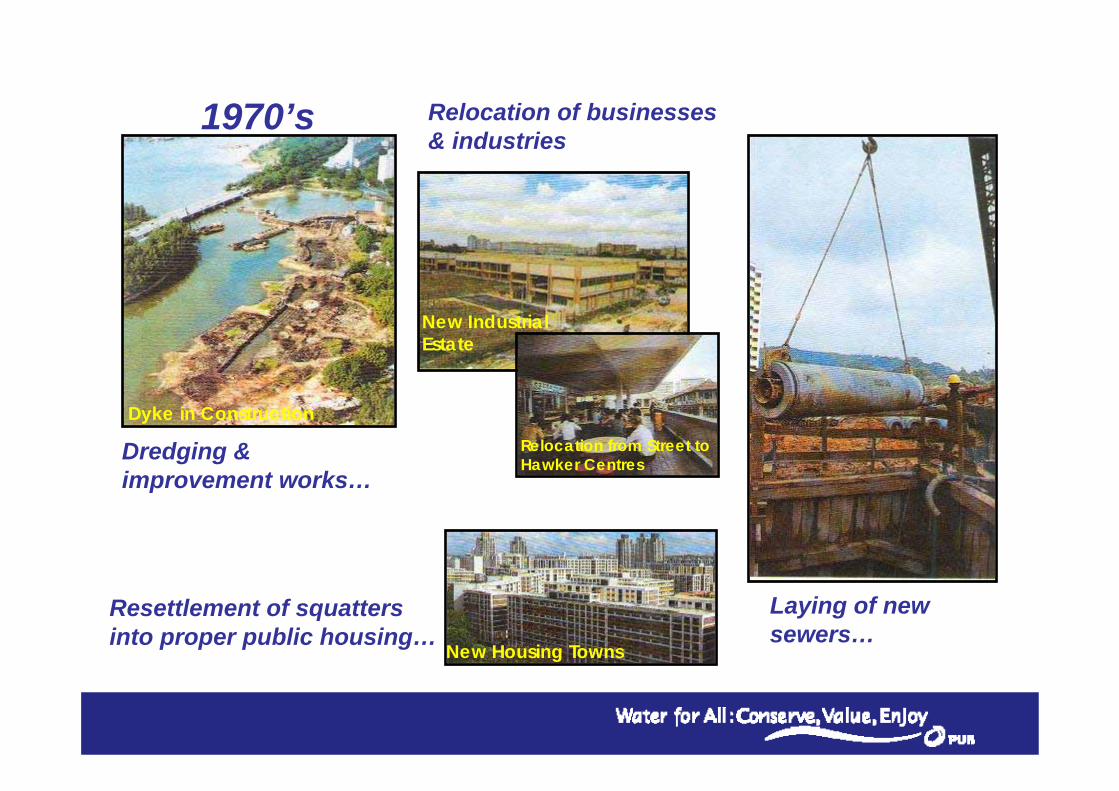
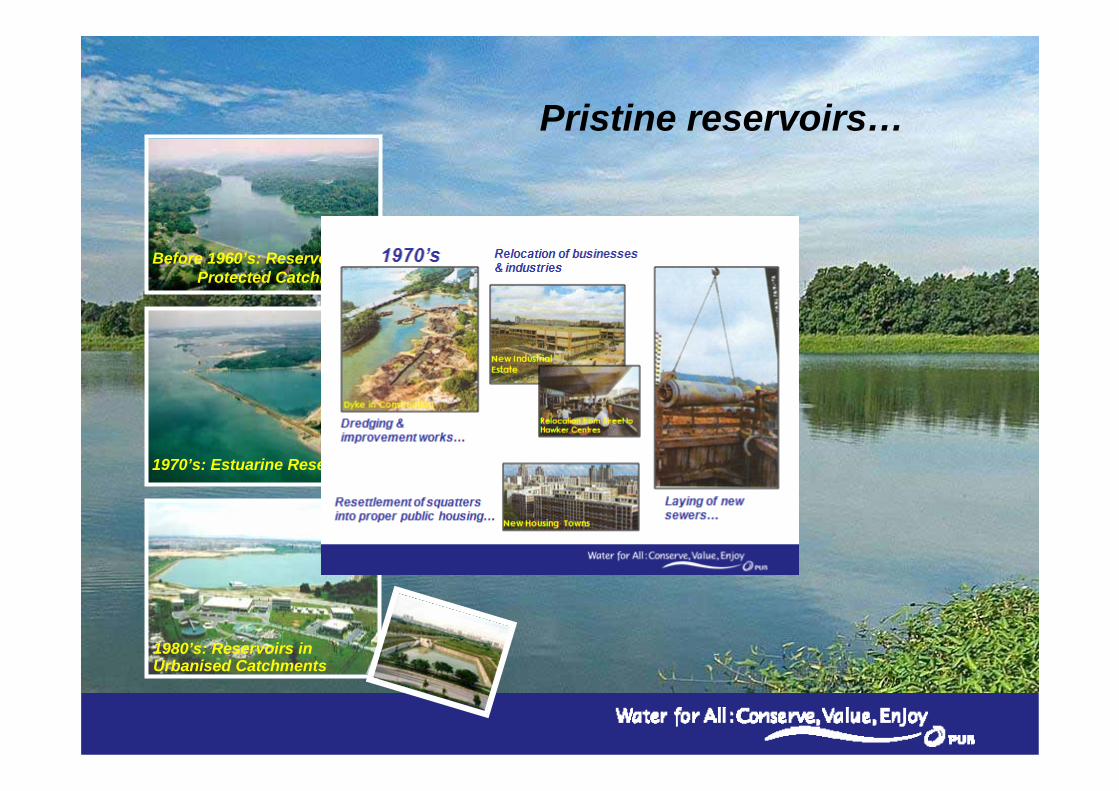
Dredging & improvement works…
Laying of new sewers…
Resettlement of squatters into proper public housing…
1970’s Relocation of businesses & industries
Dyke in Construction
New Industrial Estate
Relocation from Street to Hawker Centres
New Housing Towns
8
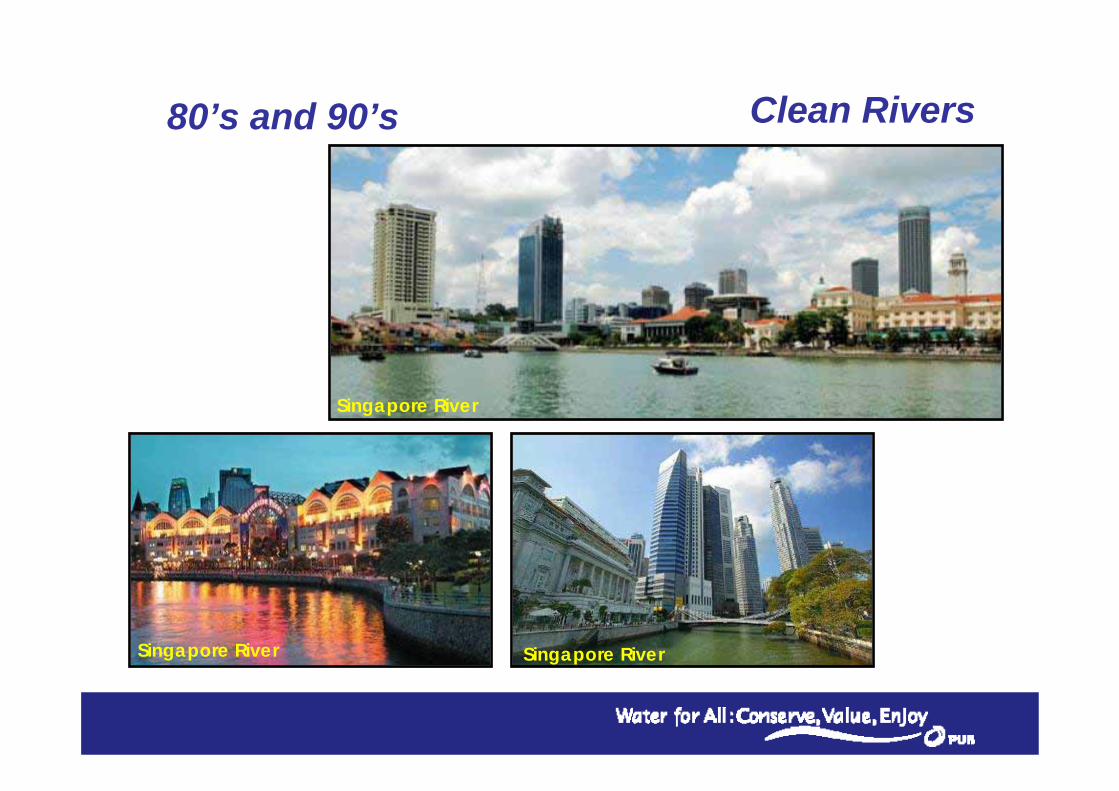
Clean Rivers80’s and 90’s
Singapore River Singapore River
Singapore River
9
Pristine reservoirs…
Before 1960’s: Reservoirs inProtected Catchments
1970’s: Estuarine Reservoirs
1980’s: Reservoirs in Urbanised Catchments
10
11
SINGAPORE WATER CHALLENGESSINGAPORE WATER CHALLENGES
12
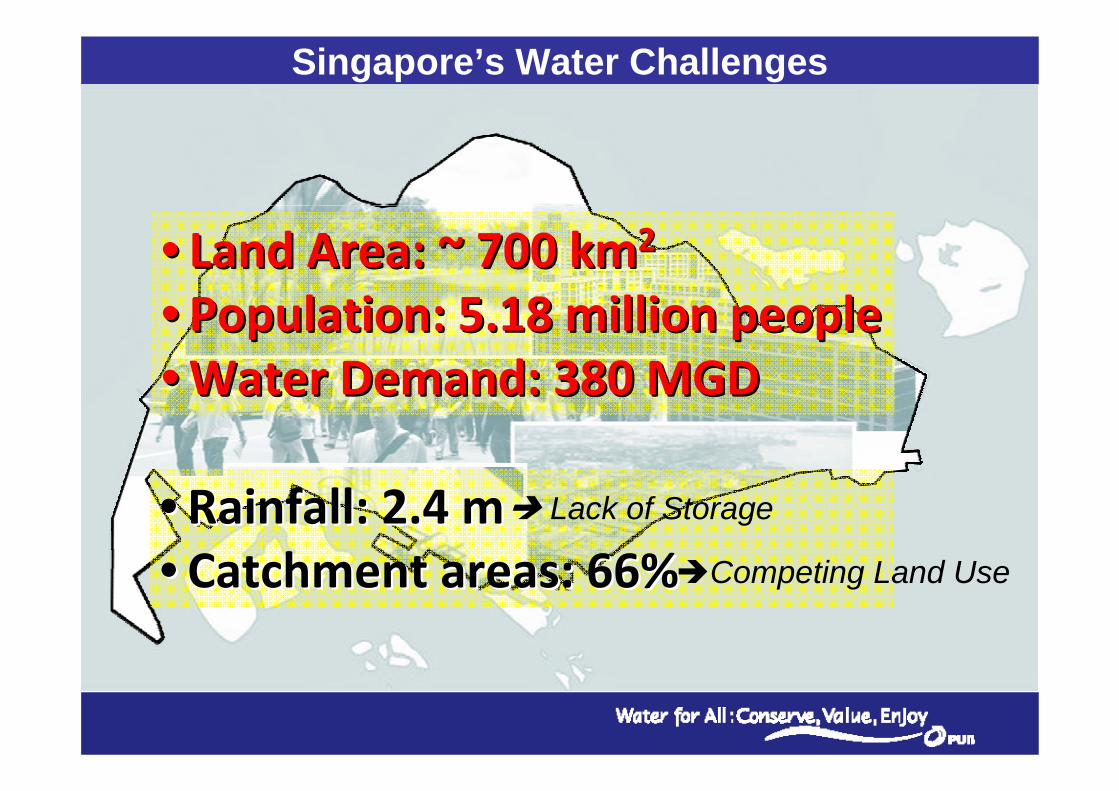
Singapore’s Water Challenges
SingaporeSingapore
•• Land Area: ~ 700 kmLand Area: ~ 700 km22
•• Population: 5.18 million peoplePopulation: 5.18 million people•• Water Demand: 380 MGD Water Demand: 380 MGD
•• Rainfall: 2.4 m Rainfall: 2.4 m •• Catchment areas: 66%Catchment areas: 66%
Lack of Storage
Competing Land Use
13
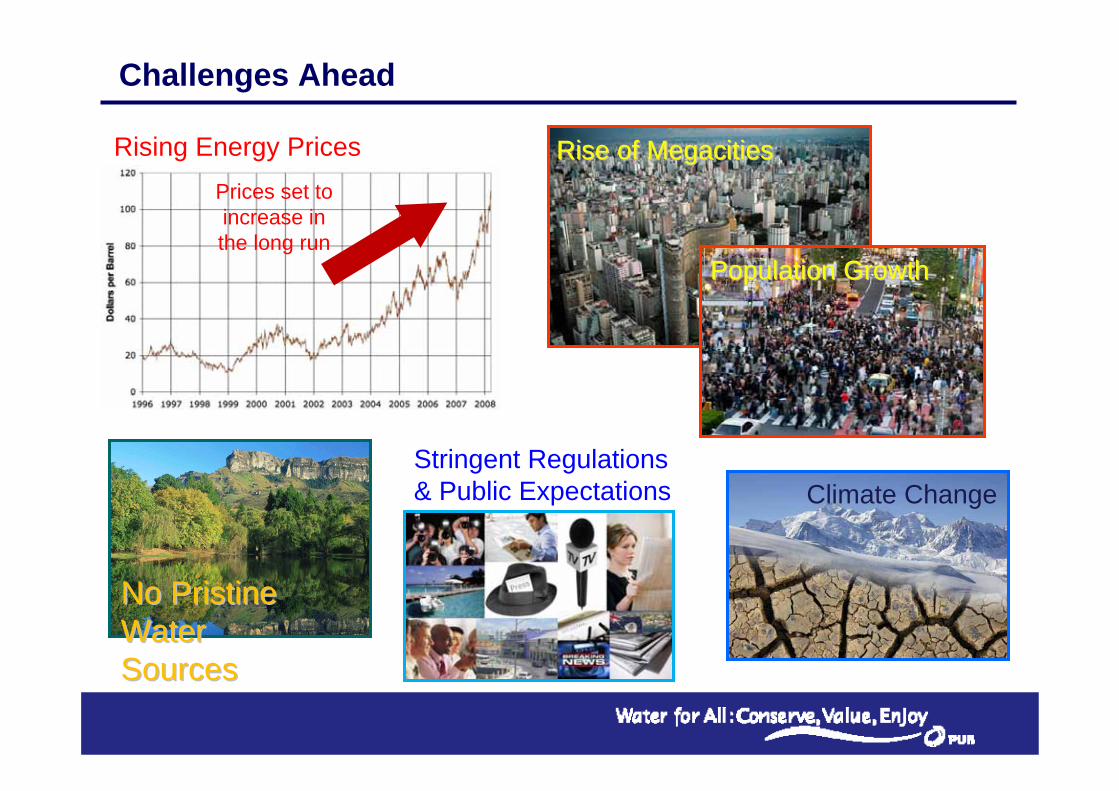
Rising Energy Prices
Stringent Regulations& Public Expectations
Prices set to increase in the long run
Population Growth Population Growth
Rise of MegacitiesRise of Megacities
Climate Change
No Pristine No Pristine Water Water SourcesSources
Challenges Ahead
14
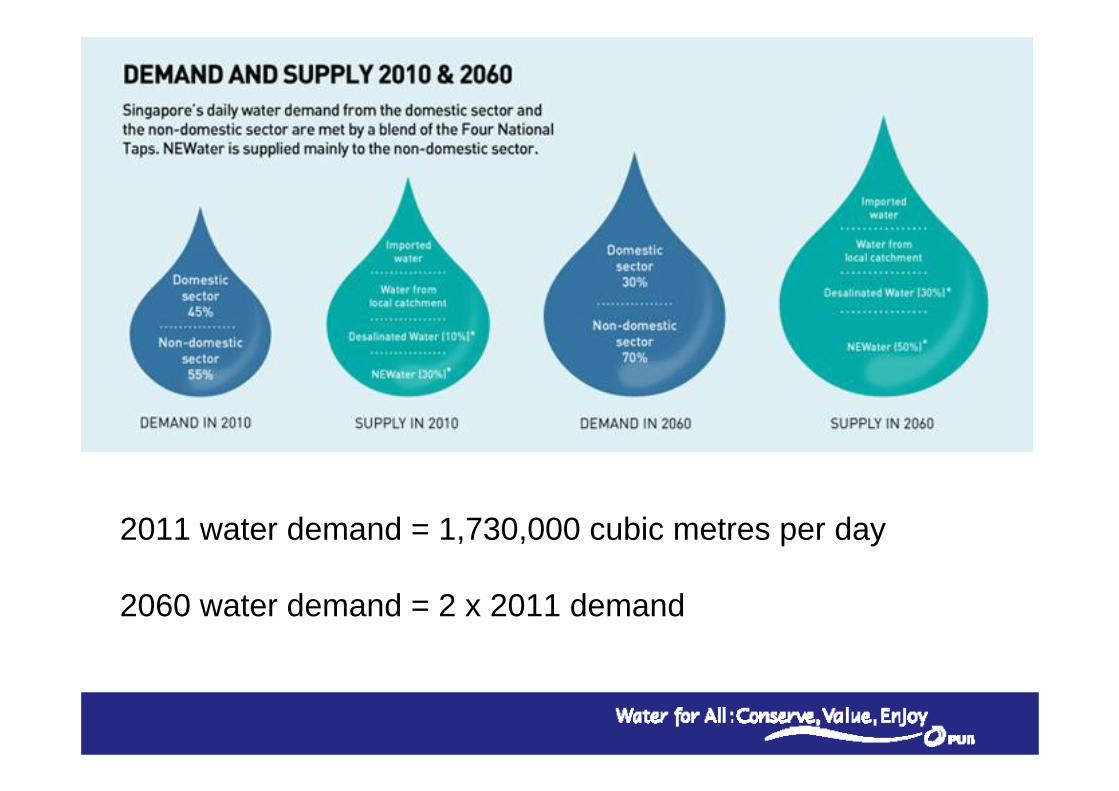
2011 water demand = 1,730,000 cubic metres per day
2060 water demand = 2 x 2011 demand
15
Integrated Water Resource ManagementIntegrated Water Resource Management
16
17
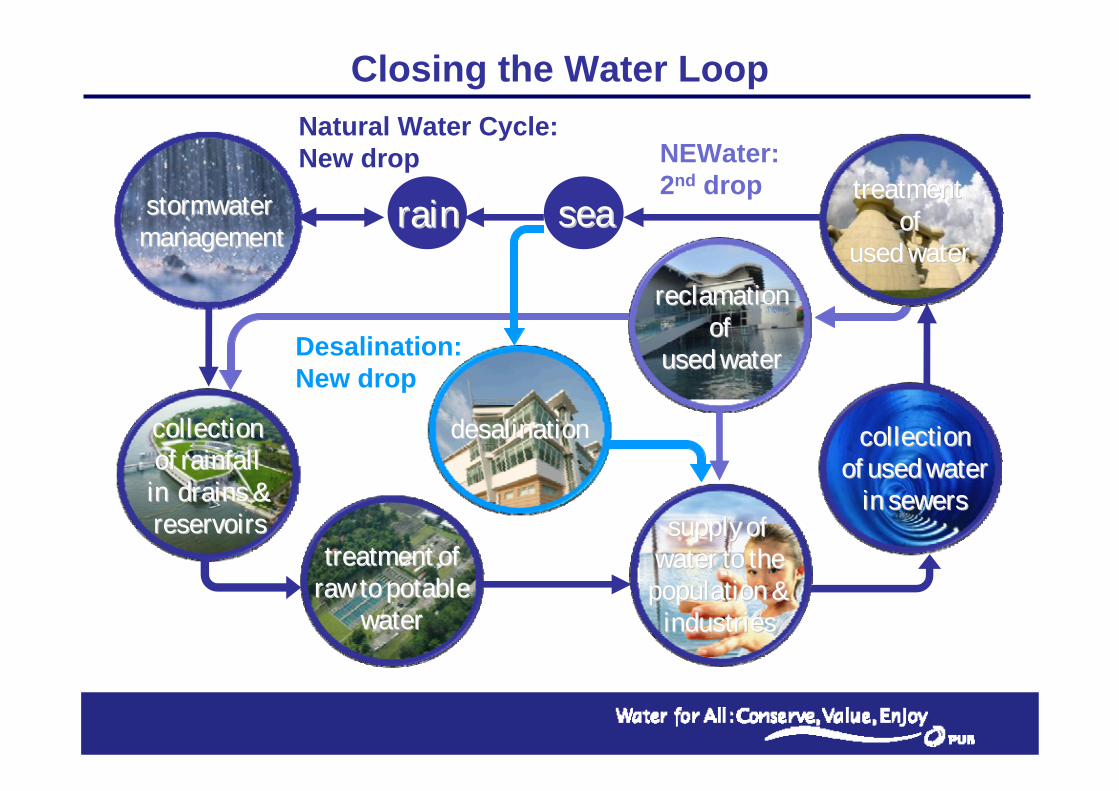
seasearainrainstormwater stormwater managementmanagement
collection collection of rainfall of rainfall
in drains & in drains & reservoirsreservoirs
treatment oftreatment ofraw to potableraw to potable
waterwater
reclamationreclamationof of
used waterused water
collectioncollectionof used waterof used water
in sewersin sewerssupply of supply of
water to thewater to thepopulation & population &
industriesindustries
treatment treatment ofof
used waterused water
desalinationdesalination
Closing the Water LoopNatural Water Cycle:New drop NEWater:
2nd drop
Desalination: New drop
18
seasearainrainstormwater stormwater managementmanagement
collection collection of rainfall of rainfall
in drains & in drains & reservoirsreservoirs
treatment oftreatment ofraw to potableraw to potable
waterwater
reclamationreclamationof of
used waterused water
collectioncollectionof used waterof used water
in sewersin sewers
supply of supply of water to thewater to the
population & population & industriesindustries
treatment treatment ofof
used waterused water
desalinationdesalinationdesalinationdesalination
collection collection of rainfall of rainfall
in drains & in drains & reservoirsreservoirs
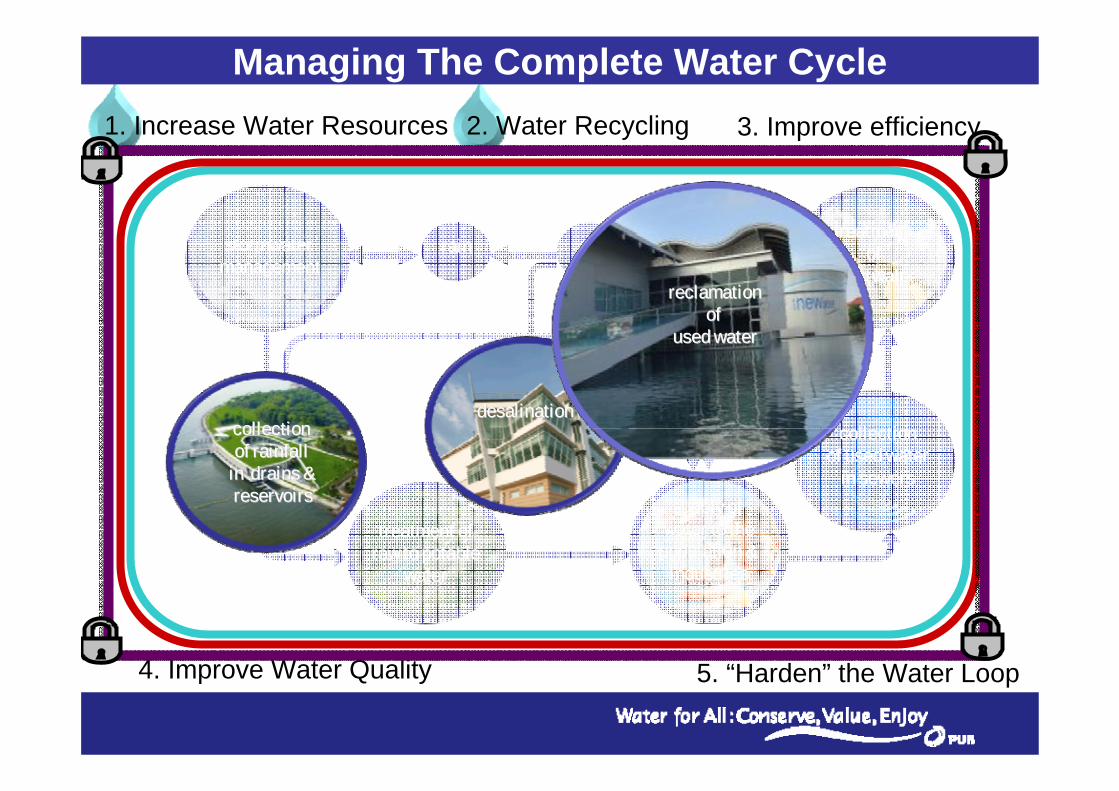
1. Increase Water Resources
reclamationreclamationof of
used waterused water
2. Water Recycling 3. Improve efficiency
4. Improve Water Quality 5. “Harden” the Water Loop
Managing The Complete Water Cycle
19
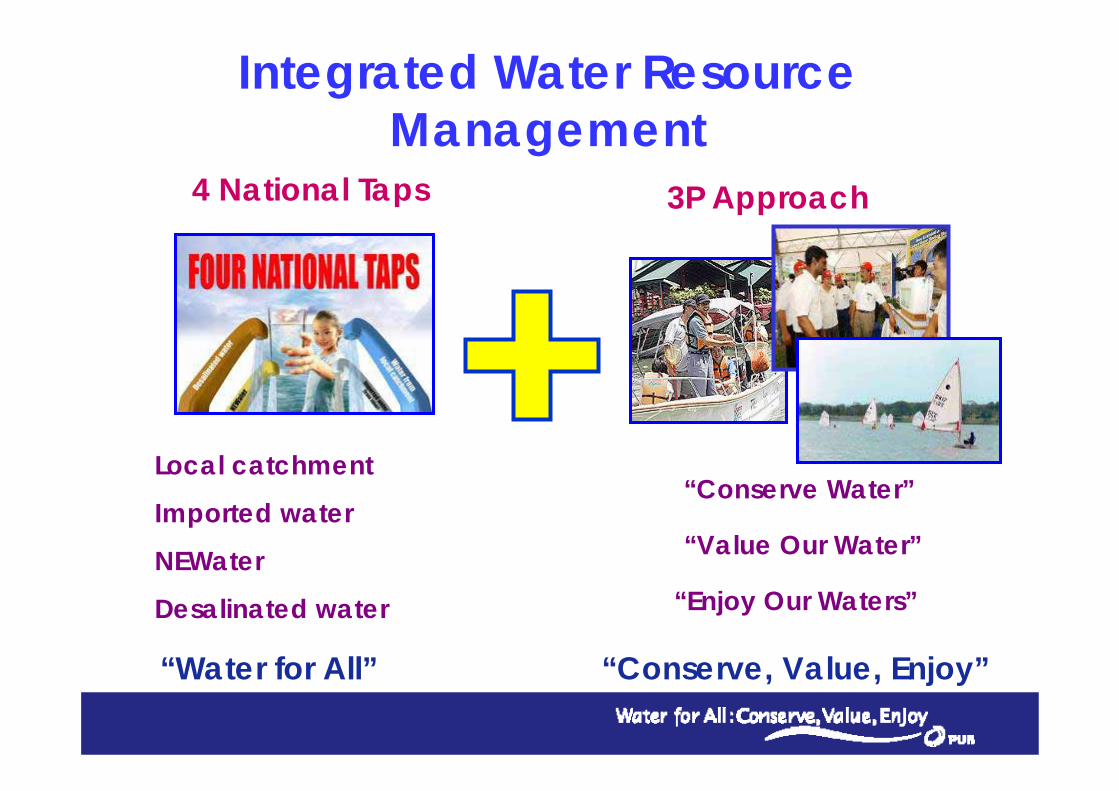
Integrated Water Resource Management
Local catchment
Imported water
NEWater
Desalinated water
4 National Taps
“Water for All”
3P Approach
“Conserve Water”
“Value Our Water”
“Enjoy Our Waters”
“Conserve, Value, Enjoy”
20
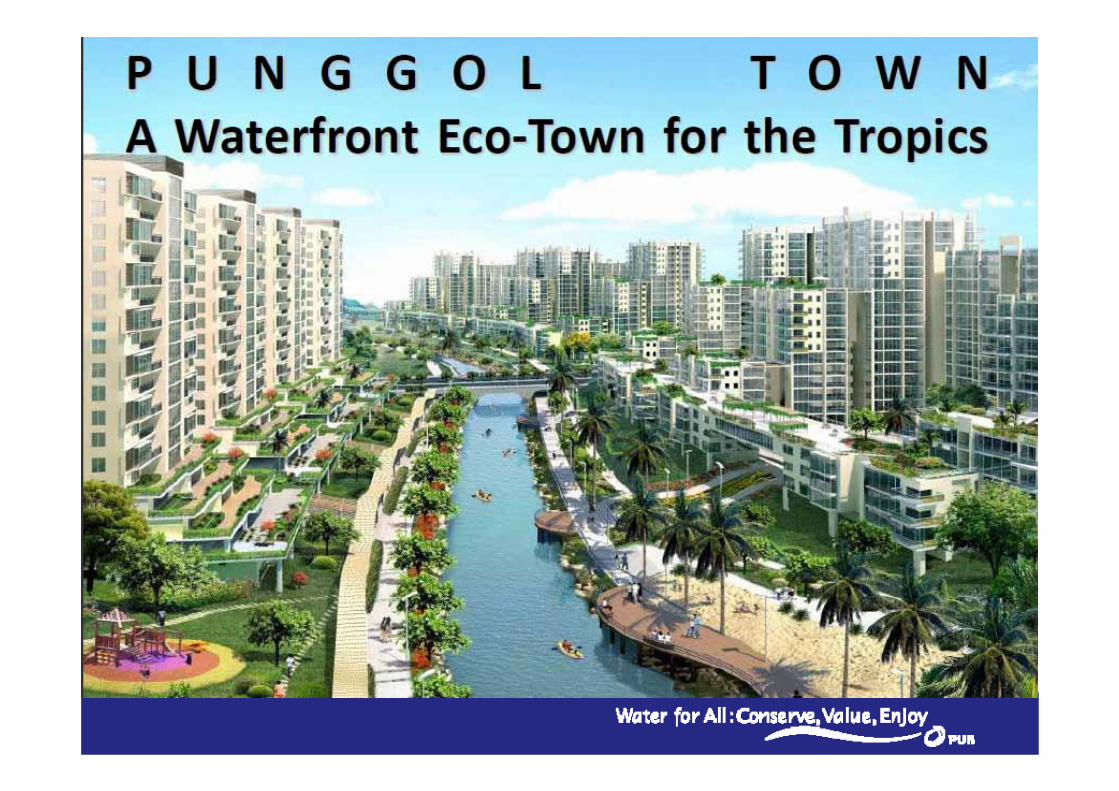
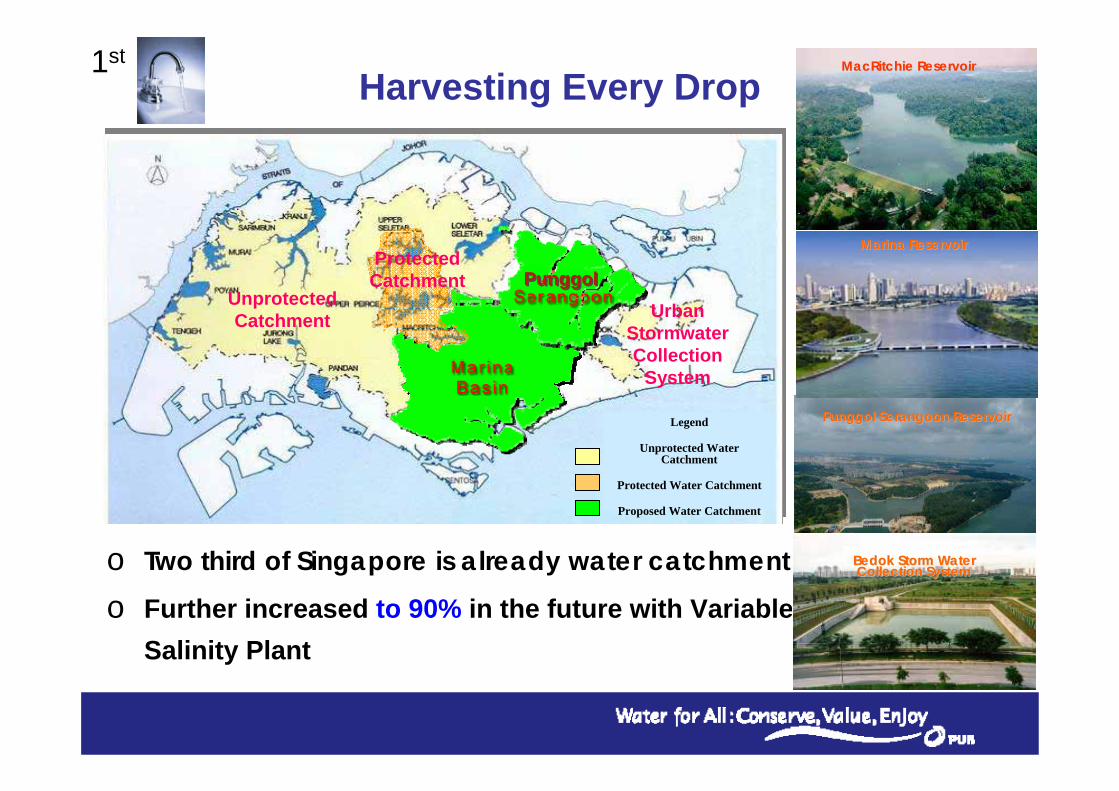
PunggolPunggol
Legend
Unprotected Water Catchment
Protected Water Catchment
Proposed Water Catchment
Protected Catchment
Unprotected Catchment Urban
Stormwater Collection
System
o Two third of Singapore is already water catchment
o Further increased to 90% in the future with Variable Salinity Plant
MacRitchie ReservoirMacRitchie Reservoir
Marina ReservoirMarina Reservoir
Punggol Serangoon ReservoirPunggol Serangoon Reservoir
Harvesting Every Drop1st
Bedok Storm Water Bedok Storm Water Collection SystemCollection System
21
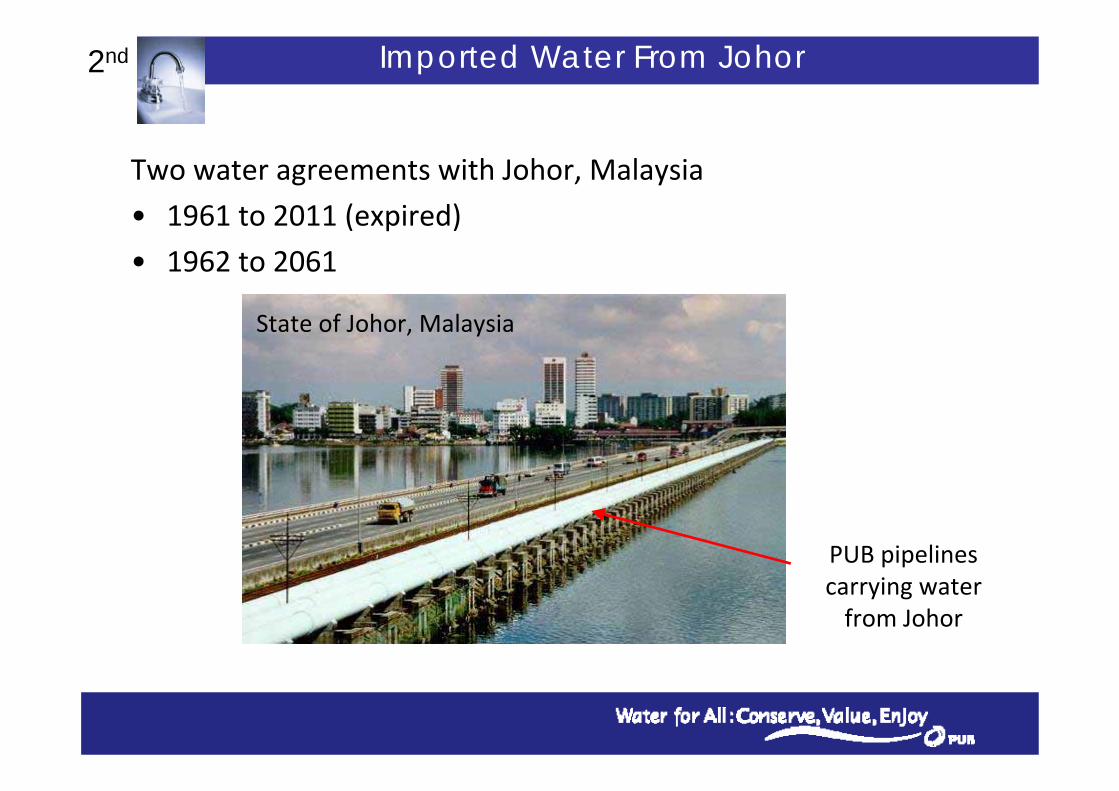
Two water agreements with Johor, Malaysia
• 1961 to 2011 (expired)
• 1962 to 2061
State of Johor, Malaysia
PUB pipelines carrying water from Johor
Imported Water From Johor2nd
22
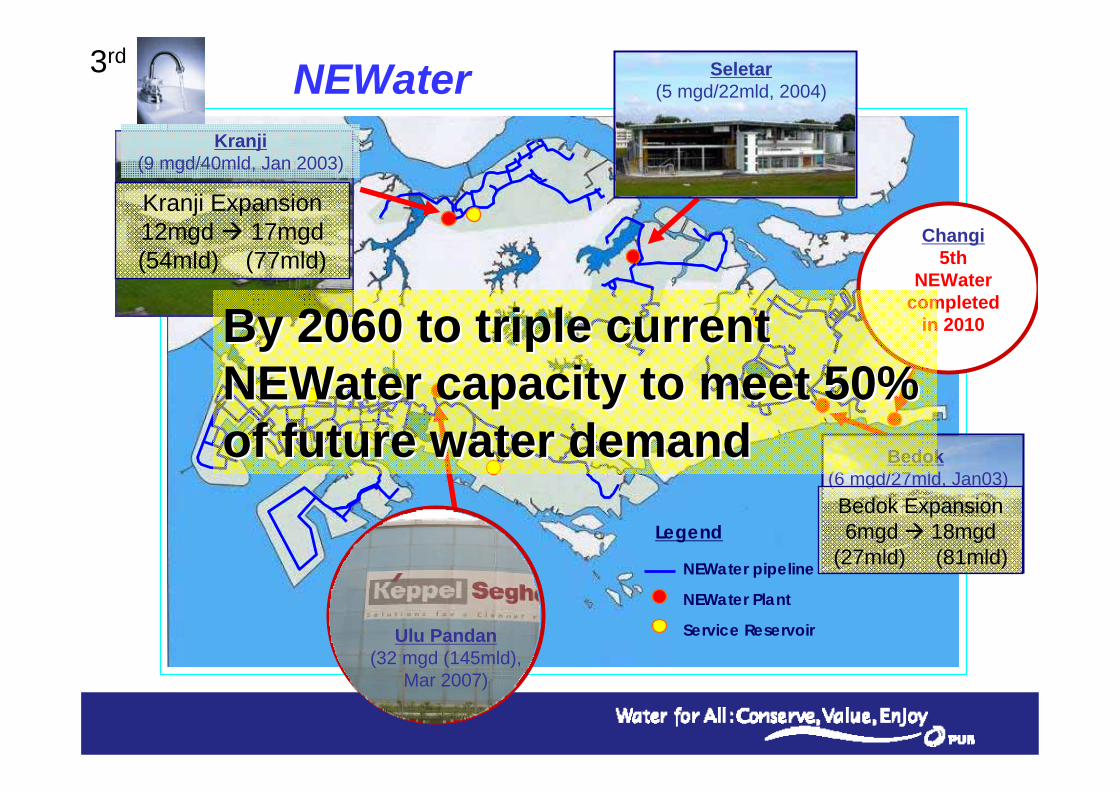
NEWater
NEWater pipeline
NEWater Plant
Service Reservoir
Legend
Kranji(9 mgd/40mld, Jan 2003)
Seletar(5 mgd/22mld, 2004)
Bedok(6 mgd/27mld, Jan03)
Ulu Pandan(32 mgd (145mld),
Mar 2007)
Kranji Expansion12mgd 17mgd(54mld) (77mld)
Bedok Expansion6mgd 18mgd
(27mld) (81mld)
Changi5th
NEWater completed
in 2010By 2060 to triple current By 2060 to triple current NEWater capacity to meet 50% NEWater capacity to meet 50% of future water demandof future water demand
3rd
23
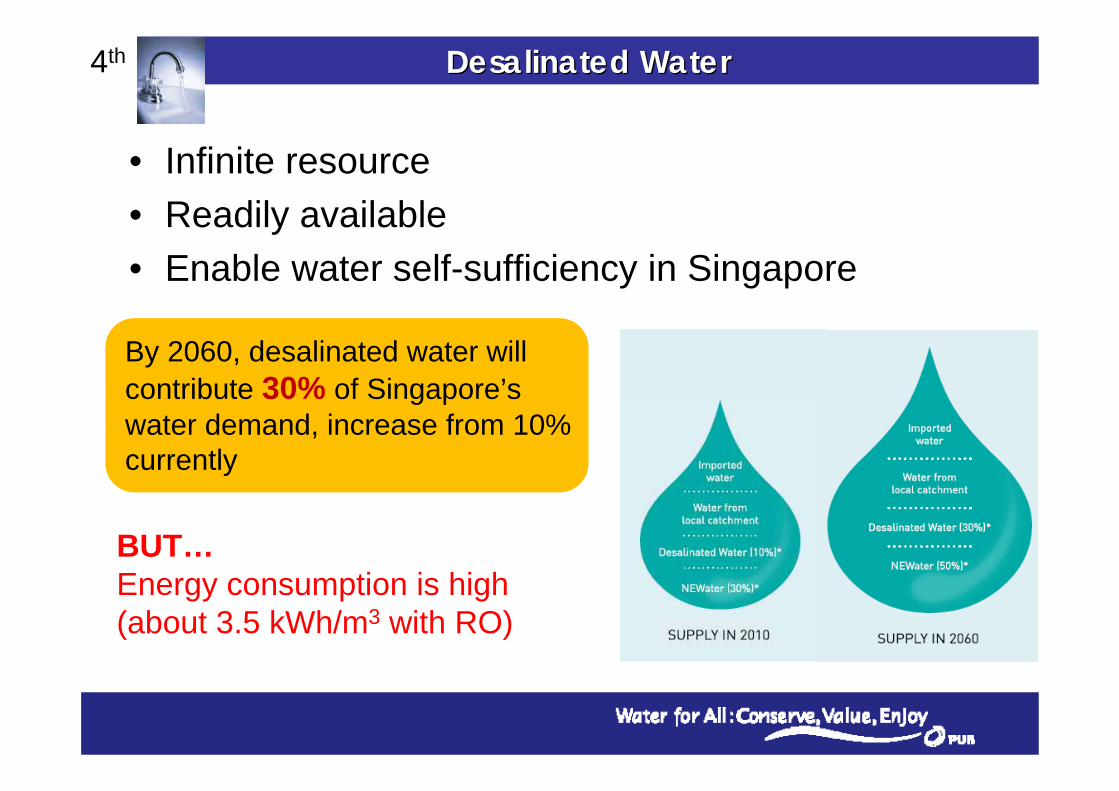
• Infinite resource• Readily available• Enable water self-sufficiency in Singapore
By 2060, desalinated water will contribute 30% of Singapore’s water demand, increase from 10% currently
BUT…Energy consumption is high (about 3.5 kWh/m3 with RO)
Desalinated WaterDesalinated Water4th
24
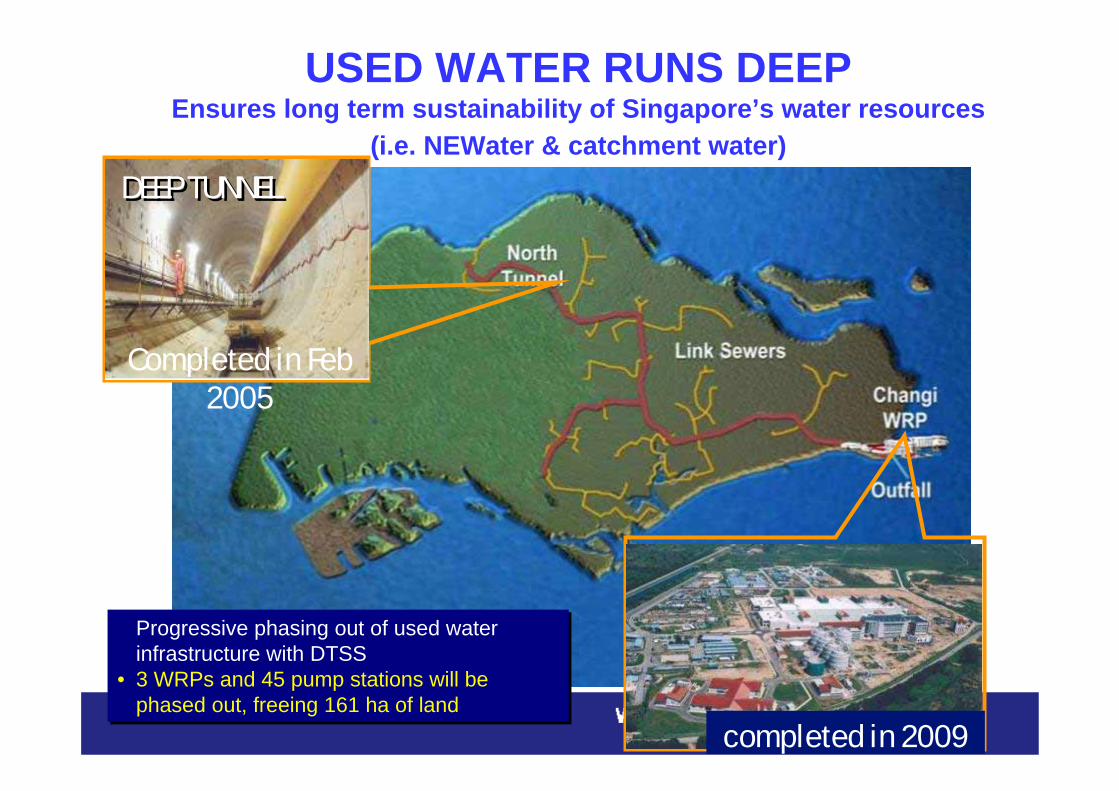
USED WATER RUNS DEEPEnsures long term sustainability of Singapore’s water resources
(i.e. NEWater & catchment water)
Progressive phasing out of used water infrastructure with DTSS
• 3 WRPs and 45 pump stations will be phased out, freeing 161 ha of land
Progressive phasing out of used water infrastructure with DTSS
• 3 WRPs and 45 pump stations will be phased out, freeing 161 ha of land
Completed in Feb 2005
DEEP TUNNELDEEP TUNNEL
completed in 2009

25
Integrated Water Resource Management
Local catchment
Imported water
NEWater
Desalinated water
4 National Taps
“Water for All”
3P Approach
“Conserve Water”
“Value Our Water”
“Enjoy Our Waters”
“Conserve, Value, Enjoy”
26
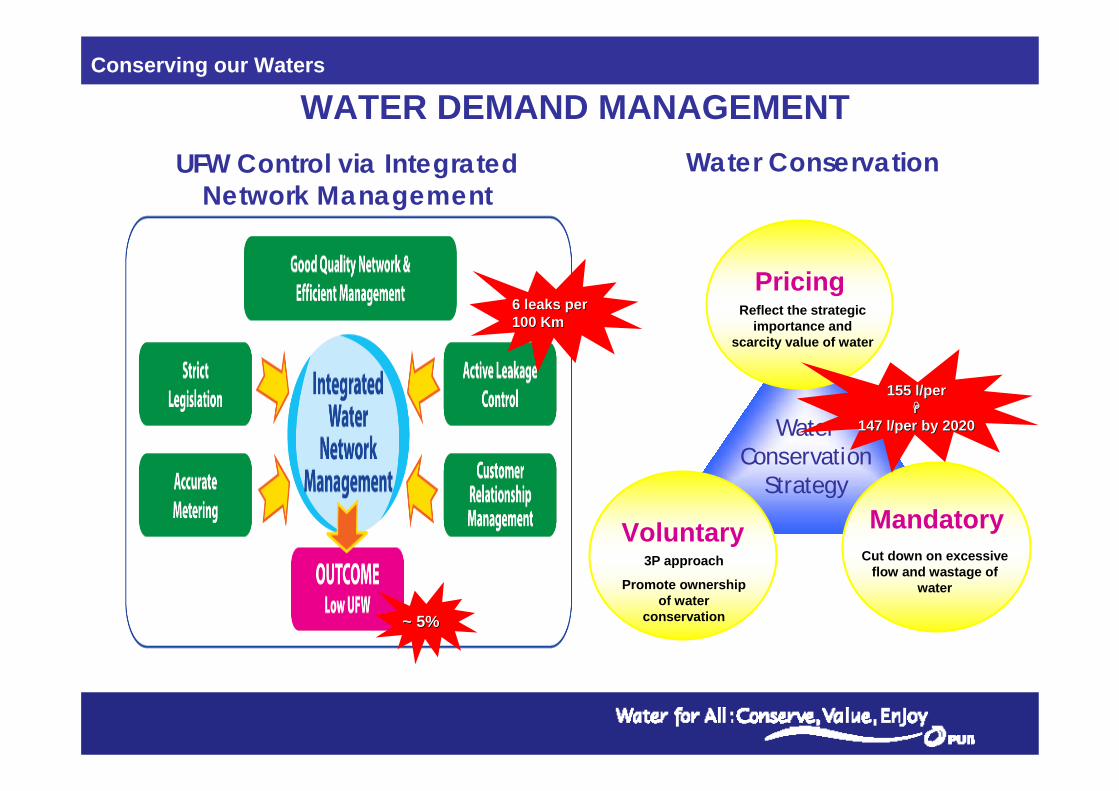
~ 5%~ 5%
6 leaks per 6 leaks per 100 Km100 Km
Water Conservation
Water Conservation
Strategy
PricingReflect the strategic
importance and scarcity value of water
Voluntary3P approach
Promote ownership of water
conservation
MandatoryCut down on excessive
flow and wastage of water
Conserving our Waters
UFW Control via Integrated Network Management
WATER DEMAND MANAGEMENT
155 l/per155 l/per
147 l/per by 2020147 l/per by 2020
27
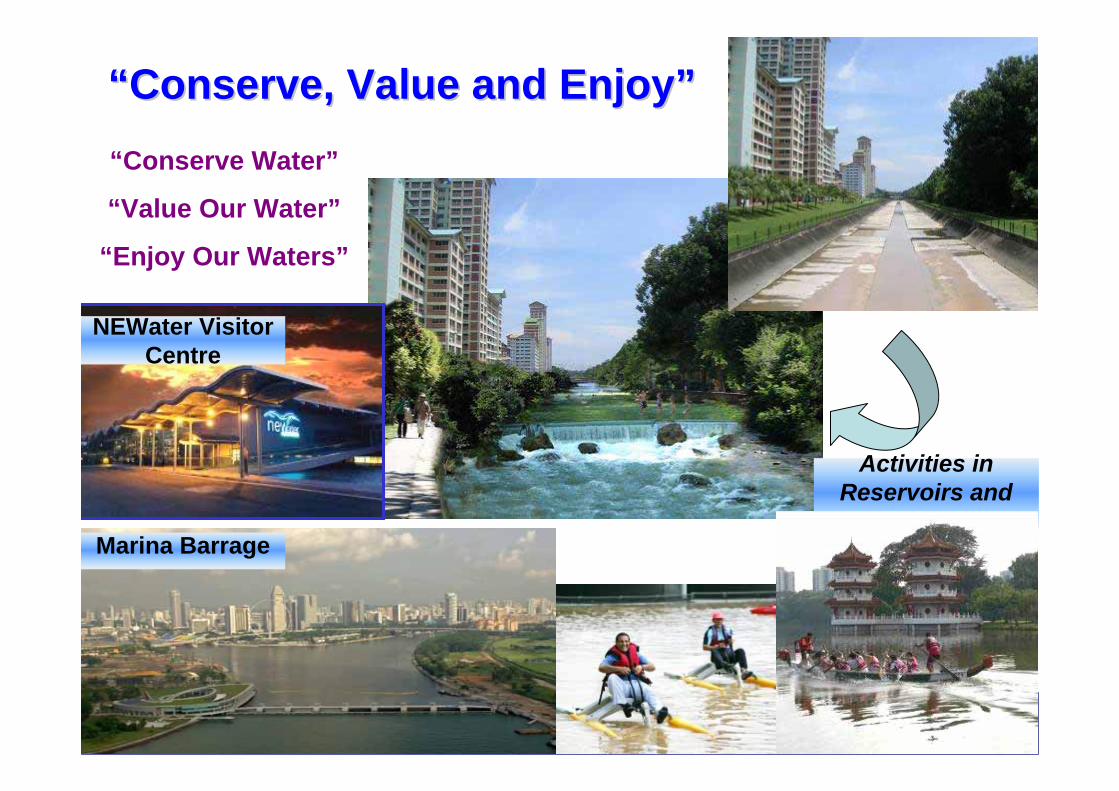
““Conserve, Value and EnjoyConserve, Value and Enjoy””“Conserve Water”
“Value Our Water”
“Enjoy Our Waters”
NEWater Visitor Centre
Activities in Reservoirs and
CanalsMarina Barrage
28
.
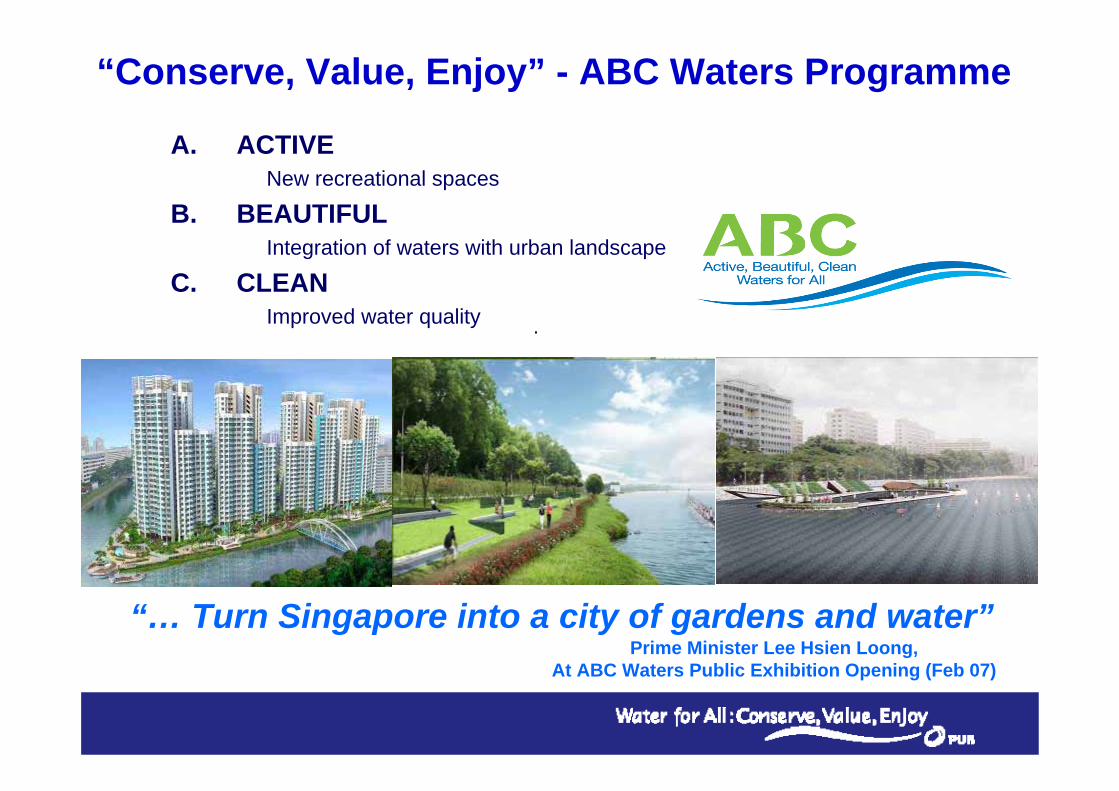
“Conserve, Value, Enjoy” - ABC Waters Programme
A. ACTIVENew recreational spaces
B. BEAUTIFUL Integration of waters with urban landscape
C. CLEAN Improved water quality
“… Turn Singapore into a city of gardens and water”Prime Minister Lee Hsien Loong,
At ABC Waters Public Exhibition Opening (Feb 07)
29
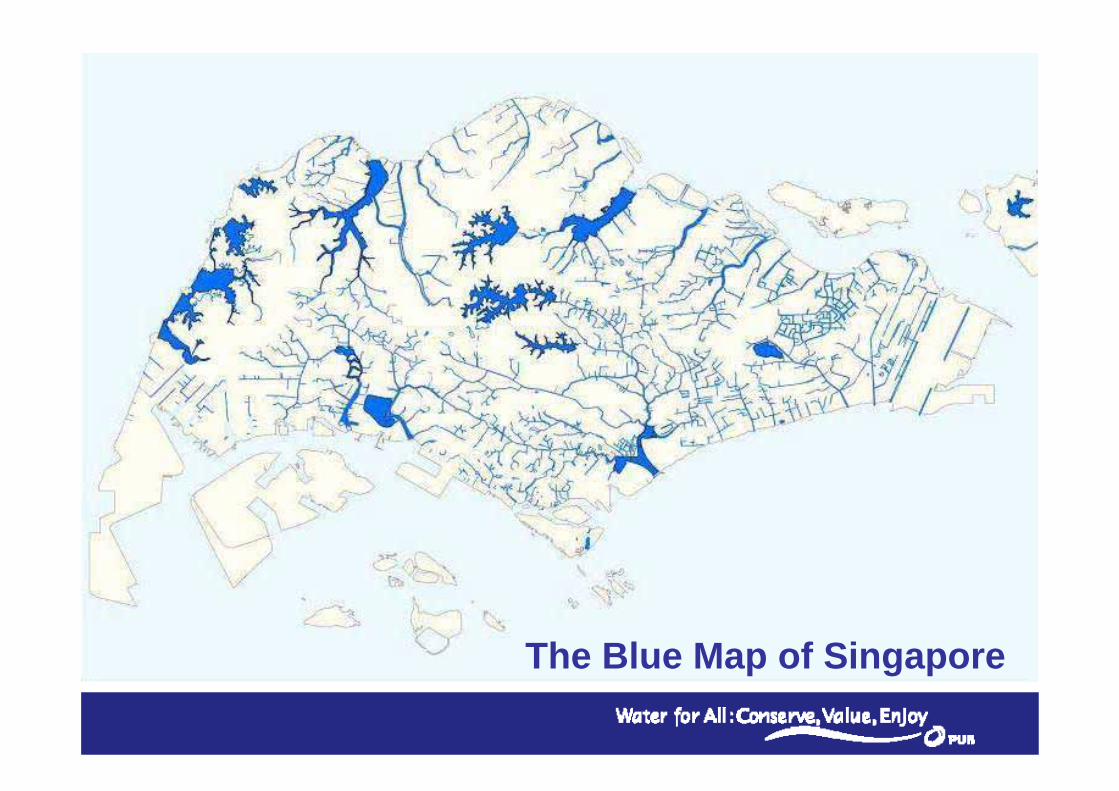
The Blue Map of Singapore

30Kallang River at Bishan Park
Existing

31Floating island in Sengkang (Sg Punggol)
Proposed

32
Ready for the FutureReady for the Future

33
Objectives of R&D:
1.Increase water resources
2.Protect water quality and security
3.Reduce production cost
Chemicals
Chemicals
UsageUsage
Ener
gyEn
ergy
Waste Waste MinimisationMinimisation
KeyKeyDriversDrivers
Driver: “Adequate Water Supply”:•Rainfall: 2.4 m•Land area: 700 km2
•Large domestic and industrial demand
Driver: “Good Water Quality”:•Water resources coming from unconventional sources
“Water for All” - Drivers for PUB’s R&DPUB’s strategy for long term sustainability of our water supply is to continue continue leveraging on technological innovation to overcome the water chaleveraging on technological innovation to overcome the water challenges. llenges.

34
PUB started its R&D programme in 2002.
•No. of Projects to‐date: 294
•Annual R&D Budget: o S$5 mil from 2004 to 2009o Increased to S$20 mil in 2010
•Total Project Value: S$160 mil
•Average annual R&D investment: S$18 mil
“Water for All” - PUB’s Investment in R&D Innovation

35
seasea
“Water for All” - R&D Projects in the Water Loop
rainrainstormwater stormwater managementmanagement
collection collection of rainfall of rainfall
in drains & in drains & reservoirsreservoirs
treatment oftreatment ofraw to potableraw to potable
waterwater
reclamationreclamationof of
used waterused water
collectioncollectionof used waterof used water
in sewersin sewerssupply of supply of
water to thewater to thepopulation & population &
industriesindustries
treatment treatment ofof
used waterused water
desalinationdesalination
Variable Variable Salinity Salinity ProcessProcess
Low Energy MBR
Water Quality Modelling and
Prediction
Integrated Anaerobic &
Aerobic Treatment
Real-Time Water Quality Monitoring
and AnalysisRegenerative
Photocatalysts
BiomimeticBiomimeticMembranesMembranes
MicrobialFuel Cells
CapacitiveCapacitiveDeionisationDeionisation
Forward Forward OsmosisOsmosis
Source Control
Reducing Evaporation
Electrochemical Electrochemical DesaltingDesalting
Membrane Membrane DistillationDistillation
DOHS DOHS BackwashBackwash
Membrane Membrane Integrity Integrity SensorsSensors
Rainfall Prediction
Robust Sensors
Microbial Source
Tracking
Contaminants of Emerging Concerns
BiomimicryBiomimicry

SWROCurrent 3.5 kWh/m3
Short-term < 1.5 kWh/m3
– Variable Salinity Process : 1.7 kWh/m3
– Memstill (with waste heat): 1.0 kWh/m3
– Electrochemical Desalting: 1.5 kWh/m3
Breakthrough R&D
Biomimetic Membranes / Biomimicry of Natural Desalination Processes
Mangrove
Long- term < 0.75 kWh/m3
Aquaporins
Journey to Low Energy Seawater Desalination

37
Current Status:Nett energy of
0.5 kWh/m3
80% Energy Reduction: <0.1 kWh/m3 nett energy
Energy-Self SufficiencyNett Zero Energy
5 – 6 years
20 years?
PUB Manages the Entire Water LoopR&D Approach - Energy Self-Sufficiency for Used Water Treatment

38
KEEPING WATCH ON CLIMATE CHANGE
Image Source Page: http://www.our-energy.com/global_warming.html
Possible Impact:Rise in the mean sea level around Singapore by 24 to 65 cm by 2100
PUB adopts a four-pronged approach towards climate:Weather-resilient sources (NEWater and desalinated water)Continue investment in R&D to help develop capabilities and innovative solutions to further enhance our water resilienceWorking closely with its international government and industry partners to help bring water solutions to the region and the worldLong-term approach to infrastructure planning e.g. reclaimed land to be constructed to a platform level of 125 cm above the highest tide level

39
Reasons for SuccessReasons for Success

40
Close coordination among government agencies Urban Redevelopment AuthorityHousing Development BoardNational Environment Agency
Land use planning and catchment managementAnti-pollution design incorporated at planning stage of developmentPollution control measures – strict erosion control, street sweeping, drain maintenance etc. Phasing out undesirable activities (pig, chicken and duck farming)
Reasons for Success

41
Separation of stormwater from sewageSingapore does not have combined sewer and stormwater drainage systems
Integrated water and wastewater managementPUB manages the entire water loop, including rainwater and wastewater collection, drinking water and wastewater treatment, as well as NEWater productionPolicies in place to protect stormwater runoff quality
Reasons for Success

42
THANK YOUTHANK YOU

43
Per Capita Domestic Water Consumption

44
Unaccounted-for-water (1989 -2010)

45
Annual Leakage per 100 km of Mains (1994-2010)