Embed Size (px)
Citation preview

DISCLOSURE APPENDIX CONTAINS ANALYST CERTIFICATIONS AND THE STATUS OF NON US ANALYSTS. FOR OTHER IMPORTANT DISCLOSURES, visit www.credit-suisse.com/researchdisclosures or call +1 (877) 291-2683 US Disclosure: Credit Suisse does and seeks to do business with companies covered in its research reports. As a result, investors should be aware that the Firm may have a conflict of interest that could affect the objectivity of this report. Investors should consider this report as only a single factor in making their investment decision.
CREDIT SUISSE SECURITIES RESEARCH & ANALYTICS BEYOND INFORMATION®
Client-Driven Solutions, Insights, and Access
11 April 2013
Asia Pacific/Singapore
Equity Research
Utilities
Singapore Utilities Sector SECTOR REVIEW
Significant capacity growth ahead
Figure 1: Credit Suisse’s power generation model suggests reserve margin
could increase to 2007 levels
0%
10%
20%
30%
40%
50%
60%
70%
0
2000
4000
6000
8000
10000
12000
14000
2007 2008 2009 2010 2011 2012 2013 2014 2015 2016 2017 2018 2019 2020
Total Generation Capacity - LHS Peak demand - LHS Reserve Margin - RHS
(MW)
Source: Energy Market Authority, Company data, Credit Suisse estimates
■ Power generation capacity to grow by 30% in 2013–14E: Following the
completion of Singapore’s LNG terminal in 2Q13 which will increase gas supply into the country, power generation capacity is expected to increase by 3.0GW or 30% in 2013–14E. Based on the Credit Suisse demand-supply model, we expect reserve margin to increase to 47% in 2013E from 37% in 2011, and will return to the 2012 level only in 2020E.
■ Uniform Singapore Electricity Price (USEP) declined 23% in 1Q13: The increase in capacity has led to a 23% fall in the pool price in 1Q13, relative to a 13% fall in fuel costs. Vesting prices for contracts which commit gencos to sell a specified amount of electricity were also revised down in January 2013. However, we expect downside support to be provided by rational pricing behaviour given high acquisition price of generation assets, retail contracts locked in, and contribution from non-electricity sale.
■ Downgrade Sembcorp Industries to NEUTRAL: We downgrade
Sembcorp Industries to NEUTRAL (from Outperform; lower TP to S$5.10 from S$5.90) as we believe market earnings expectations for 2013 do not factor in any potential decline in profit from industry capacity additions. Within China Utilities, we switch our top sector pick from HNP (raise TP to HK$9.00 from HK$7.00) to CRP, given the risks of a fall in Singapore tariffs and higher capacity adds in CRP versus HNP. We maintain our UNDERPERFORM rating on YTL Power (lower TP to RM1.40 from RM1.82).
Research Analysts
Gerald Wong, CFA
65 6212 3037
Edwin Pang
852 2101 6406
Annuar Aziz
60 3 2723 2084
Louis Chua
65 6212 3024
11 April 2013
Singapore Utilities Sector 2
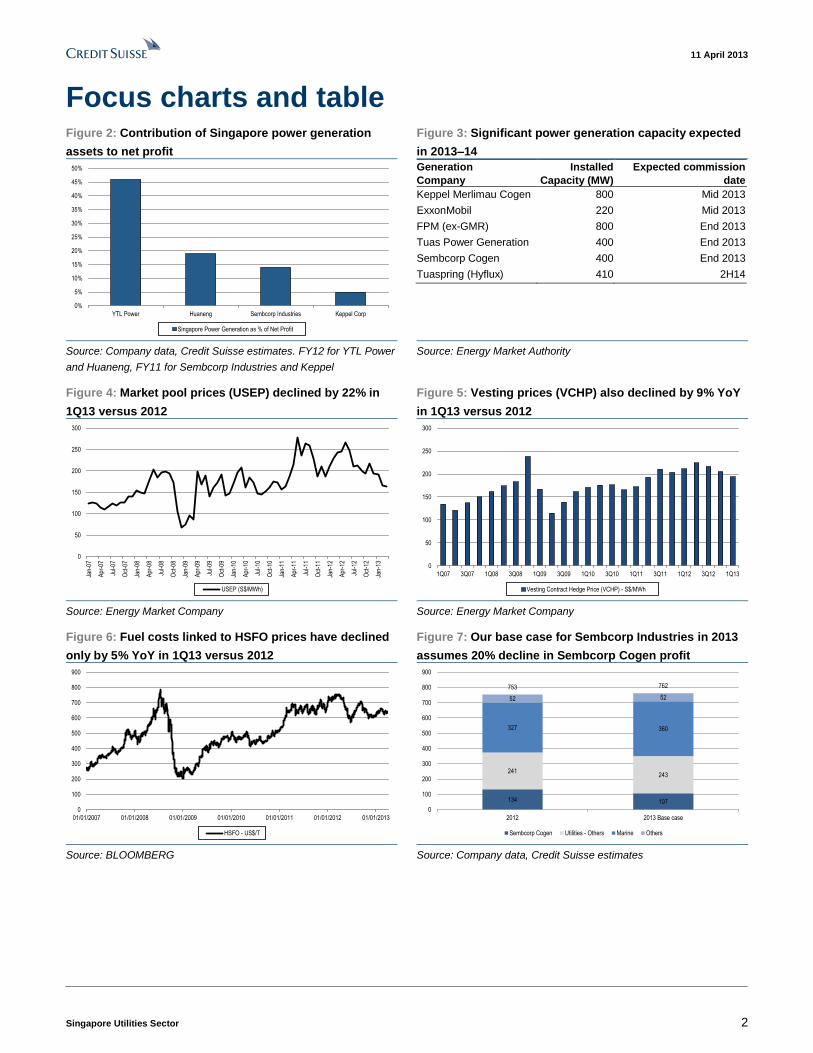
Focus charts and table Figure 2: Contribution of Singapore power generation
assets to net profit
Figure 3: Significant power generation capacity expected
in 2013–14
0%
5%
10%
15%
20%
25%
30%
35%
40%
45%
50%
YTL Power Huaneng Sembcorp Industries Keppel Corp
Singapore Power Generation as % of Net Profit
Generation
Company
Installed
Capacity (MW)
Expected commission
date
Keppel Merlimau Cogen 800 Mid 2013
ExxonMobil 220 Mid 2013
FPM (ex-GMR) 800 End 2013
Tuas Power Generation 400 End 2013
Sembcorp Cogen 400 End 2013
Tuaspring (Hyflux) 410 2H14
Source: Company data, Credit Suisse estimates. FY12 for YTL Power
and Huaneng, FY11 for Sembcorp Industries and Keppel
Source: Energy Market Authority
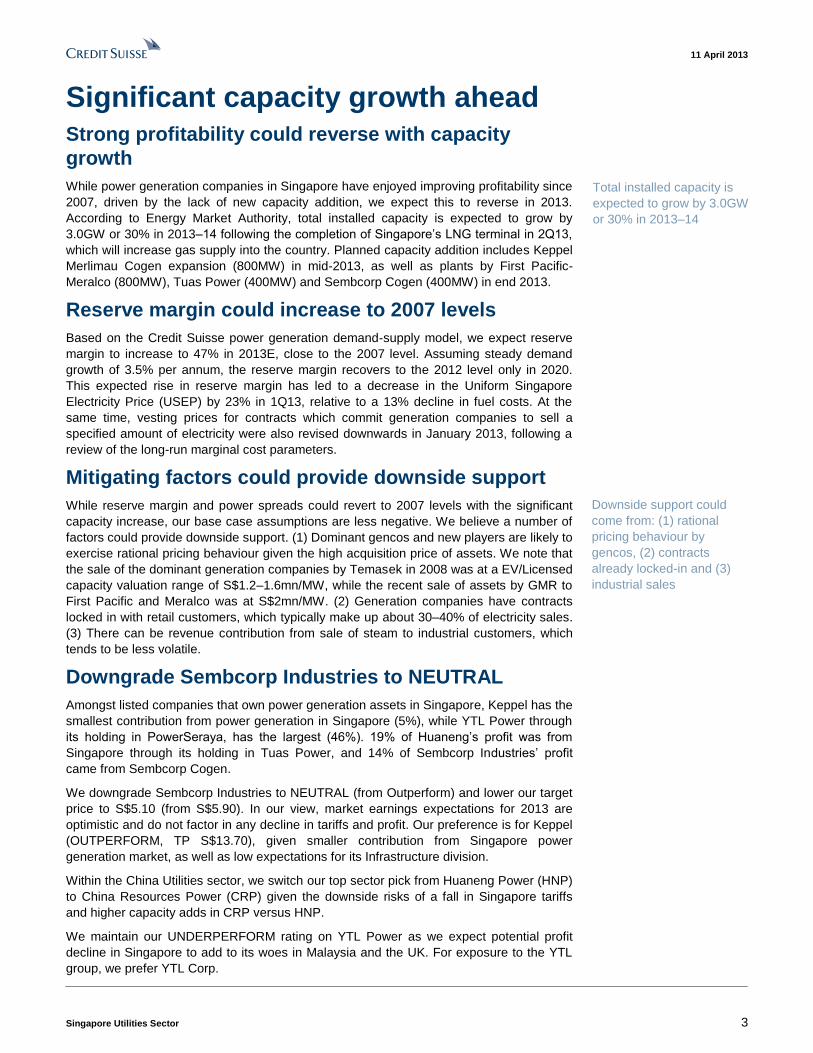
Figure 4: Market pool prices (USEP) declined by 22% in
1Q13 versus 2012
Figure 5: Vesting prices (VCHP) also declined by 9% YoY
in 1Q13 versus 2012
0
50
100
150
200
250
300
Jan-
07
Apr
-07
Jul-0
7
Oct
-07
Jan-
08
Apr
-08
Jul-0
8
Oct
-08
Jan-
09
Apr
-09
Jul-0
9
Oct
-09
Jan-
10
Apr
-10
Jul-1
0
Oct
-10
Jan-
11
Apr
-11
Jul-1
1
Oct
-11
Jan-
12
Apr
-12
Jul-1
2
Oct
-12
Jan-
13
USEP (S$/MWh)
0
50
100
150
200
250
300
1Q07 3Q07 1Q08 3Q08 1Q09 3Q09 1Q10 3Q10 1Q11 3Q11 1Q12 3Q12 1Q13
Vesting Contract Hedge Price (VCHP) - S$/MWh
Source: Energy Market Company Source: Energy Market Company
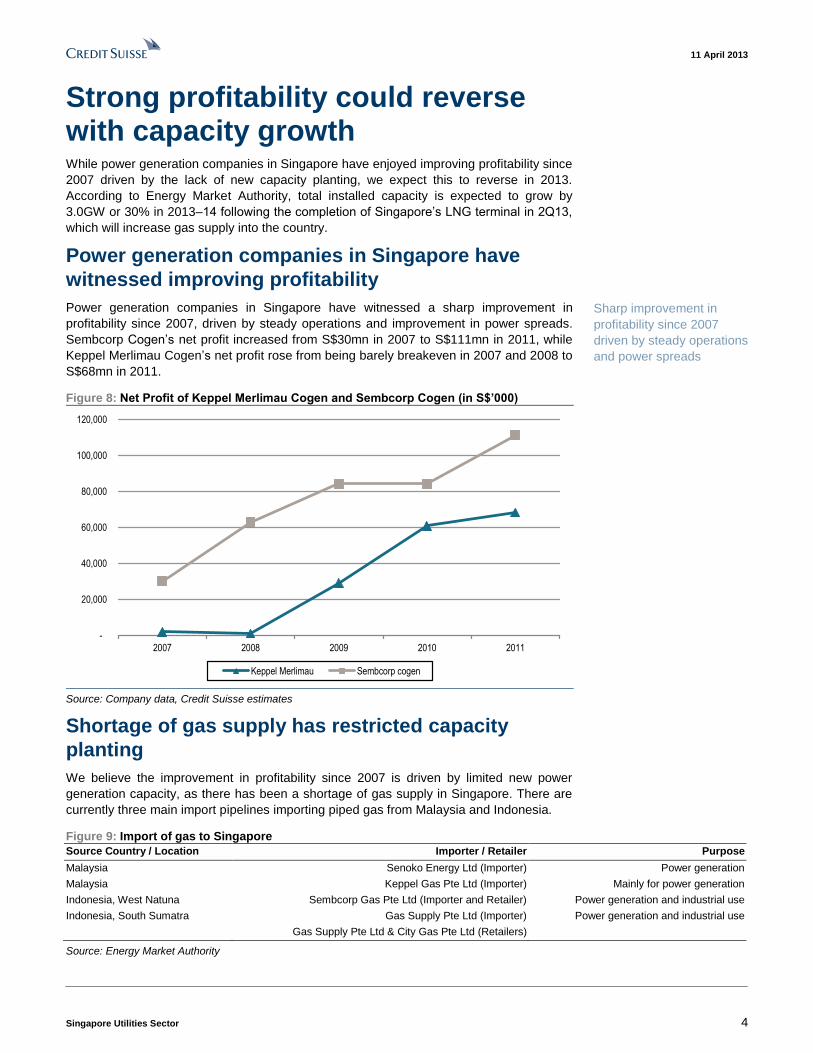
Figure 6: Fuel costs linked to HSFO prices have declined
only by 5% YoY in 1Q13 versus 2012
Figure 7: Our base case for Sembcorp Industries in 2013
assumes 20% decline in Sembcorp Cogen profit
0
100
200
300
400
500
600
700
800
900
01/01/2007 01/01/2008 01/01/2009 01/01/2010 01/01/2011 01/01/2012 01/01/2013
HSFO - US$/T
134 107
241243
327 360
52 52
753 762
0
100
200
300
400
500
600
700
800
900
2012 2013 Base case
Sembcorp Cogen Utilities - Others Marine Others
Source: BLOOMBERG Source: Company data, Credit Suisse estimates
11 April 2013
Singapore Utilities Sector 3
Significant capacity growth ahead Strong profitability could reverse with capacity
growth
While power generation companies in Singapore have enjoyed improving profitability since
2007, driven by the lack of new capacity addition, we expect this to reverse in 2013.
According to Energy Market Authority, total installed capacity is expected to grow by
3.0GW or 30% in 2013–14 following the completion of Singapore’s LNG terminal in 2Q13,
which will increase gas supply into the country. Planned capacity addition includes Keppel
Merlimau Cogen expansion (800MW) in mid-2013, as well as plants by First Pacific-
Meralco (800MW), Tuas Power (400MW) and Sembcorp Cogen (400MW) in end 2013.
Reserve margin could increase to 2007 levels
Based on the Credit Suisse power generation demand-supply model, we expect reserve
margin to increase to 47% in 2013E, close to the 2007 level. Assuming steady demand
growth of 3.5% per annum, the reserve margin recovers to the 2012 level only in 2020.
This expected rise in reserve margin has led to a decrease in the Uniform Singapore
Electricity Price (USEP) by 23% in 1Q13, relative to a 13% decline in fuel costs. At the
same time, vesting prices for contracts which commit generation companies to sell a
specified amount of electricity were also revised downwards in January 2013, following a
review of the long-run marginal cost parameters.
Mitigating factors could provide downside support
While reserve margin and power spreads could revert to 2007 levels with the significant
capacity increase, our base case assumptions are less negative. We believe a number of
factors could provide downside support. (1) Dominant gencos and new players are likely to
exercise rational pricing behaviour given the high acquisition price of assets. We note that
the sale of the dominant generation companies by Temasek in 2008 was at a EV/Licensed
capacity valuation range of S$1.2–1.6mn/MW, while the recent sale of assets by GMR to
First Pacific and Meralco was at S$2mn/MW. (2) Generation companies have contracts
locked in with retail customers, which typically make up about 30–40% of electricity sales.
(3) There can be revenue contribution from sale of steam to industrial customers, which
tends to be less volatile.
Downgrade Sembcorp Industries to NEUTRAL
Amongst listed companies that own power generation assets in Singapore, Keppel has the
smallest contribution from power generation in Singapore (5%), while YTL Power through
its holding in PowerSeraya, has the largest (46%). 19% of Huaneng’s profit was from
Singapore through its holding in Tuas Power, and 14% of Sembcorp Industries’ profit
came from Sembcorp Cogen.
We downgrade Sembcorp Industries to NEUTRAL (from Outperform) and lower our target
price to S$5.10 (from S$5.90). In our view, market earnings expectations for 2013 are
optimistic and do not factor in any decline in tariffs and profit. Our preference is for Keppel
(OUTPERFORM, TP S$13.70), given smaller contribution from Singapore power
generation market, as well as low expectations for its Infrastructure division.
Within the China Utilities sector, we switch our top sector pick from Huaneng Power (HNP)
to China Resources Power (CRP) given the downside risks of a fall in Singapore tariffs
and higher capacity adds in CRP versus HNP.
We maintain our UNDERPERFORM rating on YTL Power as we expect potential profit
decline in Singapore to add to its woes in Malaysia and the UK. For exposure to the YTL
group, we prefer YTL Corp.
Total installed capacity is
expected to grow by 3.0GW
or 30% in 2013–14
Downside support could
come from: (1) rational
pricing behaviour by
gencos, (2) contracts
already locked-in and (3)
industrial sales
11 April 2013
Singapore Utilities Sector 4
Strong profitability could reverse with capacity growth While power generation companies in Singapore have enjoyed improving profitability since
2007 driven by the lack of new capacity planting, we expect this to reverse in 2013.
According to Energy Market Authority, total installed capacity is expected to grow by
3.0GW or 30% in 2013–14 following the completion of Singapore’s LNG terminal in 2Q13,
which will increase gas supply into the country.
Power generation companies in Singapore have
witnessed improving profitability
Power generation companies in Singapore have witnessed a sharp improvement in
profitability since 2007, driven by steady operations and improvement in power spreads.
Sembcorp Cogen’s net profit increased from S$30mn in 2007 to S$111mn in 2011, while
Keppel Merlimau Cogen’s net profit rose from being barely breakeven in 2007 and 2008 to
S$68mn in 2011.
Figure 8: Net Profit of Keppel Merlimau Cogen and Sembcorp Cogen (in S$’000)
-
20,000
40,000
60,000
80,000
100,000
120,000
2007 2008 2009 2010 2011
Keppel Merlimau Sembcorp cogen
Source: Company data, Credit Suisse estimates
Shortage of gas supply has restricted capacity
planting
We believe the improvement in profitability since 2007 is driven by limited new power
generation capacity, as there has been a shortage of gas supply in Singapore. There are
currently three main import pipelines importing piped gas from Malaysia and Indonesia.
Figure 9: Import of gas to Singapore
Source Country / Location Importer / Retailer Purpose
Malaysia Senoko Energy Ltd (Importer) Power generation
Malaysia Keppel Gas Pte Ltd (Importer) Mainly for power generation
Indonesia, West Natuna Sembcorp Gas Pte Ltd (Importer and Retailer) Power generation and industrial use
Indonesia, South Sumatra Gas Supply Pte Ltd (Importer) Power generation and industrial use
Gas Supply Pte Ltd & City Gas Pte Ltd (Retailers)
Source: Energy Market Authority
Sharp improvement in
profitability since 2007
driven by steady operations
and power spreads
11 April 2013
Singapore Utilities Sector 5
Capacity expected to grow by 30% in 2013–14
Based on data from the Energy Market Authority (EMA), total installed capacity in
Singapore is expected to grow by 3.0GW during 2013–14, with the bulk of the capacity
growth coming through in end 2013.
Figure 10: Planned installed capacity growth in 2013–14
Generation Company Installed Capacity (MW) Plant Type Expected commission date
Keppel Merlimau Cogen 800 CCGT Mid 2013
ExxonMobil 220 CCGT Mid 2013
FPM (ex GMR) 800 CCGT End 2013
Tuas Power Generation 400 CCGT End 2013
Sembcorp Cogen 400 CCGT End 2013
Tuaspring (Hyflux) 410 CCGT 2H14
Source: Energy Market Authority, Company data, Credit Suisse estimates
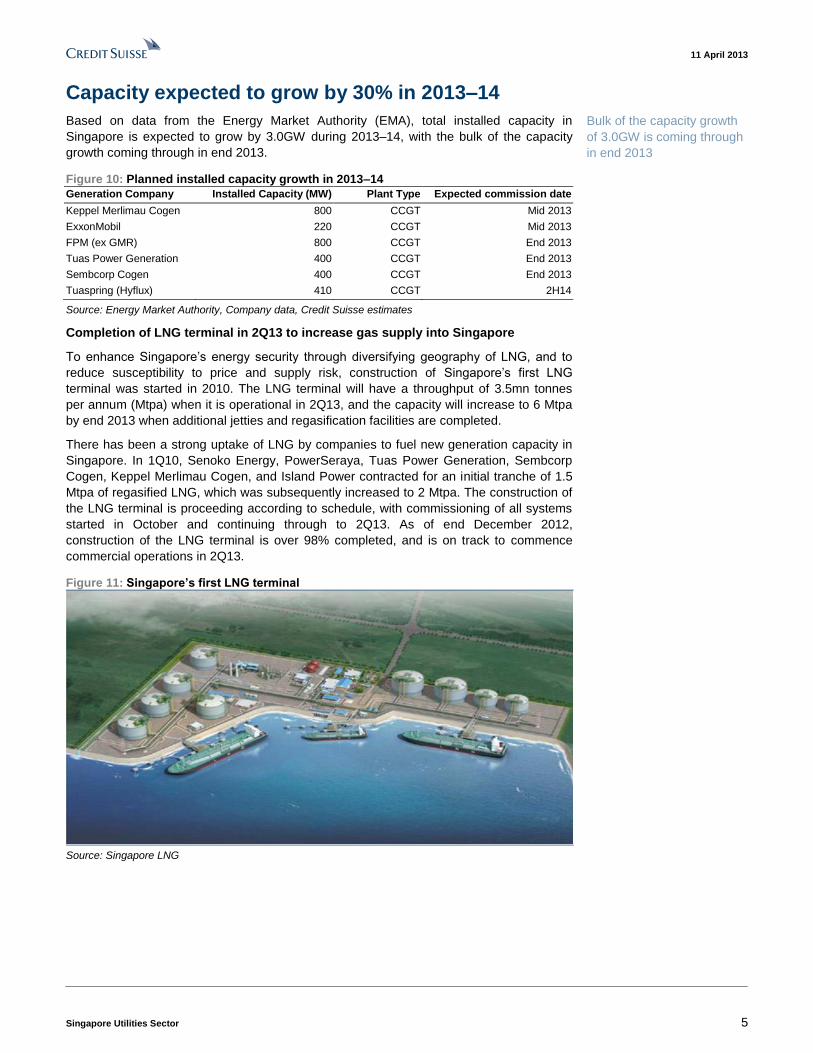
Completion of LNG terminal in 2Q13 to increase gas supply into Singapore
To enhance Singapore’s energy security through diversifying geography of LNG, and to
reduce susceptibility to price and supply risk, construction of Singapore’s first LNG
terminal was started in 2010. The LNG terminal will have a throughput of 3.5mn tonnes
per annum (Mtpa) when it is operational in 2Q13, and the capacity will increase to 6 Mtpa
by end 2013 when additional jetties and regasification facilities are completed.
There has been a strong uptake of LNG by companies to fuel new generation capacity in
Singapore. In 1Q10, Senoko Energy, PowerSeraya, Tuas Power Generation, Sembcorp
Cogen, Keppel Merlimau Cogen, and Island Power contracted for an initial tranche of 1.5
Mtpa of regasified LNG, which was subsequently increased to 2 Mtpa. The construction of
the LNG terminal is proceeding according to schedule, with commissioning of all systems
started in October and continuing through to 2Q13. As of end December 2012,
construction of the LNG terminal is over 98% completed, and is on track to commence
commercial operations in 2Q13.
Figure 11: Singapore’s first LNG terminal
Source: Singapore LNG
Bulk of the capacity growth
of 3.0GW is coming through
in end 2013
11 April 2013
Singapore Utilities Sector 6
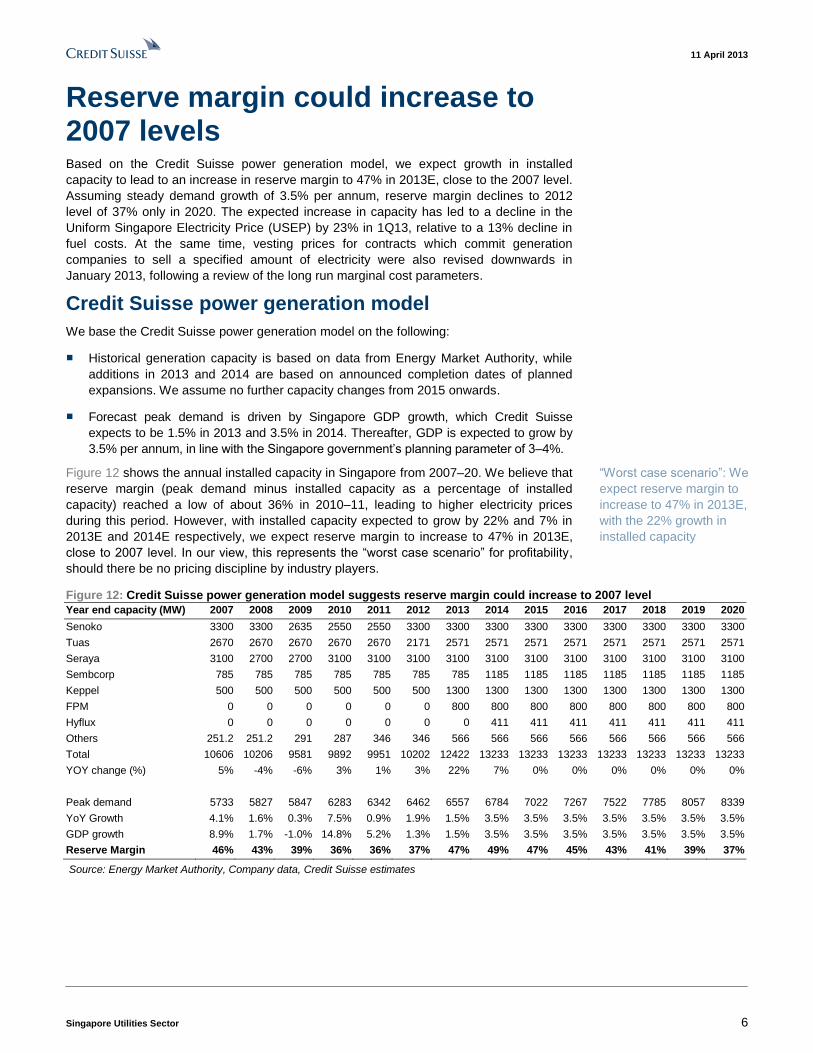
Reserve margin could increase to 2007 levels Based on the Credit Suisse power generation model, we expect growth in installed
capacity to lead to an increase in reserve margin to 47% in 2013E, close to the 2007 level.
Assuming steady demand growth of 3.5% per annum, reserve margin declines to 2012
level of 37% only in 2020. The expected increase in capacity has led to a decline in the
Uniform Singapore Electricity Price (USEP) by 23% in 1Q13, relative to a 13% decline in
fuel costs. At the same time, vesting prices for contracts which commit generation
companies to sell a specified amount of electricity were also revised downwards in
January 2013, following a review of the long run marginal cost parameters.
Credit Suisse power generation model
We base the Credit Suisse power generation model on the following:
■ Historical generation capacity is based on data from Energy Market Authority, while
additions in 2013 and 2014 are based on announced completion dates of planned
expansions. We assume no further capacity changes from 2015 onwards.
■ Forecast peak demand is driven by Singapore GDP growth, which Credit Suisse
expects to be 1.5% in 2013 and 3.5% in 2014. Thereafter, GDP is expected to grow by
3.5% per annum, in line with the Singapore government’s planning parameter of 3–4%.
Figure 12 shows the annual installed capacity in Singapore from 2007–20. We believe that
reserve margin (peak demand minus installed capacity as a percentage of installed
capacity) reached a low of about 36% in 2010–11, leading to higher electricity prices
during this period. However, with installed capacity expected to grow by 22% and 7% in
2013E and 2014E respectively, we expect reserve margin to increase to 47% in 2013E,
close to 2007 level. In our view, this represents the “worst case scenario” for profitability,
should there be no pricing discipline by industry players.
Figure 12: Credit Suisse power generation model suggests reserve margin could increase to 2007 level
Year end capacity (MW) 2007 2008 2009 2010 2011 2012 2013 2014 2015 2016 2017 2018 2019 2020
Senoko 3300 3300 2635 2550 2550 3300 3300 3300 3300 3300 3300 3300 3300 3300
Tuas 2670 2670 2670 2670 2670 2171 2571 2571 2571 2571 2571 2571 2571 2571
Seraya 3100 2700 2700 3100 3100 3100 3100 3100 3100 3100 3100 3100 3100 3100
Sembcorp 785 785 785 785 785 785 785 1185 1185 1185 1185 1185 1185 1185
Keppel 500 500 500 500 500 500 1300 1300 1300 1300 1300 1300 1300 1300
FPM 0 0 0 0 0 0 800 800 800 800 800 800 800 800
Hyflux 0 0 0 0 0 0 0 411 411 411 411 411 411 411
Others 251.2 251.2 291 287 346 346 566 566 566 566 566 566 566 566
Total 10606 10206 9581 9892 9951 10202 12422 13233 13233 13233 13233 13233 13233 13233
YOY change (%) 5% -4% -6% 3% 1% 3% 22% 7% 0% 0% 0% 0% 0% 0%
Peak demand 5733 5827 5847 6283 6342 6462 6557 6784 7022 7267 7522 7785 8057 8339
YoY Growth 4.1% 1.6% 0.3% 7.5% 0.9% 1.9% 1.5% 3.5% 3.5% 3.5% 3.5% 3.5% 3.5% 3.5%
GDP growth 8.9% 1.7% -1.0% 14.8% 5.2% 1.3% 1.5% 3.5% 3.5% 3.5% 3.5% 3.5% 3.5% 3.5%
Reserve Margin 46% 43% 39% 36% 36% 37% 47% 49% 47% 45% 43% 41% 39% 37%
Source: Energy Market Authority, Company data, Credit Suisse estimates
“Worst case scenario”: We
expect reserve margin to
increase to 47% in 2013E,
with the 22% growth in
installed capacity
11 April 2013
Singapore Utilities Sector 7
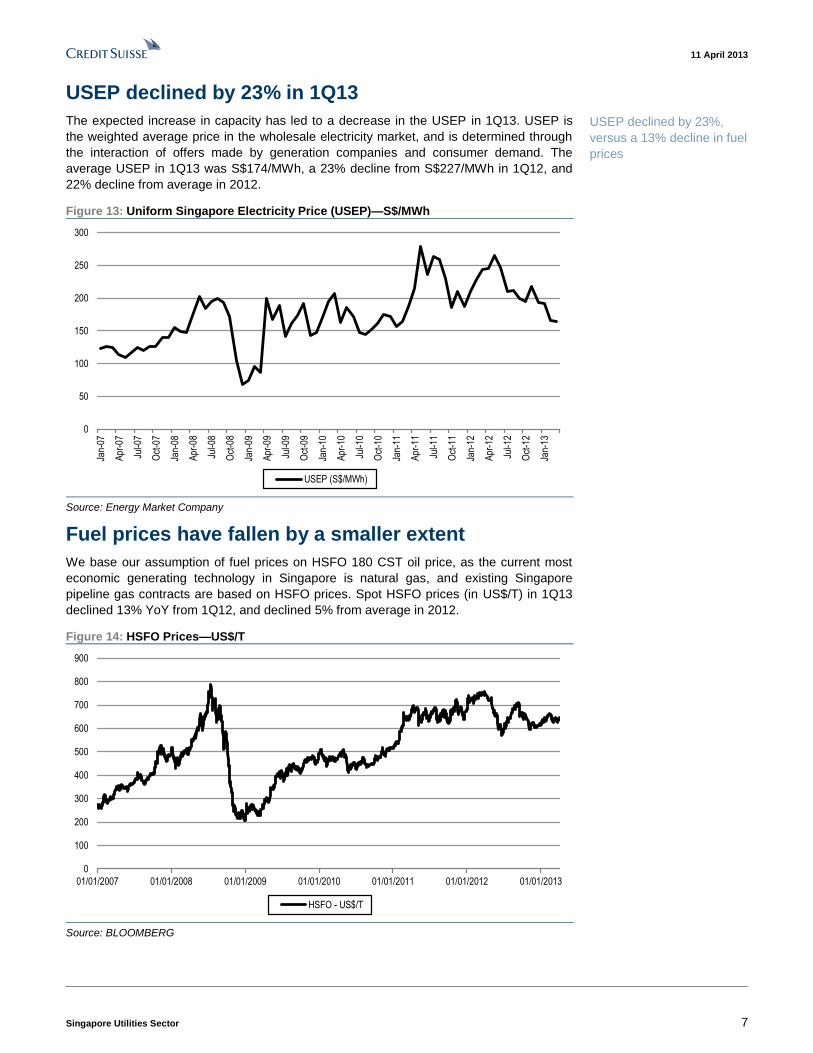
USEP declined by 23% in 1Q13
The expected increase in capacity has led to a decrease in the USEP in 1Q13. USEP is
the weighted average price in the wholesale electricity market, and is determined through
the interaction of offers made by generation companies and consumer demand. The
average USEP in 1Q13 was S$174/MWh, a 23% decline from S$227/MWh in 1Q12, and
22% decline from average in 2012.
Figure 13: Uniform Singapore Electricity Price (USEP)—S$/MWh
0
50
100
150
200
250
300
Jan-
07
Apr
-07
Jul-0
7
Oct
-07
Jan-
08
Apr
-08
Jul-0
8
Oct
-08
Jan-
09
Apr
-09
Jul-0
9
Oct
-09
Jan-
10
Apr
-10
Jul-1
0
Oct
-10
Jan-
11
Apr
-11
Jul-1
1
Oct
-11
Jan-
12
Apr
-12
Jul-1
2
Oct
-12
Jan-
13
USEP (S$/MWh)
Source: Energy Market Company
Fuel prices have fallen by a smaller extent
We base our assumption of fuel prices on HSFO 180 CST oil price, as the current most
economic generating technology in Singapore is natural gas, and existing Singapore
pipeline gas contracts are based on HSFO prices. Spot HSFO prices (in US$/T) in 1Q13
declined 13% YoY from 1Q12, and declined 5% from average in 2012.
Figure 14: HSFO Prices—US$/T
0
100
200
300
400
500
600
700
800
900
01/01/2007 01/01/2008 01/01/2009 01/01/2010 01/01/2011 01/01/2012 01/01/2013
HSFO - US$/T
Source: BLOOMBERG
USEP declined by 23%,
versus a 13% decline in fuel
prices
11 April 2013
Singapore Utilities Sector 8
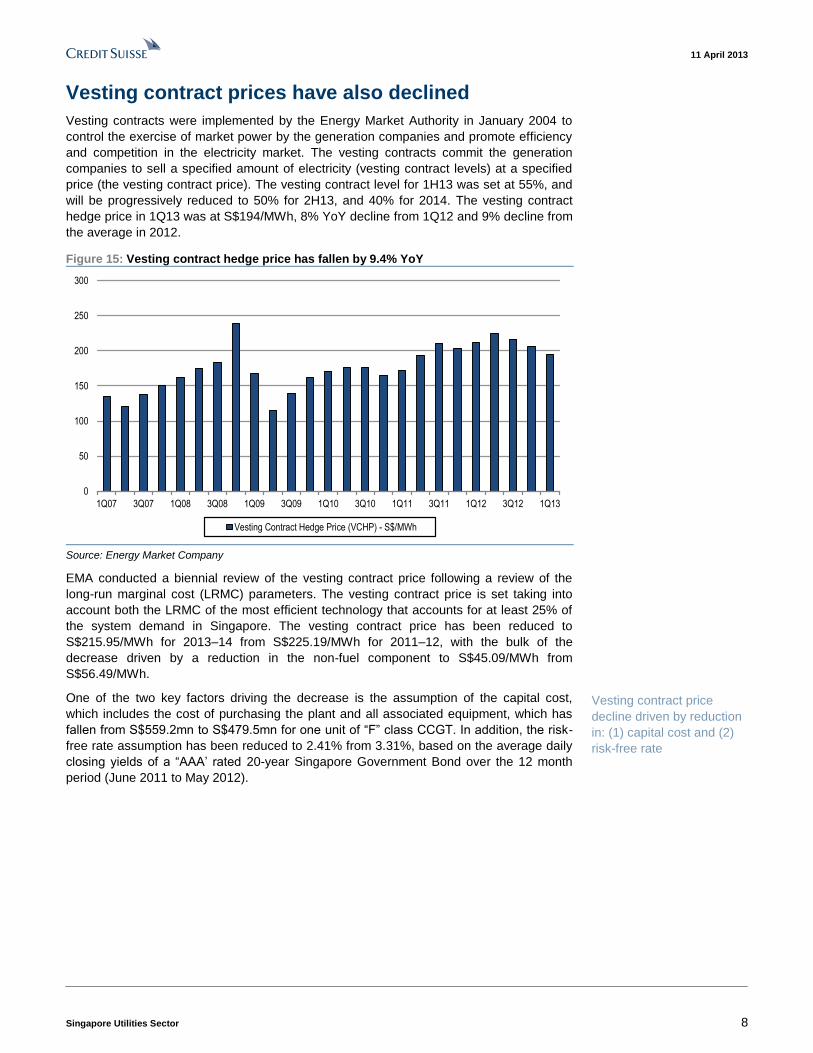
Vesting contract prices have also declined
Vesting contracts were implemented by the Energy Market Authority in January 2004 to
control the exercise of market power by the generation companies and promote efficiency
and competition in the electricity market. The vesting contracts commit the generation
companies to sell a specified amount of electricity (vesting contract levels) at a specified
price (the vesting contract price). The vesting contract level for 1H13 was set at 55%, and
will be progressively reduced to 50% for 2H13, and 40% for 2014. The vesting contract
hedge price in 1Q13 was at S$194/MWh, 8% YoY decline from 1Q12 and 9% decline from
the average in 2012.
Figure 15: Vesting contract hedge price has fallen by 9.4% YoY
0
50
100
150
200
250
300
1Q07 3Q07 1Q08 3Q08 1Q09 3Q09 1Q10 3Q10 1Q11 3Q11 1Q12 3Q12 1Q13
Vesting Contract Hedge Price (VCHP) - S$/MWh
Source: Energy Market Company
EMA conducted a biennial review of the vesting contract price following a review of the
long-run marginal cost (LRMC) parameters. The vesting contract price is set taking into
account both the LRMC of the most efficient technology that accounts for at least 25% of
the system demand in Singapore. The vesting contract price has been reduced to
S$215.95/MWh for 2013–14 from S$225.19/MWh for 2011–12, with the bulk of the
decrease driven by a reduction in the non-fuel component to S$45.09/MWh from
S$56.49/MWh.
One of the two key factors driving the decrease is the assumption of the capital cost,
which includes the cost of purchasing the plant and all associated equipment, which has
fallen from S$559.2mn to S$479.5mn for one unit of “F” class CCGT. In addition, the risk-
free rate assumption has been reduced to 2.41% from 3.31%, based on the average daily
closing yields of a “AAA’ rated 20-year Singapore Government Bond over the 12 month
period (June 2011 to May 2012).
Vesting contract price
decline driven by reduction
in: (1) capital cost and (2)
risk-free rate

11 April 2013
Singapore Utilities Sector 9
Figure 16: Summary of long-run margin cost (LRMC) parameters for setting vesting
contract price for the period 1 Jan 2013 to 31 December 2014
2011–12 2013–14
Technical parameters
Base month May-10 May-12
Capacity per generating unit (MW) 381 382.1
HHV Heat rate (Btu/kWh) 7010 7103.4
Build duration (months) 30 30
Economic lifetime (years) 24 22
Plant factor (%) 74.9 67.3
Capital cost (S$ mn) 559.2 479.5
Land, infrastructure and development cost (S$ mn) 152 150.2
Fixed annual running cost (S$ mn/yr) 22.49 23.51
Variable non-fuel cost (S$/MWh) 6.55 6.42
WACC parameters
Risk-free rate (%) 3.31 2.41
Debt premium 2.50 2.59
Gearing 0.342 0.497
Equity beta 1.00 1.00
Market risk premium 7.0 6.0
Corporate tax rate 17.0 17.0
Post-tax Nominal WACC (%) 8.43 6.29
Vesting contract price
Vesting contract price (S$/MWh) 225.19 215.95
Non-Fuel component (S$/MWh) 56.49 45.09
Fuel component (S$/MWh) 168.7 170.86
Source: Energy Market Authority

11 April 2013
Singapore Utilities Sector 10
Mitigating factors could provide downside support While reserve margin and power spreads could revert to 2007 levels with the significant
capacity increase, our base case assumptions are less negative. We believe a number of
factors could provide downside support, including: (1) likely rational pricing behaviour of
dominant gencos and new players given their high acquisition price; (2) retail contracts
locked in with industrial customers which could make up 60% of electricity sales, as well
as (3) contribution from non-electricity sales such as bundled utilities to customers on the
Jurong Island.
High acquisition cost could provide support to the
market pool prices
We believe downside support to market pool prices could be provided by the required
return of dominant generation companies, which purchased assets from Temasek
Holdings in 2008. The sale of Tuas Power (to China Huaneng), Senoko Power (to
Japanese consortium Lion Power) and PowerSeraya (to YTL Power) was made at a
EV/Licensed capacity valuation range of S$1.2–S$1.6mn/MW. More recently, First Pacific
and Meralco purchased a 70% stake in two 400MW plants from GMR at S$2 mn/MW.
Sale of major gencos at S$1.2–S$1.6mn/MW
In 2008, Temasek Holdings divested three of its wholly owned Singapore power
generation companies—PowerSeraya Ltd, Senoko Power Ltd and Tuas Power Ltd. In
March 2008, China Huaneng acquired Tuas Power for a cash consideration of S$4.235
bn. Tuas Power has generation assets with a licensed capacity totalling 2,670 MW
comprising 1,200 MW of oil-fired steam plants and 1,470 MW of gas-fired combined cycle
plants. In September 2008, Lion Power Holdings, a consortium comprising Marubeni,
GDF SUEZ, Kansai Electric Power, Kyushu Electric Power and Japan Bank for
International Cooperation, acquired Senoko Power for a cash consideration of S$3.65 bn.
Senoko has a combined installed capacity of 3,300 MW, comprising 1,945 MW of
combined cycle plants, 1,250 MW of thermal plants, and 105 MW of fast-start gas
turbines. In December 2008, YTL Power acquired PowerSeraya for a cash consideration
of S$3.6 bn. PowerSeraya has a registered capacity of 2,940 MW, comprising 732 MW of
combined cycle plants, 1,990MW of steam turbine plants and 218 MW of open cycle gas
turbine plants. The acquisition multiple of for these transactions were in the range of
S$1.2-S$1.6 mn/MW.
Figure 17: Acquisition of major gencos
Equity Net Enterprise Installed Licensed EV/ EV/
Value Debt Value Capacity Capacity Share of Installed Licensed
GenCo Date Sold Acquiror (S$ mn) (S$ mn) (S$ mn) (MW) (MW) SG needs MW MW
Tuas Power 14-Mar-08 China Huaneng 4,235 71 4,306 2,670 2,670 25% 1.61 1.61
Senoko Power 05-Sep-08 Lion Power 3,650 323 3,973 3,405 3,300 30% 1.17 1.20
PowerSeraya 02-Dec-08 YTL Power 3,600 201 3,801 3,240 3,100 27% 1.17 1.23
Source: Company data, Credit Suisse estimates
First Pac and Meralco acquire 800 MW facility from GMR at S$2mn/MW
In March 2013, GMR entered into a share purchase agreement to sell its 70% stake in
GMR Energy (GMRE) to FPM Power Holdings, a 60:40 joint venture between First Pacific
and MERALCO. GMRE owns 2x 400 MW natural gas fuelled power plant on Jurong Island,
Singapore. The plant is 96% complete, and is expected to commence operations in
December 2013.
Pool prices likely to be
supported by high required
return of dominant gencos
11 April 2013
Singapore Utilities Sector 11
The consideration will be a total of US$537 mn (S$660 mn) for a 70% stake in GMRE. The
sale translates to an Enterprise Value (100% basis) for GMRE of US$1,293 mn (S$1,612
mn) on project completion. The power plant was financed on a limited recourse basis by a
consortium of banks providing a US$545 mn 17-year debt facility and a further US$270 mn
credit facility. The remaining 30% stake in GMRE is held by PETRONAS that will continue to
stay invested in the project.
The acquisition multiple of S$2 mn per MW is at a premium to the valuation of assets
divested by Temasek in 2008. We believe this could be due to higher efficiency of a newly
completed plant, as well as improvement in power spreads since 2008.
We believe that there might be downside support to market pool prices based on the
required return of generation companies. For example, we estimate that a long-term
EBITDA of US$100 mn is required to generate an 11% IRR for the investments by First
Pacific and Meralco, which is almost in-line with the effective EBITDA for a 70% stake in
Sembcorp Cogen (800MW) in 2011.
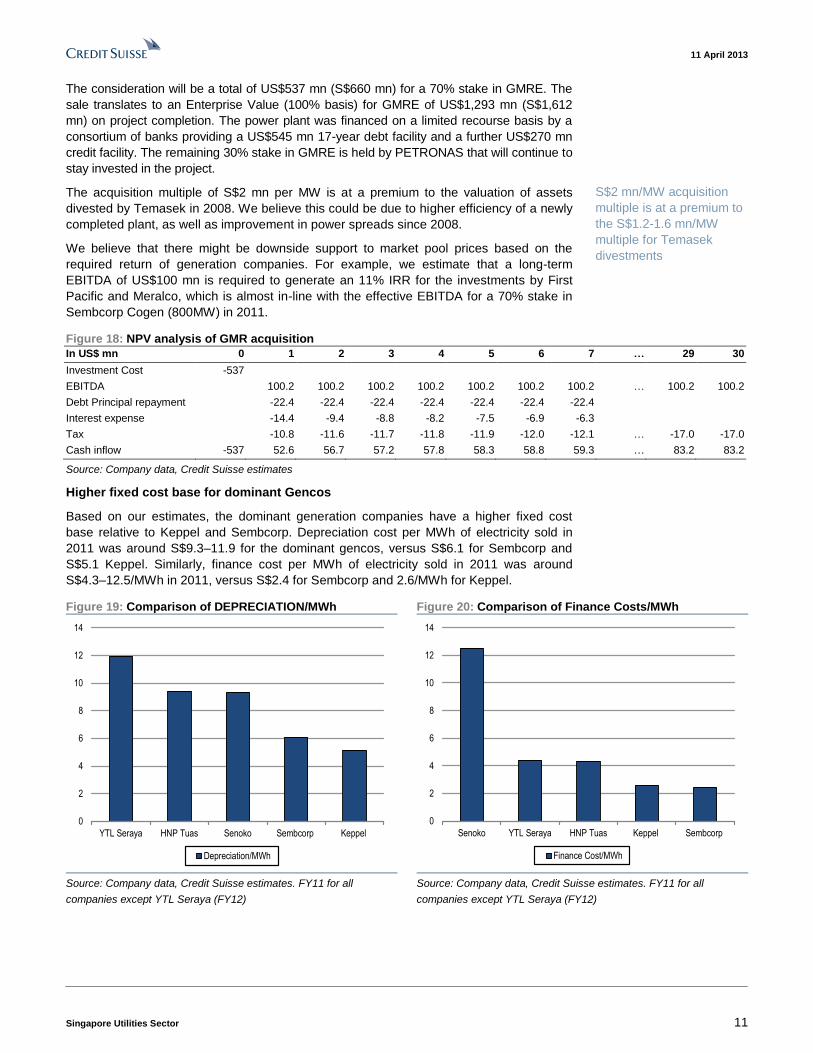
Figure 18: NPV analysis of GMR acquisition
In US$ mn 0 1 2 3 4 5 6 7 … 29 30
Investment Cost -537
EBITDA 100.2 100.2 100.2 100.2 100.2 100.2 100.2 … 100.2 100.2
Debt Principal repayment -22.4 -22.4 -22.4 -22.4 -22.4 -22.4 -22.4
Interest expense -14.4 -9.4 -8.8 -8.2 -7.5 -6.9 -6.3
Tax -10.8 -11.6 -11.7 -11.8 -11.9 -12.0 -12.1 … -17.0 -17.0
Cash inflow -537 52.6 56.7 57.2 57.8 58.3 58.8 59.3 … 83.2 83.2
Source: Company data, Credit Suisse estimates
Higher fixed cost base for dominant Gencos
Based on our estimates, the dominant generation companies have a higher fixed cost
base relative to Keppel and Sembcorp. Depreciation cost per MWh of electricity sold in
2011 was around S$9.3–11.9 for the dominant gencos, versus S$6.1 for Sembcorp and
S$5.1 Keppel. Similarly, finance cost per MWh of electricity sold in 2011 was around
S$4.3–12.5/MWh in 2011, versus S$2.4 for Sembcorp and 2.6/MWh for Keppel.
Figure 19: Comparison of DEPRECIATION/MWh Figure 20: Comparison of Finance Costs/MWh
0
2
4
6
8
10
12
14
YTL Seraya HNP Tuas Senoko Sembcorp Keppel
Depreciation/MWh
0
2
4
6
8
10
12
14
Senoko YTL Seraya HNP Tuas Keppel Sembcorp
Finance Cost/MWh
Source: Company data, Credit Suisse estimates. FY11 for all
companies except YTL Seraya (FY12)
Source: Company data, Credit Suisse estimates. FY11 for all
companies except YTL Seraya (FY12)
S$2 mn/MW acquisition
multiple is at a premium to
the S$1.2-1.6 mn/MW
multiple for Temasek
divestments
11 April 2013
Singapore Utilities Sector 12
Profit decline could be moderated by contracts
locked in with retail customers
While public data is available on spot prices and vesting prices, there is limited disclosure
on the retail contracts of generation companies. Before 2001, all consumers in Singapore
were subjected to the Singapore Power Electricity Tariff. Following the liberalisation of
Singapore’s electricity retail market in 2001, a contestable customer with minimum
electricity consumption of 10,000 kWh and above has the option of choosing the retailer
that provides the best service. Such contracts, which typically range from a month to a
year, limit the impact of volatility from spot prices. We estimate that such retail customers
make up about 30–40% of electricity sales for Tuas Power and Sembcorp Cogen in FY11.
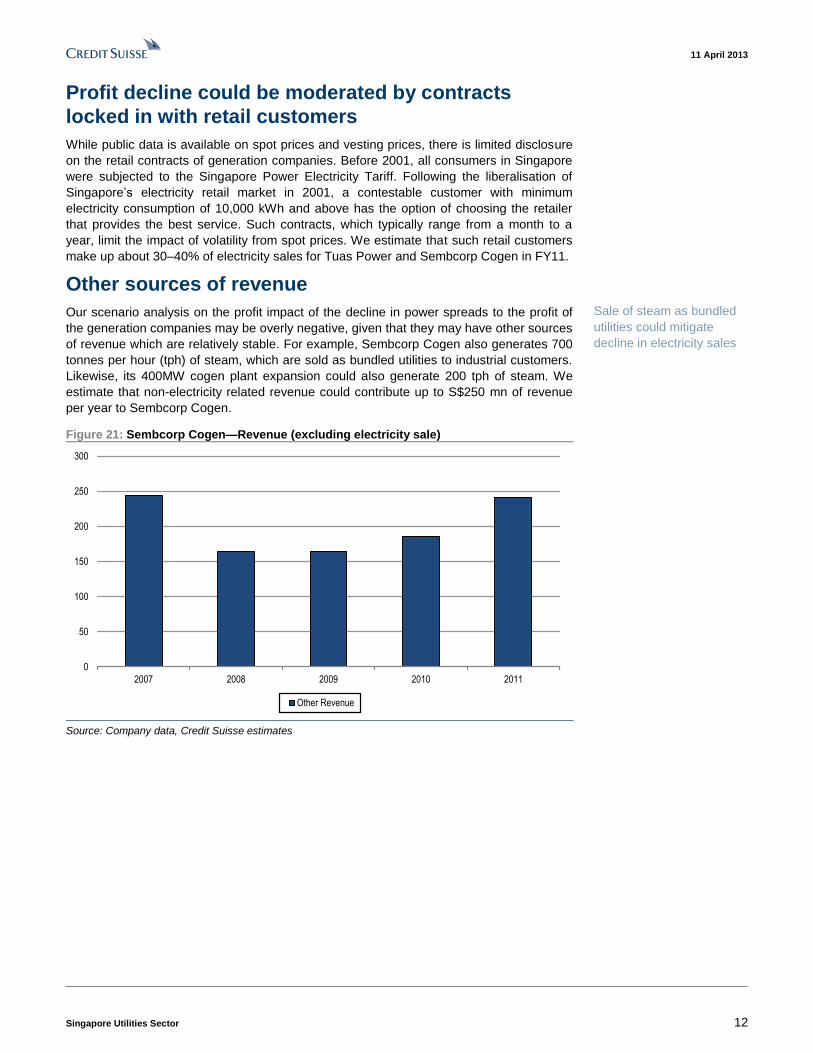
Other sources of revenue
Our scenario analysis on the profit impact of the decline in power spreads to the profit of
the generation companies may be overly negative, given that they may have other sources
of revenue which are relatively stable. For example, Sembcorp Cogen also generates 700
tonnes per hour (tph) of steam, which are sold as bundled utilities to industrial customers.
Likewise, its 400MW cogen plant expansion could also generate 200 tph of steam. We
estimate that non-electricity related revenue could contribute up to S$250 mn of revenue
per year to Sembcorp Cogen.
Figure 21: Sembcorp Cogen—Revenue (excluding electricity sale)
0
50
100
150
200
250
300
2007 2008 2009 2010 2011
Other Revenue
Source: Company data, Credit Suisse estimates
Sale of steam as bundled
utilities could mitigate
decline in electricity sales

11 April 2013
Singapore Utilities Sector 13
Downgrade Sembcorp Industries to NEUTRAL Amongst listed companies that own power generation assets in Singapore, Keppel has the
smallest contribution from power generation in Singapore (5%), while YTL Power—
through its holding in PowerSeraya—has the largest (46%). 19% of Huaneng’s FY12 profit
was from Singapore through its holding in Tuas Power, while 14% of Sembcorp Industries’
profit came from Sembcorp Cogen.
Figure 22: Singapore Power Generation as % of group net profit
0%
5%
10%
15%
20%
25%
30%
35%
40%
45%
50%
YTL Power Huaneng Sembcorp Industries Keppel Corp
Singapore Power Generation as % of Net Profit
Source: Company data, Credit Suisse estimates. FY12 for YTL Power & Huaneng, FY11 for SCI & KEP
We downgrade Sembcorp Industries (NEUTRAL from Outperform, TP S$5.10), since we
believe the market’s earnings expectations do not factor in any potential decline in
profitability because of industry capacity additions. Within the Singapore conglomerate
sector, our preference is for Keppel Corp (OUTPERFORM, TP S$13.70), since market
expectations for its Infrastructure division are low as provisions were taken following the
cost overruns in Qatar.
Within the China Utilities sector, we switch our top sector pick from Huaneng Power to
China Resources Power given the downside risks of a fall in Singapore tariffs and higher
capacity additions in CRP versus HNP.
We maintain our UNDERPERFORM rating on YTL Power as we expect potential profit
decline in Singapore to add to its woes in Malaysia and the UK. However, for exposure to
the YTL group, we prefer YTL Corp.
Figure 23: Sector valuation table
Current Target Up/ down Mkt Cap Div yld P/E (x) P/B (x) ROE (%)
Rating FX price price side (%) US$ mn (%) 12A 13E 14E 12A 13E 14E 12A 13E 14E
Sembcorp Industries N SGD 5.08 5.10 0.4 7,320 3.0 12.0 11.9 10.1 2.0 1.8 1.6 16.7 15.2 15.9
Keppel Corporation O SGD 11.16 13.70 22.8 16,244 4.6 10.5 10.4 10.4 2.2 2.0 1.8 20.7 19.3 17.6
Hyflux Ltd O SGD 1.41 1.60 13.5 981 2.3 35.6 27.2 22.7 2.3 2.0 1.9 6.4 7.5 8.2
Huaneng Power O HKD 8.29 9.00 8.6 15,713 4.6 16.8 11.1 10.7 1.6 1.5 1.4 10.3 14.2 13.6
YTL Power U MYR 1.48 1.40 -5.4 3578 4.4 9.3 9.8 10.2 1.3 1.2 1.1 13.6 12.0 10.5
First Pacific O HKD 10.54 13.03 23.6 5,248 2.1 14.9 13.6 9.9 1.6 1.4 1.3 10.8 10.6 12.8
Manila Electric N PHP 325.00 262.00 -19.4 8,896 3.0 22.2 20.2 19.4 5.3 4.8 4.5 23.8 24.0 23.0
Average 3.8 17.2 14.6 13.9 2.3 2.1 2.1 14.6 14.8 15.2
Source: Company data, Credit Suisse estimates, Thomson Reuters

11 April 2013
Singapore Utilities Sector 14
Asia Pacific / Singapore
Conglomerates (Capital goods - Engineering (Asia)) / UNDERWEIGHT
Sembcorp Industries Limited
(SCIL.SI / SCI SP)
Expectations for Singapore utilities high
■ Downgrade to NEUTRAL. While Sembcorp Cogen has generated superior
returns relative to its peers, we believe market earnings expectations for
2013 are optimistic and do not factor in any potential decline in tariffs and
profit on the back of industry capacity additions. As such, we downgrade
Sembcorp Industries to NEUTRAL (from Outperform), as we expect positive
earnings momentum to be reversed.
■ Market expectations for Utilities optimistic. Our base case assumes a
20% fall in Sembcorp Cogen’s net profit in 2013 on lower power spreads. As
a result, we lower our 2013 Utilities net profit forecast to S$350 mn from
S$375 mn. Based on consensus earnings estimates, we believe the market
is expecting power spreads in Singapore to remain constant. In the worst
case scenario where profitability declines to 2007 levels, there could be 10%
downside to our net profit forecasts for Sembcorp Industries. However, we
expect downside support from retail contracts locked in, as well as sale of
steam to industrial customers.
■ Marine margins moderating. Marine operating margins declined to 12.5%
in 2012 from 18.6% in 2011. We expect 2013 operating margin to decline
further to 12.0%, in-line with management guidance of 10–13% but below
consensus of 12.5%, driven by profit recognition for the drill-ship and other
new products in its orderbook.
■ Valuation. We lower our target price to S$5.10 from S$5.90, based on
SOTP method, valuing the Utilities business at 2013 P/E of 10x, and the
Marine business using our target price of S$4.00.
Share price performance
60
80
100
120
2
4
6
8
Apr-11 Aug-11 Dec-11 Apr-12 Aug-12 Dec-12
Price (LHS) Rebased Rel (RHS)
The price relative chart measures performance against the
FTSE STRAITS TIMES IDX which closed at 3285.81 on
08/04/13
On 08/04/13 the spot exchange rate was S$1.24/US$1
Performance Over 1M 3M 12M Absolute (%) -2.7 -5.0 -4.0 Relative (%) -2.5 -7.5 -14.0
Financial and valuation metrics
Year 12/12A 12/13E 12/14E 12/15E Revenue (S$ mn) 10,189.1 11,624.5 14,050.9 14,174.5 EBITDA (S$ mn) 1,385.0 1,393.7 1,609.9 1,639.5 EBIT (S$ mn) 1,103.4 1,111.1 1,326.3 1,355.9 Net profit (S$ mn) 753.7 762.4 895.4 923.2 EPS (CS adj.) (S$) 0.42 0.43 0.50 0.52 Change from previous EPS (%) n.a. -3.1 -0.1 -1.0 Consensus EPS (S$) n.a. 0.44 0.50 0.54 EPS growth (%) -6.9 1.1 17.3 3.0 P/E (x) 12.0 11.9 10.1 9.9 Dividend yield (%) 3.0 3.0 3.0 3.0 EV/EBITDA (x) 6.7 7.1 5.9 5.4 P/B (x) 2.0 1.8 1.6 1.4 ROE (%) 17.5 16.0 16.8 15.5 Net debt/equity (%) 3.3 13.2 4.8 net cash
Source: Company data, Thomson Reuters, Credit Suisse estimates.
Rating (from Outperform) NEUTRAL* Price (08 Apr 13, S$) 5.08 Target price (S$) (from 5.90) 5.10¹ Upside/downside (%) 0.39 Mkt cap (S$ mn) 9,081 (US$ 7,311) Enterprise value (S$ mn) 9,912 Number of shares (mn) 1,787.55 Free float (%) 23.8 52-week price range 5.76 - 4.67 ADTO - 6M (US$ mn) 14.2
*Stock ratings are relative to the coverage universe in each
analyst's or each team's respective sector.
¹Target price is for 12 months.
Research Analysts
Gerald Wong, CFA
65 6212 3037

11 April 2013
Singapore Utilities Sector 15
Sembcorp Cogen contributed 14% of SCI’s net profit
in FY11
Sembcorp Cogen operates a 815MW combined cycle gas turbine plant in the Sakra
district of Jurong Island in Singapore. Commissioned in 2001, the plant remains
Singapore’s largest cogeneration facility. Sembcorp Cogen generated S$111 mn of net
profit in 2011, representing 37% of Sembcorp Industries’ Utilities net profit, and 14% of
Sembcorp Industries’ net profit. While the breakdown in 2012 was not disclosed, we
estimate that the bulk of the increase in Singapore Utilities in 2012 to be driven by
Sembcorp Gas with the additional 90 bbtu of gas supply into Singapore.
Figure 24: Sembcorp Cogen’s contribution to Singapore net profit
Others 2007 2008 2009 2010 2011 2012E 2013E 2014E
Sembcorp Cogen 30 63 84 84 111 134 107 135
Sembcorp Gas 48 75 27 43 55 109 82 82
Others 49 -7 20 20 17 20 20 20
Singapore Total 127 131 131 147 183 263 209 237
Sembcorp Cogen as % of Singapore 24% 48% 64% 57% 61% 51% 51% 57%
Sembcorp Utilities 244 202 227 231 304 375 350 400
Sembcorp Cogen as % of Utilities 12% 31% 37% 36% 37% 36% 31% 34%
Sembcorp Industries 557 534 683 761 809 753 762 881
Sembcorp Cogen as % of SCI 5% 12% 12% 11% 14% 18% 14% 15%
Source: Company data, Credit Suisse estimates
Lower 2013 Utilities net profit forecast to S$350 mn
Our base case assumes a 20% fall in Sembcorp Cogen’s net profit in 2013 on lower power
spreads. As a result, we lower our 2013 Utilities net profit forecast to S$350 mn. In the
worst case scenario assuming that profitability declines to 2007 levels, Utilities net profit
could decline to about S$273 mn. This would imply 10% downside to our net profit
forecasts for Sembcorp Industries.
Figure 25: Base case assumes 20% decrease in
Sembcorp Cogen profit in 2013E
Figure 26: Worst case assumes Sembcorp cogen profit in
2013E declines to 2007 levels
134 107
241243
327 360
52 52
753 762
0
100
200
300
400
500
600
700
800
900
2012 2013 Base case
Sembcorp Cogen Utilities - Others Marine Others
13430
241
243
327
360
52
52
753
685
0
100
200
300
400
500
600
700
800
900
2012 2013 Worst case
Sembcorp Cogen Utilities - Others Marine Others
Source: Company data, Credit Suisse estimates Source: Company data, Credit Suisse estimates
Base case: S$350 mn
Worst case: S$273 mn
11 April 2013
Singapore Utilities Sector 16
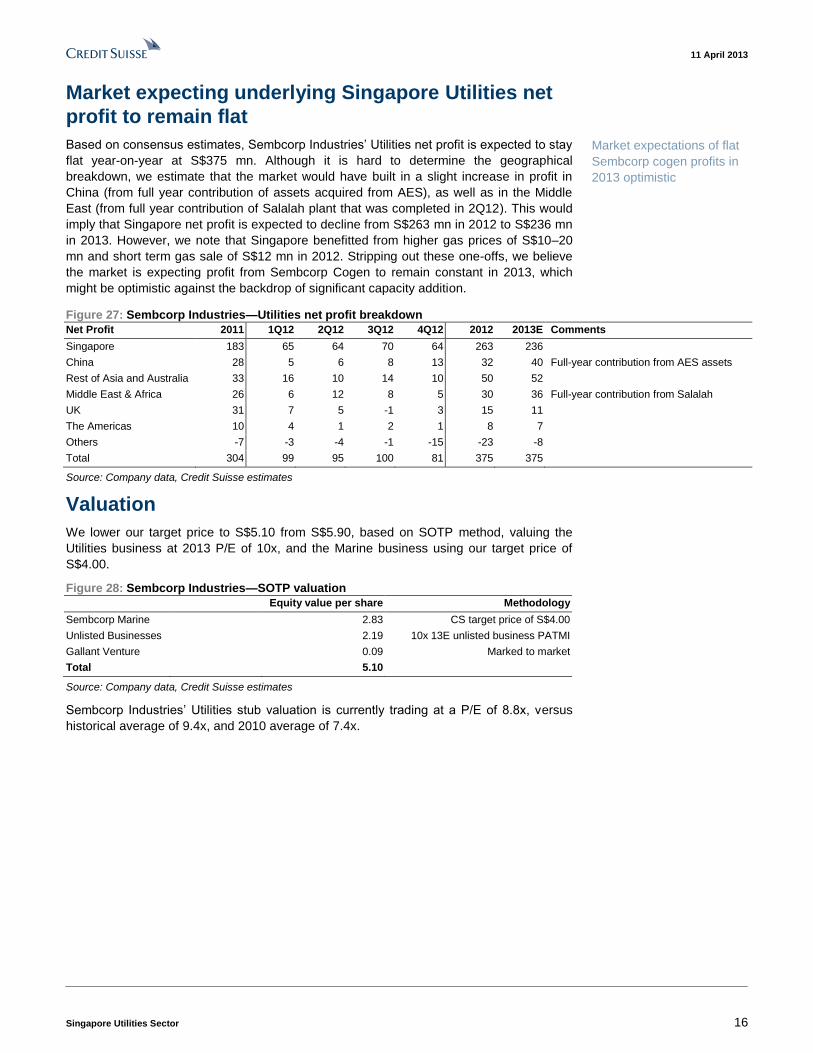
Market expecting underlying Singapore Utilities net
profit to remain flat
Based on consensus estimates, Sembcorp Industries’ Utilities net profit is expected to stay
flat year-on-year at S$375 mn. Although it is hard to determine the geographical
breakdown, we estimate that the market would have built in a slight increase in profit in
China (from full year contribution of assets acquired from AES), as well as in the Middle
East (from full year contribution of Salalah plant that was completed in 2Q12). This would
imply that Singapore net profit is expected to decline from S$263 mn in 2012 to S$236 mn
in 2013. However, we note that Singapore benefitted from higher gas prices of S$10–20
mn and short term gas sale of S$12 mn in 2012. Stripping out these one-offs, we believe
the market is expecting profit from Sembcorp Cogen to remain constant in 2013, which
might be optimistic against the backdrop of significant capacity addition.
Figure 27: Sembcorp Industries—Utilities net profit breakdown
Net Profit 2011 1Q12 2Q12 3Q12 4Q12 2012 2013E Comments
Singapore 183 65 64 70 64 263 236
China 28 5 6 8 13 32 40 Full-year contribution from AES assets
Rest of Asia and Australia 33 16 10 14 10 50 52
Middle East & Africa 26 6 12 8 5 30 36 Full-year contribution from Salalah
UK 31 7 5 -1 3 15 11
The Americas 10 4 1 2 1 8 7
Others -7 -3 -4 -1 -15 -23 -8
Total 304 99 95 100 81 375 375
Source: Company data, Credit Suisse estimates
Valuation
We lower our target price to S$5.10 from S$5.90, based on SOTP method, valuing the
Utilities business at 2013 P/E of 10x, and the Marine business using our target price of
S$4.00.
Figure 28: Sembcorp Industries—SOTP valuation
Equity value per share Methodology
Sembcorp Marine 2.83 CS target price of S$4.00
Unlisted Businesses 2.19 10x 13E unlisted business PATMI
Gallant Venture 0.09 Marked to market
Total 5.10
Source: Company data, Credit Suisse estimates
Sembcorp Industries’ Utilities stub valuation is currently trading at a P/E of 8.8x, versus
historical average of 9.4x, and 2010 average of 7.4x.
Market expectations of flat
Sembcorp cogen profits in
2013 optimistic

11 April 2013
Singapore Utilities Sector 17
Figure 29: Sembcorp Industries—Utilities Stub valuation
0
5
10
15
20
25
Dec-02 Dec-03 Dec-04 Dec-05 Dec-06 Dec-07 Dec-08 Dec-09 Dec-10 Dec-11 Dec-12
P/E Average +1 std dev -1 std dev
Source: Company data, Credit Suisse estimates, BLOOMBERG
11 April 2013
Singapore Utilities Sector 18
Asia Pacific / Singapore
Conglomerates (Capital goods - Engineering (Asia)) / UNDERWEIGHT
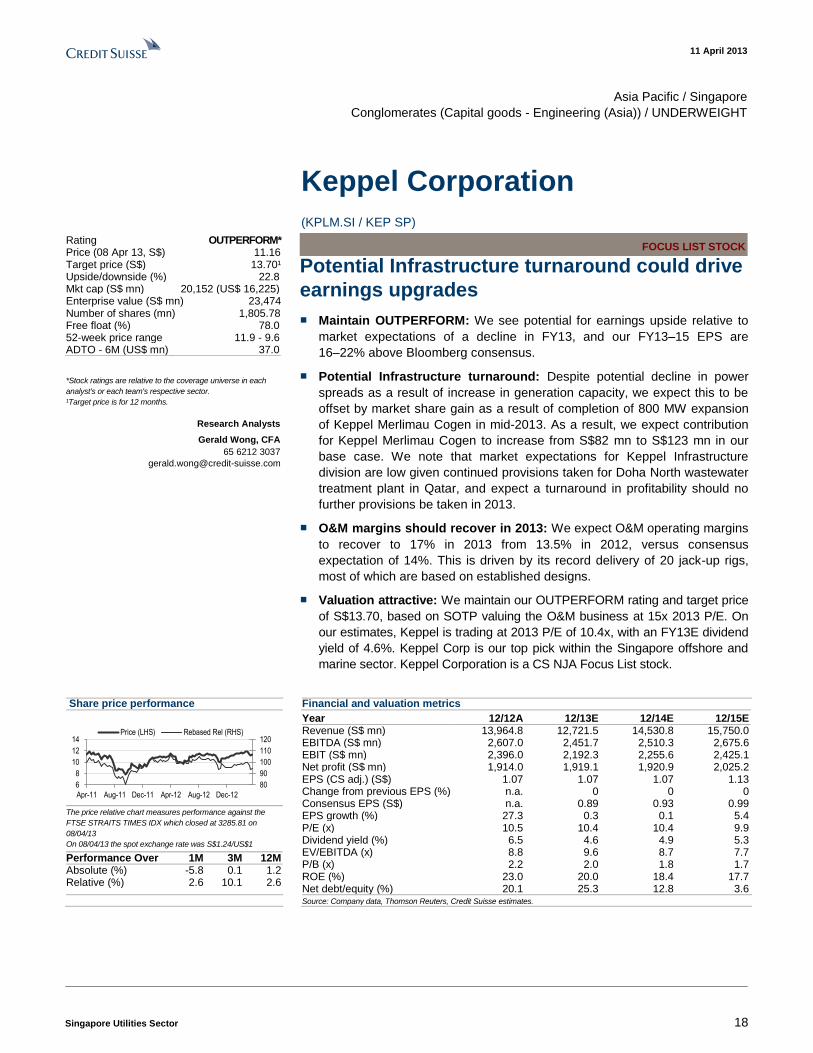
Keppel Corporation
(KPLM.SI / KEP SP) FOCUS LIST STOCK
Potential Infrastructure turnaround could drive
earnings upgrades
■ Maintain OUTPERFORM: We see potential for earnings upside relative to
market expectations of a decline in FY13, and our FY13–15 EPS are
16–22% above Bloomberg consensus.
■ Potential Infrastructure turnaround: Despite potential decline in power
spreads as a result of increase in generation capacity, we expect this to be
offset by market share gain as a result of completion of 800 MW expansion
of Keppel Merlimau Cogen in mid-2013. As a result, we expect contribution
for Keppel Merlimau Cogen to increase from S$82 mn to S$123 mn in our
base case. We note that market expectations for Keppel Infrastructure
division are low given continued provisions taken for Doha North wastewater
treatment plant in Qatar, and expect a turnaround in profitability should no
further provisions be taken in 2013.
■ O&M margins should recover in 2013: We expect O&M operating margins
to recover to 17% in 2013 from 13.5% in 2012, versus consensus
expectation of 14%. This is driven by its record delivery of 20 jack-up rigs,
most of which are based on established designs.
■ Valuation attractive: We maintain our OUTPERFORM rating and target price
of S$13.70, based on SOTP valuing the O&M business at 15x 2013 P/E. On
our estimates, Keppel is trading at 2013 P/E of 10.4x, with an FY13E dividend
yield of 4.6%. Keppel Corp is our top pick within the Singapore offshore and
marine sector. Keppel Corporation is a CS NJA Focus List stock.
Share price performance
80
90
100
110
120
6
8
10
12
14
Apr-11 Aug-11 Dec-11 Apr-12 Aug-12 Dec-12
Price (LHS) Rebased Rel (RHS)
The price relative chart measures performance against the
FTSE STRAITS TIMES IDX which closed at 3285.81 on
08/04/13
On 08/04/13 the spot exchange rate was S$1.24/US$1
Performance Over 1M 3M 12M Absolute (%) -5.8 0.1 1.2 Relative (%) 2.6 10.1 2.6
Financial and valuation metrics
Year 12/12A 12/13E 12/14E 12/15E Revenue (S$ mn) 13,964.8 12,721.5 14,530.8 15,750.0 EBITDA (S$ mn) 2,607.0 2,451.7 2,510.3 2,675.6 EBIT (S$ mn) 2,396.0 2,192.3 2,255.6 2,425.1 Net profit (S$ mn) 1,914.0 1,919.1 1,920.9 2,025.2 EPS (CS adj.) (S$) 1.07 1.07 1.07 1.13 Change from previous EPS (%) n.a. 0 0 0 Consensus EPS (S$) n.a. 0.89 0.93 0.99 EPS growth (%) 27.3 0.3 0.1 5.4 P/E (x) 10.5 10.4 10.4 9.9 Dividend yield (%) 6.5 4.6 4.9 5.3 EV/EBITDA (x) 8.8 9.6 8.7 7.7 P/B (x) 2.2 2.0 1.8 1.7 ROE (%) 23.0 20.0 18.4 17.7 Net debt/equity (%) 20.1 25.3 12.8 3.6
Source: Company data, Thomson Reuters, Credit Suisse estimates.
Rating OUTPERFORM* Price (08 Apr 13, S$) 11.16 Target price (S$) 13.70¹ Upside/downside (%) 22.8 Mkt cap (S$ mn) 20,152 (US$ 16,225) Enterprise value (S$ mn) 23,474 Number of shares (mn) 1,805.78 Free float (%) 78.0 52-week price range 11.9 - 9.6 ADTO - 6M (US$ mn) 37.0
*Stock ratings are relative to the coverage universe in each
analyst's or each team's respective sector.
¹Target price is for 12 months.
Research Analysts
Gerald Wong, CFA
65 6212 3037
11 April 2013
Singapore Utilities Sector 19
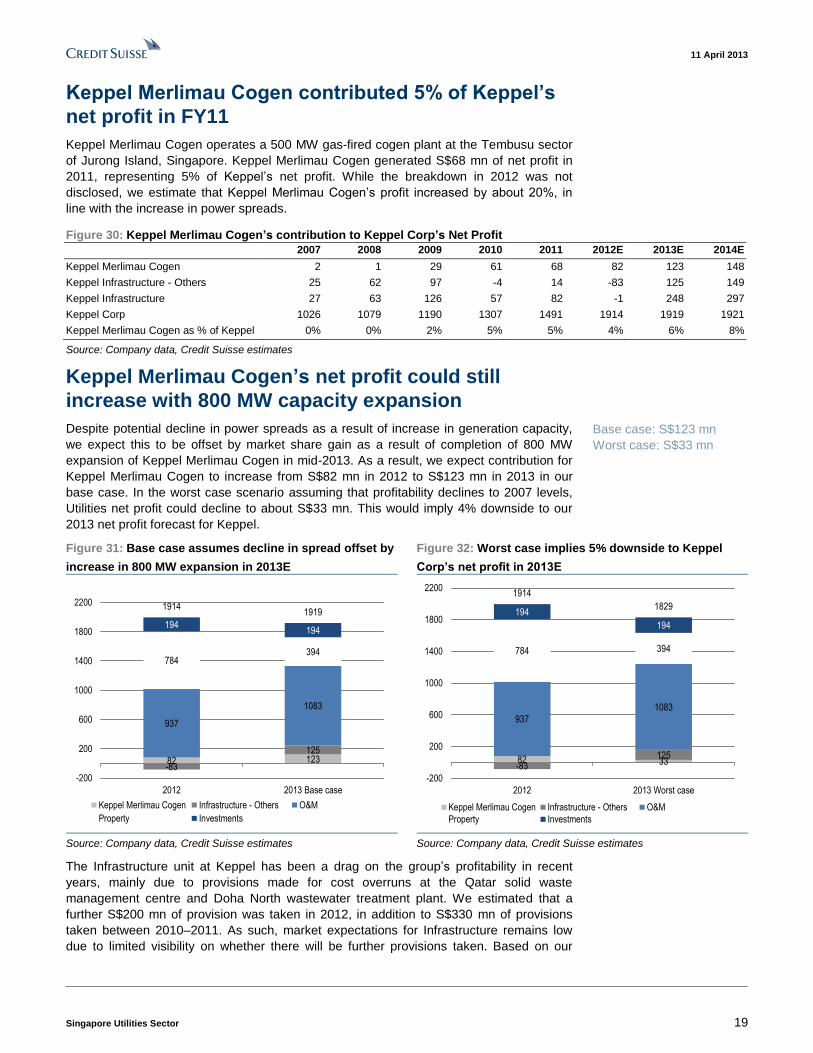
Keppel Merlimau Cogen contributed 5% of Keppel’s
net profit in FY11
Keppel Merlimau Cogen operates a 500 MW gas-fired cogen plant at the Tembusu sector
of Jurong Island, Singapore. Keppel Merlimau Cogen generated S$68 mn of net profit in
2011, representing 5% of Keppel’s net profit. While the breakdown in 2012 was not
disclosed, we estimate that Keppel Merlimau Cogen’s profit increased by about 20%, in
line with the increase in power spreads.
Figure 30: Keppel Merlimau Cogen’s contribution to Keppel Corp’s Net Profit
2007 2008 2009 2010 2011 2012E 2013E 2014E
Keppel Merlimau Cogen 2 1 29 61 68 82 123 148
Keppel Infrastructure - Others 25 62 97 -4 14 -83 125 149
Keppel Infrastructure 27 63 126 57 82 -1 248 297
Keppel Corp 1026 1079 1190 1307 1491 1914 1919 1921
Keppel Merlimau Cogen as % of Keppel 0% 0% 2% 5% 5% 4% 6% 8%
Source: Company data, Credit Suisse estimates
Keppel Merlimau Cogen’s net profit could still
increase with 800 MW capacity expansion
Despite potential decline in power spreads as a result of increase in generation capacity,
we expect this to be offset by market share gain as a result of completion of 800 MW
expansion of Keppel Merlimau Cogen in mid-2013. As a result, we expect contribution for
Keppel Merlimau Cogen to increase from S$82 mn in 2012 to S$123 mn in 2013 in our
base case. In the worst case scenario assuming that profitability declines to 2007 levels,
Utilities net profit could decline to about S$33 mn. This would imply 4% downside to our
2013 net profit forecast for Keppel.
Figure 31: Base case assumes decline in spread offset by
increase in 800 MW expansion in 2013E
Figure 32: Worst case implies 5% downside to Keppel
Corp’s net profit in 2013E
82 123-83
125
937
1083
784394
194194
19141919
-200
200
600
1000
1400
1800
2200
2012 2013 Base case
Keppel Merlimau Cogen Infrastructure - Others O&M
Property Investments
82 33-83125
937
1083
784 394
194
194
1914
1829
-200
200
600
1000
1400
1800
2200
2012 2013 Worst case
Keppel Merlimau Cogen Infrastructure - Others O&M
Property Investments
Source: Company data, Credit Suisse estimates Source: Company data, Credit Suisse estimates
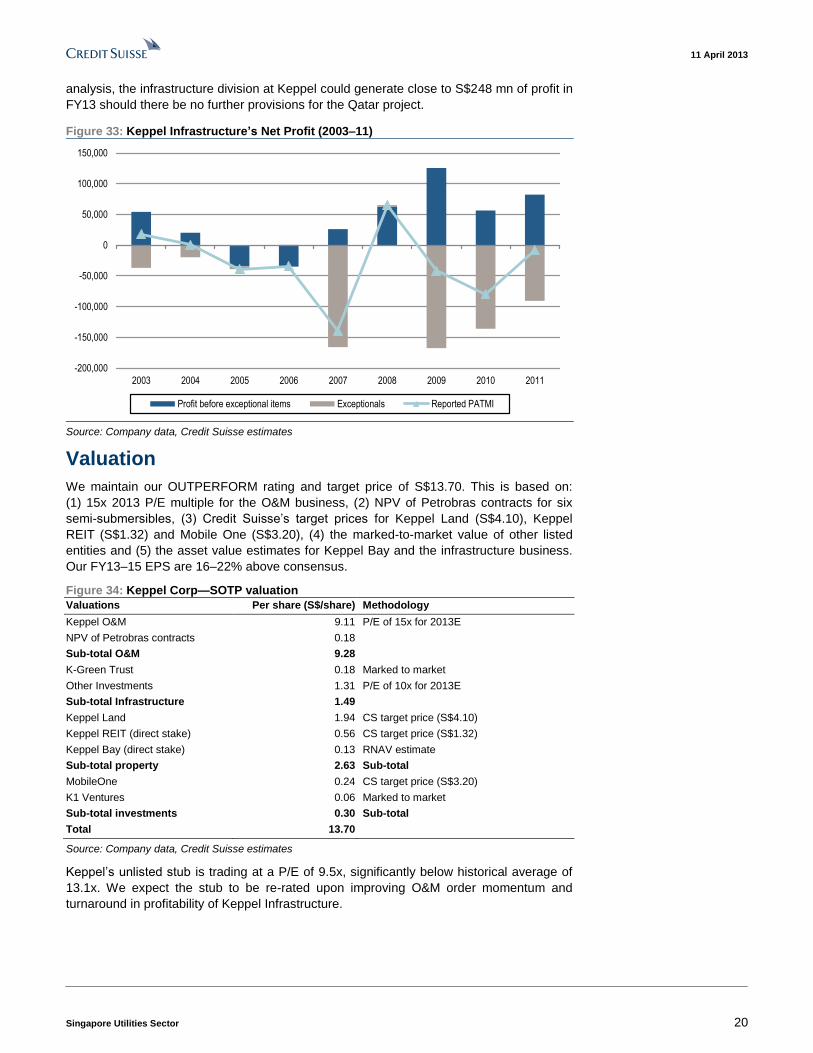
The Infrastructure unit at Keppel has been a drag on the group’s profitability in recent
years, mainly due to provisions made for cost overruns at the Qatar solid waste
management centre and Doha North wastewater treatment plant. We estimated that a
further S$200 mn of provision was taken in 2012, in addition to S$330 mn of provisions
taken between 2010–2011. As such, market expectations for Infrastructure remains low
due to limited visibility on whether there will be further provisions taken. Based on our
Base case: S$123 mn
Worst case: S$33 mn
11 April 2013
Singapore Utilities Sector 20
analysis, the infrastructure division at Keppel could generate close to S$248 mn of profit in
FY13 should there be no further provisions for the Qatar project.
Figure 33: Keppel Infrastructure’s Net Profit (2003–11)
-200,000
-150,000
-100,000
-50,000
0
50,000
100,000
150,000
2003 2004 2005 2006 2007 2008 2009 2010 2011
Profit before exceptional items Exceptionals Reported PATMI
Source: Company data, Credit Suisse estimates
Valuation
We maintain our OUTPERFORM rating and target price of S$13.70. This is based on:
(1) 15x 2013 P/E multiple for the O&M business, (2) NPV of Petrobras contracts for six
semi-submersibles, (3) Credit Suisse’s target prices for Keppel Land (S$4.10), Keppel
REIT (S$1.32) and Mobile One (S$3.20), (4) the marked-to-market value of other listed
entities and (5) the asset value estimates for Keppel Bay and the infrastructure business.
Our FY13–15 EPS are 16–22% above consensus.
Figure 34: Keppel Corp—SOTP valuation
Valuations Per share (S$/share) Methodology
Keppel O&M 9.11 P/E of 15x for 2013E
NPV of Petrobras contracts 0.18
Sub-total O&M 9.28
K-Green Trust 0.18 Marked to market
Other Investments 1.31 P/E of 10x for 2013E
Sub-total Infrastructure 1.49
Keppel Land 1.94 CS target price (S$4.10)
Keppel REIT (direct stake) 0.56 CS target price (S$1.32)
Keppel Bay (direct stake) 0.13 RNAV estimate
Sub-total property 2.63 Sub-total
MobileOne 0.24 CS target price (S$3.20)
K1 Ventures 0.06 Marked to market
Sub-total investments 0.30 Sub-total
Total 13.70
Source: Company data, Credit Suisse estimates
Keppel’s unlisted stub is trading at a P/E of 9.5x, significantly below historical average of
13.1x. We expect the stub to be re-rated upon improving O&M order momentum and
turnaround in profitability of Keppel Infrastructure.

11 April 2013
Singapore Utilities Sector 21
Figure 35: Keppel O&M’s stub valuation
0.0
5.0
10.0
15.0
20.0
25.0
30.0
Dec-0
2
Jun
-03
Dec-0
3
Jun
-04
Dec-0
4
Jun
-05
Dec-0
5
Jun
-06
Dec-0
6
Jun
-07
Dec-0
7
Jun
-08
Dec-0
8
Jun
-09
Dec-0
9
Jun
-10
Dec-1
0
Jun
-11
Dec-1
1
Jun
-12
Dec-1
2
P/E Average +1 std dev -1 std dev
Source: Company data, Credit Suisse estimates, BLOOMBERG
11 April 2013
Singapore Utilities Sector 22
Asia Pacific / China
Electric Utilities
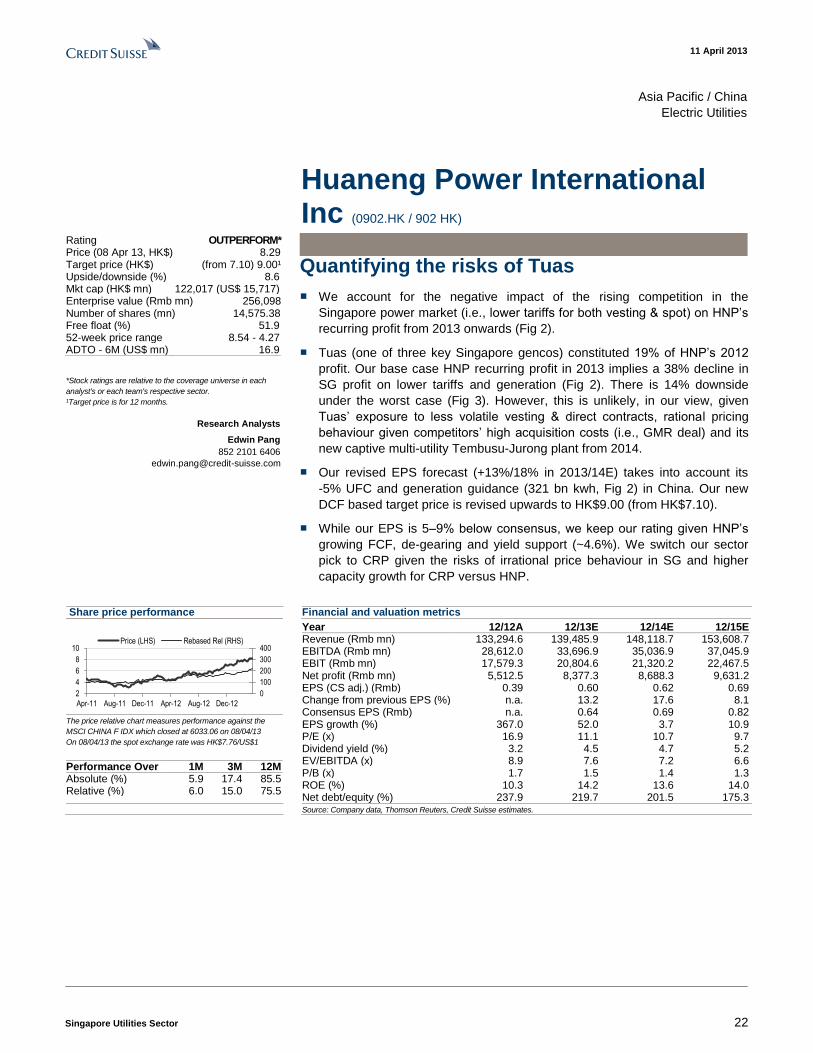
Huaneng Power International Inc (0902.HK / 902 HK)
Quantifying the risks of Tuas
■ We account for the negative impact of the rising competition in the
Singapore power market (i.e., lower tariffs for both vesting & spot) on HNP’s
recurring profit from 2013 onwards (Fig 2).
■ Tuas (one of three key Singapore gencos) constituted 19% of HNP’s 2012
profit. Our base case HNP recurring profit in 2013 implies a 38% decline in
SG profit on lower tariffs and generation (Fig 2). There is 14% downside
under the worst case (Fig 3). However, this is unlikely, in our view, given
Tuas’ exposure to less volatile vesting & direct contracts, rational pricing
behaviour given competitors’ high acquisition costs (i.e., GMR deal) and its
new captive multi-utility Tembusu-Jurong plant from 2014.
■ Our revised EPS forecast (+13%/18% in 2013/14E) takes into account its
-5% UFC and generation guidance (321 bn kwh, Fig 2) in China. Our new
DCF based target price is revised upwards to HK$9.00 (from HK$7.10).
■ While our EPS is 5–9% below consensus, we keep our rating given HNP’s
growing FCF, de-gearing and yield support (~4.6%). We switch our sector
pick to CRP given the risks of irrational price behaviour in SG and higher
capacity growth for CRP versus HNP.
Share price performance
0
100
200
300
400
2
4
6
8
10
Apr-11 Aug-11 Dec-11 Apr-12 Aug-12 Dec-12
Price (LHS) Rebased Rel (RHS)
The price relative chart measures performance against the
MSCI CHINA F IDX which closed at 6033.06 on 08/04/13
On 08/04/13 the spot exchange rate was HK$7.76/US$1
Performance Over 1M 3M 12M Absolute (%) 5.9 17.4 85.5 Relative (%) 6.0 15.0 75.5
Financial and valuation metrics
Year 12/12A 12/13E 12/14E 12/15E Revenue (Rmb mn) 133,294.6 139,485.9 148,118.7 153,608.7 EBITDA (Rmb mn) 28,612.0 33,696.9 35,036.9 37,045.9 EBIT (Rmb mn) 17,579.3 20,804.6 21,320.2 22,467.5 Net profit (Rmb mn) 5,512.5 8,377.3 8,688.3 9,631.2 EPS (CS adj.) (Rmb) 0.39 0.60 0.62 0.69 Change from previous EPS (%) n.a. 13.2 17.6 8.1 Consensus EPS (Rmb) n.a. 0.64 0.69 0.82 EPS growth (%) 367.0 52.0 3.7 10.9 P/E (x) 16.9 11.1 10.7 9.7 Dividend yield (%) 3.2 4.5 4.7 5.2 EV/EBITDA (x) 8.9 7.6 7.2 6.6 P/B (x) 1.7 1.5 1.4 1.3 ROE (%) 10.3 14.2 13.6 14.0 Net debt/equity (%) 237.9 219.7 201.5 175.3
Source: Company data, Thomson Reuters, Credit Suisse estimates.
Rating OUTPERFORM* Price (08 Apr 13, HK$) 8.29 Target price (HK$) (from 7.10) 9.00¹ Upside/downside (%) 8.6 Mkt cap (HK$ mn) 122,017 (US$ 15,717) Enterprise value (Rmb mn) 256,098 Number of shares (mn) 14,575.38 Free float (%) 51.9 52-week price range 8.54 - 4.27 ADTO - 6M (US$ mn) 16.9
*Stock ratings are relative to the coverage universe in each
analyst's or each team's respective sector.
¹Target price is for 12 months.
Research Analysts
Edwin Pang
852 2101 6406
11 April 2013
Singapore Utilities Sector 23
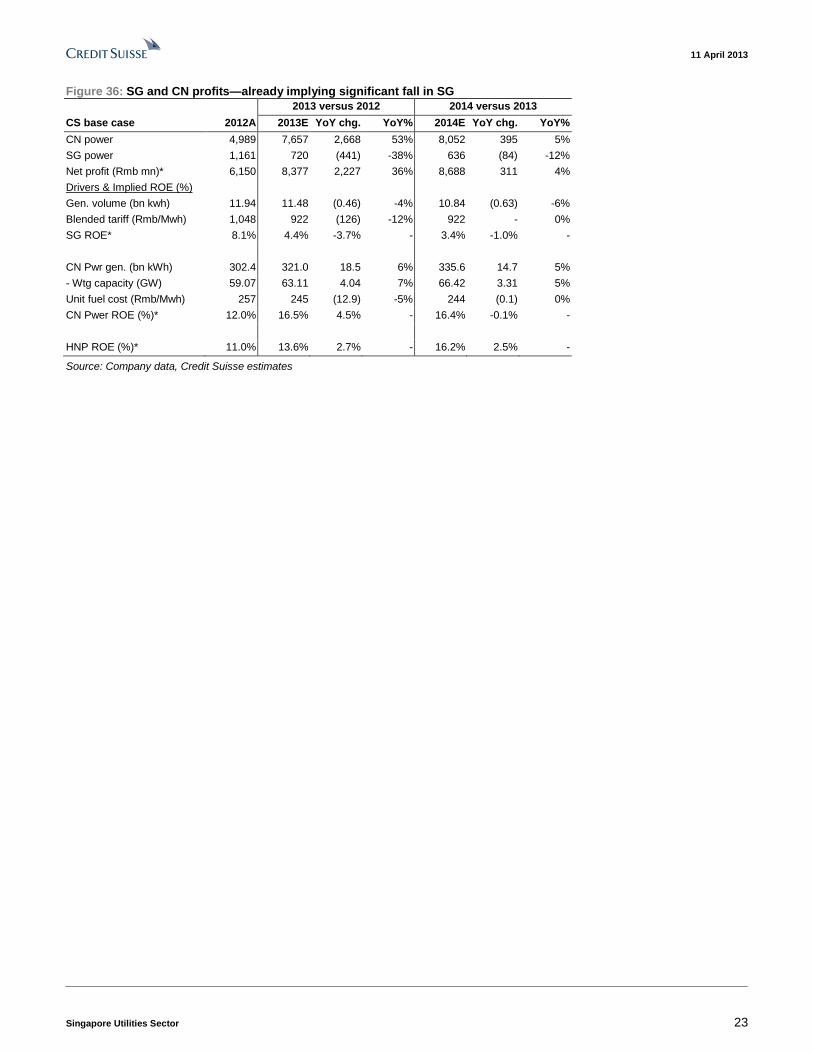
Figure 36: SG and CN profits—already implying significant fall in SG
2013 versus 2012 2014 versus 2013
CS base case 2012A 2013E YoY chg. YoY% 2014E YoY chg. YoY%
CN power 4,989 7,657 2,668 53% 8,052 395 5%
SG power 1,161 720 (441) -38% 636 (84) -12%
Net profit (Rmb mn)* 6,150 8,377 2,227 36% 8,688 311 4%
Drivers & Implied ROE (%)
Gen. volume (bn kwh) 11.94 11.48 (0.46) -4% 10.84 (0.63) -6%
Blended tariff (Rmb/Mwh) 1,048 922 (126) -12% 922 - 0%
SG ROE* 8.1% 4.4% -3.7% - 3.4% -1.0% -
CN Pwr gen. (bn kWh) 302.4 321.0 18.5 6% 335.6 14.7 5%
- Wtg capacity (GW) 59.07 63.11 4.04 7% 66.42 3.31 5%
Unit fuel cost (Rmb/Mwh) 257 245 (12.9) -5% 244 (0.1) 0%
CN Pwer ROE (%)* 12.0% 16.5% 4.5% - 16.4% -0.1% -
HNP ROE (%)* 11.0% 13.6% 2.7% - 16.2% 2.5% -
Source: Company data, Credit Suisse estimates

11 April 2013
Singapore Utilities Sector 24
Asia Pacific / Malaysia
Electric Utilities
YTL Power
(YTLP.KL / YTLP MK)
More bad news
■ Singapore sting: YTL Power’s (YTLP) wholly owned merchant power plant
in Singapore, Power Seraya, will be adversely affected by the 30% capacity
increase in the island state over 2013–14. The expected 15% fall in the
Uniform Singapore Electricity Price (USEP) will result in an estimated 19%
decline in YTL Power’s FY14 EPS.
■ Malaysia maelstrom: The outlook for YTLP power in its home market
remains poor. The company was unsuccessful in extending the Power
Purchase Agreement (PPA) for its Pasir Gudang plant that is set to expire in
2016. The future of the power plant, which sits on TNB land leased until
2016, is also unclear at this stage. Meanwhile, we expect YTLP’s WiMax
based telco, YES, to continue to report losses as it struggles to achieve its
1 mn target subscriber base to break even (0.5 mn subs at end-2012).
■ UK water woes: YTLP’s Wessex Water is perceived to be in a low-risk
sector, with fixed regulatory framework and inflation-linked cash flows.
However, impending regulatory changes under the 2014 price control review
(PR14) could see a reduction in ‘allowed returns’ for the sector. Moreover,
regulator OFWAT is considering removing the RPI-linkage of prices. At the
same time, the UK’s ‘Office for National Statistics’ is considering adjusting
the way RPI is calculated, which could lower both RPI and returns to the
water companies.
■ Maintain UNDERPERFORM: On the back of these developments, we have
downgraded our FY13–14 forecast by 11–30%, and reduced our SOTP
based target price to RM1.40 (from RM1.82). We remain negative on YTLP
and reiterate our UNDERPERFORM rating on the stock. However, for
exposure to the YTL group, we prefer YTL Corp.
Share price performance
40
60
80
100
120
0
1
2
3
4
Apr-11 Aug-11 Dec-11 Apr-12 Aug-12 Dec-12
Price (LHS) Rebased Rel (RHS)
The price relative chart measures performance against the
FTSE BURSA MALAYSIA KLCI IDX which closed at 1693.31
on 08/04/13
On 08/04/13 the spot exchange rate was RM3.06/US$1
Performance Over 1M 3M 12M Absolute (%) -4.5 -10.2 -17.6 Relative (%) -4.3 -12.6 -27.6
Financial and valuation metrics
Year 6/12A 6/13E 6/14E 6/15E Revenue (RM mn) 15,876.2 15,448.2 14,130.6 14,380.2 EBITDA (RM mn) 2,824.8 3,158.0 2,934.3 3,058.2 EBIT (RM mn) 1,664.3 2,052.8 1,807.3 1,909.1 Net profit (RM mn) 1,229.9 1,317.4 1,115.5 1,184.8 EPS (CS adj.) (RM) 0.15 0.16 0.14 0.15 Change from previous EPS (%) n.a. -10.6 -30.0 Consensus EPS (RM) n.a. 0.16 0.17 0.17 EPS growth (%) -7.7 6.8 -14.8 5.9 P/E (x) 9.7 9.1 10.7 10.1 Dividend yield (%) 4.4 4.4 4.4 4.4 EV/EBITDA (x) 12.0 10.8 11.6 11.1 P/B (x) 1.3 1.2 1.1 1.1 ROE (%) 13.7 13.4 10.5 10.5 Net debt/equity (%) 235.2 218.5 207.2 195.3
Source: Company data, Thomson Reuters, Credit Suisse estimates.
Rating UNDERPERFORM* Price (08 Apr 13, RM) 1.50 Target price (RM) (from 1.82) 1.40¹ Upside/downside (%) -6.7 Mkt cap (RM mn) 11,007 (US$ 3,598) Enterprise value (RM mn) 33,993 Number of shares (mn) 7,337.94 Free float (%) 38.6 52-week price range 1.85 - 1.41 ADTO - 6M (US$ mn) 1.8
*Stock ratings are relative to the coverage universe in each
analyst's or each team's respective sector.
¹Target price is for 12 months.
Research Analysts
Annuar Aziz
60 3 2723 2084
11 April 2013
Singapore Utilities Sector 25
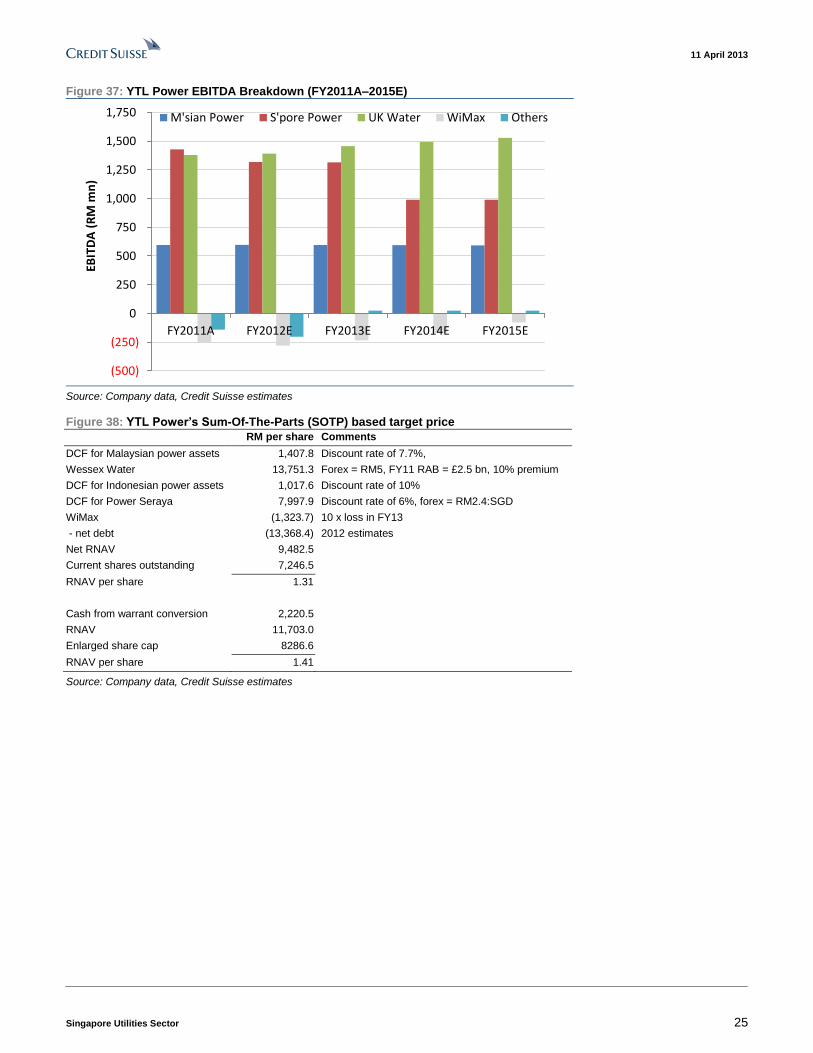
Figure 37: YTL Power EBITDA Breakdown (FY2011A–2015E)
(500)
(250)
0
250
500
750
1,000
1,250
1,500
1,750
FY2011A FY2012E FY2013E FY2014E FY2015E
EBIT
DA
(R
M m
n)
M'sian Power S'pore Power UK Water WiMax Others
Source: Company data, Credit Suisse estimates
Figure 38: YTL Power’s Sum-Of-The-Parts (SOTP) based target price
RM per share Comments
DCF for Malaysian power assets 1,407.8 Discount rate of 7.7%,
Wessex Water 13,751.3 Forex = RM5, FY11 RAB = £2.5 bn, 10% premium
DCF for Indonesian power assets 1,017.6 Discount rate of 10%
DCF for Power Seraya 7,997.9 Discount rate of 6%, forex = RM2.4:SGD
WiMax (1,323.7) 10 x loss in FY13
- net debt (13,368.4) 2012 estimates
Net RNAV 9,482.5
Current shares outstanding 7,246.5
RNAV per share 1.31
Cash from warrant conversion 2,220.5
RNAV 11,703.0
Enlarged share cap 8286.6
RNAV per share 1.41
Source: Company data, Credit Suisse estimates

11 April 2013
Singapore Utilities Sector 26
Appendix—Singapore power market Overview of the industry
The Energy Market Authority, a statutory board under the Ministry of Trade and Industry, is
responsible for the overall regulation of the electricity and gas industries in Singapore.
Governed by the Electricity Act, The National Electricity Market of Singapore (NEMS)
seeks to ensure an efficient supply of competitively priced electricity, amongst other
objectives.
The decision to liberalise the power and gas industries in Singapore was undertaken in
1995, when Singapore Power was first corporatised from a government statutory board to
a commercial company. Following the acquisition of Singapore Power by Temasek
Holdings, various power system assets were subsequently restructured to facilitate
privatisation, with the divestment of all three power generation companies in 2008: Tuas
Power was sold to China Huaneng Group, Senoko Power was sold to the Lion Power
consortium while PowerSeraya was sold to YTL Power.
Of the total electricity generated, a significant 78% is fuelled by Natural Gas, with
petroleum products such as fuel oil contributing 18% of the fuel mix and other fuel such as
waste incineration making up the remaining 4%. This is in line with the increasing role of
Combined Cycle Gas Turbines (CCGT) plants by generation companies due to its better
efficiency and cleaner environmental footprint. At present, 70% of the licensed generating
capacity in operation comprise CCGT plants.
Figure 39: Licensed generating capacity by type (2012) Figure 40: Fuel mix for electricity generation (2011)
Combined Cycle Gas
Turbine (CCGT)
70%
Steam Plant25%
Incineration & Others
3%
Open Cycle Gas Turbine
(OCGT)2%
Natural Gas78%
Petroleum Products
18%
Others4%
Source: Energy Market Authority Source: Energy Market Authority
Of the total licensed generating capacity of about 10,202 MW, PowerSeraya, Tuas Power
and Senoko Power command a dominant 84% of capacity, with Senoko Power having the
highest capacity of 3,300 MW comprising CCGT and steam plants. Historically, the market
share of generating capacity has remained largely unchanged due to the lack of new
plants coming on-stream. The market share of electricity sales in the power generation
market exhibit a similar proportion, with the three dominant generation companies
occupying a significant share of the entire market.
11 April 2013
Singapore Utilities Sector 27
Pricing structure in Singapore
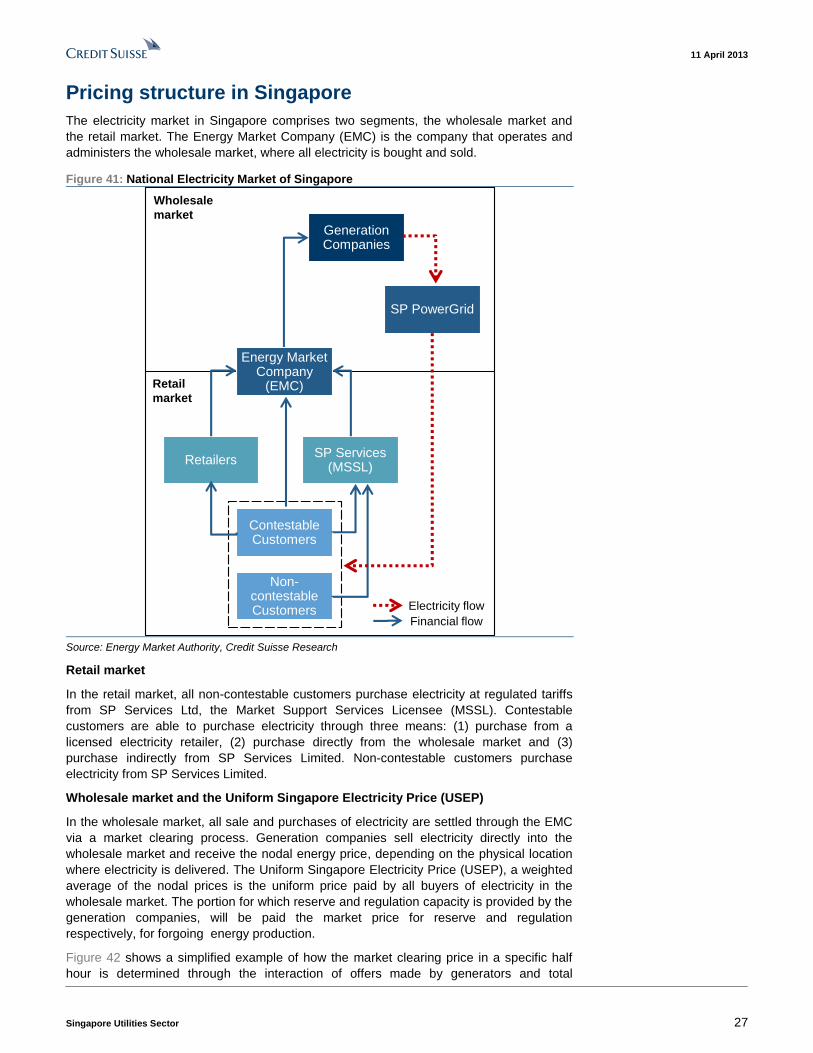
The electricity market in Singapore comprises two segments, the wholesale market and
the retail market. The Energy Market Company (EMC) is the company that operates and
administers the wholesale market, where all electricity is bought and sold.
Figure 41: National Electricity Market of Singapore
Generation Companies
Contestable Customers
Wholesale
market
Electricity flow
Non-contestable Customers
RetailersSP Services
(MSSL)
SP PowerGrid
Financial flow
Energy Market Company
(EMC)Retail
market
Source: Energy Market Authority, Credit Suisse Research
Retail market
In the retail market, all non-contestable customers purchase electricity at regulated tariffs
from SP Services Ltd, the Market Support Services Licensee (MSSL). Contestable
customers are able to purchase electricity through three means: (1) purchase from a
licensed electricity retailer, (2) purchase directly from the wholesale market and (3)
purchase indirectly from SP Services Limited. Non-contestable customers purchase
electricity from SP Services Limited.
Wholesale market and the Uniform Singapore Electricity Price (USEP)
In the wholesale market, all sale and purchases of electricity are settled through the EMC
via a market clearing process. Generation companies sell electricity directly into the
wholesale market and receive the nodal energy price, depending on the physical location
where electricity is delivered. The Uniform Singapore Electricity Price (USEP), a weighted
average of the nodal prices is the uniform price paid by all buyers of electricity in the
wholesale market. The portion for which reserve and regulation capacity is provided by the
generation companies, will be paid the market price for reserve and regulation
respectively, for forgoing energy production.
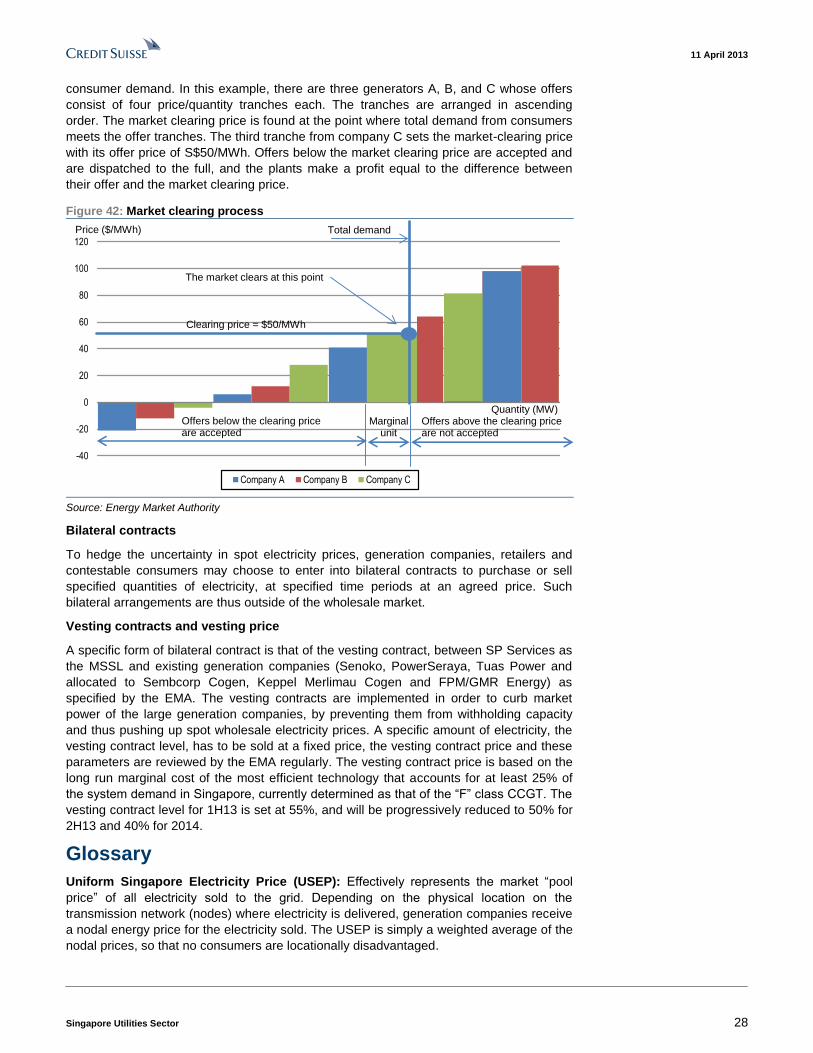
Figure 42 shows a simplified example of how the market clearing price in a specific half
hour is determined through the interaction of offers made by generators and total
11 April 2013
Singapore Utilities Sector 28
consumer demand. In this example, there are three generators A, B, and C whose offers
consist of four price/quantity tranches each. The tranches are arranged in ascending
order. The market clearing price is found at the point where total demand from consumers
meets the offer tranches. The third tranche from company C sets the market-clearing price
with its offer price of S$50/MWh. Offers below the market clearing price are accepted and
are dispatched to the full, and the plants make a profit equal to the difference between
their offer and the market clearing price.
Figure 42: Market clearing process
-40
-20
0
20
40
60
80
100
120
Company A Company B Company C
Price ($/MWh)
Offers below the clearing price are accepted
Offers above the clearing price are not accepted
Marginal unit
Clearing price = $50/MWh
Total demand
The market clears at this point
Quantity (MW)
Source: Energy Market Authority
Bilateral contracts
To hedge the uncertainty in spot electricity prices, generation companies, retailers and
contestable consumers may choose to enter into bilateral contracts to purchase or sell
specified quantities of electricity, at specified time periods at an agreed price. Such
bilateral arrangements are thus outside of the wholesale market.
Vesting contracts and vesting price
A specific form of bilateral contract is that of the vesting contract, between SP Services as
the MSSL and existing generation companies (Senoko, PowerSeraya, Tuas Power and
allocated to Sembcorp Cogen, Keppel Merlimau Cogen and FPM/GMR Energy) as
specified by the EMA. The vesting contracts are implemented in order to curb market
power of the large generation companies, by preventing them from withholding capacity
and thus pushing up spot wholesale electricity prices. A specific amount of electricity, the
vesting contract level, has to be sold at a fixed price, the vesting contract price and these
parameters are reviewed by the EMA regularly. The vesting contract price is based on the
long run marginal cost of the most efficient technology that accounts for at least 25% of
the system demand in Singapore, currently determined as that of the “F” class CCGT. The
vesting contract level for 1H13 is set at 55%, and will be progressively reduced to 50% for
2H13 and 40% for 2014.
Glossary
Uniform Singapore Electricity Price (USEP): Effectively represents the market “pool
price” of all electricity sold to the grid. Depending on the physical location on the
transmission network (nodes) where electricity is delivered, generation companies receive
a nodal energy price for the electricity sold. The USEP is simply a weighted average of the
nodal prices, so that no consumers are locationally disadvantaged.

11 April 2013
Singapore Utilities Sector 29
SP PowerGrid: Manages and operates the electricity network. SP PowerGrid is owned by
SP PowerAssets, which owns the network assets in Singapore.
High Sulphur Fuel Oil (HSFO): A form of residual (heavy) fuel oil with a high sulphur
content, used as a proxy to fuel costs. HSFO 180 CST is used as a benchmark as it is
widely used due to its emission standards. As Singapore’s electricity is mainly generated
from natural gas, the prices of natural gas as set out in commercial gas contracts signed
by generation companies are indexed to fuel oil prices.
Liquefied Natural Gas (LNG): Formed through the process of cooling natural gas (mainly
methane) to its liquid form. Transported through LNG tankers to regasification terminals
where they are heated and delivered in a gaseous state to power plants, as opposed to
natural gas from the gas fields delivered through pipelines.
Combined Cycle Gas Turbine (CCGT) plants: A more efficient plant with lower
emissions, primarily using natural gas to generate electricity. Excess heat produced
through a gas turbine is made use of to power a steam turbine, resulting in a greater
thermal efficiency.
Open Cycle Gas Turbine (OCGT) plants: Produces electricity through the combustion of
natural gas.
Wholesale market: Started on 1 January 2003. Represents the electricity market where
generation companies bid to sell electricity to the market at half hourly intervals daily. The
Energy Market Company (EMC) operates and administers the wholesale market.
Retail market: Represents the electricity market where end consumers purchase
electricity from retailers or from SP Services Ltd.
SP Services: Currently the only Market Support Services Licensee (MSSL), responsible
for providing services such as meter reading and meter data management. Also
responsible for supply electricity to all non-contestable consumers and maintains a central
register of all consumers in Singapore.
Contestable Consumers: Consumers who occupy a non-residential location and either
require high voltage supplies or has an average monthly electricity consumption of 10,000
kilowatt-hour and above. These customers are able to purchase electricity through three
means: 1) purchase from a licensed electricity retailer, 2) purchase directly from the
wholesale market and 3) purchase indirectly from SP Services Limited.
Non-contestable Consumers: Domestic consumers and all other consumers of electricity
in Singapore.
Reserve price: Consists of prices for three classes of reserves, namely primary,
secondary and contingency reserves. Represents the price paid to generation companies
for maintaining reserve generation capacity in the event of unexpected demand.
Reserve price: Represents the price paid for regulation capacity, used to cover second-
to-second variations in demand away from the estimated demand.
Vesting contracts: A unique form of bilateral contracts between SP Services and
generation companies. Implemented in order to curb market power of the large generation
companies, by preventing them from withholding capacity and thus pushing up spot
wholesale electricity prices. Determined by the authority every two years, a specific
amount of electricity, the vesting contract level, has to be sold at a fixed price, the vesting
contract price.
Vesting Contract Hedge Price (VCHP): Calculated quarterly. Set by the authority taking
into account both the long run marginal cost (LRMC) of the most efficient technology that
accounts for at least 25% of the system demand in Singapore.
Vesting Contract Hedge Quantity (VCHQ): Represents the hedge quantity allocated to
the generation companies, and settled quarterly based on the VCHP.

11 April 2013
Singapore Utilities Sector 30
Companies Mentioned (Price as of 08-Apr-2013)
China Resources Power Holdings (0836.HK, HK$22.9, OUTPERFORM, TP HK$23.0) First Pacific Company Limited (0142.HK, HK$10.54) GDF Suez (GSZ.PA, €15.25) GIL (GMRI.NS, Rs22.0) Huaneng Power International Inc (0902.HK, HK$8.29, OUTPERFORM, TP HK$9.0) Hyflux Ltd (HYFL.SI, S$1.41) Kansai Electric Power (9503.T, ¥912) Keppel Corporation (KPLM.SI, S$11.16, OUTPERFORM, TP S$13.7) Keppel Land (KLAN.SI, S$3.89) Keppel REIT (KASA.SI, S$1.36) Kyushu Electric Power (9508.T, ¥1,005) M1 Limited (MONE.SI, S$2.99) Manila Electric (Meralco) (MER.PS, P325.0) Marubeni Corp (8002.T, ¥666) Sembcorp Industries Limited (SCIL.SI, S$5.08, NEUTRAL, TP S$5.1) Sembcorp Marine Ltd. (SCMN.SI, S$4.33) YTL Power (YTLP.KL, RM1.5, UNDERPERFORM, TP RM1.4)
Disclosure Appendix
Important Global Disclosures
Gerald Wong, CFA, Edwin Pang and Annuar Aziz each certify, with respect to the companies or securities that the individual analyzes, that (1) the views expressed in this report accurately reflect his or her personal views about all of the subject companies and securities and (2) no part of his or her compensation was, is or will be directly or indirectly related to the specific recommendations or views expressed in this report.
Price and Rating History for China Resources Power Holdings (0836.HK)
0836.HK Closing Price Target Price
Date (HK$) (HK$) Rating
25-Aug-10 16.78 21.30 O *
27-Jan-11 13.62 18.36
23-Aug-11 13.16 18.05
13-Feb-12 15.20 18.25
21-Aug-12 17.06 19.00
03-Oct-12 16.78 19.70
19-Mar-13 22.65 23.00
* Asterisk signifies initiation or assumption of coverage.
O U T PERFO RM
Price and Rating History for Huaneng Power International Inc (0902.HK)
0902.HK Closing Price Target Price
Date (HK$) (HK$) Rating
25-Aug-10 4.55 5.86 O *
27-Jan-11 4.36 5.08
11-Aug-11 3.32 4.65
26-Oct-11 3.46 4.50
13-Feb-12 4.95 5.96
22-Mar-12 4.51 5.70
02-Aug-12 5.62 5.85
03-Oct-12 5.88 7.10
* Asterisk signifies initiation or assumption of coverage. O U T PERFO RM
11 April 2013
Singapore Utilities Sector 31
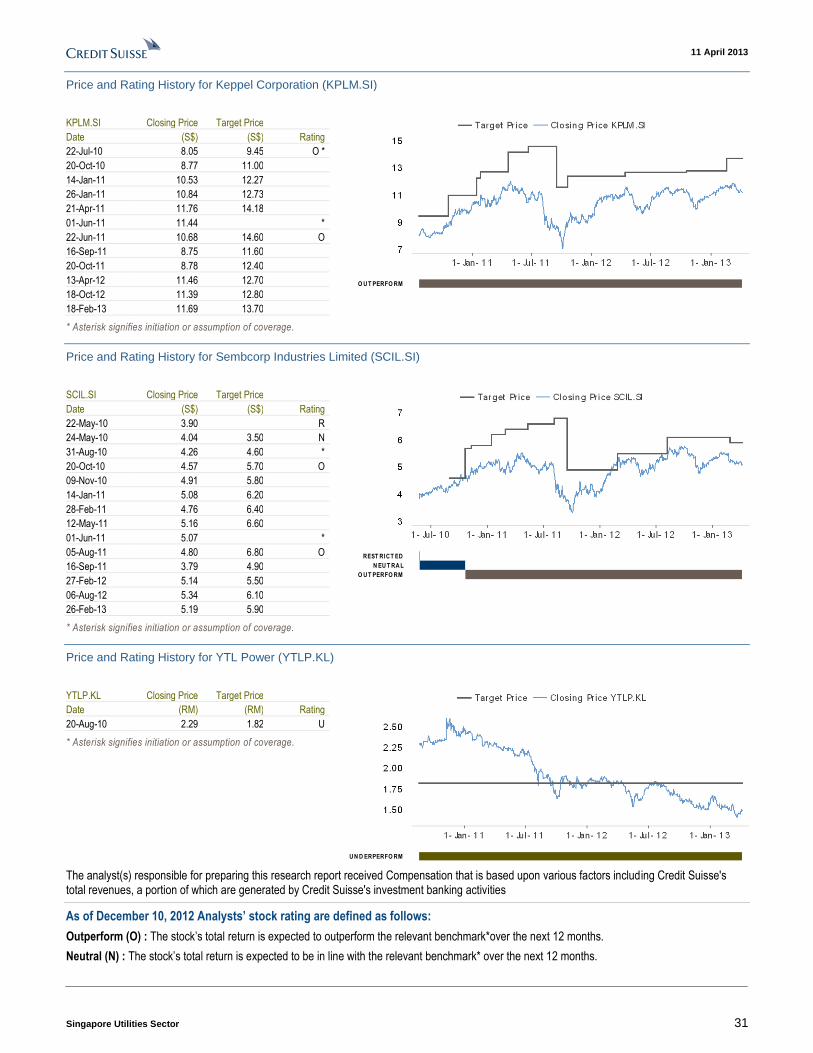
Price and Rating History for Keppel Corporation (KPLM.SI)
KPLM.SI Closing Price Target Price
Date (S$) (S$) Rating
22-Jul-10 8.05 9.45 O *
20-Oct-10 8.77 11.00
14-Jan-11 10.53 12.27
26-Jan-11 10.84 12.73
21-Apr-11 11.76 14.18
01-Jun-11 11.44 *
22-Jun-11 10.68 14.60 O
16-Sep-11 8.75 11.60
20-Oct-11 8.78 12.40
13-Apr-12 11.46 12.70
18-Oct-12 11.39 12.80
18-Feb-13 11.69 13.70
* Asterisk signifies initiation or assumption of coverage.
O U T PERFO RM
Price and Rating History for Sembcorp Industries Limited (SCIL.SI)
SCIL.SI Closing Price Target Price
Date (S$) (S$) Rating
22-May-10 3.90 R
24-May-10 4.04 3.50 N
31-Aug-10 4.26 4.60 *
20-Oct-10 4.57 5.70 O
09-Nov-10 4.91 5.80
14-Jan-11 5.08 6.20
28-Feb-11 4.76 6.40
12-May-11 5.16 6.60
01-Jun-11 5.07 *
05-Aug-11 4.80 6.80 O
16-Sep-11 3.79 4.90
27-Feb-12 5.14 5.50
06-Aug-12 5.34 6.10
26-Feb-13 5.19 5.90
* Asterisk signifies initiation or assumption of coverage.
REST RICT ED
N EU T RA L
O U T PERFO RM
Price and Rating History for YTL Power (YTLP.KL)
YTLP.KL Closing Price Target Price
Date (RM) (RM) Rating
20-Aug-10 2.29 1.82 U
* Asterisk signifies initiation or assumption of coverage.
UN D ERPERFO RM
The analyst(s) responsible for preparing this research report received Compensation that is based upon various factors including Credit Suisse's total revenues, a portion of which are generated by Credit Suisse's investment banking activities
As of December 10, 2012 Analysts’ stock rating are defined as follows:
Outperform (O) : The stock’s total return is expected to outperform the relevant benchmark*over the next 12 months.
Neutral (N) : The stock’s total return is expected to be in line with the relevant benchmark* over the next 12 months.
11 April 2013
Singapore Utilities Sector 32
Underperform (U) : The stock’s total return is expected to underperform the relevant benchmark* over the next 12 months.
*Relevant benchmark by region: As of 10th December 2012, Japanese ratings are based on a stock’s total return relative to the analyst's coverage universe which consists of all companies covered by the analyst within the relevant sector, with Outperforms representing the most attractiv e, Neutrals the less attractive, and Underperforms the least attractive investment opportunities. As of 2nd October 2012, U.S. and Canadian as well as European ratings are ba sed on a stock’s total return relative to the analyst's coverage universe which consists of all companies covered by the analyst wi thin the relevant sector, with Outperforms representing the most attractive, Neutrals the less attractive, and Underperforms the least attractive investment opportunities. For Latin Ame rican and non-Japan Asia stocks, ratings are based on a stock’s total return relative to the average total return of the relevant country or regional benchmark; Australia, New Zealand are, and pri or to 2nd October 2012 U.S. and Canadian ratings were based on (1) a stock’s absolute total return potential to its current share p rice and (2) the relative attractiveness of a stock’s total return potential within an analyst’s coverage universe. For Australian and New Zealand stocks, 12 -month rolling yield is incorporated in the absolute total return calculation and a 15% and a 7.5% threshold replace the 10-15% level in the Outperform and Underperform stock rating definitions, respectively. The 15% and 7.5% thresholds replace the +10-15% and -10-15% levels in the Neutral stock rating definition, respectively. Prior to 10th December 2012, Japanese ratings were based on a stock’s total return relative to the average total return of the relevant country or regional benchmark.
Restricted (R) : In certain circumstances, Credit Suisse policy and/or applicable law and regulations preclude certain types of communications, including an investment recommendation, during the course of Credit Suisse's engagement in an investment banking transaction and in certain other circumstances.
Volatility Indicator [V] : A stock is defined as volatile if the stock price has moved up or down by 20% or more in a month in at least 8 of the past 24 months or the analyst expects significant volatility going forward.
Analysts’ sector weightings are distinct from analysts’ stock ratings and are based on the analyst’s expectations for the fundamentals and/or valuation of the sector* relative to the group’s historic fundamentals and/or valuation:
Overweight : The analyst’s expectation for the sector’s fundamentals and/or valuation is favorable over the next 12 months.
Market Weight : The analyst’s expectation for the sector’s fundamentals and/or valuation is neutral over the next 12 months.
Underweight : The analyst’s expectation for the sector’s fundamentals and/or valuation is cautious over the next 12 months.
*An analyst’s coverage sector consists of all companies covered by the analyst within the relevant sector. An analyst may cover mult iple sectors.
Credit Suisse's distribution of stock ratings (and banking clients) is:
Global Ratings Distribution
Rating Versus universe (%) Of which banking clients (%)
Outperform/Buy* 43% (54% banking clients)
Neutral/Hold* 39% (47% banking clients)
Underperform/Sell* 16% (40% banking clients)
Restricted 3%
*For purposes of the NYSE and NASD ratings distribution disclosure requirements, our stock ratings of Outperform, Neutral, and Underperform most closely correspond to Buy, Hold, and Sell, respectively; however, the meanings are not the same, as our stock ratings are determined on a relative basis. (Please refer to definitions above.) An investor's decision to buy or sell a security should be based on investment objectives, current holdings, and o ther individual factors.
Credit Suisse’s policy is to update research reports as it deems appropriate, based on developments with the subject company, the sector or the market that may have a material impact on the research views or opinions stated herein.
Credit Suisse's policy is only to publish investment research that is impartial, independent, clear, fair and not misleading. For more detail please refer to Credit Suisse's Policies for Managing Conflicts of Interest in connection with Investment Research: http://www.csfb.com/research and analytics/disclaimer/managing_conflicts_disclaimer.html
Credit Suisse does not provide any tax advice. Any statement herein regarding any US federal tax is not intended or written to be used, and cannot be used, by any taxpayer for the purposes of avoiding any penalties.
Price Target: (12 months) for Sembcorp Industries Limited (SCIL.SI)
Method: Our S$5.10 target price for Sembcorp Industries is based on 1) sum-of-the-parts analysis with SembCorp Marine (SCMN.SI) valued at its Credit Suisse target price, 2) Gallant Venture marked to market and 3) the balance of SCI is valued at 10x FY13E earnings.
Risk: The key risks to our target price of S$5.10 for SembCorp Industries (SCI) include: 1) a potential slowdown in rig demand for SMM which constitutes a significant portion of our value of SCI, 2) asset impairment in the financial assets held by SCI, 3) the risk that there is poor take-up in the additional space in Jurong Island by petrochemical companies and not meeting our growth forecasts and 4) limited sucess in its overseas joint venture.
Price Target: (12 months) for Huaneng Power International Inc (0902.HK)
Method: We calculate our target price of HK$9.00/share for Huaneng Power International Inc using DCF (discounted cash flow) valuation, with an explicit 2012-30E free cash flow CAGR (compound annual growth rate) of 5.6% & terminal growth rate of 2.0%, and WACC (weighted average cost of capital) of 8.5%, deriving from 11.7% cost of equity and 7% pre-tax cost of debt (with 50% target debt to capital). Our target price implies a 1.53x forward P/B (price-to-book) (2014).

11 April 2013
Singapore Utilities Sector 33
Risk: Potential risks to our HK$9.00 target price for Huaneng Power International include: 1) a lower or later than expected tariff increase, 2) worse than expected coal price movement and 3) slower than expected capacity expansion (given Huaneng's larger capacity base).
Price Target: (12 months) for Keppel Corporation (KPLM.SI)
Method: Our TP of $13.70 for Keppel Corporation is based on an SOTP valuing: (1) 15x O&M 2013E EPS. (2) CS target prices for Keppel Land (S$4.10), Keppel REIT (S$1.32), (3) mark-to-market value of other listed entities, and (4) asset value estimates of Keppel Bay and the infrastructure business.
Risk: Risks to our target price of S$13.70 for Keppel Corp include the following:1) slower than expected recovery in the offshore & marine or property cycles; 2) limited earnings visibility on infrastructure business and 3) limited disclosure on individual businesses.
Price Target: (12 months) for YTL Power (YTLP.KL)
Method: YTL Power's target price of RM1.40 is based on (1) The water assets are valued based on a 20% premium to the FY11 RAB (regulated asset base), in line with the water sector in the UK. We have assumed a forex exchange of RM5 to every Pound Sterling. (2) The Malaysian power assets are valued based on a Discounted cash flow method, with a discount rate of 10.5% (weighted average cost of capital) (3) The Indonesian power assets are valued based on the Discounted Cashflow method with a discount rate of 10%. (4) Power Seraya power plants are valued based on a discounted cashflow method with a discount rate of 10%.
Risk: Upside risks to YTL Power's RM1.40 target price include: (1) A lucrative overseas utility project is injected into the company (2) YTL Power gets a slice of the Malaysian water restructuring. (3) The UK water utilities get rerated. Downside to YTLPower's target price: (1) New projects become a drag. (2) A stronger Ringgit or a weaker Pound Sterling will mean less Ringgit revenue from Wessex (3) More political uncertainties (4) PPA renegotiation uncertainties.
Price Target: (12 months) for China Resources Power Holdings (0836.HK)
Method: Our target price of HK$23.0 for China Resources Power Holdings is based on DCF and implies 1.63x forward P/B. Our 8.3% weighted average cost of capital (WACC) is derived from 11.7% cost of equity (4.5% of PRC risk free rate, 9% PRC equity premium and 0.80 beta), 6.5% pre-tax cost of debt and 50% targeted debt to capital ratio.
Risk: Potential risks to our HK$23.0 target price for China Resources Power Holdings include: 1) less or delayed tariff increase, 2) worse than expected coal price movements and 3) delay or failure on upstream coal mine production.
Please refer to the firm's disclosure website at www.credit-suisse.com/researchdisclosures for the definitions of abbreviations typically used in the target price method and risk sections.
See the Companies Mentioned section for full company names
The subject company (0902.HK, KPLM.SI, 0836.HK, HYFL.SI, SCMN.SI, 0142.HK, GSZ.PA, KLAN.SI, MONE.SI, KASA.SI) currently is, or was during the 12-month period preceding the date of distribution of this report, a client of Credit Suisse.
Credit Suisse provided investment banking services to the subject company (0902.HK, KPLM.SI, SCMN.SI, 0142.HK, KLAN.SI, KASA.SI) within the past 12 months.
Credit Suisse provided non-investment banking services to the subject company (KPLM.SI, 0142.HK, GSZ.PA, MONE.SI) within the past 12 months
Credit Suisse has managed or co-managed a public offering of securities for the subject company (KPLM.SI, KLAN.SI) within the past 12 months.
Credit Suisse has received investment banking related compensation from the subject company (0902.HK, KPLM.SI, SCMN.SI, 0142.HK, KLAN.SI, KASA.SI) within the past 12 months
Credit Suisse expects to receive or intends to seek investment banking related compensation from the subject company (0902.HK, KPLM.SI, 0836.HK, HYFL.SI, SCMN.SI, 0142.HK, GSZ.PA, KLAN.SI, MONE.SI, KASA.SI) within the next 3 months.
Credit Suisse has received compensation for products and services other than investment banking services from the subject company (KPLM.SI, 0142.HK, GSZ.PA, MONE.SI) within the past 12 months
Credit Suisse may have interest in (YTLP.KL)
Important Regional Disclosures
Singapore recipients should contact Credit Suisse AG, Singapore Branch for any matters arising from this research report.
The analyst(s) involved in the preparation of this report have not visited the material operations of the subject company (SCIL.SI, 0902.HK, KPLM.SI, YTLP.KL, 0836.HK, HYFL.SI, SCMN.SI, 0142.HK, MER.PS, GSZ.PA, KLAN.SI, MONE.SI, KASA.SI) within the past 12 months
Restrictions on certain Canadian securities are indicated by the following abbreviations: NVS--Non-Voting shares; RVS--Restricted Voting Shares; SVS--Subordinate Voting Shares.
Individuals receiving this report from a Canadian investment dealer that is not affiliated with Credit Suisse should be advised that this report may not contain regulatory disclosures the non-affiliated Canadian investment dealer would be required to make if this were its own report.
11 April 2013
Singapore Utilities Sector 34
For Credit Suisse Securities (Canada), Inc.'s policies and procedures regarding the dissemination of equity research, please visit http://www.csfb.com/legal_terms/canada_research_policy.shtml.
The following disclosed European company/ies have estimates that comply with IFRS: (GSZ.PA).
As of the date of this report, Credit Suisse acts as a market maker or liquidity provider in the equities securities that are the subject of this report.
Principal is not guaranteed in the case of equities because equity prices are variable.
Commission is the commission rate or the amount agreed with a customer when setting up an account or at any time after that.
To the extent this is a report authored in whole or in part by a non-U.S. analyst and is made available in the U.S., the following are important disclosures regarding any non-U.S. analyst contributors: The non-U.S. research analysts listed below (if any) are not registered/qualified as research analysts with FINRA. The non-U.S. research analysts listed below may not be associated persons of CSSU and therefore may not be subject to the NASD Rule 2711 and NYSE Rule 472 restrictions on communications with a subject company, public appearances and trading securities held by a research analyst account.
Credit Suisse (Hong Kong) Limited ........................................................................................................................................................ Edwin Pang
Credit Suisse Securities (Malaysia) Sdn Bhd. ....................................................................................................................................... Annuar Aziz
Credit Suisse AG, Singapore Branch .................................................................................................................... Gerald Wong, CFA ; Louis Chua
For Credit Suisse disclosure information on other companies mentioned in this report, please visit the website at www.credit-suisse.com/researchdisclosures or call +1 (877) 291-2683.

11 April 2013
Singapore Utilities Sector UT0359.doc
References in this report to Credit Suisse include all of the subsidiaries and affiliates of Credit Suisse operating under its investment banking division. For more information on our structure, please use the following link: https://www.credit-suisse.com/who_we_are/en/.This report may contain material that is not directed to, or intended for distribution to or use by, any person or entity who is a citizen or resident of or located in any locality, state, country or other jurisdiction where such distribution, publication, availability or use would be contrary to law or regulation or which would subject Credit Suisse AG or its affiliates ("CS") to any registration or licensing requirement within such jurisdiction. All material presented in this report, unless specifically indicated otherwise, is under copyright to CS. None of the material, nor its content, nor any copy of it, may be altered in any way, transmitted to, copied or distributed to any other party, without the prior express written permission of CS. All trademarks, service marks and logos used in this report are trademarks or service marks or registered trademarks or service marks of CS or its affiliates. The information, tools and material presented in this report are provided to you for information purposes only and are not to be used or considered as an offer or the solicitation of an offer to sell or to buy or subscribe for securities or other financial instruments. CS may not have taken any steps to ensure that the securities referred to in this report are suitable for any particular investor. CS will not treat recipients of this report as its customers by virtue of their receiving this report. The investments and services contained or referred to in this report may not be suitable for you and it is recommended that you consult an independent investment advisor if you are in doubt about such investments or investment services. Nothing in this report constitutes investment, legal, accounting or tax advice, or a representation that any investment or strategy is suitable or appropriate to your individual circumstances, or otherwise constitutes a personal recommendation to you. CS does not advise on the tax consequences of investments and you are advised to contact an independent tax adviser. Please note in particular that the bases and levels of taxation may change. Information and opinions presented in this report have been obtained or derived from sources believed by CS to be reliable, but CS makes no representation as to their accuracy or completeness. CS accepts no liability for loss arising from the use of the material presented in this report, except that this exclusion of liability does not apply to the extent that such liability arises under specific statutes or regulations applicable to CS. This report is not to be relied upon in substitution for the exercise of independent judgment. CS may have issued, and may in the future issue, other communications that are inconsistent with, and reach different conclusions from, the information presented in this report. Those communications reflect the different assumptions, views and analytical methods of the analysts who prepared them and CS is under no obligation to ensure that such other communications are brought to the attention of any recipient of this report. CS may, to the extent permitted by law, participate or invest in financing transactions with the issuer(s) of the securities referred to in this report, perform services for or solicit business from such issuers, and/or have a position or holding, or other material interest, or effect transactions, in such securities or options thereon, or other investments related thereto. In addition, it may make markets in the securities mentioned in the material presented in this report. CS may have, within the last three years, served as manager or co-manager of a public offering of securities for, or currently may make a primary market in issues of, any or all of the entities mentioned in this report or may be providing, or have provided within the previous 12 months, significant advice or investment services in relation to the investment concerned or a related investment. Additional information is, subject to duties of confidentiality, available on request. Some investments referred to in this report will be offered solely by a single entity and in the case of some investments solely by CS, or an associate of CS or CS may be the only market maker in such investments. Past performance should not be taken as an indication or guarantee of future performance, and no representation or warranty, express or implied, is made regarding future performance. Information, opinions and estimates contained in this report reflect a judgment at its original date of publication by CS and are subject to change without notice. The price, value of and income from any of the securities or financial instruments mentioned in this report can fall as well as rise. The value of securities and financial instruments is subject to exchange rate fluctuation that may have a positive or adverse effect on the price or income of such securities or financial instruments. Investors in securities such as ADR's, the values of which are influenced by currency volatility, effectively assume this risk. Structured securities are complex instruments, typically involve a high degree of risk and are intended for sale only to sophisticated investors who are capable of understanding and assuming the risks involved. The market value of any structured security may be affected by changes in economic, financial and political factors (including, but not limited to, spot and forward interest and exchange rates), time to maturity, market conditions and volatility, and the credit quality of any issuer or reference issuer. Any investor interested in purchasing a structured product should conduct their own investigation and analysis of the product and consult with their own professional advisers as to the risks involved in making such a purchase. Some investments discussed in this report may have a high level of volatility. High volatility investments may experience sudden and large falls in their value causing losses when that investment is realised. Those losses may equal your original investment. Indeed, in the case of some investments the potential losses may exceed the amount of initial investment and, in such circumstances, you may be required to pay more money to support those losses. Income yields from investments may fluctuate and, in consequence, initial capital paid to make the investment may be used as part of that income yield. Some investments may not be readily realisable and it may be difficult to sell or realise those investments, similarly it may prove difficult for you to obtain reliable information about the value, or risks, to which such an investment is exposed. This report may provide the addresses of, or contain hyperlinks to, websites. Except to the extent to which the report refers to website material of CS, CS has not reviewed any such site and takes no responsibility for the content contained therein. Such address or hyperlink (including addresses or hyperlinks to CS's own website material) is provided solely for your convenience and information and the content of any such website does not in any way form part of this document. Accessing such website or following such link through this report or CS's website shall be at your own risk. This report is issued and distributed in Europe (except Switzerland) by Credit Suisse Securities (Europe) Limited, One Cabot Square, London E14 4QJ, England, which is regulated in the United Kingdom by The Financial Services Authority ("FSA"). This report is being distributed in Germany by Credit Suisse Securities (Europe) This report is being distributed in the United States and Canada by Credit Suisse Securities (USA) LLC; in Switzerland by Credit Suisse AG; in Brazil by Banco de Investimentos Credit Suisse (Brasil) S.A or its affiliates; in Mexico by Banco Credit Suisse (México), S.A. (transactions related to the securities mentioned in this report will only be effected in compliance with applicable regulation); in Japan by Credit Suisse Securities (Japan) Limited, Financial Instruments Firm, Director-General of Kanto Local Finance Bureau (Kinsho) No. 66, a member of Japan Securities Dealers Association, The Financial Futures Association of Japan, Japan Investment Advisers Association, Type II Financial Instruments Firms Association; elsewhere in Asia/ Pacific by whichever of the following is the appropriately authorised entity in the relevant jurisdiction: Credit Suisse (Hong Kong) Limited, Credit Suisse Equities (Australia) Limited, Credit Suisse Securities (Thailand) Limited, Credit Suisse Securities (Malaysia) Sdn Bhd, Credit Suisse AG, Singapore Branch, Credit Suisse Securities (India) Private Limited regulated by the Securities and Exchange Board of India (registration Nos. INB230970637; INF230970637; INB010970631; INF010970631), having registered address at 9th Floor, Ceejay House, Dr.A.B. Road, Worli, Mumbai - 18, India, T- +91-22 6777 3777, Credit Suisse Securities (Europe) Limited, Seoul Branch, Credit Suisse AG, Taipei Securities Branch, PT Credit Suisse Securities Indonesia, Credit Suisse Securities (Philippines ) Inc., and elsewhere in the world by the relevant authorised affiliate of the above. Research on Taiwanese securities produced by Credit Suisse AG, Taipei Securities Branch has been prepared by a registered Senior Business Person. Research provided to residents of Malaysia is authorised by the Head of Research for Credit Suisse Securities (Malaysia) Sdn Bhd, to whom they should direct any queries on +603 2723 2020. This research may not conform to Canadian disclosure requirements. In jurisdictions where CS is not already registered or licensed to trade in securities, transactions will only be effected in accordance with applicable securities legislation, which will vary from jurisdiction to jurisdiction and may require that the trade be made in accordance with applicable exemptions from registration or licensing requirements. Non-U.S. customers wishing to effect a transaction should contact a CS entity in their local jurisdiction unless governing law permits otherwise. U.S. customers wishing to effect a transaction should do so only by contacting a representative at Credit Suisse Securities (USA) LLC in the U.S. Please note that this research was originally prepared and issued by CS for distribution to their market professional and institutional investor customers. Recipients who are not market professional or institutional investor customers of CS should seek the advice of their independent financial advisor prior to taking any investment decision based on this report or for any necessary explanation of its contents. This research may relate to investments or services of a person outside of the UK or to other matters which are not regulated by the FSA or in respect of which the protections of the FSA for private customers and/or the UK compensation scheme may not be available, and further details as to where this may be the case are available upon request in respect of this report. CS may provide various services to US municipal entities or obligated persons ("municipalities"), including suggesting individual transactions or trades and entering into such transactions. Any services CS provides to municipalities are not viewed as "advice" within the meaning of Section 975 of the Dodd-Frank Wall Street Reform and Consumer Protection Act. CS is providing any such services and related information solely on an arm's length basis and not as an advisor or fiduciary to the municipality. In connection with the provision of the any such services, there is no agreement, direct or indirect, between any municipality (including the officials, management, employees or agents thereof) and CS for CS to provide advice to the municipality. Municipalities should consult with their financial, accounting and legal advisors regarding any such services provided by CS. In addition, CS is not acting for direct or indirect compensation to solicit the municipality on behalf of an unaffiliated broker, dealer, municipal securities dealer, municipal advisor, or investment adviser for the purpose of obtaining or retaining an engagement by the municipality for or in connection with Municipal Financial Products, the issuance of municipal securities, or of an investment adviser to provide investment advisory services to or on behalf of the municipality. If this report is being distributed by a financial institution other than Credit Suisse AG, or its affiliates, that financial institution is solely responsible for distribution. Clients of that institution should contact that institution to effect a transaction in the securities mentioned in this report or require further information. This report does not constitute investment advice by Credit Suisse to the clients of the distributing financial institution, and neither Credit Suisse AG, its affiliates, and their respective officers, directors and employees accept any liability whatsoever for any direct or consequential loss arising from their use of this report or its content. Principal is not guaranteed. Commission is the commission rate or the amount agreed with a customer when setting up an account or at any time after that.
Copyright © 2013 CREDIT SUISSE AG and/or its affiliates. All rights reserved.
Investment principal on bonds can be eroded depending on sale price or market price. In addition, there are bonds on which investment principal can be eroded due to changes in redemption amounts. Care is required when investing in such instruments.
When you purchase non-listed Japanese fixed income securities (Japanese government bonds, Japanese municipal bonds, Japanese government guaranteed bonds, Japanese corporate bonds) from CS as a seller, you will be requested to pay the purchase price only.