Embed Size (px)
Citation preview
SINGAPORE REPORTCONTRUCTION MARKET QUARTERLY UPDATE
ISSUE NO. 72 | DECEMBER 2015
SIM CAMPUS DEVELOPMENT PHASE IIPROJECT FEATURE
|SINGAPORE REPORT
DECEMBER 2015
1 |
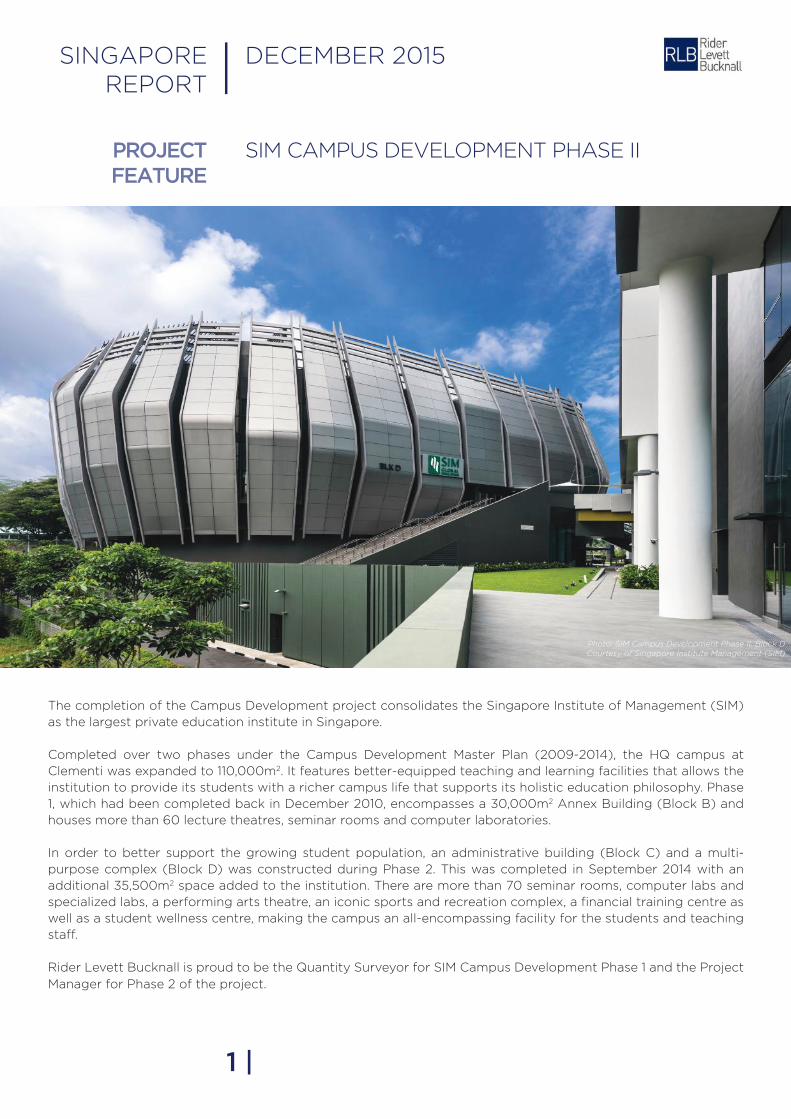
Photo: SIM Campus Development Phase II, Block DCourtesy of Singapore Institute Management (SIM)
The completion of the Campus Development project consolidates the Singapore Institute of Management (SIM) as the largest private education institute in Singapore.
Completed over two phases under the Campus Development Master Plan (2009-2014), the HQ campus at Clementi was expanded to 110,000m2. It features better-equipped teaching and learning facilities that allows the institution to provide its students with a richer campus life that supports its holistic education philosophy. Phase 1, which had been completed back in December 2010, encompasses a 30,000m2 Annex Building (Block B) and houses more than 60 lecture theatres, seminar rooms and computer laboratories.
In order to better support the growing student population, an administrative building (Block C) and a multi-purpose complex (Block D) was constructed during Phase 2. This was completed in September 2014 with an additional 35,500m2 space added to the institution. There are more than 70 seminar rooms, computer labs and specialized labs, a performing arts theatre, an iconic sports and recreation complex, a financial training centre as well as a student wellness centre, making the campus an all-encompassing facility for the students and teaching staff.
Rider Levett Bucknall is proud to be the Quantity Surveyor for SIM Campus Development Phase 1 and the Project Manager for Phase 2 of the project.
MARKET TRENDS
SINGAPORE ECONOMy
SINGAPORE REPORT | DECEMBER 2015
2 |
Singapore narrowly avoided a technical recession in third quarter of the year. The gross domestic product (GDP) in 3Q 2015 rose by 1.9% quarter-on-quarter, seasonally-adjusted annualised rate (q-o-q, saar) following the 2.6% decline in the previous quarter. The growth partly reflected a pickup in oil-related trade as declining oil prices spurred an increase in oil trading, transport & storage activities. The manufacturing sector however, continued to deteriorate on the back of persistent weakness in the electronics and marine & offshore engineering clusters.
Against the backdrop of low inflation and tepid global growth, the Monetary Authority of Singapore (MAS) had eased its exchange-rate based monetary policy twice in 2015 by slowing the pace of the Singapore dollar’s appreciation. This was to create cheaper imports and make exports cheaper in foreign markets in order to boost economic growth.
CPI-All Items inflation slid -0.6% year-on-year (y-o-y) in December 2015. The CPI-All Items inflation was -0.8% y-o-y in November 2015. Despite a pickup in petrol costs and overall price of services, falling private road transport and housing costs were the main drags on inflation in December 2015, which created a 14th straight month of contraction as well as the country’s longest stretch of negative inflation since the global financial crisis. Advanced estimates by MAS for 2015’s core inflation is around 0.5%. MAS expects the core inflation to rise gradually within 2016, as the effects of temporary disinflationary factors dissipate.
MAS and the Ministry of Trade and Industry (MTI) reiterated their 2016 headline and core inflation forecasts at -0.5% to 0.5%, and 0.5% to 1.5%, respectively, while highlighting a “significant uncertainty” over global oil prices.
The construction sector in 3Q 2015 expanded by 1.6%, down from the 2.0% growth recorded in 2Q 2015. The slowdown was mainly due to weaker private sector construction activities. On a seasonally adjusted basis, the sector contracted by 0.8% q-o-q, a reversal from the 12.4% expansion in 2Q 2015.
The labour market remained tight in 3Q 2015 and the number of redundancies fell for the third consecutive quarter. Domestic-oriented sectors are expected to stay generally resilient despite ongoing supply-side constraints as firms continue to take steps to boost productivity. Overall employment across all sectors rose by 16,400 on a quarterly basis in 3Q 2015, faster than the gains of 9,700 in 2Q 2015. This was supported by an increase in employment in the construction and services sectors. However, the employment gains were lower when compared to the gains in 3Q 2014.
Weak global demand will continue to weigh on growth in 4Q 2015 and into 2016. The economic momentum for Singapore is expected to remain modest and GDP growth is projected to come in at close to 2.0% for 2015 and 1.0% - 3.0% for 2016. However, stabilisation in China and stronger growth in the US is anticipated to help drive improvement in the first half of 2016.
SINGAPORE REPORT | DECEMBER 2015
rolled out from January 2016. Builders with good productivity records in their past projects and their investment in technology adoption and workforce development are given an advantage when they tender for government construction projects.
The number of sites under the Confirmed List of the 1H 2016 Government Land Sales (GLS) remains limited and under control. Land prices are therefore also expected to remain high. There are four sites on the Confirmed List it is expected to add about 1,560 private residential units and 640 executive condominiums (ECs) and 11,000m2 of gross floor area (GFA) of commercial space. This reflects a 27.0% reduction compared to the 2,130 residential units in 2H 2015. Together with all the projects in the pipeline, the supply of private housing and commercial space allocated under 1H 2016 GLS programme has been projected to meet the demand over the next two years (2016 - 2018) according to the Ministry of National Development (MND).
BCA’s Tender Price Index (TPI) for all buildings decreased by 0.19% in 3Q 2015 from 2Q 2015. This reflects a continuation of intense competition over a shrinking pool of jobs for the third consecutive quarter. Although there was a deferment in the previously announced foreign worker levy (FWL) increases to help firms gradually adapt to a permanently tight labour market, the FWL fee increment will resume on 1 July 2016. Labour costs are anticipated to rise while some construction materials and plant and equipment costs are also expected to increase. Overall, tender prices and project margins are projected to continue to trend downwards in 2015 till 1H 2016.
Growth in the construction sector slowed down in the third quarter of the year. The sector moderated its growth from 2.2% in 2Q 2015 to 1.6% in 3Q 2015. The sector employed 3,800 more workers in 3Q 2015 compared to a quarter ago. However, this was lower than the employment gains seen in 2Q 2015 (7,600) on the back of a slowdown in construction activities, particularly for private sector works.
The total construction demand for 2015 is projected to achieve between S$29 billion to S$36 billion but may fall short of this target due to the rescheduling of a few major public infrastructure contracts such as MRT projects during late 3Q 2015 and early 4Q 2015.
The construction demand from the private sector in 2016 is expected to slow down from previous years due to less favourable economic conditions and an increased supply of completed private housing projects and offices. Nevertheless, the construction industry will still be supported by a higher construction demand from the public sector, largely due to an increase in civil engineering works.
Commitments have been made to major infrastructural investments in order to meet Singapore’s future economic and social needs. These includes the development of Changi Airport’s new terminal T5, improvements in housing estates and the public transport system, as well as the expansion in the capacity of hospitals and nursing homes.
BCA has also revised the tender evaluation framework for government construction projects, raising the productivity weightage to 10% of the overall score. The revised tender evaluation framework will be fully
3 |
MARKET TRENDS
SINGAPORE CONSTRUCTION MARKET
4 |
SINGAPORE REPORT | DECEMBER 2015
According to the Urban Redevelopment Authority (URA), price falls were observed across all segments of the private residential property market. Prices of non-landed properties in the Core Central Region (CCR) declined by 1.2% from the previous quarter, while prices in the Rest of Central Region (RCR) and the Outside Central Region (OCR) both fell by 1.6%. Prices of landed properties declined by 0.4%.
Prices of private residential properties in 3Q 2015 declined for the eight consecutive quarter. Fitch Ratings, in its November 2015 report, also noted private residential property prices have fallen 8.2% from its peak in September 2013. Following the last round of cooling measures in June 2013, the residential property price index decreased by 1.3% (q-o-q) to 142.3 index points in 3Q 2015. The decline was sharper than in the 2Q 2015 (144.2 index points), when prices fell 0.9% from 1Q 2015.
Rentals of private residential properties fell by 0.6% in 3Q 2015, compared to a 1.1% decline in previous quarter. As at the end of 3Q 2015, there were 58,348 uncompleted private residential units (excluding ECs) in the pipeline, compared with 61,237 units in the previous quarter. Of this number, 22,456 units remained unsold. With the addition of 14,540 upcoming EC units, there will be a total of 72,888 units in the pipeline, based on URA’s released data. With reference to expected completion dates reported by developers,
there would be 6,296 units (including ECs) being completed in the last quarter of 2015. URA further reported that another 27,149 units (including ECs) are expected to be completed in 2016.
Prices of office space decreased by 0.1% in 3Q 2015, compared to the increase of 0.3% in the 2Q 2015. The same quarter also saw rental rates of office space fell by 2.9% compared to the decline of 2.6% in the preceding quarter. As at the end of 3Q 2015, there was a total supply of about 908,000m2 GFA of office space in the pipeline and the supply of office space is expected to increase in 4Q 2015.
Correspondingly, the amount of occupied office space increased by 15,000m2 in 3Q 2015, compared to the 38,000m2 increase in the preceding quarter. The stock of office space dropped by 3,000m2 in 3Q 2015, compared to the increase of 8,000m2 in the previous quarter. As a result, the island-wide vacancy rate of office space at the end of 3Q 2015 fell to 9.6%, from 9.8% at the end of 2Q 2015, according to URA.
Fitch Ratings expects the overall house-price growth in Singapore to continue decreasing with prices expected to drop by a further 5.0% in 2016. With the real estate market exposed to the US rate hikes, and an influx of new supply, the soft economy and ongoing measures designed to cool the property market are likely to dampen sentiments.
MARKET TRENDS
SINGAPORE PROPERTy MARKET
5 |
The US economy expanded at a revised 2.0% y-o-y in 3Q 2015, following the 3.9% growth in 2Q 2015. The US economy continued to be bouyed by consumer spending even as businesses struggled to sell to overseas customers who are burdened by sluggish growth. The Federal Reserve finally raised its first interest rates in a decade, after much intense global anticipation. The Fed bank adjusted its benchmark short-term rate to a range of 0.25% to 0.5% after keeping it near zero for seven years in an unprecedented effort to pump up the economy. The country is projected to maintain, at best moderate growth for the rest of 2015 and in 2016, underpinned by private consumption notwithstanding the violatility of global oil prices and plunging stock markets.
The growth momentum in the eurozone slackened in 3Q 2015, as external demand faltered, with sluggish investment and weaker growth in Asia which restrained exports, particularly from the slowing Chinese economy. The eurozone economy expanded at an annual rate of only 1.2% in 3Q 2015, predominantly supported by domestic expenditure. On a quarterly basis, it expanded 0.3% in the third quarter compared to the preceding quarter.
In general, Germany grew by 0.3% in 3Q 2015, down from 0.4% in the previous quarter due to weaker foreign trade and possibly also affected by the repurcussions of the refugee crisis with its ‘Open Borders Policy’. Italy’s economy grew 0.2%, down from 0.3% in 2Q 2015. Smaller nations within the eurozone also had disapppointing GDP growths - Netherlands barely grew and Portugal stagnated. Greece’s economy exceeded expectations when it shrunk by a mere 0.5%, instead of the earlier forecast of 1.0%.
The Japanese economy dodged recession in 3Q 2015 with its revised GDP expansion. Their GDP was adjusted to an annualized expansion of 1.0%. Private consumption recovered from a contraction in the previous quarter to increase by 2.1% in 3Q 2015, while residential investment rose by a solid 8.0% for the third consecutive quarter. In addition, net exports contributed positively to overall growth in 3Q 2015, the first such boost since 4Q 2014. Despite so, the overall economy remains stagnant amid weak exports and household spending.
The Chinese economy grew faster than expected in 3Q 2015 with a 6.9% GDP growth, riding on the the growth of the services sector. This is slightly lower than the 7.0% growth in 1H 2015. Residential real estate prices continued to rise into December 2015, which suggested improvements in the housing market, even though the recovery remains uneven across the country. The country is still suffering from a shrinking labour force, factory overcapacity, oversupply of housing and weak foreign demand for Chinese exports. The Chinese government has vaguely set five key goals for 2016 including shrinking the glut of unsold homes, reducing businesses costs and encouraging new technology as well as to boost spending on infrastructure projects to make up for the fall in property and manufacturing-linked investment. The World Bank forecasts growth in China to slow to 6.7% in 2016.
For the Asean region, the World Bank moderated its outlook and warned that economic growth in the region remains at risk from a prolonged slowdown in China, on top of the possibility of greater financial market volatility and restricted credit. Emerging economies are subjected to a steep appreciation of the value of the US dollar; and a slower than expected acceleration of high income economies.
SINGAPORE REPORT | DECEMBER 2015
MARKET TRENDS
GLOBAL ECONOMy
6 |
Data Sources: BCA and RLB
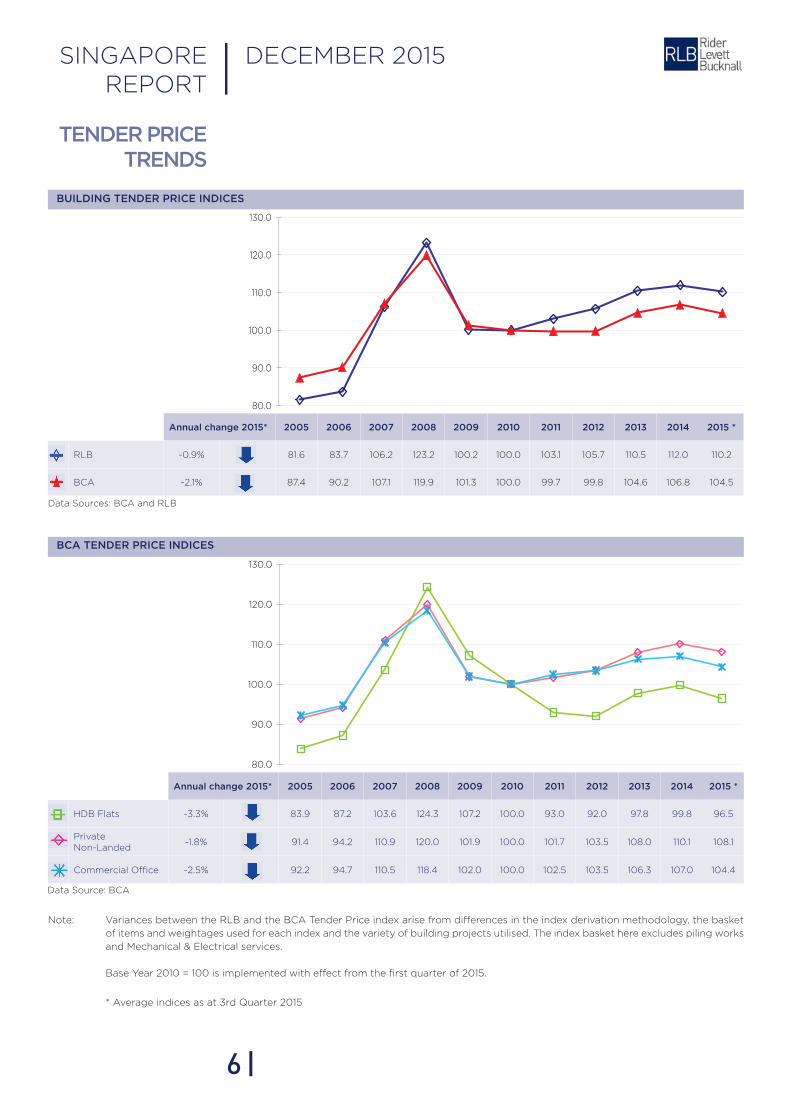
Variances between the RLB and the BCA Tender Price index arise from differences in the index derivation methodology, the basket
of items and weightages used for each index and the variety of building projects utilised. The index basket here excludes piling works
and Mechanical & Electrical services.
Base year 2010 = 100 is implemented with effect from the first quarter of 2015.
* Average indices as at 3rd Quarter 2015
Note:
Data Source: BCA
Annual change 2015* 2005 2006 2007 2008 2009 2010 2011 2012 2013 2014 2015 *
RLB -0.9% 81.6 83.7 106.2 123.2 100.2 100.0 103.1 105.7 110.5 112.0 110.2
BCA -2.1% 87.4 90.2 107.1 119.9 101.3 100.0 99.7 99.8 104.6 106.8 104.5
BUILDING TENDER PRICE INDICES
Annual change 2015* 2005 2006 2007 2008 2009 2010 2011 2012 2013 2014 2015 *
HDB Flats -3.3% 83.9 87.2 103.6 124.3 107.2 100.0 93.0 92.0 97.8 99.8 96.5
PrivateNon-Landed
-1.8% 91.4 94.2 110.9 120.0 101.9 100.0 101.7 103.5 108.0 110.1 108.1
Commercial Office -2.5% 92.2 94.7 110.5 118.4 102.0 100.0 102.5 103.5 106.3 107.0 104.4
DECEMBER 2015|SINGAPORE REPORT
TENDER PRICE TRENDS
BCA TENDER PRICE INDICES
80.0
90.0
100.0
110.0
120.0
130.0
80.0
90.0
100.0
110.0
120.0
130.0
CRUDE OIL PRICES
Data Source: BCA
Data Source: IMF
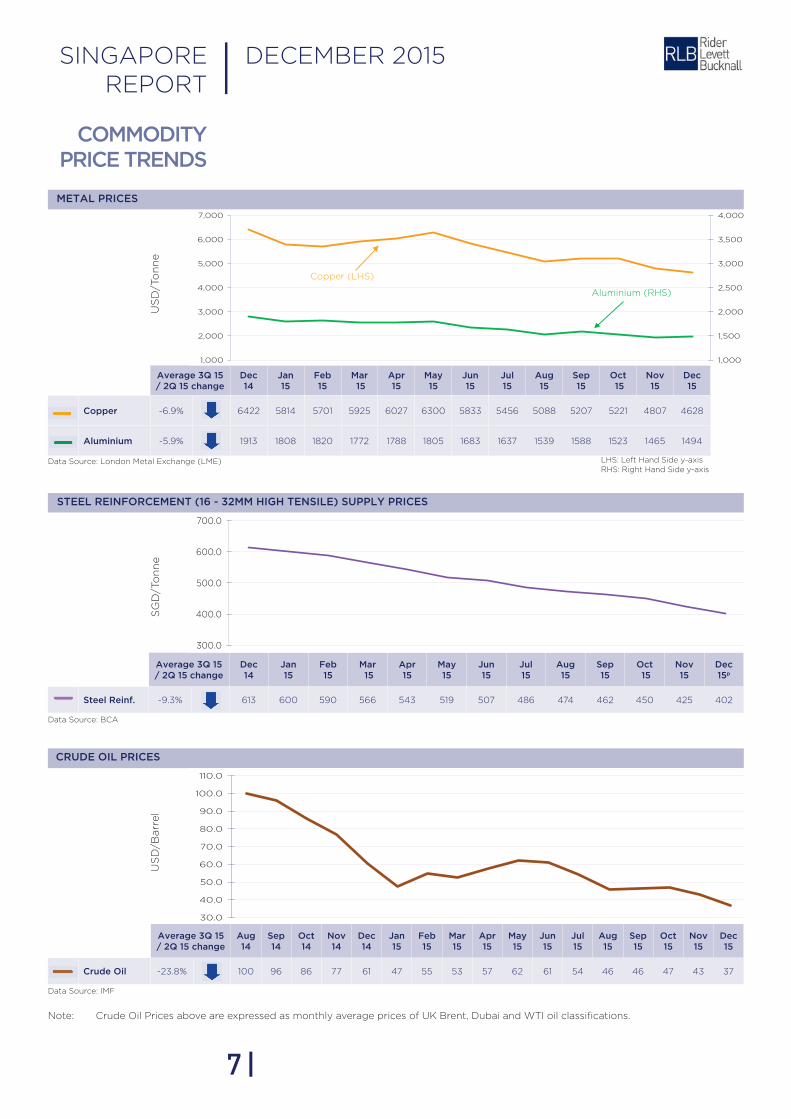
Note: Crude Oil Prices above are expressed as monthly average prices of UK Brent, Dubai and WTI oil classifications.
7 |
STEEL REINFORCEMENT (16 - 32MM HIGH TENSILE) SUPPLY PRICES
METAL PRICES
Average 3Q 15 / 2Q 15 change
Aug 14
Sep 14
Oct 14
Nov 14
Dec 14
Jan 15
Feb 15
Mar 15
Apr 15
May 15
Jun 15
Jul 15
Aug 15
Sep 15
Oct 15
Nov 15
Dec 15
Crude Oil -23.8% 100 96 86 77 61 47 55 53 57 62 61 54 46 46 47 43 37
Data Source: London Metal Exchange (LME)
US
D/B
arr
el
SG
D/T
on
ne
US
D/T
on
ne
LHS: Left Hand Side y-axisRHS: Right Hand Side y-axis
SINGAPORE REPORT | DECEMBER 2015
COMMODITY PRICE TRENDS
Average 3Q 15 / 2Q 15 change
Dec 14
Jan 15
Feb 15
Mar 15
Apr 15
May 15
Jun 15
Jul 15
Aug 15
Sep 15
Oct 15
Nov 15
Dec 15p
Steel Reinf. -9.3% 613 600 590 566 543 519 507 486 474 462 450 425 402
30.0
40.0
50.0
60.0
70.0
80.0
90.0
100.0
110.0
USD
/Bar
rel
Crude Oil
300.0
400.0
500.0
600.0
700.0
S$/Tonne
P : Preliminary Data Source: BCA
Steel Reinforcement
Average 3Q 15 / 2Q 15 change
Dec 14
Jan 15
Feb 15
Mar 15
Apr 15
May 15
Jun 15
Jul 15
Aug 15
Sep 15
Oct 15
Nov 15
Dec 15
Copper -6.9% 6422 5814 5701 5925 6027 6300 5833 5456 5088 5207 5221 4807 4628
Aluminium -5.9% 1913 1808 1820 1772 1788 1805 1683 1637 1539 1588 1523 1465 1494
1,000
1,500
2,000
2,500
3,000
3,500
4,000
1,000
2,000
3,000
4,000
5,000
6,000
7,000
US
D/T
onn
e
Copper (LHS)
Aluminium (RHS)
50.0
100.0
150.0
0.0
20.0
40.0
60.0
80.0
100.0
120.0
Dec 14 Jan 15 Feb 15 Mar 15 Apr 15 May 15 Jun 15 Jul 15 Aug 15 Sep 15 Oct 15 Nov 15 Dec 15 p
S$/m3S$/Tonne
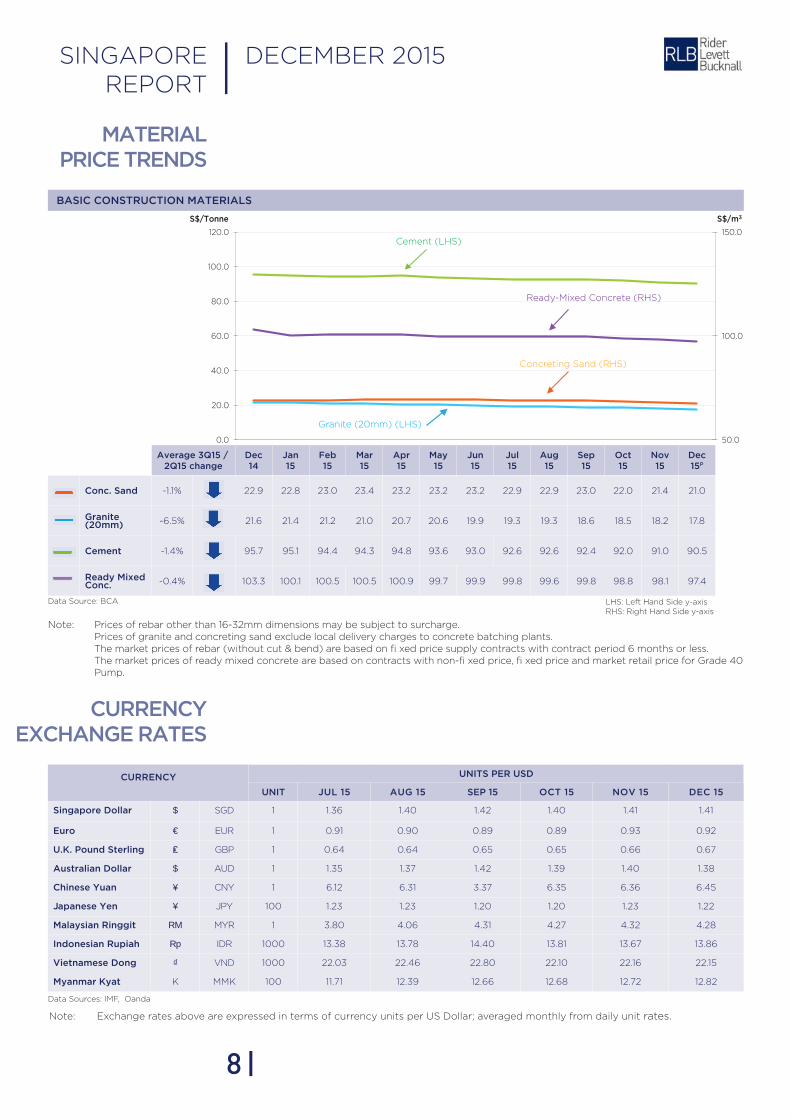
BASIC CONSTRUCTION MATERIALS
Data Source: BCA LHS: Left Hand Side y-axis RHS: Right Hand Side y-axis
Prices of rebar other than 16-32mm dimensions may be subject to surcharge.Prices of granite and concreting sand exclude local delivery charges to concrete batching plants.The market prices of rebar (without cut & bend) are based on fi xed price supply contracts with contract period 6 months or less.The market prices of ready mixed concrete are based on contracts with non-fi xed price, fi xed price and market retail price for Grade 40 Pump.
Note:
CURRENCYEXCHANGE RATES
Data Sources: IMF, Oanda
Note: Exchange rates above are expressed in terms of currency units per US Dollar; averaged monthly from daily unit rates.
8 |
CURRENCY UNITS PER USD
UNIT JUL 15 AUG 15 SEP 15 OCT 15 NOv 15 DEC 15
Singapore Dollar $ SGD 1 1.36 1.40 1.42 1.40 1.41 1.41
Euro € EUR 1 0.91 0.90 0.89 0.89 0.93 0.92
U.K. Pound Sterling ₤ GBP 1 0.64 0.64 0.65 0.65 0.66 0.67
Australian Dollar $ AUD 1 1.35 1.37 1.42 1.39 1.40 1.38
Chinese Yuan ¥ CNy 1 6.12 6.31 3.37 6.35 6.36 6.45
Japanese Yen ¥ JPy 100 1.23 1.23 1.20 1.20 1.23 1.22
Malaysian Ringgit RM MyR 1 3.80 4.06 4.31 4.27 4.32 4.28
Indonesian Rupiah Rp IDR 1000 13.38 13.78 14.40 13.81 13.67 13.86
vietnamese Dong ₫ VND 1000 22.03 22.46 22.80 22.10 22.16 22.15
Myanmar Kyat K MMK 100 11.71 12.39 12.66 12.68 12.72 12.82
Average 3Q15 / 2Q15 change
Dec 14
Jan 15
Feb 15
Mar 15
Apr 15
May 15
Jun 15
Jul 15
Aug 15
Sep 15
Oct 15
Nov 15
Dec 15P
Conc. Sand -1.1% 22.9 22.8 23.0 23.4 23.2 23.2 23.2 22.9 22.9 23.0 22.0 21.4 21.0
Granite (20mm) -6.5% 21.6 21.4 21.2 21.0 20.7 20.6 19.9 19.3 19.3 18.6 18.5 18.2 17.8
Cement -1.4% 95.7 95.1 94.4 94.3 94.8 93.6 93.0 92.6 92.6 92.4 92.0 91.0 90.5
Ready Mixed Conc. -0.4% 103.3 100.1 100.5 100.5 100.9 99.7 99.9 99.8 99.6 99.8 98.8 98.1 97.4
Cement (LHS)
Ready-Mixed Concrete (RHS)
Granite (20mm) (LHS)
Concreting Sand (RHS)
SINGAPORE REPORT | DECEMBER 2015
MATERIAL PRICE TRENDS
LOCALCONSTRUCTION
PRICES
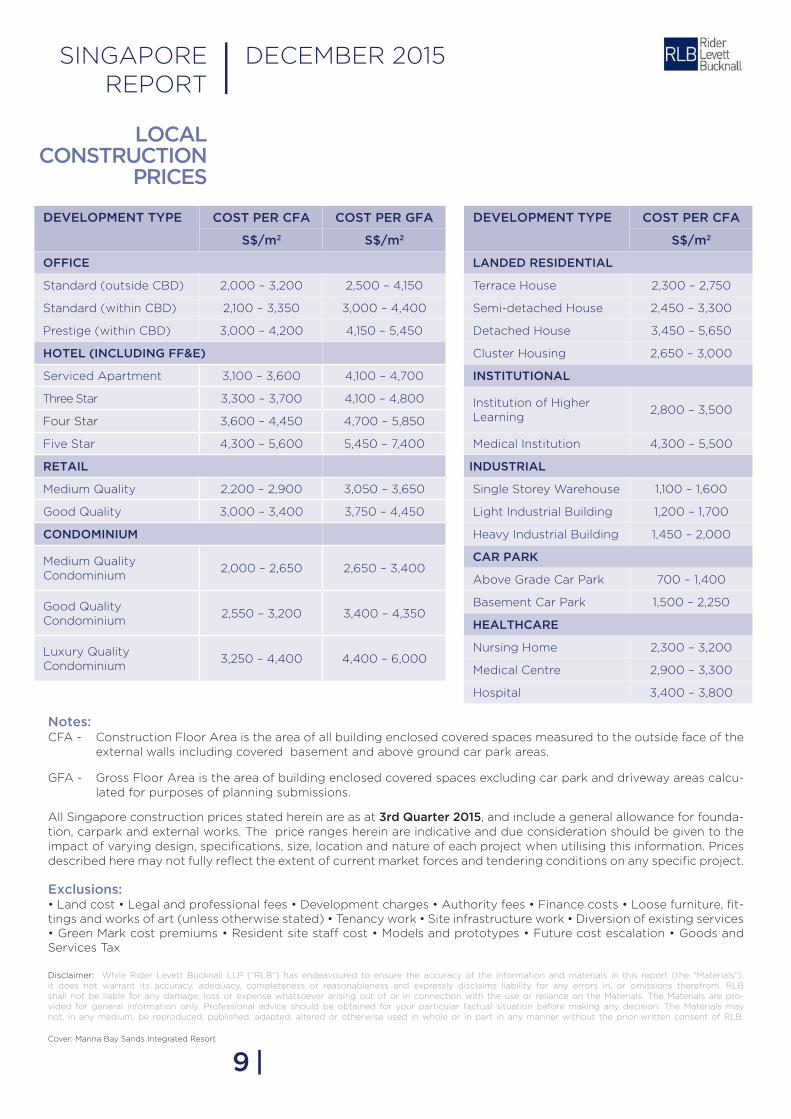
Notes:CFA - Construction Floor Area is the area of all building enclosed covered spaces measured to the outside face of the external walls including covered basement and above ground car park areas.
GFA - Gross Floor Area is the area of building enclosed covered spaces excluding car park and driveway areas calcu- lated for purposes of planning submissions.
All Singapore construction prices stated herein are as at 3rd Quarter 2015, and include a general allowance for founda-tion, carpark and external works. The price ranges herein are indicative and due consideration should be given to the impact of varying design, specifications, size, location and nature of each project when utilising this information. Prices described here may not fully reflect the extent of current market forces and tendering conditions on any specific project.
Exclusions:• Land cost • Legal and professional fees • Development charges • Authority fees • Finance costs • Loose furniture, fit-tings and works of art (unless otherwise stated) • Tenancy work • Site infrastructure work • Diversion of existing services • Green Mark cost premiums • Resident site staff cost • Models and prototypes • Future cost escalation • Goods and Services Tax
Disclaimer: While Rider Levett Bucknall LLP (“RLB”) has endeavoured to ensure the accuracy of the information and materials in this report (the “Materials”), it does not warrant its accuracy, adequacy, completeness or reasonableness and expressly disclaims liability for any errors in, or omissions therefrom. RLB shall not be liable for any damage, loss or expense whatsoever arising out of or in connection with the use or reliance on the Materials. The Materials are pro-vided for general information only. Professional advice should be obtained for your particular factual situation before making any decision. The Materials may not, in any medium, be reproduced, published, adapted, altered or otherwise used in whole or in part in any manner without the prior written consent of RLB.
9 |
DEvELOPMENT TYPE COST PER CFA
S$/m2
LANDED RESIDENTIAL
Terrace House 2,300 – 2,750
Semi-detached House 2,450 – 3,300
Detached House 3,450 – 5,650
Cluster Housing 2,650 – 3,000
INSTITUTIONAL
Institution of Higher Learning
2,800 – 3,500
Medical Institution 4,300 – 5,500
INDUSTRIAL
Single Storey Warehouse 1,100 – 1,600
Light Industrial Building 1,200 – 1,700
Heavy Industrial Building 1,450 – 2,000
CAR PARK
Above Grade Car Park 700 – 1,400
Basement Car Park 1,500 – 2,250
HEALTHCARE
Nursing Home 2,300 – 3,200
Medical Centre 2,900 – 3,300
Hospital 3,400 – 3,800
SINGAPORE REPORT | DECEMBER 2015
DEvELOPMENT TYPE COST PER CFA COST PER GFA
S$/m2 S$/m2
OFFICE
Standard (outside CBD) 2,000 – 3,200 2,500 – 4,150
Standard (within CBD) 2,100 – 3,350 3,000 – 4,400
Prestige (within CBD) 3,000 – 4,200 4,150 – 5,450
HOTEL (INCLUDING FF&E)
Serviced Apartment 3,100 – 3,600 4,100 – 4,700
Three Star 3,300 – 3,700 4,100 – 4,800
Four Star 3,600 – 4,450 4,700 – 5,850
Five Star 4,300 – 5,600 5,450 – 7,400
RETAIL
Medium Quality 2,200 – 2,900 3,050 – 3,650
Good Quality 3,000 – 3,400 3,750 – 4,450
CONDOMINIUM
Medium Quality Condominium
2,000 – 2,650 2,650 – 3,400
Good Quality Condominium
2,550 – 3,200 3,400 – 4,350
Luxury Quality Condominium
3,250 – 4,400 4,400 – 6,000
Cover: Marina Bay Sands Integrated Resort
RLB GLOBAL OFFICESRider Levett Bucknall is an independent, global property and construction practice with over 3,500 people in more than 120 offices across Asia, Oceania, Europe, Middle East, Africa and the Americas. Services provided include Cost Management, Project Management and Advisory Services.
ASIASINGAPORETelephone: +65 6339 1500E-Mail: [email protected]: Winston HauwMALAySIAKUALA LUMPURTelephone: +60 3 6207 9991E-mail: [email protected]: Kar Fook LaiINDONESIAJAKARTATelephone: +62 21 5795 2308E-Mail: [email protected]: Colin Kin VIETNAMHO CHI MINH CITyTelephone: +84 83 823 8070E-Mail: [email protected] Contact: Silas LohMyANMARyANGONTelephone: +95 1 3448 (ext. 4004)E-mail: [email protected]: Silas LohPHILIPPINESCAGAyAN DE OROTelephone: +63 88 850 4105E-mail: [email protected]: Corazon Ballard CEBUTelephone: +63 032 268 0072E-mail: [email protected]: Corazon BallardDAVAOTelephone: +63 082 235 0995E-mail: [email protected]: Corazon BallardMANILATelephone: +63 2 687 1075E-mail: [email protected]: Corazon BallardHONG KONG Telephone: +852 2823 1823E-mail: [email protected]: Philip LoMACAUTelephone: +853 2875 3088E-mail: [email protected]: Kenneth KwanJAPANTOKyOTelephone: +81 3 5402 6080Email: [email protected]: Takayoshi SatoSOUTH KOREASEOULTelephone: +82 2 582 2834E-mail: [email protected]: Stephen LaiTAIWANRider Levett Bucknall (Hong Kong)Telephone: +852 2823 1823E-mail: [email protected]: Phillip LoMAINLAND CHINABEIJINGTelephone: +86 10 6515 5818E-mail: [email protected]: Simon TuenCHENGDUTelephone: +86 28 8670 3382E-mail: [email protected]: Eric Lau CHONGQINGTelephone: +86 23 6380 6628E-mail: [email protected]: Danny ChowDALIANTelephone: +86 411 3973 7778E-mail: [email protected]: Simon TuenGUANGZHOUTelephone: +86 20 8732 1801E-mail: [email protected]: Danny ChowGUIyANGTelephone: +86 851 553 3818E-mail: [email protected]: Danny ChowHAIKOUTelephone: +86 898 6672 6638E-mail: [email protected]: Stephen LaiHANGZHOUTelephone: +86 571 8539 3028E-mail: [email protected]: Iris LeeNANJINGTelephone: +86 25 8678 0300E-mail: [email protected]: Eric Fong
QINGDAOTelephone: +86 532 8612 3015E-mail: [email protected]: Stephen LiuSHANGHAITelephone: +86 21 6330 1999Email: [email protected]: Iris Lee / Eric Fong / Wei Qing WangSHENyANGTelephone: +86 24 2396 5516E-mail: [email protected]: Choi Hing Chan SHENZHENTelephone: +86 755 8246 0959E-mail: [email protected] Contact: Kenneth KwanTIANJINTelephone: +86 22 2339 6632E-mail: [email protected] Contact: Stephen LaiWUHANTelephone: +86 27 6885 0986E-mail: [email protected]: Stephen LaiWUXITelephone: +86 510 8274 0266E-mail: [email protected] Contact: Wei Qing Wang XIANTelephone: +86 29 8833 7433E-mail: [email protected]: Stephen LiuZHUHAITelephone: +86 756 388 9010E-mail: [email protected]: Kenneth Kwan
OCEANIAAUSTRALIAADELAIDETelephone: +61 8 8100 1200E-mail: [email protected]: Andrew SuttieBRISBANETelephone: +61 7 3009 6933E-mail: [email protected]: Mark BurowCAIRNSTelephone: +61 7 4032 1533E-mail: [email protected]: Nicholas DuncanCANBERRATelephone: +61 2 6281 5446E-mail: [email protected]: Mark Chappé DARWINTelephone: +61 8 8941 2262E-mail: [email protected]: Paul LassemillanteGOLD COASTTelephone: +61 7 5595 6900E-mail: [email protected]: Stuart HoughtonMELBOURNETelephone: +61 3 9690 6111E-mail: [email protected]: Michael Kerr NEWCASTLETelephone: +61 2 4940 0000E-mail: [email protected]: Mark HockingNORTHERN NEW SOUTH WALESTelephone: +61 2 6659 2060E-mail: [email protected]: Mark HockingPERTHTelephone: +61 8 9421 1230E-mail: [email protected]: Alastair McMichael SUNSHINE COASTTelephone: +61 7 5443 3622E-mail: [email protected]: David StewartSyDNEyTelephone: +61 2 9922 2277E-mail: [email protected]: Bob RichardsonTOWNSVILLETelephone: +61 7 4771 5718E-mail: [email protected]: Chris MaraisContact: Tony SutherlandNEW ZEALANDAUCKLANDTelephone: +64 9 309 1074E-mail: [email protected]: Brian DackersCHRISTCHURCHTelephone: +64 3 354 6873E-mail: [email protected]: Malcolm Timms
HAMILTONTelephone: +64 9 309 1074E-mail: [email protected]: Richard Anderson OTAGOTelephone: +64 3 409 0325E-mail: [email protected]: Chris HainesPALMERSTON NORTHTelephone: +64 6 357 0326E-mail: [email protected]: Wayne KitchingTAURANGATelephone: +64 7 579 5873E-mail: [email protected]: Richard GerrishWELLINGTONTelephone: +64 4 384 9198E-mail: [email protected]
EUROPEUNITED KINGDOMBIRCHWOOD/ WARRINGTONTelephone: +44 0 192 585 1787 E-mail: [email protected]: Deryck BartonBIRMINGHAMTelephone: +44 0 121 503 1500E-Mail: [email protected] Contact: Nigel MasonBRISTOLTelephone: +44 0 117 974 1122E-Mail: [email protected] Contact: Mark WilliamsonLONDONTelephone: +44 0 207 398 8300E-mail: [email protected]: Tony CatchpoleMANCHESTERTelephone: +44 0 161 868 7700E-Mail: [email protected]: Deryck BartonNEWCASTLETelephone: +44 0 121 503 1500 E-Mail: [email protected]: Mark WeaverSHEFFIELDTelephone: +44 0 114 273 3300E-Mail: [email protected]: Dean SheehyWELWyN GARDEN CITyTelephone: +44 0 170 787 1506E-Mail: [email protected] Contact: Andrew ReynoldsWOKINGHAMTelephone: +44 0 118 974 3600E-Mail: [email protected] Contact: Simon KertonRLB | EUROALLIANCETelephone: +44 7764 285899E-mail: [email protected]: Andrew Reynolds
AMERICASCANADACALGARyTelephone: +1 403 571 0505E-mail: [email protected]: Peter KnowlesCARIBBEANBAHAMAS Telephone: +1 242 677 9142E-Mail: [email protected]: Gordon GlenBARBADOSTelephone: +1 246 432 5795E-Mail: [email protected]: Robert HoyleGRAND CAyMAN ISLANDSTelephone: +1 345 946 6063E-Mail: [email protected]: Martyn BouldUSAAUSTINTelephone: +1 512 704 3026E-Mail: [email protected]: Ruben RodriguesBOSTONTelephone: +1 617 737 9339E-Mail: [email protected]: Grant OwenCHICAGOTelephone: +1 312 819 4250E-mail: [email protected]: Robert GarrisonDENVERTelephone: +1 720 904 1480E-Mail: [email protected]: Peter Knowles GUAMTelephone: +1 671 473 9054E-mail: [email protected]: Emile le Roux
HILOTelephone: +1 808 934 7953E-mail: [email protected]: Kevin MitchellHONOLULUTelephone: +1 808 521 2641E-Mail: [email protected]: Tony Smith / Paul Brussow / Maelyn UyeharaTelephone: +1 702 227 8818E-Mail: [email protected]: Julian Anderson LOS ANGELESTelephone: +1 213 689 1103E-Mail: [email protected]: Graham RoyMAUITelephone: +1 808 875 1945E-Mail: [email protected]: Brian LowderNEW yORKTelephone: +1 212 952 1300E-Mail: [email protected]: Grant OwenPHOENIXTelephone: +1 602 443 4848E-Mail: [email protected]: Julian Anderson/ Scott Macpherson/ John Jozwick PORTLANDTelephone: +1 503 226 2730E-Mail: [email protected]: Graham RoySAN FRANCISCOTelephone: +1 415 362 2613E-Mail: [email protected]: Graham RoySEATTLETelephone: +1 206 223 2055E-Mail: [email protected]: Chris BurrisTUSCONTelephone: +1 520 202 7378E-mail: [email protected]: Joel BrownWAIKOLOATelephone: +1 808 883 3379E-mail: [email protected]: Kevin MitchellWASHINGTON DCTelephone: +1 202 434 8350E-Mail: [email protected]: Grant Owen
AFRICASOUTH AFRICACAPE TOWNTelephone: +27 21 418 9977E-mail: [email protected]: Martin MeineszJOHANNESBURGTelephone: +27 11 548 4000E-mail: [email protected]: Leon CronjePRETORIATelephone: +27 12 348 1040E-mail: [email protected]: Nicholas Sheard BOTSWANAGABARONETelephone: +278 32 260 303E-mail: [email protected]: Nicholas SheardMAURITIUSMOKATelephone: +230 433 9954E-mail: [email protected]: Marvind BeetulMOZAMBIQUEMAPUTOTelephone: +258 21 495 791E-mail: [email protected]: Charlé Viljoen
MIDDLE EASTABU DHABITelephone: +971 2 643 3691E-mail: [email protected] Contact: Tony BrattDOHATelephone: +974 4 016 2777E-mail: [email protected]: Sam GrahamDUBAITelephone: +971 4 339 7444E-Mail: [email protected]: Rob EdgecombeMUSCATTelephone: +968 2 449 9676E-Mail: [email protected]: Stephen LaiRIyADHTelephone: +966 506 633 288E-mail: [email protected]

rlb.com
A Quarterly Publication from RLB Research of:
Rider Levett Bucknall LLP 150 Beach Road #09-01 Gateway West Singapore 189720 Tel: +65 6339 1500 | Fax: +65 6339 1521 | Web: www.rlb.com | E-mail: [email protected]
MCI (P) 140/06/2016