Embed Size (px)
Citation preview
ed: TH / sa: JC, PY
FSST Small Cap: 397.81 FSST - Mid Cap : 684.56 STI : 3,096.69
Analyst Paul YONG CFA +65 6682 3712 [email protected]
Singapore Research Team
Key Indices
Current % ChngSTI Index 3,096.69 -0.4% FS Small Cap Index 395.52 -0.6% USD/SGD Curncy 1.41 -0.6% Daily Volume (m) 2,634 Daily Turnover (S$m) 1,024 Daily Turnover (US$m) 727
Source: Bloomberg Finance L.P.
Prices as at 20 Feb 2017
Source: DBS Bank Source: Bloomberg Finance L.P.
DBS Group Research. Equity 21 Feb 2017
Singapore Market Focus
Small Mid Cap MonthlyIssue No. 14 Refer to important disclosures at the end of this report
Jump on the privatisation bandwagon Markets remained buoyant over the last four
weeks, with small caps leading growth
Riding on the positive momentum, we continueto favour growth stocks for February - Cityneon,Courts Asia, Japfa, mm2 and recent initiation,Best World
Three privatisation offers have been made in2017, putting the privatisation theme back underthe spotlight; We highlight 5 potentialcandidates: Courts Asia, PACC Offshore,Mermaid Maritime, CSE Global and Sinostar PEC
Seeking growth; add Best World. While small caps (FTSE ST Small Cap Index) were the best performing over the past month, the mid- and large-cap segments (represented by the FTSE ST Mid Cap and FTSE STI Indices) also did well, gaining 2.9% on average.
With investor sentiment still strong, we continue to favour companies with firm growth prospects and keep three of our five picks for February – Cityneon, Japfa and mm2. We also add privatisation candidate, Courts Asia, and Best World, a unique play on the Asian (especially China) consumption story.
Offering attractive premiums, privatisations help unlock value and offer exit for shareholders. Buyout offers that have emerged over the last twelve months offered average premiums of 24% and 31% over their last transaction price and one-month VWAP, respectively.
Interest in this space could continue to heat up ahead as more than one-third of profitable small-mid cap (market cap between S$50m – S$2bn) companies are currently trading under book value. Taking cues from companies that have been successfully privatised over the past year, we screened for potential privatisation candidates based on the following criteria:
(1) Low P/B, (2) Profitable over the last twelve months, (3) Majority shareholders with >50% stake in the company, and (4) More than 40% of current share price backed by net cash.
Top privatisation candidates. With our stock screen in mind, we highlight 5 companies that could potentially see privatisation or take-over offers, including Courts Asia, PACC Offshore, Mermaid Maritime, CSE Global and Sinostar PEC.
SMC Top Picks
Price Mkt Cap 12-mth Target Price Performance (%)
S$ US$m S$ 1 mth 12 mth Rating
Current
Best World International
1.91 372 2.36 37.9 623.5 BUY
Cityneon Holdings 0.90 155 1.26 (18.9) 221.4 BUY Courts Asia 0.45 161 0.51 0.0 39.1 BUY Japfa Ltd 0.97 1,206 1.26 4.9 108.6 BUY mm2 Asia 0.51 366 0.56 13.5 182.5 BUY
Previous Cityneon Holdings 0.90 155 1.26 (18.9) 221.4 BUY CNMC Goldmine 0.40 115 0.65 (11.1) 86.1 BUY Ezion Holdings 0.38 555 0.56 24.6 (17.6) BUY Japfa Ltd 0.97 1,206 1.26 4.9 108.6 BUY mm2 Asia 0.51 366 0.56 13.5 182.5 BUY
Page 1

Market Focus
Small Mid Cap Monthly
Conviction picks for January & February
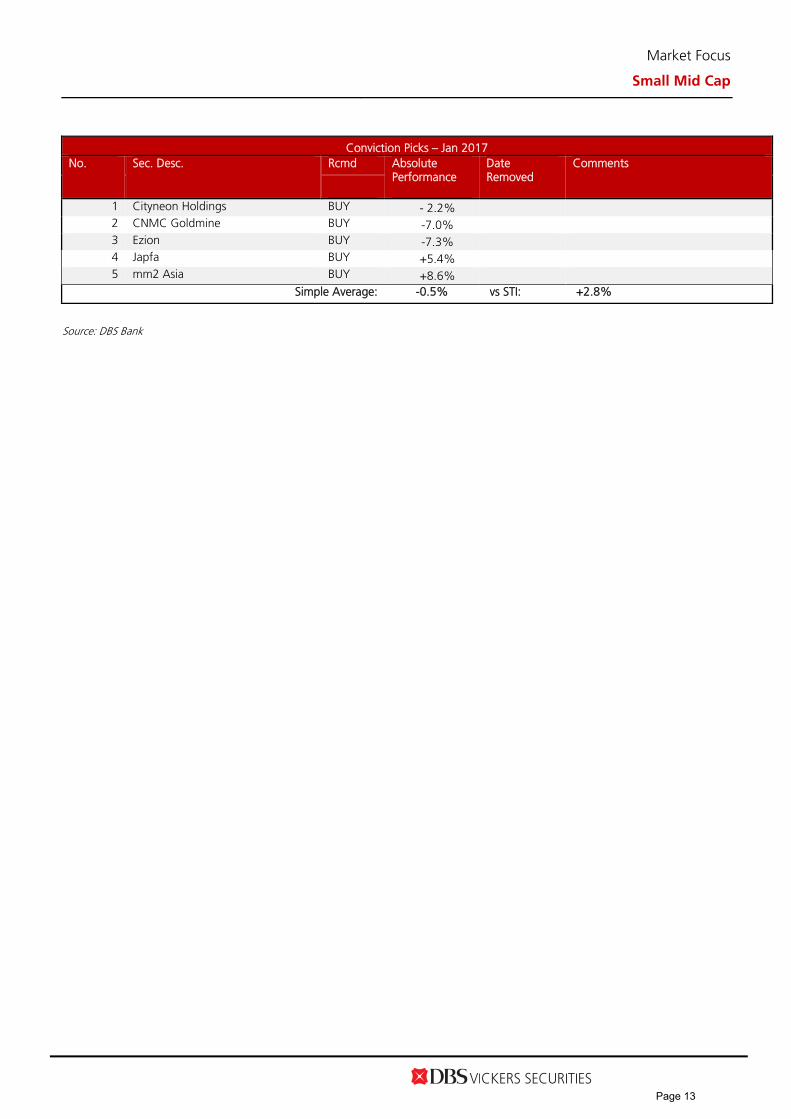
Our January picks declined 0.5% on average. Performances among our conviction picks for January were fairly mixed, with mm2 Asia and Japfa further extending their gains by 8.6% and 7.4% over the last four weeks, respectively and outperforming the three indices (FTSE STI +2.8%, FTSE ST Small Cap +3.6% and FTSE Mid Cap +2.3%). Meanwhile, a pullback in Ezion following its four-month rally resulted in a 7.3% m-o-m decline. In anticipation of a weak set of results (mainly due to unrealised forex losses) for 4Q16, CNMC Goldmine also fell 7.0% m-o-m. Beyond the temporary blip, higher gold production and gold prices could catalyse earnings for the group, with further upside potential from M&A.
Desc. 1M Price Performance* Dec Conviction Picks +0.5% Cityneon Holdings -2.2% CNMC Goldmine -7.0% Ezion -7.3% Japfa +5.4% mm2 Asia +8.6% Indices (STI, FSTS and FSTM) +2.9% FTSE STI +2.8% FSTS Index +3.6% FSTM Index +2.3%
*Refers to change in last price between 17th Jan and 16th Feb Source: DBS Bank, Bloomberg Finance L.P
Include new initiation, Best World International (BUY, TP S$2.36) and Courts Asia (BUY, TP S$0.51) among conviction picks for February. With earnings momentum in Taiwan likely to be sustained by targeted efforts to cultivate existing networks and leapfrog into Northern Taiwan and MOFCOM’s indirect endorsement through the recent award of its direct selling license in the PRC providing the company with the credibility and platform needed to gain scale in China, we like Best World as a unique play on the Asian (especially China) consumption story. Riding on the steady growth outlook of its key markets of Taiwan and China, we project PATMI to rise quickly at 68% CAGR from S$10.1m in FY15 to S$48m by FY18F, and opine that it should trade at a smaller discount to global peers’ 19x forward PE. On track to to post core earnings growth of 30% y-o-y on the back of better cost controls, stronger gross margins and lower interest costs, earnings recovery for Courts Asia will be led by store network expansion plans in Indonesia and Malaysia, which in turn should benefit from the expected acceleration in GDP growth and consumer sentiment recovery regionally in 2017. Apart from compelling valuations of 8x FY18F PE (near -0.5SD of its historical forward PE valuation) and 0.7x P/B, we also like Courts , which is more than 70% owned by Singapore Retail Group, as a potential privatisation play.
No. Security Desc. Sector Rating Last Price
(17-Jan)
12-mth
Target Price
Upside/
(Downside)
Catalyst
1 Best World
International
Consumer
Services
BUY 0.910 2.36 24% 1) Earnings delivery
2) Successful expansion into new
markets
3) M&A
2 Cityneon Holdings
Consumer
Services
BUY 0.900 1.26 40% 1) Securing of third IP
2) Entry of strategic investor
3 Courts Asia
Consumer
Services
BUY 0.440 0.51 16% 1) Earnings recovery
2) M&A
4 Japfa Ltd Consumer
Goods
BUY 1.000 1.26 26% 1) Resilence despite typically weaker
4Q earnings
2) Continued growth in all segments
5 mm2 Asia Consumer
Services
BUY 0.505 0.56 11% 1) Earnings-accretive acquisitions
2) UnUsual listing
Source: DBS Bank, Bloomberg Finance L.P
Page 2

Market Focus
Small Mid Cap Monthly
Revisting potential privatisation plays Recent buyout offers put privatisation theme back under the spotlight. Barely two months into the new year, we have already seen buyout offers for three companies, including Healthway Medical and Auric Pacific, offering premiums between 5% to 21% over their last transaction price and 14% to 21% over one-month VWAP. Privatisation premium offered. We estimate that the 20 small-mid companies (of which 14 have been delisted and privatised) that have announced potential privatisations over the last 12 months offered average premiums of 24% and 31% over their last transaction price and one-month VWAP, respectively. At least two-thirds of privatisation candidates were trading below book, while a further two companies were trading at low P/BV of under 1.1x just before their respective offer announcements. A quarter of the privatisation candidates were S-Chips. Of the 20 offers, 75% were made by majority shareholders (nearly half of which were by founding families). At least 15% were led by management or the executive team, while third-party offers only represented 10%. Privatisations help unlock value and offer exit for shareholders. For majority-owned companies trading at persistently low valuations and with less incentive to maintain their listing - especially cash-rich companies with low capex
needs, privatisations can often serve as a means of unlocking value for shareholders, while freeing up company resources towards longer-term objectives and growth. What have been the premiums offered? Premiums can vary pretty widely across deals, looking at small mid-cap privatisations (deal size under S$2 bn and excludes third-party offers) that have gone through successfully over the last 12 months, we found that:- a) Low P/BV companies were more likely to receive privatisation offers (70% were trading below book value) and saw higher premiums on average, b) Higher premiums (>38% over 1mth VWAP) were often required to entice shareholders of companies trading at prices that were much lower compared to their historical peak, c) Conversely, premiums for companies trading close to the upper end of their historical range (i.e. Sim Lian) were more modest, at about 15-20%. Unsurprisingly, prior to the offer, these companies were at least 50% majority owned. While offerors in our sample year did not appear to show bias for net cash companies, we opine that in a rising rate environment, companies with net cash could potentially be more attractive targets, particularly for third-party buyers.
Target Company
Announcement
Deal Size (S$ m)
Final Offer Price
Premium/(Discount) of the Offer Price over Relevant Prices prior to Announcement
Book Value per Share*
(Last Reported)
% Majority owned
Net Cash (Debt)?
Last Transacted Price
1-month VWAP
3-month VWAP
China Yongsheng 24-Feb-16
34.94 $0.03 52% 68% 62% $0.05 68% Net Debt
Xinren Aluminum 25-Feb-16
469.28 $0.60 67% 64% 63% $0.34 75% Net Debt
Select Group 23-Mar-16
60.51 $0.53 24% 38% 43% $0.13 54% Net Debt
OSIM Int'l 7-Mar-16
823.17 $1.39 27% 41% 42% $0.51 69% Net Cash
Pteris Global 21-Apr-16
237.08 $0.85 34% 38% 44% $0.76 54% Net Cash
CMH Pacific 9-May-16
1,091.06 $1.02 23% 22% 25% $0.95 76% Net Debt Sim Lian Group 8-Aug-16
945.54 $1.08 15% 17% 19% $1.14 80% Net Cash
China Auto Electronics 24-Oct-16
88.61 $0.16 23% 57% 65% $0.29 74% Net Debt
Otto Marine 8-Jun-16
48.84 $0.32 39% 45% 43% $1.18 61% Net Debt
XYEC Hldgs 29-Mar-16
21.20 $0.30 50% 44% 47% $0.23 60% Net Cash
* converted to SGD at prevailing exchanges rates as at quarter Source: ThomsonReuters, DBS Bank
Page 3
Market Focus
Small Mid Cap
Page 4
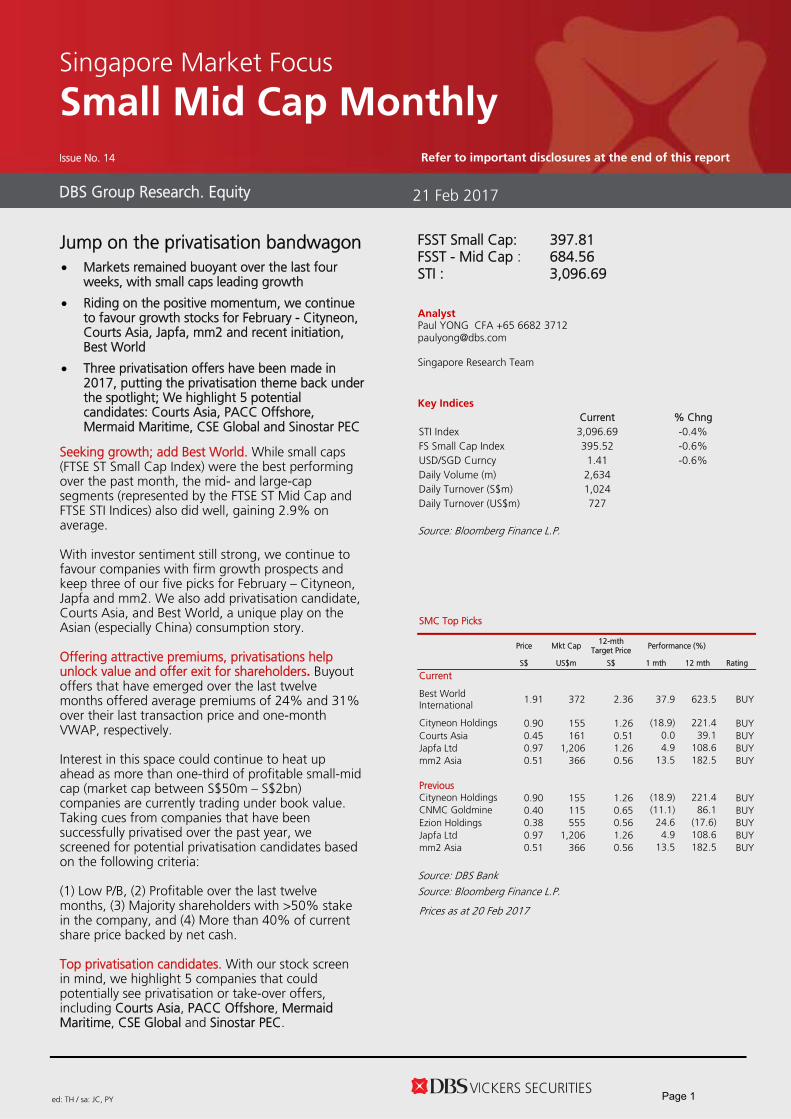
These companies could be next. Staying on this theme, we screen for small-mid cap (market cap between S$50m to S$2 bn) companies outside our coverage that fit the following critera:
1) Low P/BV (Under 1.1x P/BV), 2) Profitable over the last 12 months, 3) Majority shareholders with >50% stake in the company, 4) More than 40% of current share price backed by net cash.
Company Market Cap (S$m)
GICS Sector Name Last Close P/BV P/E ROE (LTM)
5-Yr Avg ROE
% Majority Owned
Net Cash (%Share
Price) CDW Holding 64.2 Information Technology 0.255 0.67 66.7 1.0% 12.9% 55.3% 113%
Nobel Design 92.1 Consumer Discretionary 0.425 0.58 4.6 13.7% 16.1% 72.6% 107%
Sinostar PEC 104.2 Energy 0.163 0.84 6.7 13.2% -5.1% 60.2% 97%
Asia Enterprises 63.5 Industrials 0.186 0.68 27.2 2.5% 0.0% 71.2% 95%
PEC Ltd 144.0 Industrials 0.565 0.66 8.8 7.8% 4.2% 67.9% 93%
Hanwell Holdings 136.9 Consumer Staples 0.24 0.50 32.1 1.6% -0.8% 59.8% 91%
SHS Holdings 152.6 Energy 0.215 0.68 10.8 7.1% 6.5% 57.7% 66%
Hai Leck Holdings 111.6 Energy 0.545 0.89 7.9 11.5% 10.3% 83.5% 62%
PNE Industries 71.7 Information Technology 0.855 0.89 8.1 11.6% 11.3% 82.0% 61%
Metro Holdings 921.9 Consumer Discretionary 1.11 0.68 19.3 3.4% 8.8% 52.8% 57%
Multi-Chem 69.7 Information Technology 0.775 0.72 7.2 10.4% 4.5% 83.6% 56%
Chuan Hup Holdings 241.5 Information Technology 0.26 0.62 13.0 4.8% 9.6% 56.0% 54%
OKP Holdings 98.6 Industrials 0.32 0.93 12.0 7.9% 11.1% 70.5% 67%
Chemical Industries (Far East)
55.0 Materials 0.725 0.53 6.4 8.4% 7.9% 58.7% 50%
InnoTek 78.8 Industrials 0.32 0.60 44.8 1.3% -8.3% 52.8% 49%
Nam Lee Pressed Metal Industries
88.0 Industrials 0.365 0.69 9.7 7.2% 9.5% 65.5% 48%
Khong Guan Flour Milling
51.8 Consumer Staples 2.01 0.83 889.4 0.1% 4.5% 81.8% 48%
Ellipsiz Ltd 81.8 Information Technology 0.49 0.63 10.2 6.3% 6.5% 67.0% 44%
New Toyo Int'l 127.3 Materials 0.29 0.75 12.1 6.3% 9.0% 63.9% 40%
Source: ThomsonReuters, DBS Bank
Trading below net cash per share. Of the 19 names that showed up on our screen, two were trading below their net cash per share levels, namely CDW Holding and Nobel Design. Their net cash per share represented 113% and 107% of their share prices respectively. Other names trading very close to their net cash per share include Sinostar PEC, Asia Enterprises, PEC Ltd and Hanwell – all of which are trading above 90% of their net cash per share levels. Deep discounts to book value. At 0.50x, 0.53x, and 0.58x P/BV, Hanwell Holdings, Chemical Industries and Nobel Design appear to offer deep discounts to their respective asset values. Additionally, Nobel Design and Chemical Industries delivered 13.7% and 8.4% ROE over the last 12 months, respectively, which suggest that they could potentially be deeply undervalued. Undemanding PE valuations. A couple of names that appear inexpensive from a PE perspective include Nobel Design, Chemical Industries, Sinostar PEC, Multi-Chem, and Hai Leck Holdings, which are currently trading at 4.6x, 6.4x, 6.7x, 7.2x and 7.9x historical PE respectively.
Majority shareholders have stakes of over 80%. Based on our screen, four companies – Hai Leck Holdings, Multi-Chem, PNE Industries, and Khong Guan Flour Milling, had substantial majority shareholdings representing 88.5%, 83.6%, 82.0% and 81.8% of their respective free floats. Interestingly, some companies require less cash than on their balance sheet to privatise. With the founding Cheng family and related parties collectively owning about 83.4% of outstanding shares, we believe that Hai Leck Holdings will be a counter to watch as the estimated cash outlay required to acquire remaining shares of under S$25.8m (assuming a 40% offer premium), represents just 1.8x of TTM earnings. This is also less than the current cash (of S$69.9m as at end-4Q16) that the company has on its balance sheet. Assuming a 40% privatisation premium, OKP Holdings, among others, could also require less cash than available on their balance sheet to successfully privatise.
Page 4

Market Focus
Small Mid Cap
Page 5
With our stock screen in mind, we highlight 5 companies that could potentially see privatisation or take-over offers:
Our Top 5 Privatisation Candidates 1
Courts Asia (BUY, TP S$0.51) 1) Compelling valuations of 8x FY18F PE and 0.8x P/BV. 2) 74.3% owned by Singapore Retail Group, the outlay required to acquire remaining shares does not seem excessive in our view (c.S$58m, and approximately 2.3x FY18F net profit level based on current share price).
2 PACC Offshore (BUY, TP S$0.41) 1) Share price has recovered off 2016 lows but at current prices, trades at >50% discount to book value 2) Approximately 81.9% owned by Kuok group 3) POSH is a more stable long-term bet versus peers with no immediate debt concerns, and has also demonstrated ability to secure work for its vessels amid an anaemic market
3
Mermaid Maritime (BUY, TP S$0.24) 1) Mermaid is c.87.3% held by the Thoresen group and its related management. With c. S$270m in cash on hand, the Thoresen group has the necessary ammunition to take Mermaid private. 2) Very low debt levels versus peers, and net gearing of only 0.11x as of 3Q16, which adds to Mermaid’s attractiveness as a privatisation candidate.
4 CSE Global (HOLD, TP S$0.41) 1) Net cash 20% of market cap, 0.9x P/B and 6.5% dividend yield. Reasonable PE of 11x. 2) Free float of over 50% and with no single shareholder holding more than 15%, CSE is a potential take-over target.
5 Sinostar PEC (NON-RATED) 1) Based in Shandong, China, Sinostar produces petrochemical products in two locations. 2) Company is trading below book at 0.8x, and under 7x PE, while trading nearly at net cash per share. 3) Single largest shareholder, the chairmain, owns over 50% of the company.
Source: ThomsonReuters, DBS Bank
Page 5

Market Focus
Small Mid Cap
Appendices
Page 6
Market Focus
Small Mid Cap
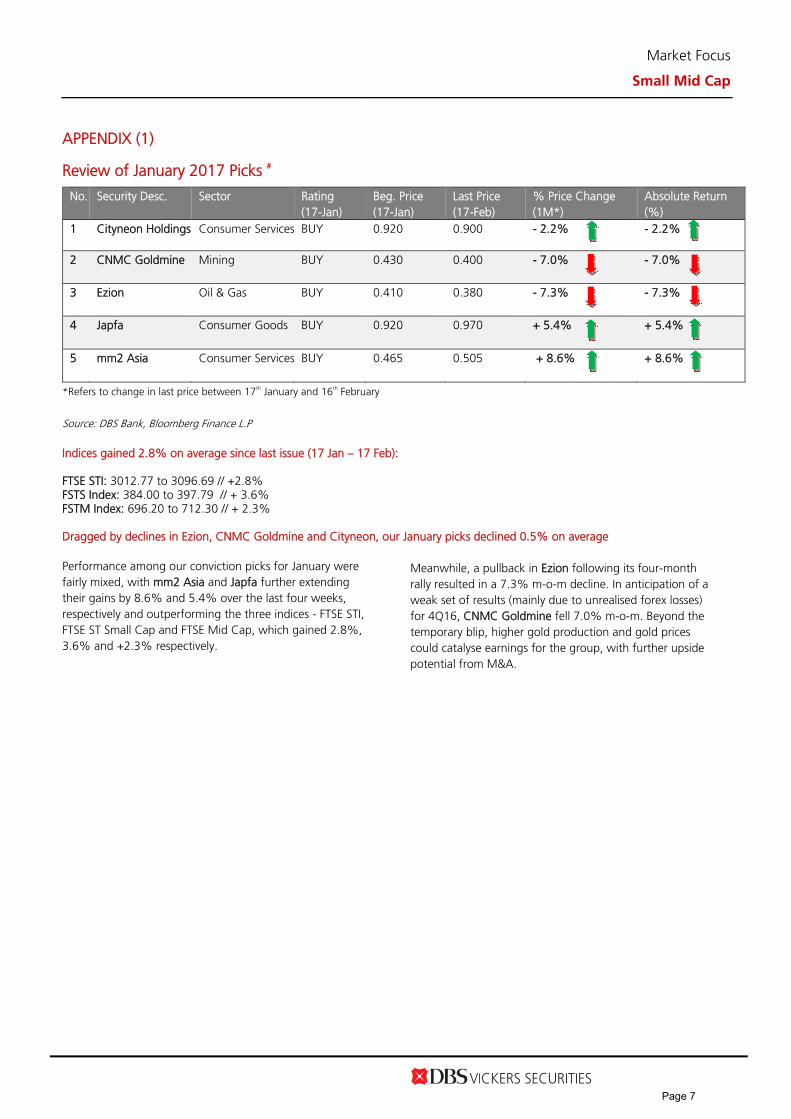
APPENDIX (1) Review of January 2017 Picks #
No. Security Desc. Sector Rating (17-Jan)
Beg. Price (17-Jan)
Last Price (17-Feb)
% Price Change (1M*)
Absolute Return (%)
1 Cityneon Holdings Consumer Services BUY 0.920 0.900 - 2.2% - 2.2%
2 CNMC Goldmine Mining BUY 0.430 0.400 - 7.0% - 7.0%
3 Ezion Oil & Gas BUY 0.410 0.380 - 7.3% - 7.3%
4 Japfa Consumer Goods BUY 0.920 0.970 + 5.4% + 5.4%
5 mm2 Asia Consumer Services BUY 0.465 0.505 + 8.6% + 8.6%
*Refers to change in last price between 17th January and 16th February
Source: DBS Bank, Bloomberg Finance L.P Indices gained 2.8% on average since last issue (17 Jan – 17 Feb): FTSE STI: 3012.77 to 3096.69 // +2.8% FSTS Index: 384.00 to 397.79 // + 3.6% FSTM Index: 696.20 to 712.30 // + 2.3% Dragged by declines in Ezion, CNMC Goldmine and Cityneon, our January picks declined 0.5% on average
Performance among our conviction picks for January were fairly mixed, with mm2 Asia and Japfa further extending their gains by 8.6% and 5.4% over the last four weeks, respectively and outperforming the three indices - FTSE STI, FTSE ST Small Cap and FTSE Mid Cap, which gained 2.8%, 3.6% and +2.3% respectively.
Meanwhile, a pullback in Ezion following its four-month rally resulted in a 7.3% m-o-m decline. In anticipation of a weak set of results (mainly due to unrealised forex losses) for 4Q16, CNMC Goldmine fell 7.0% m-o-m. Beyond the temporary blip, higher gold production and gold prices could catalyse earnings for the group, with further upside potential from M&A.
Page 7
Market Focus
Small Mid Cap
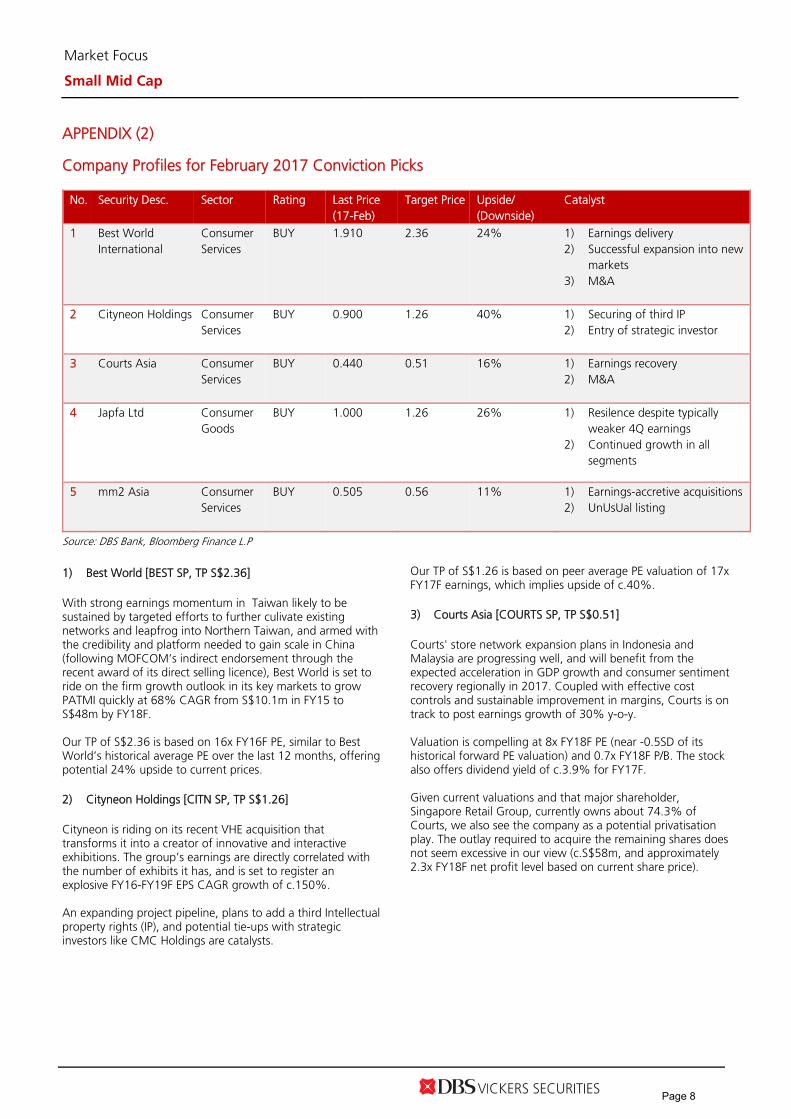
APPENDIX (2) Company Profiles for February 2017 Conviction Picks
No. Security Desc. Sector Rating Last Price (17-Feb)
Target Price Upside/ (Downside)
Catalyst
1 Best World International
Consumer Services
BUY 1.910 2.36 24% 1) Earnings delivery 2) Successful expansion into new
markets 3) M&A
2 Cityneon Holdings Consumer
Services BUY 0.900 1.26 40% 1) Securing of third IP
2) Entry of strategic investor
3 Courts Asia
Consumer Services
BUY 0.440 0.51 16% 1) Earnings recovery 2) M&A
4 Japfa Ltd Consumer
Goods BUY 1.000 1.26 26% 1) Resilence despite typically
weaker 4Q earnings 2) Continued growth in all
segments
5 mm2 Asia Consumer Services
BUY 0.505 0.56 11% 1) Earnings-accretive acquisitions 2) UnUsUal listing
Source: DBS Bank, Bloomberg Finance L.P 1) Best World [BEST SP, TP S$2.36] With strong earnings momentum in Taiwan likely to be sustained by targeted efforts to further culivate existing networks and leapfrog into Northern Taiwan, and armed with the credibility and platform needed to gain scale in China (following MOFCOM’s indirect endorsement through the recent award of its direct selling licence), Best World is set to ride on the firm growth outlook in its key markets to grow PATMI quickly at 68% CAGR from S$10.1m in FY15 to S$48m by FY18F. Our TP of S$2.36 is based on 16x FY16F PE, similar to Best World’s historical average PE over the last 12 months, offering potential 24% upside to current prices. 2) Cityneon Holdings [CITN SP, TP S$1.26]
Cityneon is riding on its recent VHE acquisition that transforms it into a creator of innovative and interactive exhibitions. The group’s earnings are directly correlated with the number of exhibits it has, and is set to register an explosive FY16-FY19F EPS CAGR growth of c.150%. An expanding project pipeline, plans to add a third Intellectual property rights (IP), and potential tie-ups with strategic investors like CMC Holdings are catalysts.
Our TP of S$1.26 is based on peer average PE valuation of 17x FY17F earnings, which implies upside of c.40%. 3) Courts Asia [COURTS SP, TP S$0.51]
Courts' store network expansion plans in Indonesia and Malaysia are progressing well, and will benefit from the expected acceleration in GDP growth and consumer sentiment recovery regionally in 2017. Coupled with effective cost controls and sustainable improvement in margins, Courts is on track to post earnings growth of 30% y-o-y. Valuation is compelling at 8x FY18F PE (near -0.5SD of its historical forward PE valuation) and 0.7x FY18F P/B. The stock also offers dividend yield of c.3.9% for FY17F. Given current valuations and that major shareholder, Singapore Retail Group, currently owns about 74.3% of Courts, we also see the company as a potential privatisation play. The outlay required to acquire the remaining shares does not seem excessive in our view (c.S$58m, and approximately 2.3x FY18F net profit level based on current share price).
Page 8
Market Focus
Small Mid Cap
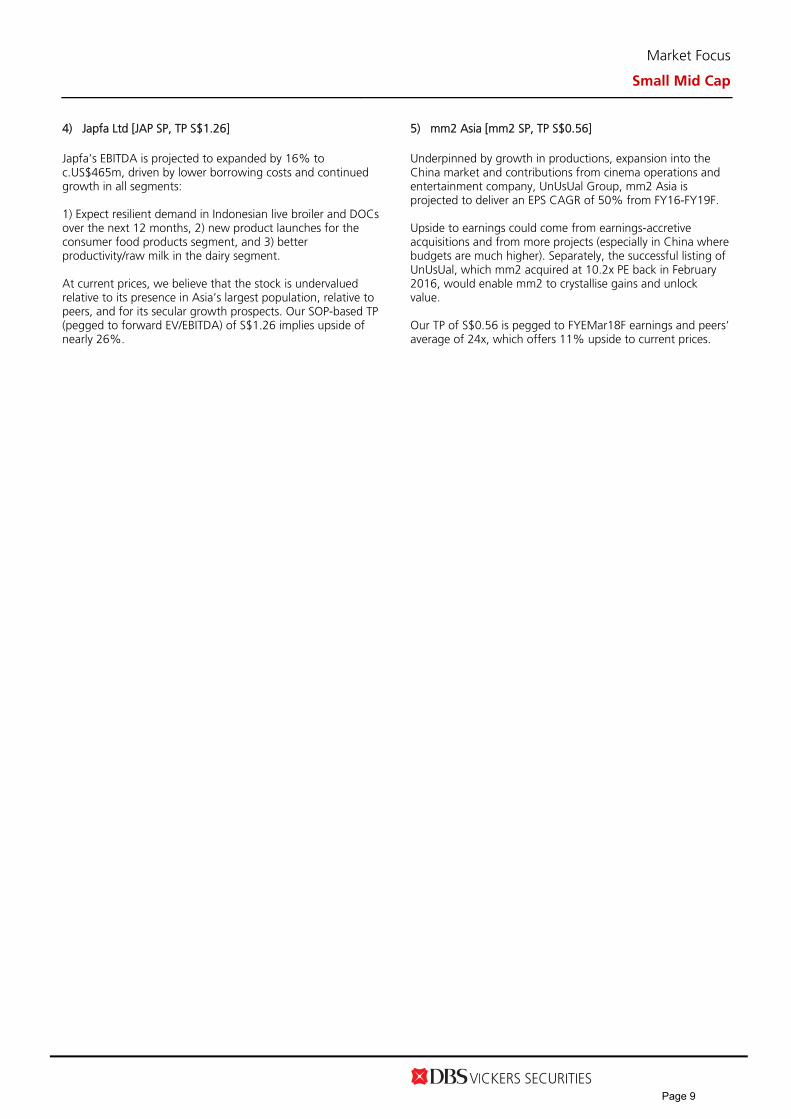
4) Japfa Ltd [JAP SP, TP S$1.26]
Japfa’s EBITDA is projected to expanded by 16% to c.US$465m, driven by lower borrowing costs and continued growth in all segments: 1) Expect resilient demand in Indonesian live broiler and DOCs over the next 12 months, 2) new product launches for the consumer food products segment, and 3) better productivity/raw milk in the dairy segment. At current prices, we believe that the stock is undervalued relative to its presence in Asia’s largest population, relative to peers, and for its secular growth prospects. Our SOP-based TP (pegged to forward EV/EBITDA) of S$1.26 implies upside of nearly 26%.
5) mm2 Asia [mm2 SP, TP S$0.56]
Underpinned by growth in productions, expansion into the China market and contributions from cinema operations and entertainment company, UnUsUal Group, mm2 Asia is projected to deliver an EPS CAGR of 50% from FY16-FY19F. Upside to earnings could come from earnings-accretive acquisitions and from more projects (especially in China where budgets are much higher). Separately, the successful listing of UnUsUal, which mm2 acquired at 10.2x PE back in February 2016, would enable mm2 to crystallise gains and unlock value. Our TP of S$0.56 is pegged to FYEMar18F earnings and peers’ average of 24x, which offers 11% upside to current prices.
Page 9
Market Focus
Small Mid Cap
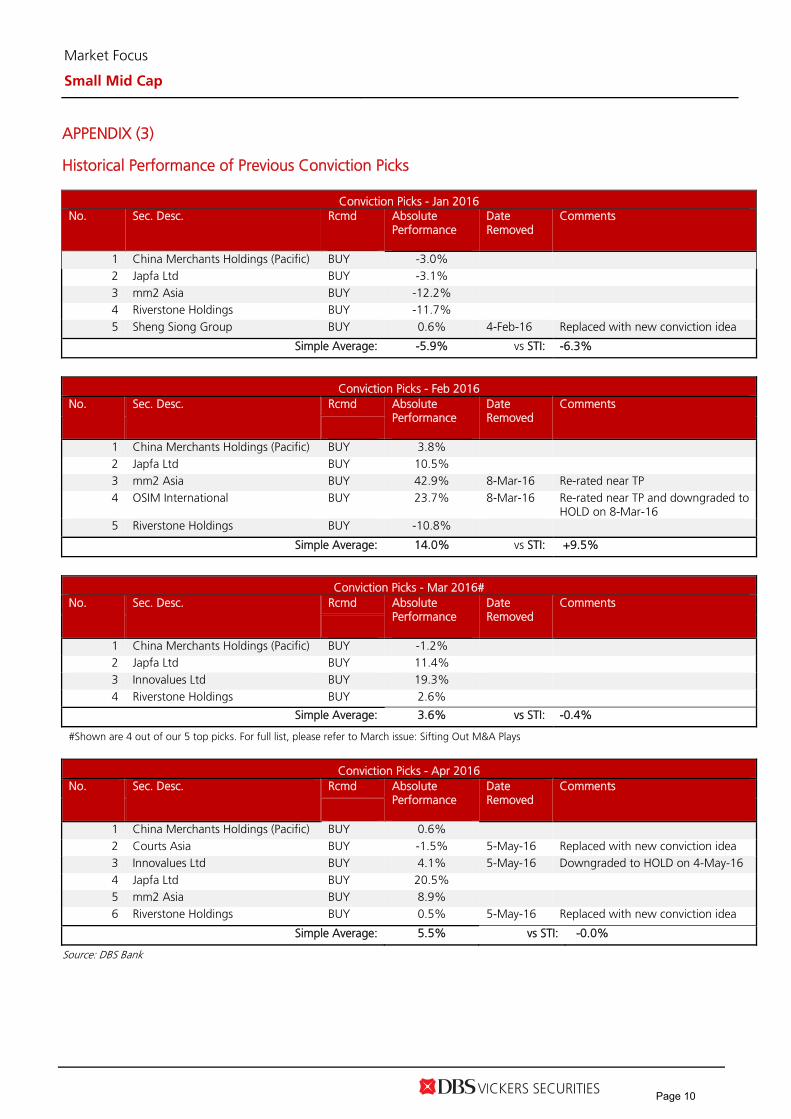
APPENDIX (3) Historical Performance of Previous Conviction Picks
Conviction Picks - Jan 2016 No. Sec. Desc. Rcmd Absolute
Performance
Date Removed
Comments
1 China Merchants Holdings (Pacific) BUY -3.0% 2 Japfa Ltd BUY -3.1% 3 mm2 Asia BUY -12.2% 4 Riverstone Holdings BUY -11.7% 5 Sheng Siong Group BUY 0.6% 4-Feb-16 Replaced with new conviction idea
Simple Average: -5.9% vs STI: -6.3%
Conviction Picks - Feb 2016 No. Sec. Desc. Rcmd Absolute
Performance
Date Removed
Comments
1 China Merchants Holdings (Pacific) BUY 3.8% 2 Japfa Ltd BUY 10.5% 3 mm2 Asia BUY 42.9% 8-Mar-16 Re-rated near TP 4 OSIM International BUY 23.7% 8-Mar-16 Re-rated near TP and downgraded to
HOLD on 8-Mar-16 5 Riverstone Holdings BUY -10.8%
Simple Average: 14.0% vs STI: +9.5%
Conviction Picks - Mar 2016# No. Sec. Desc. Rcmd Absolute
Performance
Date Removed
Comments
1 China Merchants Holdings (Pacific) BUY -1.2% 2 Japfa Ltd BUY 11.4% 3 Innovalues Ltd BUY 19.3% 4 Riverstone Holdings BUY 2.6%
Simple Average: 3.6% vs STI: -0.4%
#Shown are 4 out of our 5 top picks. For full list, please refer to March issue: Sifting Out M&A Plays
Conviction Picks - Apr 2016 No. Sec. Desc. Rcmd Absolute
Performance
Date Removed
Comments
1 China Merchants Holdings (Pacific) BUY 0.6% 2 Courts Asia BUY -1.5% 5-May-16 Replaced with new conviction idea 3 Innovalues Ltd BUY 4.1% 5-May-16 Downgraded to HOLD on 4-May-16 4 Japfa Ltd BUY 20.5% 5 mm2 Asia BUY 8.9% 6 Riverstone Holdings BUY 0.5% 5-May-16 Replaced with new conviction idea
Simple Average: 5.5% vs STI: -0.0%
Source: DBS Bank
Page 10
Market Focus
Small Mid Cap
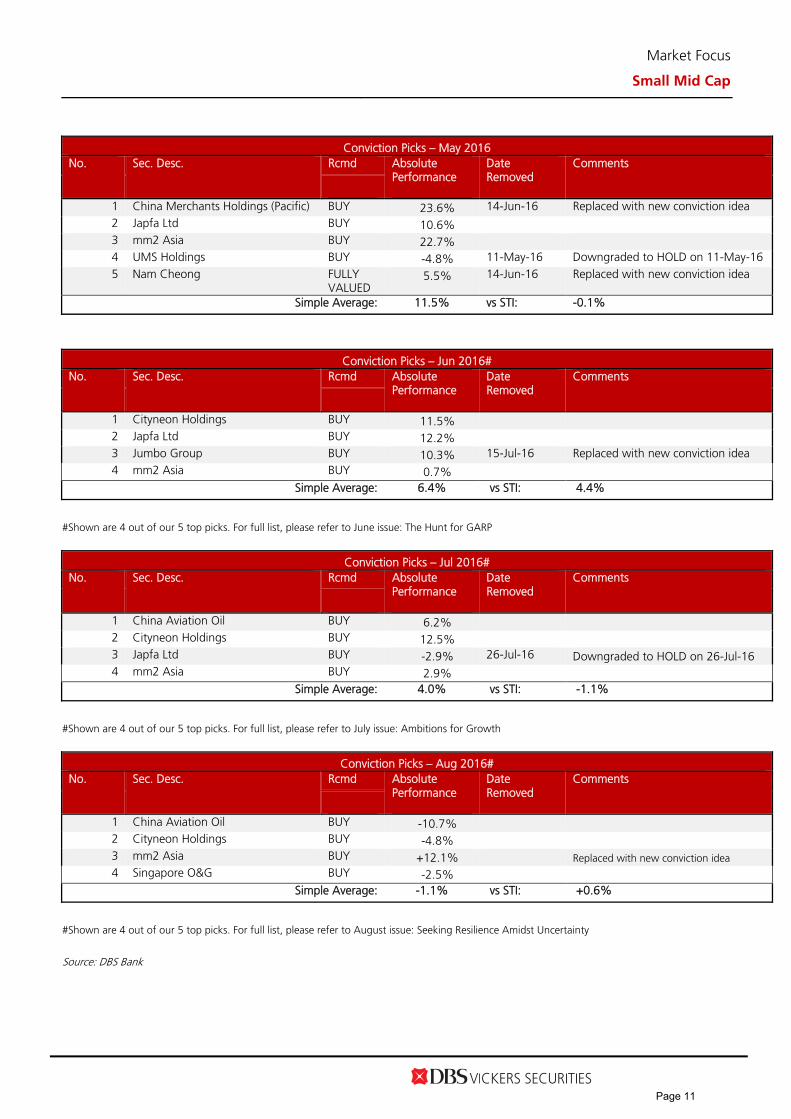
Conviction Picks – May 2016
No. Sec. Desc. Rcmd Absolute Performance
Date Removed
Comments
1 China Merchants Holdings (Pacific) BUY 23.6% 14-Jun-16 Replaced with new conviction idea 2 Japfa Ltd BUY 10.6% 3 mm2 Asia BUY 22.7% 4 UMS Holdings BUY -4.8% 11-May-16 Downgraded to HOLD on 11-May-16 5 Nam Cheong FULLY
VALUED 5.5% 14-Jun-16 Replaced with new conviction idea
Simple Average: 11.5% vs STI: -0.1%
Conviction Picks – Jun 2016#
No. Sec. Desc. Rcmd Absolute Performance
Date Removed
Comments
1 Cityneon Holdings BUY 11.5% 2 Japfa Ltd BUY 12.2% 3 Jumbo Group BUY 10.3% 15-Jul-16 Replaced with new conviction idea 4 mm2 Asia BUY 0.7%
Simple Average: 6.4% vs STI: 4.4%
#Shown are 4 out of our 5 top picks. For full list, please refer to June issue: The Hunt for GARP
Conviction Picks – Jul 2016#
No. Sec. Desc. Rcmd Absolute Performance
Date Removed
Comments
1 China Aviation Oil BUY 6.2% 2 Cityneon Holdings BUY 12.5% 3 Japfa Ltd BUY -2.9% 26-Jul-16 Downgraded to HOLD on 26-Jul-16 4 mm2 Asia BUY 2.9%
Simple Average: 4.0% vs STI: -1.1%
#Shown are 4 out of our 5 top picks. For full list, please refer to July issue: Ambitions for Growth
Conviction Picks – Aug 2016#
No. Sec. Desc. Rcmd Absolute Performance
Date Removed
Comments
1 China Aviation Oil BUY -10.7% 2 Cityneon Holdings BUY -4.8% 3 mm2 Asia BUY +12.1% Replaced with new conviction idea 4 Singapore O&G BUY -2.5%
Simple Average: -1.1% vs STI: +0.6%
#Shown are 4 out of our 5 top picks. For full list, please refer to August issue: Seeking Resilience Amidst Uncertainty
Source: DBS Bank
Page 11

Market Focus
Small Mid Cap
Conviction Picks – Sep 2016# No. Sec. Desc. Rcmd Absolute
Performance
Date Removed
Comments
1 China Aviation Oil BUY +0.0% 2 Cityneon Holdings BUY - 3.0% 3 Katrina Group BUY +0.0% 4 Singapore O&G BUY +2.2%
Simple Average: -0.5% vs STI: -0.4%
#Shown are 4 out of our 5 top picks. For full list, please refer to September issue: Safety First as Dark Clouds Gather
Conviction Picks – Oct 2016#
No. Sec. Desc. Rcmd Absolute Performance
Date Removed
Comments
1 China Aviation Oil BUY -3.3% 2 Cityneon Holdings BUY +15.7% 3 Katrina Group BUY -25.4% 4 Singapore O&G BUY -1.3%
Simple Average: -4.9% vs STI: -2.4%
#Shown are 4 out of our 5 top picks. For full list, please refer to October issue: Eye$ on the money
Conviction Picks – Nov 2016
No. Sec. Desc. Rcmd Absolute Performance
Date Removed
Comments
1 China Aviation Oil BUY +4.9% 2 Cityneon Holdings BUY -5.0% 3 CNMC Goldmine BUY -9.5% 4 Katrina Group BUY -6.4% 5 Singapore O&G BUY -0.0%
Simple Average: -3.2% vs STI: +5.2%
Conviction Picks – Dec 2016 No. Sec. Desc. Rcmd Absolute
Performance
Date Removed
Comments
1 China Aviation Oil BUY +10.4% 18-Jan-17 Replaced with new conviction idea 2 Cityneon Holdings BUY -11.0% TP lowered from S$1.37 to S$1.26 on 29
Dec 2016 3 CNMC Goldmine BUY - 4 mm2 Asia BUY +13.4% 5 Singapore O&G BUY +3.0% 18-Jan-17 Replaced with new conviction idea
Simple Average: +3.2% vs STI: +1.8%
Source: DBS Bank
Page 12
Market Focus
Small Mid Cap
Conviction Picks – Jan 2017
No. Sec. Desc. Rcmd Absolute Performance
Date Removed
Comments
1 Cityneon Holdings BUY - 2.2% 2 CNMC Goldmine BUY -7.0% 3 Ezion BUY -7.3% 4 Japfa BUY +5.4% 5 mm2 Asia BUY +8.6%
Simple Average: -0.5% vs STI: +2.8%
Source: DBS Bank
Page 13

Market Focus
Small Mid Cap
APPENDIX (4) FSTS & FSTM Indices in January 2017
Top 5 Performing Sectors - FSTM Top 5 Performing Sectors - FSTS
ICB Sector No. of
Constituents
Net Market
Cap % Chg
ICB Sector No. of
Constituents
Net Market
Cap % Chg
(S$ m) (1m) (S$ m) (1m)
Construction & Materials 1 1,306 10.6
Personal Goods 1 253 36.6
Software & Compurer Services
1 464 9.4
Chemicals 1 262 14.8
Oil Equipment, Services & Distribution
1 1,239 8.0
Mining 1 155 13.3
Real Estate Investment Trusts
3 4,607 6.5
Industrial Metals & Mining
1 294 7.0
Industrial Transportation
3 6,216 5.0
Travel & Leisure
1 530 6.4
Bottom 5 Performing Sectors – FSTM Bottom 5 Performing Sectors - FSTS
ICB Sector No. of
Constituents
Net Market
Cap % Chg
ICB Sector No. of
Constituents
Net Market
Cap % Chg
(S$ m) (1m) (S$ m) (1m)
Industrial Engineering
1 1,668 (1.2) Media 1 79 (9.4)
Food Producers
3 3,898 (0.7) Software & Computer Services
1 24 (7.5)
Gas,Water & Multiutilities
3 1,715 0.3 Food & Drug Retailers
1 294 (2.0)
General Industrials
1 1,520 0.6 Technology Hardware & Equipment
1 185 (1.9)
Travel & Leisure
3 1,757 0.8 Travel & Leisure
1 676 (1.6)
Source: DBS Bank, FTSE
Page 14
Market Focus
Small Mid Cap
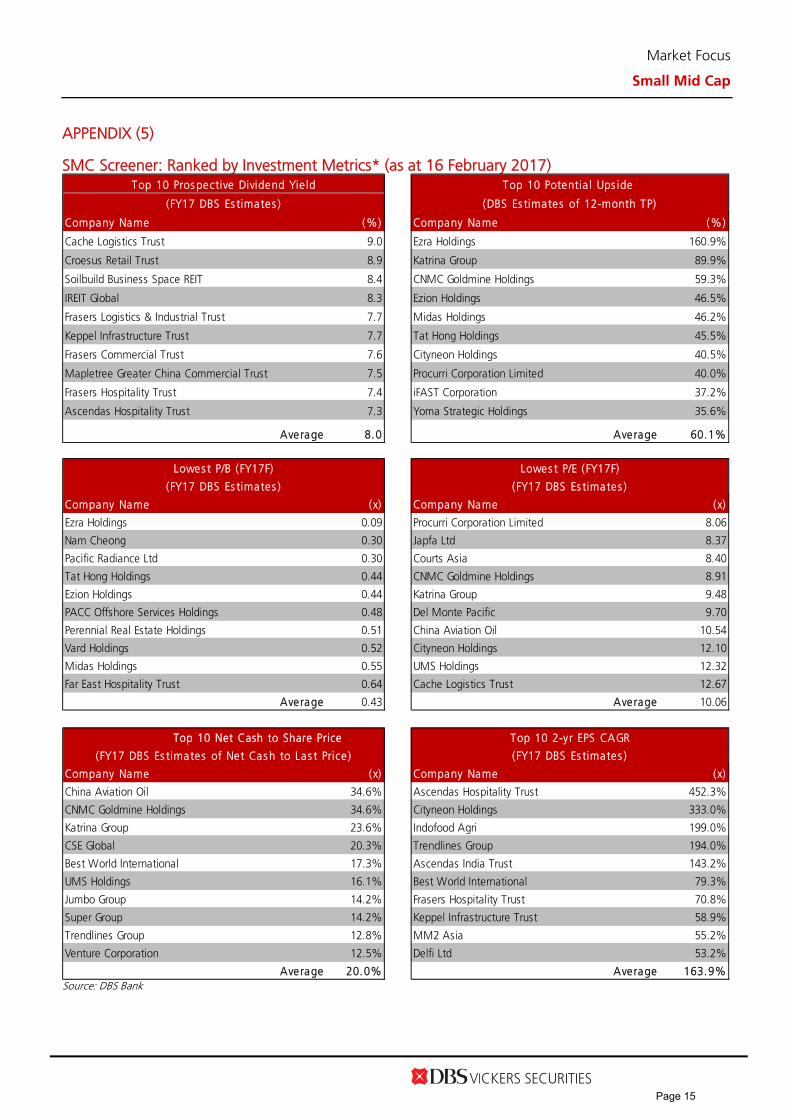
APPENDIX (5)
SMC Screener: Ranked by Investment Metrics* (as at 16 February 2017)
Company Name (%) Company Name (%)
Cache Logistics Trust 9.0 Ezra Holdings 160.9%
Croesus Retail Trust 8.9 Katrina Group 89.9%
Soilbuild Business Space REIT 8.4 CNMC Goldmine Holdings 59.3%
IREIT Global 8.3 Ezion Holdings 46.5%
Frasers Logistics & Industrial Trust 7.7 Midas Holdings 46.2%
Keppel Infrastructure Trust 7.7 Tat Hong Holdings 45.5%
Frasers Commercial Trust 7.6 Cityneon Holdings 40.5%
Mapletree Greater China Commercial Trust 7.5 Procurri Corporation Limited 40.0%
Frasers Hospitality Trust 7.4 iFAST Corporation 37.2%
Ascendas Hospitality Trust 7.3 Yoma Strategic Holdings 35.6%
Average 8.0 Average 60.1%
Company Name (x) Company Name (x)
Ezra Holdings 0.09 Procurri Corporation Limited 8.06
Nam Cheong 0.30 Japfa Ltd 8.37
Pacific Radiance Ltd 0.30 Courts Asia 8.40
Tat Hong Holdings 0.44 CNMC Goldmine Holdings 8.91
Ezion Holdings 0.44 Katrina Group 9.48
PACC Offshore Services Holdings 0.48 Del Monte Pacific 9.70
Perennial Real Estate Holdings 0.51 China Aviation Oil 10.54
Vard Holdings 0.52 Cityneon Holdings 12.10
Midas Holdings 0.55 UMS Holdings 12.32
Far East Hospitality Trust 0.64 Cache Logistics Trust 12.67
Average 0.43 Average 10.06
Company Name (x) Company Name (x)
China Aviation Oil 34.6% Ascendas Hospitality Trust 452.3%
CNMC Goldmine Holdings 34.6% Cityneon Holdings 333.0%
Katrina Group 23.6% Indofood Agri 199.0%
CSE Global 20.3% Trendlines Group 194.0%
Best World International 17.3% Ascendas India Trust 143.2%
UMS Holdings 16.1% Best World International 79.3%
Jumbo Group 14.2% Frasers Hospitality Trust 70.8%
Super Group 14.2% Keppel Infrastructure Trust 58.9%
Trendlines Group 12.8% MM2 Asia 55.2%
Venture Corporation 12.5% Delfi Ltd 53.2%
Average 20.0% Average 163.9%
(FY17 DBS Es timates )
Top 10 Net Cash to Share Price Top 10 2-yr EPS CAGR
(FY17 DBS Es timates ) (DBS Es timates of 12-month TP)
(FY17 DBS Es timates ) (FY17 DBS Es timates )
(FY17 DBS Es timates of Net Cas h to Las t Price )
Top 10 Pros pective Dividend Yie ld Top 10 Potentia l Ups ide
Lowes t P/B (FY17F) Lowes t P/E (FY17F)
Source: DBS Bank
Page 15
Market Focus
Small Mid Cap
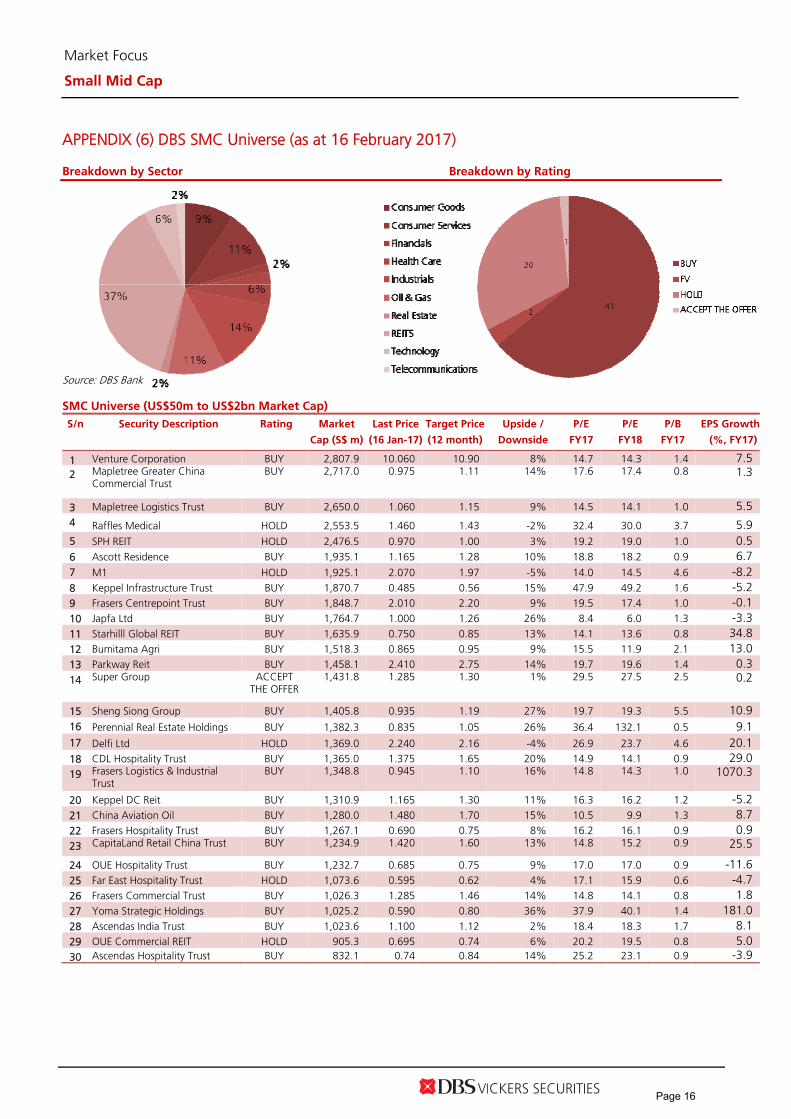
APPENDIX (6) DBS SMC Universe (as at 16 February 2017) Breakdown by Sector Breakdown by Rating
Source: DBS Bank
SMC Universe (US$50m to US$2bn Market Cap)
S/n Security Description Rating Market
Cap (S$ m)
Last Price
(16 Jan-17)
Target Price
(12 month)
Upside /
Downside
P/E
FY17
P/E
FY18
P/B
FY17
EPS Growth
(%, FY17)
1 Venture Corporation BUY 2,807.9 10.060 10.90 8% 14.7 14.3 1.4 7.5 2 Mapletree Greater China
Commercial Trust BUY 2,717.0 0.975 1.11 14% 17.6 17.4 0.8 1.3
3 Mapletree Logistics Trust BUY 2,650.0 1.060 1.15 9% 14.5 14.1 1.0 5.5 4 Raffles Medical HOLD 2,553.5 1.460 1.43 -2% 32.4 30.0 3.7 5.9 5 SPH REIT HOLD 2,476.5 0.970 1.00 3% 19.2 19.0 1.0 0.5 6 Ascott Residence BUY 1,935.1 1.165 1.28 10% 18.8 18.2 0.9 6.7 7 M1 HOLD 1,925.1 2.070 1.97 -5% 14.0 14.5 4.6 -8.2 8 Keppel Infrastructure Trust BUY 1,870.7 0.485 0.56 15% 47.9 49.2 1.6 -5.2 9 Frasers Centrepoint Trust BUY 1,848.7 2.010 2.20 9% 19.5 17.4 1.0 -0.1 10 Japfa Ltd BUY 1,764.7 1.000 1.26 26% 8.4 6.0 1.3 -3.3 11 Starhilll Global REIT BUY 1,635.9 0.750 0.85 13% 14.1 13.6 0.8 34.8 12 Bumitama Agri BUY 1,518.3 0.865 0.95 9% 15.5 11.9 2.1 13.0 13 Parkway Reit BUY 1,458.1 2.410 2.75 14% 19.7 19.6 1.4 0.3 14 Super Group ACCEPT
THE OFFER 1,431.8 1.285 1.30 1% 29.5 27.5 2.5 0.2
15 Sheng Siong Group BUY 1,405.8 0.935 1.19 27% 19.7 19.3 5.5 10.9 16 Perennial Real Estate Holdings BUY 1,382.3 0.835 1.05 26% 36.4 132.1 0.5 9.1 17 Delfi Ltd HOLD 1,369.0 2.240 2.16 -4% 26.9 23.7 4.6 20.1 18 CDL Hospitality Trust BUY 1,365.0 1.375 1.65 20% 14.9 14.1 0.9 29.0 19 Frasers Logistics & Industrial
Trust BUY 1,348.8 0.945 1.10 16% 14.8 14.3 1.0 1070.3
20 Keppel DC Reit BUY 1,310.9 1.165 1.30 11% 16.3 16.2 1.2 -5.2 21 China Aviation Oil BUY 1,280.0 1.480 1.70 15% 10.5 9.9 1.3 8.7 22 Frasers Hospitality Trust BUY 1,267.1 0.690 0.75 8% 16.2 16.1 0.9 0.9 23 CapitaLand Retail China Trust BUY 1,234.9 1.420 1.60 13% 14.8 15.2 0.9 25.5
24 OUE Hospitality Trust BUY 1,232.7 0.685 0.75 9% 17.0 17.0 0.9 -11.6 25 Far East Hospitality Trust HOLD 1,073.6 0.595 0.62 4% 17.1 15.9 0.6 -4.7 26 Frasers Commercial Trust BUY 1,026.3 1.285 1.46 14% 14.8 14.1 0.8 1.8 27 Yoma Strategic Holdings BUY 1,025.2 0.590 0.80 36% 37.9 40.1 1.4 181.0 28 Ascendas India Trust BUY 1,023.6 1.100 1.12 2% 18.4 18.3 1.7 8.1 29 OUE Commercial REIT HOLD 905.3 0.695 0.74 6% 20.2 19.5 0.8 5.0 30 Ascendas Hospitality Trust BUY 832.1 0.74 0.84 14% 25.2 23.1 0.9 -3.9
Page 16
Market Focus
Small Mid Cap
SMC Universe (US$50m to US$2bn Market Cap)
S/n Security Description Rating Market
Cap (S$ m)
Last Price
(16 Jan-17)
Target Price
(12 month)
Upside /
Downside
P/E
FY17
P/E
FY18
P/B
FY17
EPS Growth
(%, FY17)
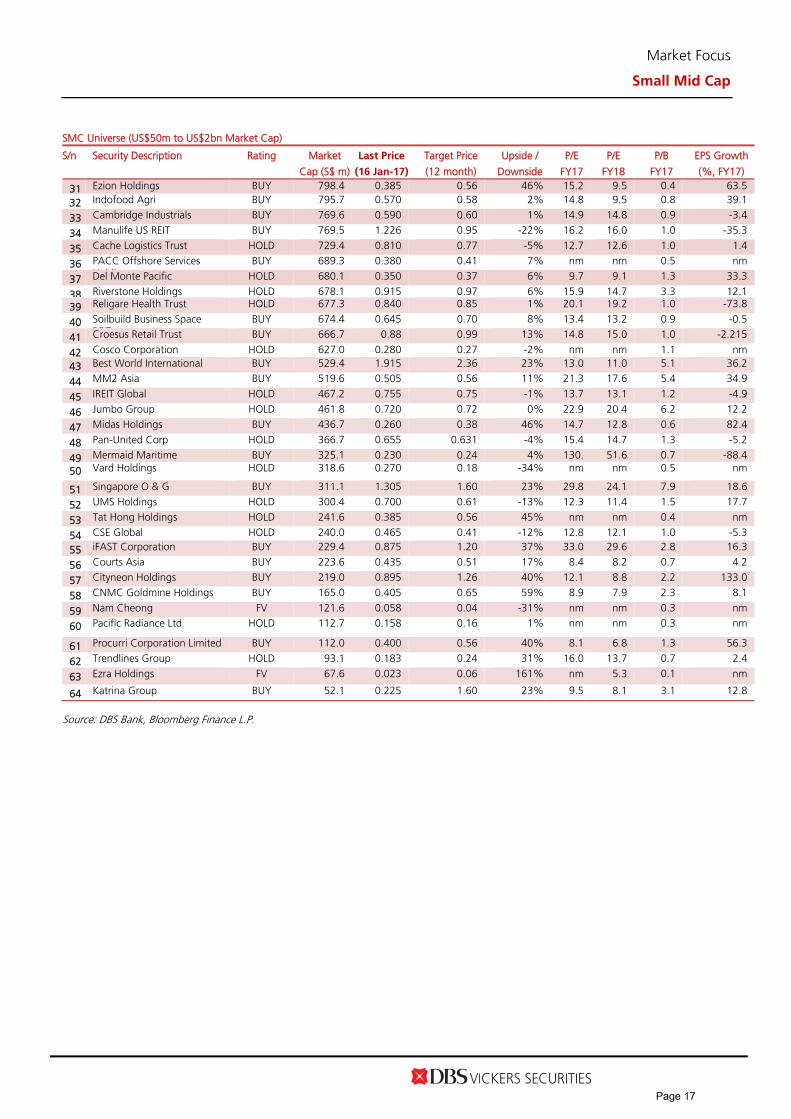
31 Ezion Holdings BUY 798.4 0.385 0.56 46% 15.2 9.5 0.4 63.5
32 Indofood Agri BUY 795.7 0.570 0.58 2% 14.8 9.5 0.8 39.1
33 Cambridge Industrials BUY 769.6 0.590 0.60 1% 14.9 14.8 0.9 -3.4
34 Manulife US REIT BUY 769.5 1.226 0.95 -22% 16.2 16.0 1.0 -35.3
35 Cache Logistics Trust HOLD 729.4 0.810 0.77 -5% 12.7 12.6 1.0 1.4
36 PACC Offshore Services H ldi
BUY 689.3 0.380 0.41 7% nm nm 0.5 nm
37 Del Monte Pacific HOLD 680.1 0.350 0.37 6% 9.7 9.1 1.3 33.3
38 Riverstone Holdings HOLD 678.1 0.915 0.97 6% 15.9 14.7 3.3 12.1
39 Religare Health Trust HOLD 677.3 0.840 0.85 1% 20.1 19.2 1.0 -73.8
40 Soilbuild Business Space REIT
BUY 674.4 0.645 0.70 8% 13.4 13.2 0.9 -0.5
41 Croesus Retail Trust BUY 666.7 0.88 0.99 13% 14.8 15.0 1.0 -2.215
42 Cosco Corporation HOLD 627.0 0.280 0.27 -2% nm nm 1.1 nm
43 Best World International BUY 529.4 1.915 2.36 23% 13.0 11.0 5.1 36.2
44 MM2 Asia BUY 519.6 0.505 0.56 11% 21.3 17.6 5.4 34.9
45 IREIT Global HOLD 467.2 0.755 0.75 -1% 13.7 13.1 1.2 -4.9
46 Jumbo Group HOLD 461.8 0.720 0.72 0% 22.9 20.4 6.2 12.2
47 Midas Holdings BUY 436.7 0.260 0.38 46% 14.7 12.8 0.6 82.4
48 Pan-United Corp HOLD 366.7 0.655 0.631 -4% 15.4 14.7 1.3 -5.2
49 Mermaid Maritime BUY 325.1 0.230 0.24 4% 130. 51.6 0.7 -88.4
50 Vard Holdings HOLD 318.6 0.270 0.18 -34% nm nm 0.5 nm
51 Singapore O & G BUY 311.1 1.305 1.60 23% 29.8 24.1 7.9 18.6
52 UMS Holdings HOLD 300.4 0.700 0.61 -13% 12.3 11.4 1.5 17.7
53 Tat Hong Holdings HOLD 241.6 0.385 0.56 45% nm nm 0.4 nm
54 CSE Global HOLD 240.0 0.465 0.41 -12% 12.8 12.1 1.0 -5.3
55 iFAST Corporation BUY 229.4 0.875 1.20 37% 33.0 29.6 2.8 16.3
56 Courts Asia BUY 223.6 0.435 0.51 17% 8.4 8.2 0.7 4.2
57 Cityneon Holdings BUY 219.0 0.895 1.26 40% 12.1 8.8 2.2 133.0
58 CNMC Goldmine Holdings BUY 165.0 0.405 0.65 59% 8.9 7.9 2.3 8.1
59 Nam Cheong FV 121.6 0.058 0.04 -31% nm nm 0.3 nm
60 Pacific Radiance Ltd HOLD 112.7 0.158 0.16 1% nm nm 0.3 nm
61 Procurri Corporation Limited BUY 112.0 0.400 0.56 40% 8.1 6.8 1.3 56.3
62 Trendlines Group HOLD 93.1 0.183 0.24 31% 16.0 13.7 0.7 2.4
63 Ezra Holdings FV 67.6 0.023 0.06 161% nm 5.3 0.1 nm
64 Katrina Group BUY 52.1 0.225 1.60 23% 9.5 8.1 3.1 12.8
Source: DBS Bank, Bloomberg Finance L.P.
Page 17

Market Focus
Small Mid Cap
COMPANY GUIDES
Page 18

ASIAN INSIGHTS VICKERS SECURITIES ed: TH / JC, PY
BUY (Initiating Coverage) Last Traded Price ( 31 Jan 2017): S$1.83 (STI : 3,046.80) Price Target 12-mth: S$2.36 (29% upside) Potential Catalyst: Earnings delivery, successful expansion into new markets, and M&A Analyst
Paul YONG CFA +65 6682 3712 [email protected] Singapore Research Team [email protected]
Price Relative
Forecasts and Valuation FY Dec (S$m) 2015A 2016F 2017F 2018F Revenue 102 207 269 311 EBITDA 19.5 46.1 62.1 73.1 Pre-tax Profit 17.0 43.5 59.3 70.3 Net Profit 10.1 29.8 40.6 48.0 Net Pft (Pre Ex.) 10.1 29.8 40.6 48.0 EPS (S cts) 4.59 10.8 14.7 17.4 EPS Pre Ex. (S cts) 4.59 10.8 14.7 17.4 EPS Gth (%) 146 136 36 18 EPS Gth Pre Ex (%) 146 136 36 18 Diluted EPS (S cts) 4.59 10.8 14.7 17.4 Net DPS (S cts) 2.00 4.72 6.43 7.61 BV Per Share (S cts) 28.9 29.3 37.6 47.4 PE (X) 39.9 16.9 12.4 10.5 PE Pre Ex. (X) 39.9 16.9 12.4 10.5 P/Cash Flow (X) 23.6 14.7 8.7 9.2 EV/EBITDA (X) 18.1 9.6 6.6 5.2 Net Div Yield (%) 1.1 2.6 3.5 4.2 P/Book Value (X) 6.3 6.3 4.9 3.9 Net Debt/Equity (X) CASH CASH CASH CASH ROAE (%) 16.8 41.3 44.1 41.1 Consensus EPS (S cts): 11.3 14.3 17.3 Other Broker Recs: B: 3 S: 0 H: 0 ICB Industry : Consumer Services ICB Sector: General Retailers Principal Business: Best World International (BEST SP) is the only direct selling company to be listed on the SGX. A regional player with a presence in 12 markets, Best World is primarily engaged in the development, manufacture and distribution of personal care and wellness products (including premium skincare, health supplements and other nutritional products). Source of all data on this page: Company, DBS Bank, Bloomberg Finance L.P.
At A Glance Issued Capital (m shrs) 276 Mkt. Cap (S$m/US$m) 506 / 359 Major Shareholders (%) D2 Investment Pte Ltd 34.9 Beng Mui Hoan 5.6 Moi Tan Nee 5.6
Free Float (%) 45.2 3m Avg. Daily Val (US$m) 1.9
DBS Group Research . Equity 1 Feb 2017
Singapore Company Focus
Best World International Bloomberg: BEST SP | Reuters: BEST.SI Refer to important disclosures at the end of this report
Buckling down China Direct seller of premium skincare has made a breakthrough in
Taiwan, where it has strong earnings momentum China, a market over 50x larger than Taiwan, is ripe for Best World
to harvest Attainment of a rare direct selling licence in China should underpin
years of firm growth Initiate with BUY, TP of $2.36 based on 16x FY17F PE
Singapore-based direct seller enjoying great success in Taiwan. Best World’s flagship Dr’s Secret range of premium skincare, which represents nearly 70% of the group’s sales, has been immensely successful in Taiwan. Currently Best World’s largest market by revenue, operations in Taiwan have already achieved a decent scale but still hold more potential. Looking ahead, strong earnings momentum will likely be sustained by further cultivation of existing networks in its stronghold in Central and Southern Taiwan, and plans to leapfrog into the Northern region.
Attainment of a direct selling licence in China, a market over 50x larger than Taiwan, should underpin years of firm growth. Best World hopes to emulate its success in China, where the cosmetics sector is forecasted to grow at 12.9% CAGR into 2019. With much of the groundwork already laid in the PRC, MOFCOM’s indirect endorsement through the recent award of its rare direct selling licence provides Best World with the credibility and platform needed to gain scale in the world’s most populous nation and second-largest direct selling market. Stronger participation rates at Best World’s post-licence recruitment events also confirm this.
Riding on highly scalable model to deliver 68% PATMI CAGR over FY15-18F. Compared to traditional retailers, Best World’s advantage lies in its highly scalable model (with lower fixed costs). Supported by greater scale economies, we project PATMI to rise quickly from S$10.1m in FY15 to S$48m by FY18F as the group further extends its reach in its key markets of Taiwan and China.
Valuation: Initiate with BUY; TP of S$2.36 is based on 16x FY17F PE. As Best World enters into a period of firm growth, we opine that it should trade at 16x FY17F earnings (at a smaller discount to global peers’ 19x). In addition, Best World’s PEG ratio of 0.4 is among the lowest in its peer group, which provides further upside.
Key Risks to Our View: Key risks include lack of control over individual distributor’s selling process and impact of unanticipated changes in local regulations and restrictions.
72
272
472
672
872
1072
0.1
0.3
0.5
0.7
0.9
1.1
1.3
1.5
1.7
1.9
Jan-13 Jan-14 Jan-15 Jan-16 Jan-17
Relative IndexS$
Best World International (LHS) Relative STI (RHS)
Page 19
ASIAN INSIGHTS VICKERS SECURITIES Page 2
Company Focus
Best World International
INVESTMENT THESIS
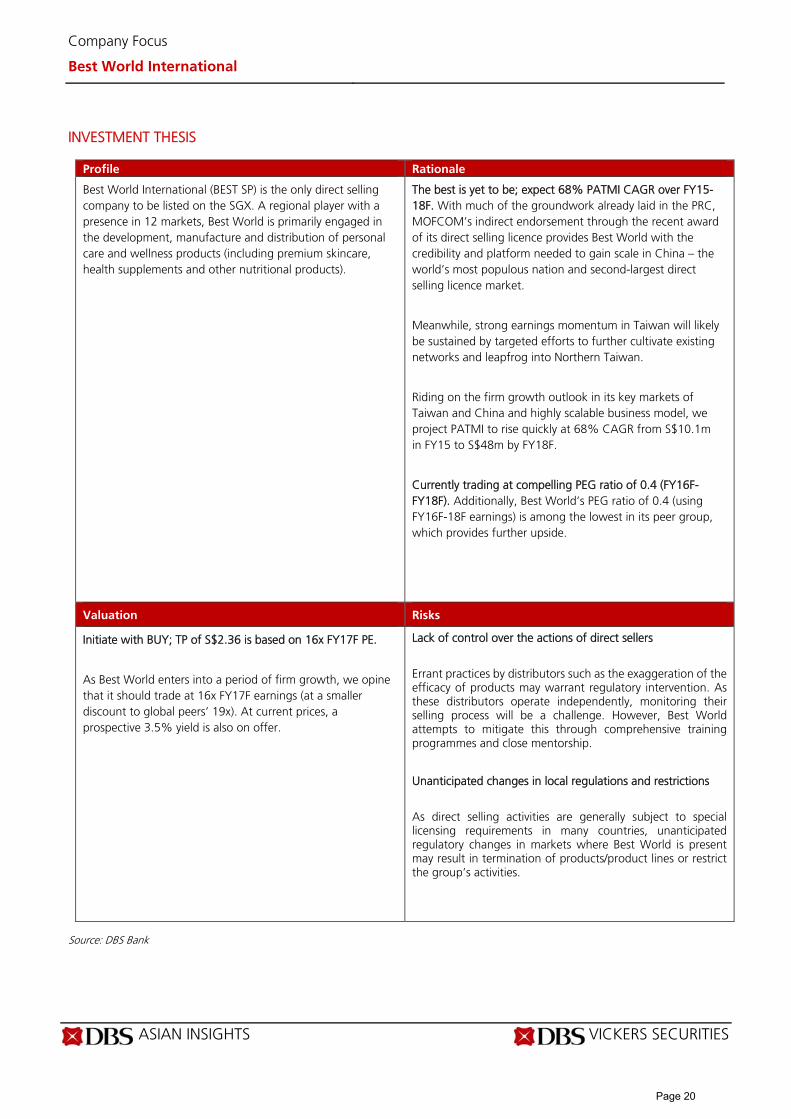
Profile Rationale
Best World International (BEST SP) is the only direct selling company to be listed on the SGX. A regional player with a presence in 12 markets, Best World is primarily engaged in the development, manufacture and distribution of personal care and wellness products (including premium skincare, health supplements and other nutritional products).
The best is yet to be; expect 68% PATMI CAGR over FY15-18F. With much of the groundwork already laid in the PRC, MOFCOM’s indirect endorsement through the recent award of its direct selling licence provides Best World with the credibility and platform needed to gain scale in China – the world’s most populous nation and second-largest direct selling licence market.
Meanwhile, strong earnings momentum in Taiwan will likely be sustained by targeted efforts to further cultivate existing networks and leapfrog into Northern Taiwan.
Riding on the firm growth outlook in its key markets of Taiwan and China and highly scalable business model, we project PATMI to rise quickly at 68% CAGR from S$10.1m in FY15 to S$48m by FY18F.
Currently trading at compelling PEG ratio of 0.4 (FY16F-FY18F). Additionally, Best World’s PEG ratio of 0.4 (using FY16F-18F earnings) is among the lowest in its peer group, which provides further upside.
Valuation Risks
Initiate with BUY; TP of S$2.36 is based on 16x FY17F PE.
As Best World enters into a period of firm growth, we opine that it should trade at 16x FY17F earnings (at a smaller discount to global peers’ 19x). At current prices, a prospective 3.5% yield is also on offer.
Lack of control over the actions of direct sellers
Errant practices by distributors such as the exaggeration of the efficacy of products may warrant regulatory intervention. As these distributors operate independently, monitoring their selling process will be a challenge. However, Best World attempts to mitigate this through comprehensive training programmes and close mentorship.
Unanticipated changes in local regulations and restrictions
As direct selling activities are generally subject to special licensing requirements in many countries, unanticipated regulatory changes in markets where Best World is present may result in termination of products/product lines or restrict the group’s activities.
Source: DBS Bank
Page 20
ASIAN INSIGHTS VICKERS SECURITIES Page 3
Company Focus
Best World International
SWOT Analysis
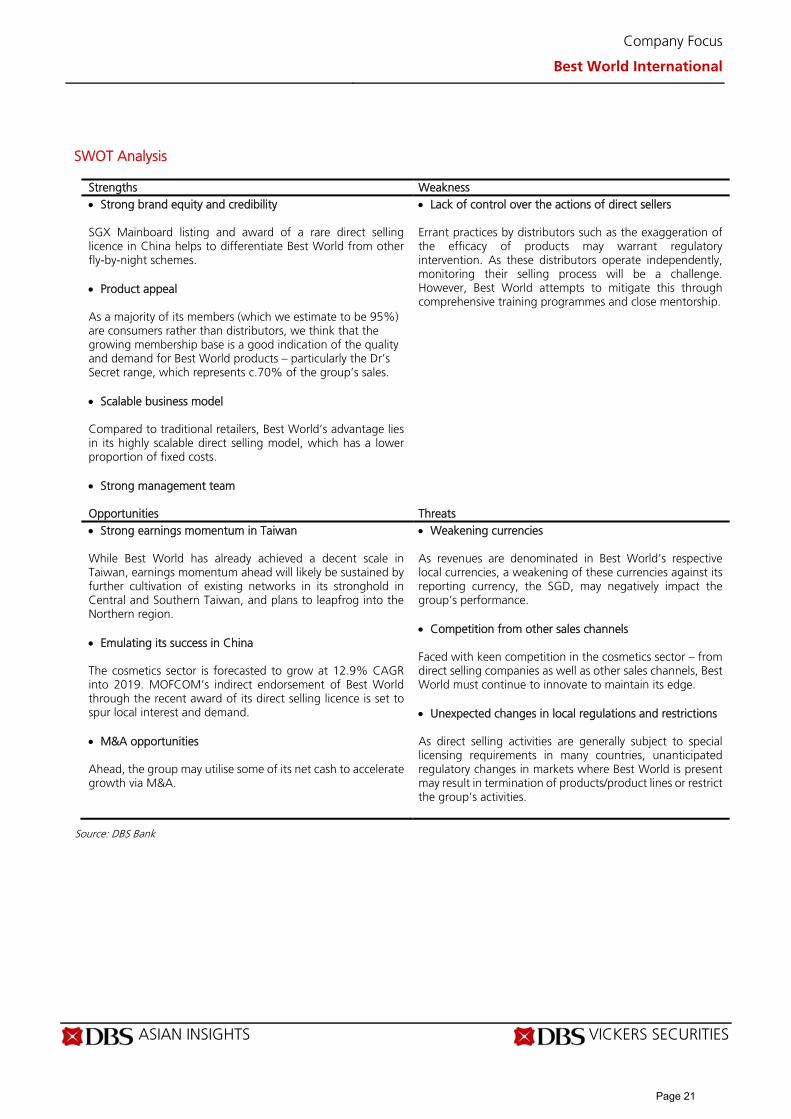
Strengths Weakness Strong brand equity and credibility SGX Mainboard listing and award of a rare direct selling licence in China helps to differentiate Best World from other fly-by-night schemes. Product appeal As a majority of its members (which we estimate to be 95%) are consumers rather than distributors, we think that the growing membership base is a good indication of the quality and demand for Best World products – particularly the Dr’s Secret range, which represents c.70% of the group’s sales. Scalable business model Compared to traditional retailers, Best World’s advantage lies in its highly scalable direct selling model, which has a lower proportion of fixed costs. Strong management team
Lack of control over the actions of direct sellers Errant practices by distributors such as the exaggeration of the efficacy of products may warrant regulatory intervention. As these distributors operate independently, monitoring their selling process will be a challenge. However, Best World attempts to mitigate this through comprehensive training programmes and close mentorship.
Opportunities Threats Strong earnings momentum in Taiwan While Best World has already achieved a decent scale in Taiwan, earnings momentum ahead will likely be sustained by further cultivation of existing networks in its stronghold in Central and Southern Taiwan, and plans to leapfrog into the Northern region. Emulating its success in China The cosmetics sector is forecasted to grow at 12.9% CAGR into 2019. MOFCOM’s indirect endorsement of Best World through the recent award of its direct selling licence is set to spur local interest and demand. M&A opportunities Ahead, the group may utilise some of its net cash to accelerate growth via M&A.
Weakening currencies As revenues are denominated in Best World’s respective local currencies, a weakening of these currencies against its reporting currency, the SGD, may negatively impact the group’s performance. Competition from other sales channels Faced with keen competition in the cosmetics sector – from direct selling companies as well as other sales channels, Best World must continue to innovate to maintain its edge. Unexpected changes in local regulations and restrictions As direct selling activities are generally subject to special licensing requirements in many countries, unanticipated regulatory changes in markets where Best World is present may result in termination of products/product lines or restrict the group’s activities.
Source: DBS Bank
Page 21
ASIAN INSIGHTS VICKERS SECURITIES Page 4
Company Focus
Best World International
Company background
First and only direct-selling company to be listed on the SGX. Founded in Singapore in 1990, Best World International Ltd (“Best World”) became the first direct-selling company to be listed on the SGX in July 2004. Best World is mainly focused on the development, manufacture, and distribution of personal care and wellness products (including premium skincare, health supplements and other nutritional products). Additionally, the group is also engaged in the manufacture and distribution of the Aurigen line of supplements through drugstores and retail outlets across all provinces in the PRC.
Emerged as a regional player with a sizeable member pool of nearly 430k and presence in 12 markets, and growing. With the establishment of its joint venture in Dubai in 2016, Best World further strengthened its regional presence to a total of 12 markets (including Myanmar) – with subsidiaries in Singapore, Thailand, Taiwan, the Philippines, Indonesia, Malaysia, Vietnam, Hong Kong, China, and Korea. Alongside regional expansion, membership has steadily expanded at 1.9% CAGR from 229.5k in FY10 to 402.4k in FY15, and a further 6.7% to 429.5k as at end-9M16.
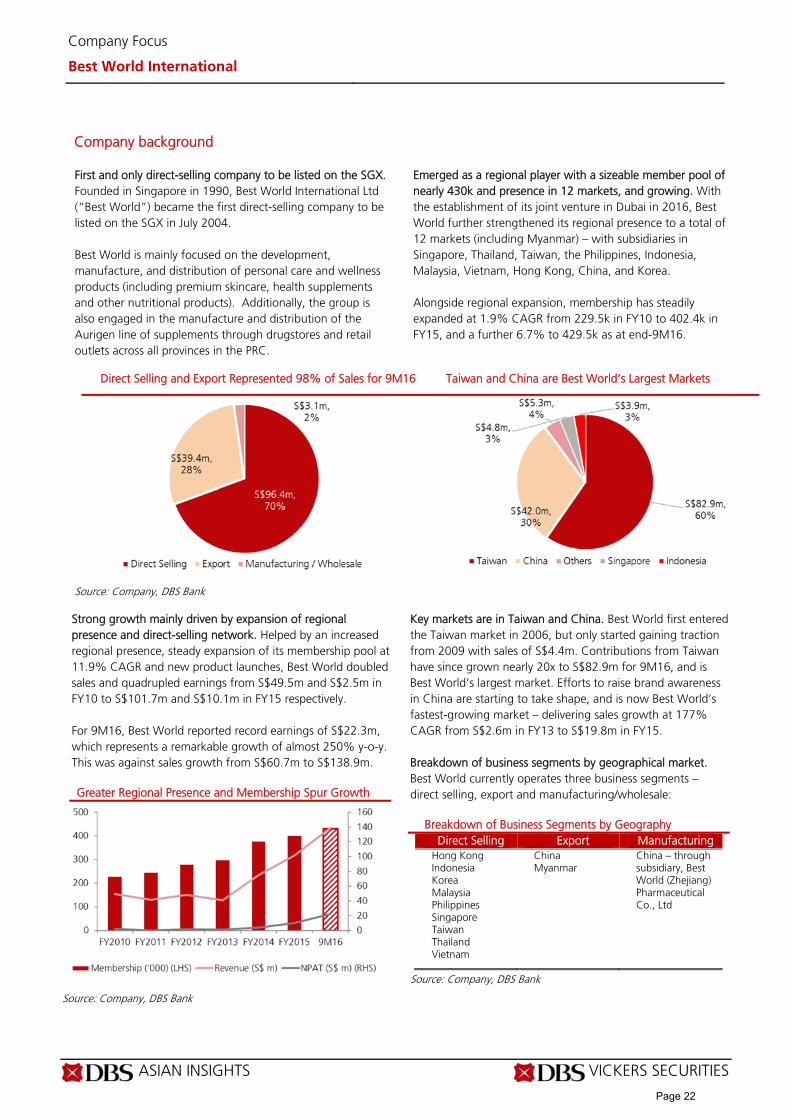
Direct Selling and Export Represented 98% of Sales for 9M16 Taiwan and China are Best World’s Largest Markets
Source: Company, DBS Bank Strong growth mainly driven by expansion of regional presence and direct-selling network. Helped by an increased regional presence, steady expansion of its membership pool at 11.9% CAGR and new product launches, Best World doubled sales and quadrupled earnings from S$49.5m and S$2.5m in FY10 to S$101.7m and S$10.1m in FY15 respectively. For 9M16, Best World reported record earnings of S$22.3m, which represents a remarkable growth of almost 250% y-o-y. This was against sales growth from S$60.7m to S$138.9m.
Greater Regional Presence and Membership Spur Growth
Source: Company, DBS Bank
Key markets are in Taiwan and China. Best World first entered the Taiwan market in 2006, but only started gaining traction from 2009 with sales of S$4.4m. Contributions from Taiwan have since grown nearly 20x to S$82.9m for 9M16, and is Best World’s largest market. Efforts to raise brand awareness in China are starting to take shape, and is now Best World’s fastest-growing market – delivering sales growth at 177% CAGR from S$2.6m in FY13 to S$19.8m in FY15. Breakdown of business segments by geographical market. Best World currently operates three business segments – direct selling, export and manufacturing/wholesale:
Breakdown of Business Segments by Geography Direct Selling Export Manufacturing
Hong Kong Indonesia Korea Malaysia Philippines Singapore Taiwan Thailand Vietnam
China Myanmar
China – through subsidiary, Best World (Zhejiang) Pharmaceutical Co., Ltd
Source: Company, DBS Bank
Page 22
ASIAN INSIGHTS VICKERS SECURITIES Page 5
Company Focus
Best World International
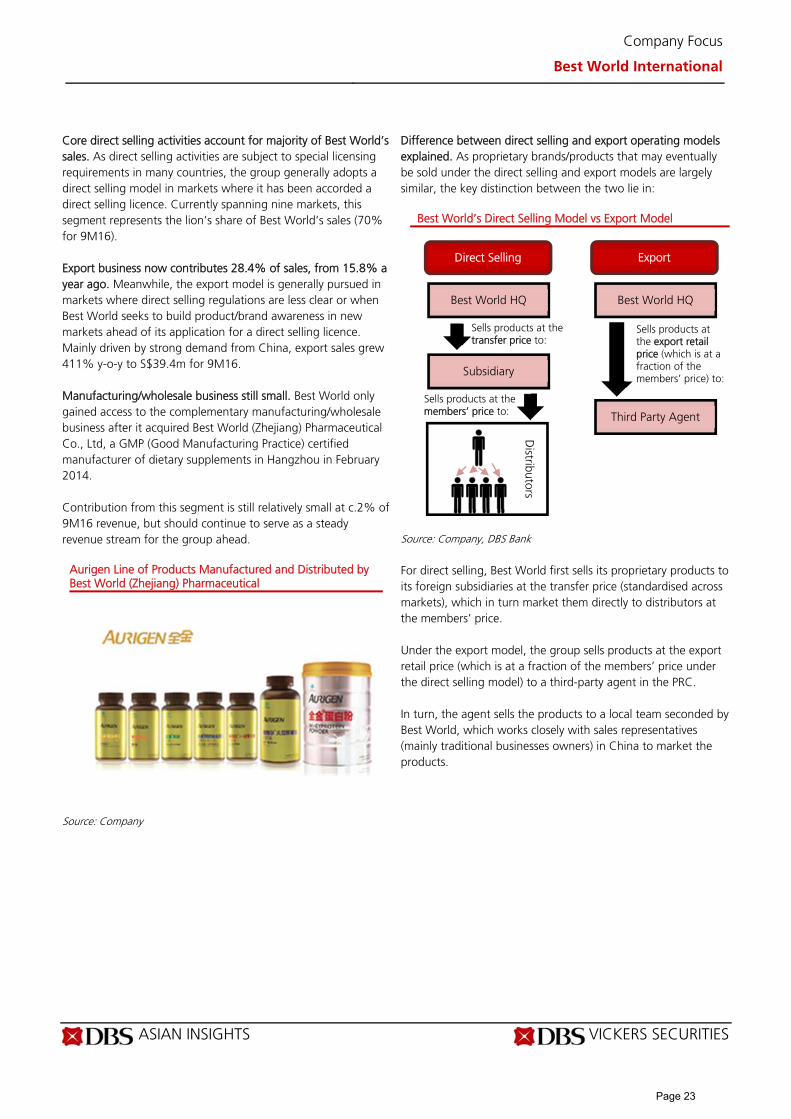
Core direct selling activities account for majority of Best World’s sales. As direct selling activities are subject to special licensing requirements in many countries, the group generally adopts a direct selling model in markets where it has been accorded a direct selling licence. Currently spanning nine markets, this segment represents the lion’s share of Best World’s sales (70% for 9M16). Export business now contributes 28.4% of sales, from 15.8% a year ago. Meanwhile, the export model is generally pursued in markets where direct selling regulations are less clear or when Best World seeks to build product/brand awareness in new markets ahead of its application for a direct selling licence. Mainly driven by strong demand from China, export sales grew 411% y-o-y to S$39.4m for 9M16. Manufacturing/wholesale business still small. Best World only gained access to the complementary manufacturing/wholesale business after it acquired Best World (Zhejiang) Pharmaceutical Co., Ltd, a GMP (Good Manufacturing Practice) certified manufacturer of dietary supplements in Hangzhou in February 2014. Contribution from this segment is still relatively small at c.2% of 9M16 revenue, but should continue to serve as a steady revenue stream for the group ahead.
Aurigen Line of Products Manufactured and Distributed by Best World (Zhejiang) Pharmaceutical
Source: Company
Difference between direct selling and export operating models explained. As proprietary brands/products that may eventually be sold under the direct selling and export models are largely similar, the key distinction between the two lie in:
Best World’s Direct Selling Model vs Export Model
Source: Company, DBS Bank For direct selling, Best World first sells its proprietary products to its foreign subsidiaries at the transfer price (standardised across markets), which in turn market them directly to distributors at the members’ price. Under the export model, the group sells products at the export retail price (which is at a fraction of the members’ price under the direct selling model) to a third-party agent in the PRC. In turn, the agent sells the products to a local team seconded by Best World, which works closely with sales representatives (mainly traditional businesses owners) in China to market the products.
Direct Selling Export
Best World HQ Best World HQ
Subsidiary
Third Party Agent
Sells products at the transfer price to:
Sells products at the members’ price to:
Sells products at the export retail price (which is at a fraction of the members’ price) to:
Distributors
Page 23

ASIAN INSIGHTS VICKERS SECURITIES Page 6
Company Focus
Best World International
Presence in 12 Markets through Subsidiaries and Joint Ventures in 11 Countries (as at end-2016) Markets Subsidiaries and JVs % Held Business Description Singapore Avance Living Pte. Ltd 100% Distribution of cosmetics, skincare, nutritional
supplements, personal care products and healthcare equipment
Best World Lifestyle Pte. Ltd 100% Distribution of nutritional supplements, personal care products and healthcare equipment
Celcott Investments Pte. Ltd 100% On 16 January 2017, Best World announced that Celcott has terminated its joint venture agreement with Prolife Biobank Private Limited, a stem cell banking service provider
Taiwan Best World Lifestyle (Taiwan) Co., Ltd
100% Distribution of health food, network services, sanitary products, skin care and cosmetic products
Hong Kong Best World Lifestyle (HK) Company Limited
100% Distribution of cosmetics, skin care, nutritional supplements, personal care products and healthcare equipment
Vietnam Best World Vietnam Company Limited 100% Trading and distribution of skincare and health-related products
Philippines BWL Health & Sciences, Inc. 100% Selling and distribution, on wholesale basis of skincare, nutritional supplements and personal care products and healthcare supplements
China Best World Lifestyle (Shanghai) Co., Ltd.
100% Import and distribution of cosmetics, skincare, nutritional supplements, personal care products and healthcare equipment
Best World (Zhejiang) Pharmaceutical Co., Ltd.
100% GMP-certified and focused on the development, manufacture and wholesale of the Aurigen brand of dietary supplements
Korea BWL Korea Co., Ltd 100% Distribution of skincare, health food and equipment
Malaysia Best World Lifestyle Sdn Bhd 77.5% Import and distribution of cosmetics, skincare, nutritional supplements, personal care products and healthcare equipment
Indonesia PT BWL Indonesia 80% Distribution of cosmetics, skincare, nutritional supplements, personal care products and healthcare equipment
Thailand PT Best World Indonesia 80% -
BWL (Thailand) Company Limited 49% Import and distribution of cosmetics, skincare, nutritional supplements, personal care products and healthcare equipment
Dubai BWL General Trading L.L.C 49% JV with local Dubai partner
Source: Company
Page 24
ASIAN INSIGHTS VICKERS SECURITIES Page 7
Company Focus
Best World International
Best World’s key success factors lie in…
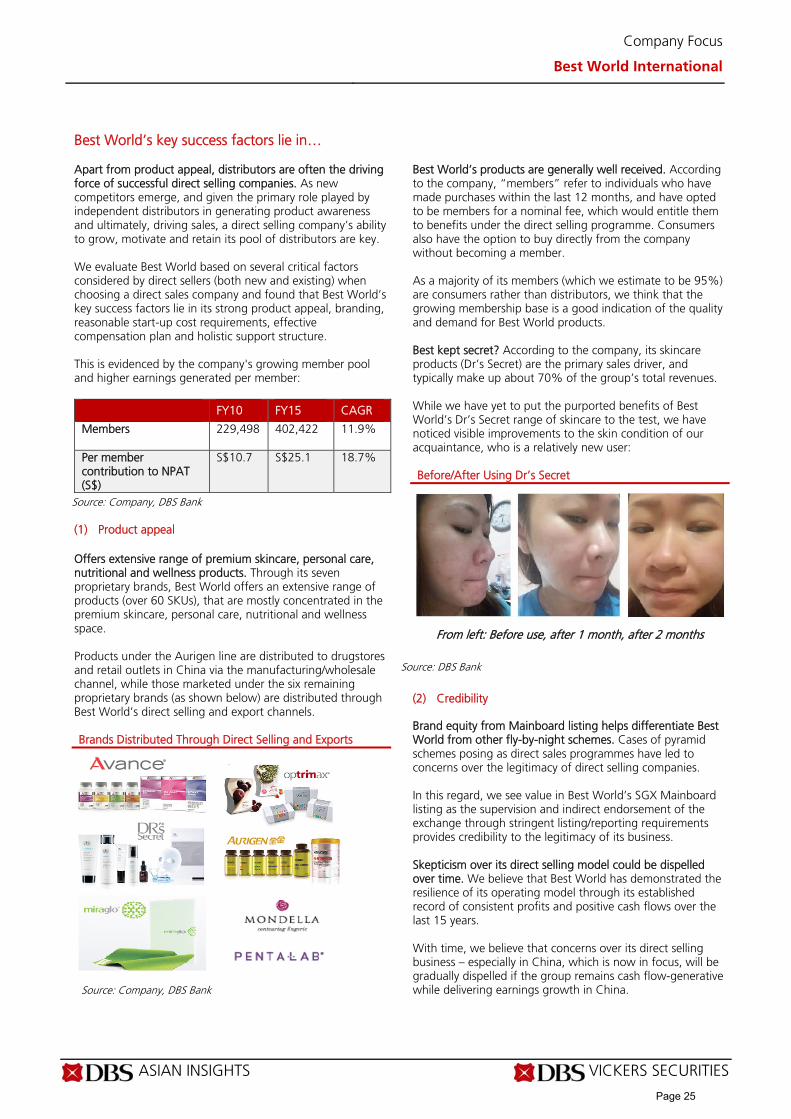
Apart from product appeal, distributors are often the driving force of successful direct selling companies. As new competitors emerge, and given the primary role played by independent distributors in generating product awareness and ultimately, driving sales, a direct selling company’s ability to grow, motivate and retain its pool of distributors are key. We evaluate Best World based on several critical factors considered by direct sellers (both new and existing) when choosing a direct sales company and found that Best World’s key success factors lie in its strong product appeal, branding, reasonable start-up cost requirements, effective compensation plan and holistic support structure. This is evidenced by the company's growing member pool and higher earnings generated per member:
FY10 FY15 CAGR
Members 229,498 402,422 11.9%
Per member contribution to NPAT (S$)
S$10.7 S$25.1 18.7%
Source: Company, DBS Bank (1) Product appeal
Offers extensive range of premium skincare, personal care, nutritional and wellness products. Through its seven proprietary brands, Best World offers an extensive range of products (over 60 SKUs), that are mostly concentrated in the premium skincare, personal care, nutritional and wellness space. Products under the Aurigen line are distributed to drugstores and retail outlets in China via the manufacturing/wholesale channel, while those marketed under the six remaining proprietary brands (as shown below) are distributed through Best World’s direct selling and export channels. Brands Distributed Through Direct Selling and Exports
Source: Company, DBS Bank
Best World’s products are generally well received. According to the company, “members” refer to individuals who have made purchases within the last 12 months, and have opted to be members for a nominal fee, which would entitle them to benefits under the direct selling programme. Consumers also have the option to buy directly from the company without becoming a member. As a majority of its members (which we estimate to be 95%) are consumers rather than distributors, we think that the growing membership base is a good indication of the quality and demand for Best World products. Best kept secret? According to the company, its skincare products (Dr’s Secret) are the primary sales driver, and typically make up about 70% of the group’s total revenues. While we have yet to put the purported benefits of Best World’s Dr’s Secret range of skincare to the test, we have noticed visible improvements to the skin condition of our acquaintance, who is a relatively new user: Before/After Using Dr’s Secret
From left: Before use, after 1 month, after 2 months
Source: DBS Bank (2) Credibility
Brand equity from Mainboard listing helps differentiate Best World from other fly-by-night schemes. Cases of pyramid schemes posing as direct sales programmes have led to concerns over the legitimacy of direct selling companies. In this regard, we see value in Best World’s SGX Mainboard listing as the supervision and indirect endorsement of the exchange through stringent listing/reporting requirements provides credibility to the legitimacy of its business. Skepticism over its direct selling model could be dispelled over time. We believe that Best World has demonstrated the resilience of its operating model through its established record of consistent profits and positive cash flows over the last 15 years. With time, we believe that concerns over its direct selling business – especially in China, which is now in focus, will be gradually dispelled if the group remains cash flow-generative while delivering earnings growth in China.
Page 25

ASIAN INSIGHTS VICKERS SECURITIES Page 8
Company Focus
Best World International
(3) Start-up cost for distributors
Start-up costs kept at a minimum. Initial investments for direct sellers typically include membership fees and inventory costs. In line with recommendations by the Direct Selling Association (DSA), start-up costs for Best World’s distributors are generally modest and include (i) a nominal membership fee, and (ii) reasonable inventory costs as its distributors (to prevent inventory loading) are not under compulsion to hold large amounts of inventory. (4) Compensation plan
Compensation plans should be attractive, yet sustainable. We believe that an effective compensation plan should facilitate the meeting of the following objectives: (i) motivate distributors to work hard at growing their product sales and network, and in return, (ii) reward their efforts through long-lasting residual income. Importantly, compensation should also be exclusively derived from commissions earned based on sales of actual products and not on recruitment. Best World practices a hierarchical commission structure under which distributors (members who purchase Best World products for sale to their network contacts, and further develop their network by introducing new members to the group) who achieve a minimum prescribed sales target will be accorded benefits and bonuses. As a distributor rises up the ranks, his/her benefits will increase. Promotions are hinged upon the sales volume generated by the distributor and his downlines (members recruited by the distributor) within a specified time period. Commissions paid out to distributors vary with product type and rank (among other factors), and are paid up to approximately 35-40% of sales value. (5) Holistic support structure
Comprehensive training. In line with its holistic approach, Best World has developed a comprehensive series of courses that are focused on personal wellbeing and equipping members with essential skills for success in the direct selling industry – such as product knowledge, entrepreneurial skills and business skills. While these courses are made available to members across its 12 markets and are usually self-funded (to cover overheads), attendance is not compulsory. The company has also often stressed that they do not profit from such events. Building a culture of mentorship and peer support. Independent sharing sessions hosted and sponsored by distributors are a regular feature at Best World. Each small group session is usually led by a senior, higher-ranked distributor (upline) who is primarily responsible for guiding
and grooming junior members (downlines) through close mentorship. Additionally, through brainstorming and sharing of experiences, these events are a viable platform for peer support and learning. System and tools. To help facilitate the sales process, Best World recently developed and launched a WeChat micro-site for its China market, which provides users with comprehensive information on its Dr’s Secret range, web-based membership enrolment (if desired) and the option to make purchases via the app. According to the company, sales made via the app will still go directly to the respective sales representatives. Best World’s WeChat Micro-site
Source: Company
Page 26

ASIAN INSIGHTS VICKERS SECURITIES Page 9
Company Focus
Best World International
Business model displays superior sales-to-cost growth relationship Best World’s Current Business Process for Direct Selling and Export Segments
Source: Company, DBS Bank
(1) Significant cost and time savings from the use of third-
party manufacturing
Enhancing consumer appeal through product innovation and improvement. Leveraging on insights from its vast member network and anticipating trends in the consumer/lifestyle space, Best World continuously seeks to introduce new, innovative products and improve on the existing formulae and packaging of its products to enhance its consumer appeal. Formulations are done in-house. Once a new product idea is initiated, Best World would first formulate the product in-house before appointing third-party manufacturers to develop prototypes. These efforts are usually led by the President, Dr Doreen Tan, who is a qualified nutritionist and CEO, Mr Huan Ban Chin, who is a biochemist and microbiologist by training. Low capex requirements as proprietary products are manufactured by contract manufacturers... The outsourcing of its manufacturing function allows Best World to mass produce without incurring substantial capex charges. The company’s current contract manufacturers are mainly based in Taiwan, Korea and the US. …but quality checks and packaging are done in-house. The group’s quality control process requires that finished products
be sent for sample inspections upon delivery. They are then sent to the group’s packaging facility in Singapore before they are distributed via the direct selling and export channels.
(2) Direct selling among the most scalable retail channels
Direct selling vs conventional retail. Unlike conventional retail, direct selling is a socially-based sales process where distributors – which are not confined to a permanent retail location, play a primary role in raising brand awareness. Eliminating the need for various costly overheads - such as rental, staff and advertising, the advantage of Best World’s direct selling model as opposed to traditional brick-and-mortar sales formats lies in its scalability given its ability to grow sales quickly without a commensurate increase in costs. This is evidenced by:
FY10 FY15 CAGR Membership 229,498 402,422 11.9%
Revenue (S$ m)
49.55 S$101.7 15.5%
NPAT (S$ m) 2.45 4.05 32.8%
Source: Company, DBS Bank
Product Initiation
Product Conceptualisation and Development
Receipt of Products, Quality Assurance and Packaging
3rd Party Manufacturing, New Product Registration and Marketing
Sales through Distribution Channels Direct Selling Export
Page 27

ASIAN INSIGHTS VICKERS SECURITIES Page 10
Company Focus
Best World International
A glimpse into Best World’s China operations
Best World’s 102 Product Workshop in Changsha, China (10-11 Dec 2016)
Source: DBS Bank Large-scale recruitment event attracting over 1,000 attendees. We had the opportunity to visit Best World’s operations in Changsha (Hunan province), where we attended a large-scale event from 10-11 December 2016 – which the company refers to as the “102 Product Workshop”, aimed at recruiting sales representatives. Over the course of two days, we spoke to key members of Best World’s China operations who were seconded from the company to China some years ago to lay the foundation and build awareness for the group’s products ahead of its application for a direct selling licence. We saw a good mix of both existing and potential sales representatives at the event, most of whom were traditional business owners. Of over a thousand attendees, we had the opportunity to interact closely with at least 60-70 individuals, including: (1) pioneer members/sales representatives, (2) existing users of Best World products exploring opportunities in direct selling, and (3) potential customers/users. Key items on the agenda included an introduction to Best World and its culture – led by co-founder Dr Dora Hoan, educational sessions focused on the philosophy behind its products and brands and improving product knowledge, managing expectations for upcoming events (such as the potential conversion to the direct selling model in China and shifting of manufacturing operations for Dr’s Secret products from the US to Singapore), as well as the sharing of inspirational success stories by some of the group’s top sales representatives. Thereafter, attendees would then break into smaller groups (led by their respective uplines), where they would take turns to share their takeaways, personal experiences (both as product users and as sales representatives) as well as their sales goals. At a Small-group Sharing Session
Source: DBS Bank
From the horse’s mouth. Through our interactions with attendees and sitting in at several small-group sharing sessions, we found that majority came to know about Best World’s products indirectly, after noticing and making enquiries about improvements to the physical appearance of a friend/acquaintance. Individuals who were once less financially independent felt that they benefitted from the low start-up costs and “having a product that sells itself”, which allowed them to “start small” and gradually grow their passive income. Encouraged by the success stories, several attendees (existing users) also made the leap to join Best World as a sales representative. Participants were generally most excited about the prospect of having a first-mover advantage in their respective cities, and looked forward to leveraging on the new WeChat micro-site to optimise their sales and networking efforts. Due to geographical dispersion, distributors located farther from the local headquarters in Changsha cited longer delivery lead-times as a challenge.
Page 28

ASIAN INSIGHTS VICKERS SECURITIES Page 11
Company Focus
Best World International
Earnings growth a driver of share price Historical Relationship Between Earnings Growth and Best World’s Share Price
Strong historical correlation between share price and trailing 12-month earnings per share price (T12M EPS). We attempt to study the longer–term relationship between BEST’s share price performance against T12M EPS as we compute the correlation between the two from FY2012. The pair displayed a positive correlation of 0.940, which suggests that BEST’s 12-month EPS performance for the past five years was closely correlated to changes in the underlying share prices. Best World mostly traded range-bound between 2012 and most of 2015, but saw an uptick at end-2015 after the company reported a good set of results – earnings for the quarter nearly doubled m-o-m. Apart from strong earnings momentum, the share’s impressive 400% run-up in 2016 from 26.8 Scts to S$1.34 (as at 31 December) also appears to be driven by optimism surrounding
the counter in anticipation of the award of its direct selling licence in China:
Quarterly EPS T12M EPS
3Q15 0.0077 0.02008
4Q15 0.0146 0.03064
1Q16 0.0135 0.03672
2Q16 0.0217 0.05752
3Q16 0.0268 0.07664
% Chg: +248% +282%
Source: DBS Bank, Bloomberg Finance L.P.
Source: DBS Bank, Bloomberg Finance L.P.
Page 29
ASIAN INSIGHTS VICKERS SECURITIES Page 12
Company Focus
Best World International
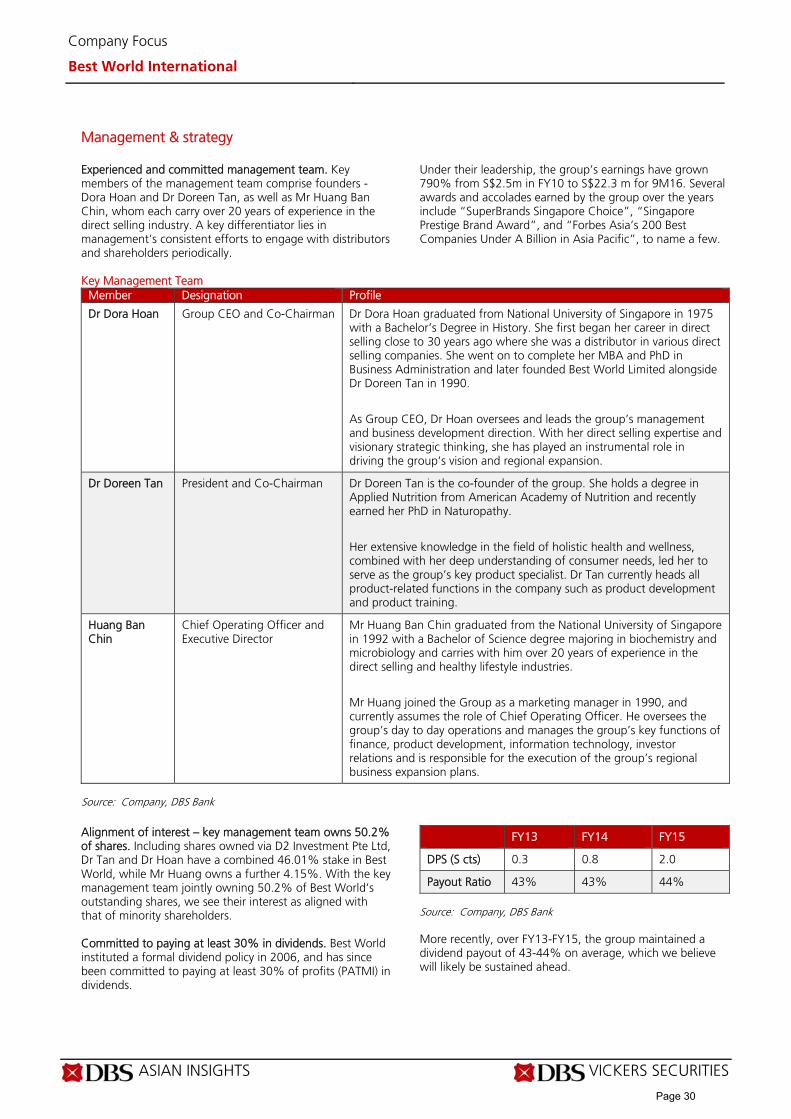
Management & strategy Experienced and committed management team. Key members of the management team comprise founders - Dora Hoan and Dr Doreen Tan, as well as Mr Huang Ban Chin, whom each carry over 20 years of experience in the direct selling industry. A key differentiator lies in management’s consistent efforts to engage with distributors and shareholders periodically.
Under their leadership, the group’s earnings have grown 790% from S$2.5m in FY10 to S$22.3 m for 9M16. Several awards and accolades earned by the group over the years include “SuperBrands Singapore Choice”, “Singapore Prestige Brand Award”, and “Forbes Asia’s 200 Best Companies Under A Billion in Asia Pacific”, to name a few.
Key Management Team Member Designation Profile
Dr Dora Hoan Group CEO and Co-Chairman Dr Dora Hoan graduated from National University of Singapore in 1975 with a Bachelor’s Degree in History. She first began her career in direct selling close to 30 years ago where she was a distributor in various direct selling companies. She went on to complete her MBA and PhD in Business Administration and later founded Best World Limited alongside Dr Doreen Tan in 1990.
As Group CEO, Dr Hoan oversees and leads the group’s management and business development direction. With her direct selling expertise and visionary strategic thinking, she has played an instrumental role in driving the group’s vision and regional expansion.
Dr Doreen Tan President and Co-Chairman Dr Doreen Tan is the co-founder of the group. She holds a degree in Applied Nutrition from American Academy of Nutrition and recently earned her PhD in Naturopathy.
Her extensive knowledge in the field of holistic health and wellness, combined with her deep understanding of consumer needs, led her to serve as the group’s key product specialist. Dr Tan currently heads all product-related functions in the company such as product development and product training.
Huang Ban Chin
Chief Operating Officer and Executive Director
Mr Huang Ban Chin graduated from the National University of Singapore in 1992 with a Bachelor of Science degree majoring in biochemistry and microbiology and carries with him over 20 years of experience in the direct selling and healthy lifestyle industries.
Mr Huang joined the Group as a marketing manager in 1990, and currently assumes the role of Chief Operating Officer. He oversees the group’s day to day operations and manages the group’s key functions of finance, product development, information technology, investor relations and is responsible for the execution of the group’s regional business expansion plans.
Source: Company, DBS Bank
Alignment of interest – key management team owns 50.2% of shares. Including shares owned via D2 Investment Pte Ltd, Dr Tan and Dr Hoan have a combined 46.01% stake in Best World, while Mr Huang owns a further 4.15%. With the key management team jointly owning 50.2% of Best World’s outstanding shares, we see their interest as aligned with that of minority shareholders. Committed to paying at least 30% in dividends. Best World instituted a formal dividend policy in 2006, and has since been committed to paying at least 30% of profits (PATMI) in dividends.
FY13 FY14 FY15
DPS (S cts) 0.3 0.8 2.0
Payout Ratio 43% 43% 44% Source: Company, DBS Bank More recently, over FY13-FY15, the group maintained a dividend payout of 43-44% on average, which we believe will likely be sustained ahead.
Page 30

ASIAN INSIGHTS VICKERS SECURITIES Page 13
Company Focus
Best World International
(1) Focusing on its fastest-growing market, China Direct selling licence for Hangzhou now effective. Best World was granted its direct selling licence by the Ministry of Commerce, the People’s Republic of China (MOFCOM) on 30 June 2016. Having fulfilled the condition of setting up nine service centres in Hangzhou city (one per district), Best World is now permitted to commence direct selling in Hangzhou city. Shift to direct selling model in 2017 unlikely. We do not expect to see a complete shift from the export to direct selling model in China for 2017 as (i) the direct selling licence was only awarded for Hangzhou city, while Best World’s stronghold is in the Hunan (Changsha), Zhejiang, Guangdong, Sichuan (Chongqing) and Heilongjiang (Harbin) provinces, and (ii) differing direct selling regulatory frameworks between China and its other direct selling markets. To successfully navigate China’s regulatory environment, we reckon that it will take a further 8-10 months (or longer) for Best World to finetune its direct sales model for China, before making a formal shift away from its current export model. Ahead of this, we believe that the company will still continue to grow the geographical coverage under its direct selling licence. Similar to Hangzhou, the extension will entail setting up one service outlet per district per city. We think Best World will likely kick-start the process by focusing on cities and provinces where it has established its presence. Strategies to drive growth in China. Leveraging on its heightened brand/product awareness following MOFCOM’s indirect endorsement, we believe Best World will continue to employ the following strategies to drive growth: (a) Increasing the frequency of large-scale recruitment events
(much like the one we attended in Changsha) from one to two/three per quarter, especially in Tier 2 and Tier 3 cities where the competitive landscape tends to be more favourable
(b) Rolling out more promotional events and introducing more complementary products into China – subject to successful product registrations
(c) Recent launch of Best World’s official WeChat micro-site,
an informative in-app order platform, should help raise the productivity of its sales representatives
(2) Driving sales across markets through higher member engagement levels Upside potential when customers exercise option to also distribute. As Best World is primarily focused on growing user base, before ultimately converting them to distributors. We see significant potential just from Best World’s current membership base alone as c.95% of its membership pool comprises users who have fulfilled the criteria to be distributors, and have the flexibility to do so if desired. Further beefing up its product portfolio. Best World typically introduces an average of 3-4 new products each year. From
2017, to better engage and incentivise members to achieve their prescribed maintenance amounts – the level at which rebates/bonuses kick in, the group plans to supplement new product offerings with a series of more generic, day-to-day products (such as toiletries and instant beverages). (3) Setting up a skincare manufacturing facility in Singapore Motivations for shifting operations back to Singapore. The company typically has an average lead time of six months for its purchase orders with its OEM manufacturer in the US, and as a result, has had to hold considerable amounts of inventory on its balance sheet. In addition to hopes of reducing its inventory lead time, the group’s strategic decision to shift its skincare manufacturing operations back to Singapore was also to allow for greater control over procurement of raw materials and production quality. While it is not a key priority, this initiative could also lead to eventual cost-savings (i.e. freight costs) for the group over the longer term. Tuas facility to be operational by end-2017. Best World acquired a 4,550-sqm facility in Tuas (Singapore) for S$10m in 2016. By the end of 2017, half of Best World’s skincare products are expected to be manufactured out of Tuas, with the shift in operations back to Singapore likely to be completed by early 2019. (4) Net cash of S$30.2m could be deployed towards acquisitions
M&A opportunities. Best World will likely utilise some of its net cash of c.S$30.2m as at 9M16, to accelerate growth inorganically. Potential candidates include direct selling companies which provide immediate access to new markets (such as Japan and Europe), or complementary products and services that could be further marketed via Best World’s distribution network – similar to its proposed acquisition of stem cell banking service provider, Prolife Biobank in 2016 (which has since lapsed as conditions precedent in the joint venture agreement were not met).
(5) Further organic growth could also come from... Venture into other markets. Following the establishment of its JV with a local Dubai partner, we understand from the company that they are in the midst of setting up their Dubai Regional Centre, which will then be used as a platform to springboard their Halal-certified products into the other GCC markets of Saudi Arabia, Qatar, Bahrain, Oman and Kuwait over the next 2-3 years. Plans to grow wholesale/manufacturing business. While there are plans to further expand its Hangzhou factory and raise product awareness for its Aurigen line, we think its impact on the group’s overall performance in the near-term will likely be dwarfed by the fast-growing and larger direct selling and export segments, as the wholesale business only constitutes c.2% of the group’s total revenue.
Page 31
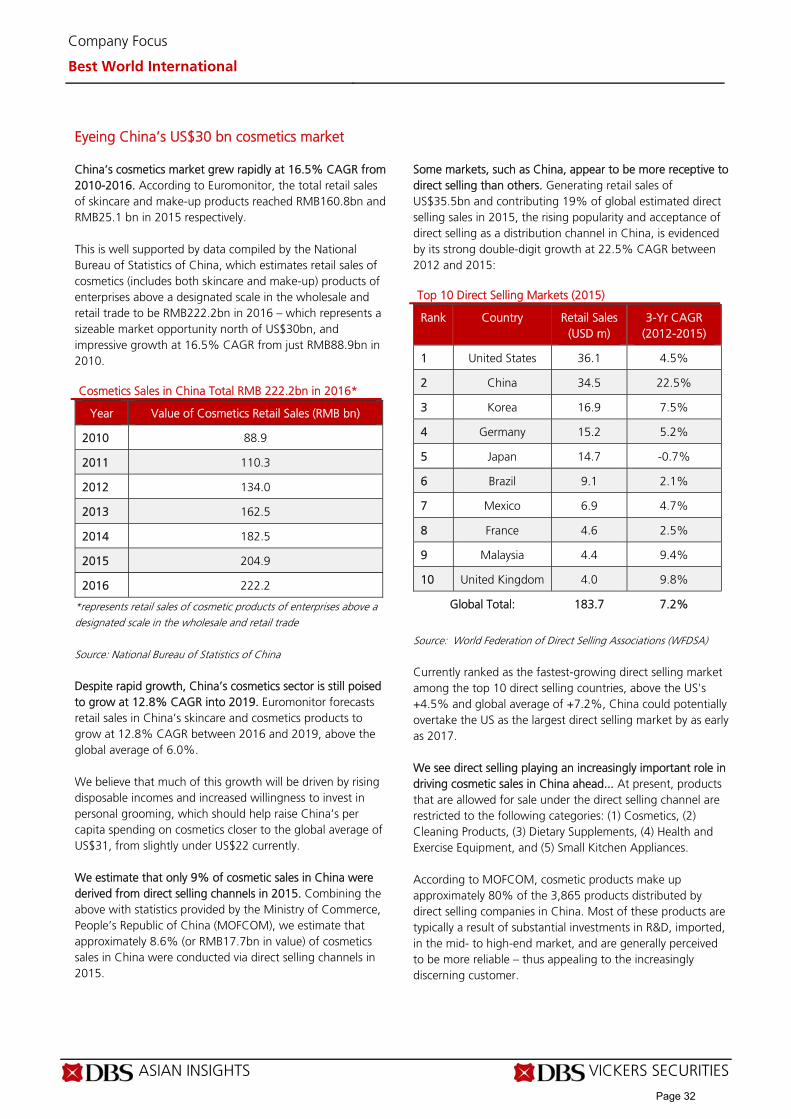
ASIAN INSIGHTS VICKERS SECURITIES Page 14
Company Focus
Best World International
Eyeing China’s US$30 bn cosmetics market China’s cosmetics market grew rapidly at 16.5% CAGR from 2010-2016. According to Euromonitor, the total retail sales of skincare and make-up products reached RMB160.8bn and RMB25.1 bn in 2015 respectively. This is well supported by data compiled by the National Bureau of Statistics of China, which estimates retail sales of cosmetics (includes both skincare and make-up) products of enterprises above a designated scale in the wholesale and retail trade to be RMB222.2bn in 2016 – which represents a sizeable market opportunity north of US$30bn, and impressive growth at 16.5% CAGR from just RMB88.9bn in 2010. Cosmetics Sales in China Total RMB 222.2bn in 2016*
Year Value of Cosmetics Retail Sales (RMB bn)
2010 88.9
2011 110.3
2012 134.0
2013 162.5
2014 182.5
2015 204.9
2016 222.2
*represents retail sales of cosmetic products of enterprises above a designated scale in the wholesale and retail trade Source: National Bureau of Statistics of China Despite rapid growth, China’s cosmetics sector is still poised to grow at 12.8% CAGR into 2019. Euromonitor forecasts retail sales in China’s skincare and cosmetics products to grow at 12.8% CAGR between 2016 and 2019, above the global average of 6.0%. We believe that much of this growth will be driven by rising disposable incomes and increased willingness to invest in personal grooming, which should help raise China’s per capita spending on cosmetics closer to the global average of US$31, from slightly under US$22 currently. We estimate that only 9% of cosmetic sales in China were derived from direct selling channels in 2015. Combining the above with statistics provided by the Ministry of Commerce, People’s Republic of China (MOFCOM), we estimate that approximately 8.6% (or RMB17.7bn in value) of cosmetics sales in China were conducted via direct selling channels in 2015.
Some markets, such as China, appear to be more receptive to direct selling than others. Generating retail sales of US$35.5bn and contributing 19% of global estimated direct selling sales in 2015, the rising popularity and acceptance of direct selling as a distribution channel in China, is evidenced by its strong double-digit growth at 22.5% CAGR between 2012 and 2015: Top 10 Direct Selling Markets (2015)
Rank Country Retail Sales (USD m)
3-Yr CAGR (2012-2015)
1 United States 36.1 4.5%
2 China 34.5 22.5%
3 Korea 16.9 7.5%
4 Germany 15.2 5.2%
5 Japan 14.7 -0.7%
6 Brazil 9.1 2.1%
7 Mexico 6.9 4.7%
8 France 4.6 2.5%
9 Malaysia 4.4 9.4%
10 United Kingdom 4.0 9.8%
Global Total: 183.7 7.2%
Source: World Federation of Direct Selling Associations (WFDSA) Currently ranked as the fastest-growing direct selling market among the top 10 direct selling countries, above the US's +4.5% and global average of +7.2%, China could potentially overtake the US as the largest direct selling market by as early as 2017. We see direct selling playing an increasingly important role in driving cosmetic sales in China ahead... At present, products that are allowed for sale under the direct selling channel are restricted to the following categories: (1) Cosmetics, (2) Cleaning Products, (3) Dietary Supplements, (4) Health and Exercise Equipment, and (5) Small Kitchen Appliances. According to MOFCOM, cosmetic products make up approximately 80% of the 3,865 products distributed by direct selling companies in China. Most of these products are typically a result of substantial investments in R&D, imported, in the mid- to high-end market, and are generally perceived to be more reliable – thus appealing to the increasingly discerning customer.
Page 32

ASIAN INSIGHTS VICKERS SECURITIES Page 15
Company Focus
Best World International
Product Mix
Source: MOFCOM According to Nielsen, 92% of consumers trust recommendations from family and friends over all other forms of advertising. This is especially true for China, where the credibility of paid advertisements and large-scale promotional campaigns have been hurt by multiple product safety scandals over time. Coupled with the use of social media platforms, which facilitates communication and sharing, we thus see direct sellers playing an increasingly important role in driving cosmetic sales ahead.
Best World could potentially leverage on its well-executed, unique sales model to deliver above-industry performance. Offering potential benefits to multiple parties (consumers, distributors and the direct selling companies they represent), we believe the sustainability of a well-executed direct selling business model, such as that of Best World’s, could lead to sustainable, above-industry performance:
Source: Estonian Direct Selling Association, DBS Bank
Benefits to Consumers
Benefits to Distributors
Benefits to Direct Selling Firms
1) Direct contact with seller and guaranteed after-sales service 2) Potential for rebates and bonuses
1) Opportunity to run own business at minimum cost/risk 2) Often fairly rewarded for their efforts
1) Does not require high capital investments 2) Highly scalable business
80%
12%
5%
2% 1%
Cosmetics Dietary SupplementsCleaning Products Health and Exercise EquipmentSmall Kitchen Appliances
Page 33

ASIAN INSIGHTS VICKERS SECURITIES Page 16
Company Focus
Best World International
China, a market over 50x larger than Taiwan is ripe for Best World to harvest Strong momentum in Taiwan to continue. Delivering remarkable sales growth at 52.8% CAGR from S$4.4m in FY09 to S$56.4m in FY15, Best World has been enjoying great success in Taiwan, its largest market by revenue.
Nearly a decade after its foray into Taiwan in 2006, Best World is poised to deliver another record year in its key market, after achieving an all-time high revenue of S$82.9m in 9M16. The group attributes much of its strong performance to a combination of targeted marketing activities, emphasis on training and new product launches.
Sales in Taiwan Grew >1,700%
Source: Company
Ahead, driven by the continued deepening of its existing networks in the Central and Southern parts of Taiwan - where Best World has already achieved a decent scale, plans to leapfrog into Northern Taiwan which has higher population density, as well as the introduction of new products into the market, growth momentum in Taiwan will likely remain robust. Emulating Taiwan’s success in China. Best World’s efforts to cultivate the China market ahead of its application for a direct selling licence started to bear fruit in 2012, where its export business registered sales of S$3.4m. As marketing and outreach efforts began to intensify, export sales quickly quadrupled to S$14.4m by 2015.
Growth momentum continued to accelerate in 2016, as Best World’s export sales grew a further 170% to S$39.4m for 9M16, representing 28.4% of the group’s sales. Export Sales in China Grew Tenfold Over FY12-9M16*
*excludes contributrions from manufacturing/wholesale business Source: Company With its prized Taiwan operations running smoothly, Best World is ready for its next stage of growth and hopes to emulate its success in China, a market over 50x larger than Taiwan. With a population of 1.37bn (as compared to Taiwan’s 23.5m), China has the largest number of potential customers globally and presents many untapped opportunities for the group. Having registered its key products and established a strong network of sales representatives, much of the groundwork has already been laid in China. Further, with MOFCOM’s indirect endorsement through its recent award of a rare direct selling licence set to spur local interest and demand, we believe that the China market is now ripe for Best World to harvest.
Page 34
ASIAN INSIGHTS VICKERS SECURITIES Page 17
Company Focus
Best World International
Key risks Weakening currencies of key markets of operation against the SGD. As revenues are dominated in the respective local currencies, a weakening of the currencies of Best World’s key markets such as Taiwan and China (which contributed to nearly 90% of group revenue in 9M16) may negatively impact the group’s performance. As the company reports in SGD, fluctuations in the respective currencies against the SGD may also give rise to unrealised losses as Best World typically holds some of its cash in USD, RMB and TWD. Risk of reputational damage. Best World’s reputation could be materially affected and may be subject to a loss of business goodwill in the event of the following: 1) Negative publicity surrounding other direct selling companies or the skincare and wellness industries, 2) Errant practices by distributors such as the exaggeration of the efficacy of products may warrant regulatory intervention, 3) Internal/external injuries resulting from the use of Best World products, and 4) The emergence of counterfeit products, which could erode confidence in the brand Unanticipated changes in local regulations and restrictions. As direct selling activities are usually subject to special licensing requirements in many countries, unanticipated regulatory changes in markets where Best World is present could result in termination or restriction on activities for the group.
Further, new restrictions on product ingredients may be imposed long after a product has been approved for a given market, which could potentially lead to the discontinuation of the affected products. Premium products could be faced with weaker demand when discretionary spending decreases. As Best World’s products are priced at a premium, it could thus be susceptible to weak economic conditions and declines in discretionary spending. However, given Best World’s ongoing diversification into other markets and its lower proportion of fixed costs (as compared to traditional retail businesses), we are confident of the group’s ability to weather short-term challenges arising in individual markets and remain profitable during periods of reduced consumer spending. Business may be affected by product shortages or obsolescence. Due to the relatively long order lead time, order forecasts are prepared by the respective regional centres approximately 6-8 months ahead. In periods where sales exceed forecasts, the regional centres face opportunity costs arising from product shortages and conversely, over-ordering may result in higher storage costs and stock obsolescence for the group. Competition from other sales channels. Nearly 70% of Best World’s revenues are from its Dr’s Secret range of skincare. Faced with keen competition in the cosmetics sector – from direct selling companies as well as other sales channels, Best World must continue to innovate to maintain its edge.
Page 35
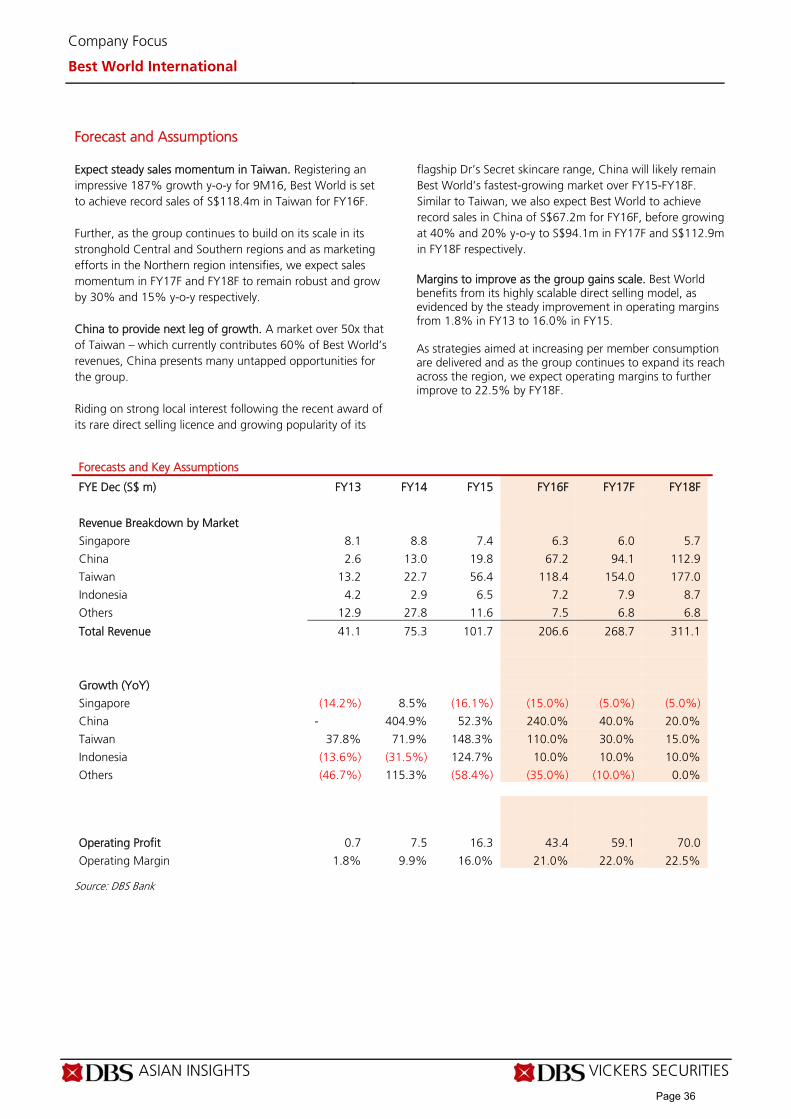
ASIAN INSIGHTS VICKERS SECURITIES Page 18
Company Focus
Best World International
Forecast and Assumptions
Expect steady sales momentum in Taiwan. Registering an impressive 187% growth y-o-y for 9M16, Best World is set to achieve record sales of S$118.4m in Taiwan for FY16F. Further, as the group continues to build on its scale in its stronghold Central and Southern regions and as marketing efforts in the Northern region intensifies, we expect sales momentum in FY17F and FY18F to remain robust and grow by 30% and 15% y-o-y respectively. China to provide next leg of growth. A market over 50x that of Taiwan – which currently contributes 60% of Best World’s revenues, China presents many untapped opportunities for the group. Riding on strong local interest following the recent award of its rare direct selling licence and growing popularity of its
flagship Dr’s Secret skincare range, China will likely remain Best World’s fastest-growing market over FY15-FY18F. Similar to Taiwan, we also expect Best World to achieve record sales in China of S$67.2m for FY16F, before growing at 40% and 20% y-o-y to S$94.1m in FY17F and S$112.9m in FY18F respectively. Margins to improve as the group gains scale. Best World benefits from its highly scalable direct selling model, as evidenced by the steady improvement in operating margins from 1.8% in FY13 to 16.0% in FY15. As strategies aimed at increasing per member consumption are delivered and as the group continues to expand its reach across the region, we expect operating margins to further improve to 22.5% by FY18F.
Forecasts and Key Assumptions
FYE Dec (S$ m) FY13 FY14 FY15 FY16F FY17F FY18F
Revenue Breakdown by Market
Singapore 8.1 8.8 7.4 6.3 6.0 5.7
China 2.6 13.0 19.8 67.2 94.1 112.9
Taiwan 13.2 22.7 56.4 118.4 154.0 177.0
Indonesia 4.2 2.9 6.5 7.2 7.9 8.7
Others 12.9 27.8 11.6 7.5 6.8 6.8
Total Revenue 41.1 75.3 101.7 206.6 268.7 311.1
Growth (YoY)
Singapore (14.2%) 8.5% (16.1%) (15.0%) (5.0%) (5.0%)
China - 404.9% 52.3% 240.0% 40.0% 20.0%
Taiwan 37.8% 71.9% 148.3% 110.0% 30.0% 15.0%
Indonesia (13.6%) (31.5%) 124.7% 10.0% 10.0% 10.0%
Others (46.7%) 115.3% (58.4%) (35.0%) (10.0%) 0.0%
Operating Profit 0.7 7.5 16.3 43.4 59.1 70.0
Operating Margin 1.8% 9.9% 16.0% 21.0% 22.0% 22.5%
Source: DBS Bank
Page 36

ASIAN INSIGHTS VICKERS SECURITIES Page 19
Company Focus
Best World International
Financials - Income Statement Project 68% PATMI CAGR over FY15-18F. As Best World continues to gain scale and further extend its reach in the key markets of Taiwan and China, we project the group’s PATMI to rise quickly from S$10.1m in FY15 to S$48m by FY18F. Effective tax rate should be closer to our assumed 32% ahead. Apart from one-off items which resulted in higher effective taxes of 65%, 43% and 45% in FY11, FY13 and FY15 respectively, Best World’s effective taxes generally fall between 28% and 32% p.a. All else equal, with China’s (which has a higher corporate tax rate) growing contribution to bottom line), we have assumed that tax rates will remain at the higher-end of its normalised historical range, at 32%. Income Statement (S$m)
FY Dec 2013A 2014A 2015A 2016F 2017F 2018F Revenue 41.1 75.3 102 207 269 311
Cost of Goods Sold (9.3) (19.3) (24.8) (55.8) (71.2) (82.4)
Gross Profit 31.8 56.0 76.9 151 198 229
Other Opng (Exp)/Inc (31.1) (48.5) (60.6) (107) (138) (159)
Operating Profit 0.72 7.48 16.3 43.4 59.1 70.0
Other Non Opg (Exp)/Inc 1.00 (1.9) 0.43 0.0 0.0 0.0
Associates & JV Inc 0.0 0.0 0.0 0.0 0.0 0.0
Net Interest (Exp)/Inc 0.21 0.09 0.26 0.08 0.22 0.27
Exceptional Gain/(Loss) 0.0 0.0 0.0 0.0 0.0 0.0
Pre-tax Profit 1.93 5.65 17.0 43.5 59.3 70.3
Tax (0.8) (1.6) (7.7) (13.9) (19.0) (22.5)
Minority Interest 0.33 0.0 0.80 0.24 0.24 0.24
Preference Dividend 0.0 0.0 0.0 0.0 0.0 0.0
Net Profit 1.43 4.05 10.1 29.8 40.6 48.0
Net Profit before Except. 1.43 4.05 10.1 29.8 40.6 48.0
EBITDA 3.22 8.15 19.5 46.1 62.1 73.1
Growth
Revenue Gth (%) (14.8) 83.2 35.1 103.2 30.0 15.8
EBITDA Gth (%) (13.8) 153.0 139.4 136.2 34.7 17.7
Opg Profit Gth (%) (76.3) 935.5 118.1 166.1 36.2 18.4
Net Profit Gth (Pre-ex) (%)
(20.6) 183.7 149.2 195.0 36.2 18.3
Margins & Ratio
Gross Margins (%) 77.4 74.4 75.6 73.0 73.5 73.5
Opg Profit Margin (%) 1.8 9.9 16.0 21.0 22.0 22.5
Net Profit Margin (%) 3.5 5.4 9.9 14.4 15.1 15.4
ROAE (%) 2.9 7.7 16.8 41.3 44.1 41.1
ROA (%) 2.4 5.6 11.3 25.3 25.4 24.7
ROCE (%) 3.3 7.1 16.3 41.2 44.3 41.3
Div Payout Ratio (%) 43.0 43.0 43.6 43.6 43.6 43.6
Net Interest Cover (x) NM NM NM NM NM NM Source: Company, DBS Bank
Margins Trend
5.0%
7.0%
9.0%
11.0%
13.0%
15.0%
17.0%
19.0%
21.0%
23.0%
2014A 2015A 2016F 2017F 2018F
Operating Margin % Net Income Margin %
Higher one-off effective tax rate of 45% in FY15 includes tax claims made by the Indonesia Tax Authority on subsidiary, PT Best World Indonesia’s tax assessment for FY08, which amounted to S$3.4m.
Page 37
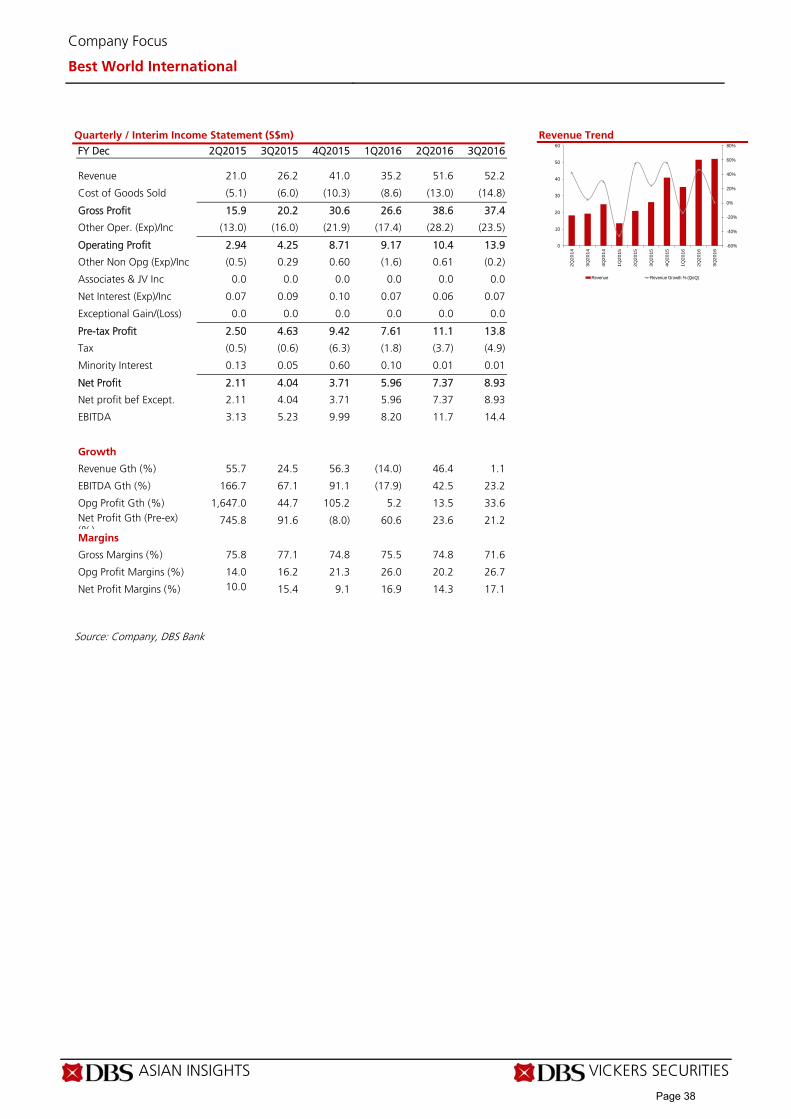
ASIAN INSIGHTS VICKERS SECURITIES Page 20
Company Focus
Best World International
Quarterly / Interim Income Statement (S$m)
FY Dec 2Q2015 3Q2015 4Q2015 1Q2016 2Q2016 3Q2016 Revenue 21.0 26.2 41.0 35.2 51.6 52.2
Cost of Goods Sold (5.1) (6.0) (10.3) (8.6) (13.0) (14.8)
Gross Profit 15.9 20.2 30.6 26.6 38.6 37.4
Other Oper. (Exp)/Inc (13.0) (16.0) (21.9) (17.4) (28.2) (23.5)
Operating Profit 2.94 4.25 8.71 9.17 10.4 13.9
Other Non Opg (Exp)/Inc (0.5) 0.29 0.60 (1.6) 0.61 (0.2)
Associates & JV Inc 0.0 0.0 0.0 0.0 0.0 0.0
Net Interest (Exp)/Inc 0.07 0.09 0.10 0.07 0.06 0.07
Exceptional Gain/(Loss) 0.0 0.0 0.0 0.0 0.0 0.0
Pre-tax Profit 2.50 4.63 9.42 7.61 11.1 13.8
Tax (0.5) (0.6) (6.3) (1.8) (3.7) (4.9)
Minority Interest 0.13 0.05 0.60 0.10 0.01 0.01
Net Profit 2.11 4.04 3.71 5.96 7.37 8.93
Net profit bef Except. 2.11 4.04 3.71 5.96 7.37 8.93
EBITDA 3.13 5.23 9.99 8.20 11.7 14.4
Growth
Revenue Gth (%) 55.7 24.5 56.3 (14.0) 46.4 1.1
EBITDA Gth (%) 166.7 67.1 91.1 (17.9) 42.5 23.2
Opg Profit Gth (%) 1,647.0 44.7 105.2 5.2 13.5 33.6 Net Profit Gth (Pre-ex) (%)
745.8 91.6 (8.0) 60.6 23.6 21.2
Margins
Gross Margins (%) 75.8 77.1 74.8 75.5 74.8 71.6
Opg Profit Margins (%) 14.0 16.2 21.3 26.0 20.2 26.7
Net Profit Margins (%) 10.0 15.4 9.1 16.9 14.3 17.1
Revenue Trend
Source: Company, DBS Bank
-60%
-40%
-20%
0%
20%
40%
60%
80%
0
10
20
30
40
50
60
2Q
20
14
3Q
20
14
4Q
20
14
1Q
20
15
2Q
20
15
3Q
20
15
4Q
20
15
1Q
20
16
2Q
20
16
3Q
20
16
Revenue Revenue Growth % (QoQ)
Page 38

ASIAN INSIGHTS VICKERS SECURITIES Page 21
Company Focus
Best World International
Financials - Balance Sheet Healthy balance sheet. Backed by its firm earnings outlook and net cash of S$30.2m (as at 9M16), our projections show that Best World should be able to fund planned capital expenditures of c.S$11m for its Tuas factory FY17/18F internally, and that the cash balance will continue to rise. M&A in the works? Apart from its focus on organic growth, we also believe that Best World is on the lookout for acquisitive opportunities, and will likely utilise some of its net cash to accelerate growth when viable opportunities arise.
Balance Sheet (S$m)
FY Dec 2013A 2014A 2015A 2016F 2017F 2018F Net Fixed Assets 6.39 7.55 6.85 16.2 19.7 23.2
Invts in Associates & JVs 0.0 0.0 0.0 0.0 0.0 0.0
Other LT Assets 2.85 9.51 11.0 9.94 8.92 7.90
Cash & ST Invts 34.3 41.2 47.3 57.4 91.9 120
Inventory 5.91 7.75 11.5 30.6 25.4 22.6
Debtors 5.34 9.35 10.6 20.3 25.0 29.0
Other Current Assets 7.11 8.71 7.25 7.25 7.25 7.25
Total Assets 61.9 84.1 94.4 142 178 210
ST Debt
3.50 4.72 0.01 0.01 0.01 0.01
Creditor 7.42 19.0 24.5 45.9 54.6 56.5
Other Current Liab 1.69 1.94 5.59 14.9 20.0 23.5
LT Debt 0.25 1.33 0.01 0.01 0.01 0.01
Other LT Liabilities 0.0 1.68 2.31 2.31 2.31 2.31
Shareholder’s Equity 49.4 56.3 63.7 80.5 103 131
Minority Interests (0.3) (0.9) (1.7) (2.0) (2.2) (2.5)
Total Cap. & Liab. 61.9 84.1 94.4 142 178 210
Non-Cash Wkg. Capital 9.24 4.88 (0.7) (2.7) (16.9) (21.1)
Net Cash/(Debt) 30.6 35.2 47.2 57.4 91.8 120
Debtors Turn (avg days) 49.7 35.6 35.8 27.2 30.8 31.7
Creditors Turn (avg days) 375.8 289.0 360.5 241.9 268.8 255.4
Inventory Turn (avg days) 264.6 149.4 159.7 144.7 149.6 110.2
Asset Turnover (x) 0.7 1.0 1.1 1.8 1.7 1.6
Current Ratio (x) 4.2 2.6 2.5 1.9 2.0 2.2
Quick Ratio (x) 3.1 2.0 1.9 1.3 1.6 1.9
Net Debt/Equity (X) CASH CASH CASH CASH CASH CASH
Net Debt/Equity ex MI (X) CASH CASH CASH CASH CASH CASH
Capex to Debt (%) 28.7 15.0 6,100.0 61,111.1 30,555.6 30,555.6 Source: Company, DBS Bank
Asset Breakdown
Page 39
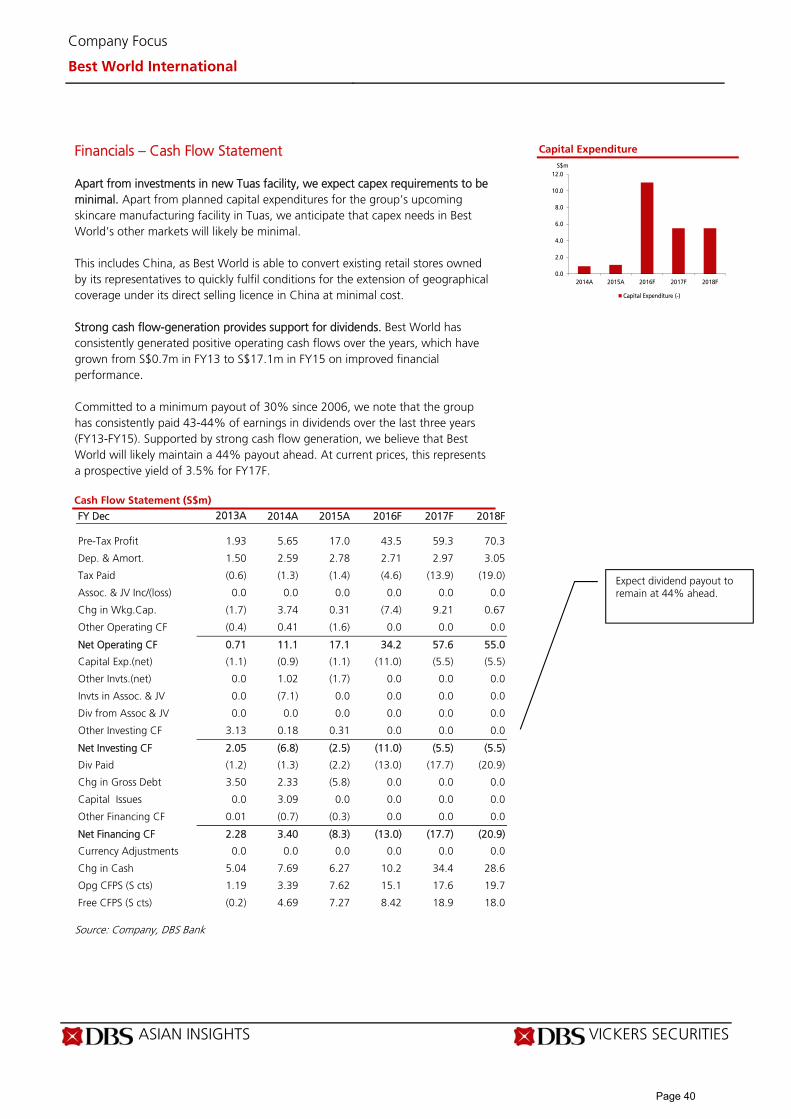
ASIAN INSIGHTS VICKERS SECURITIES Page 22
Company Focus
Best World International
Financials – Cash Flow Statement Apart from investments in new Tuas facility, we expect capex requirements to be minimal. Apart from planned capital expenditures for the group’s upcoming skincare manufacturing facility in Tuas, we anticipate that capex needs in Best World’s other markets will likely be minimal. This includes China, as Best World is able to convert existing retail stores owned by its representatives to quickly fulfil conditions for the extension of geographical coverage under its direct selling licence in China at minimal cost. Strong cash flow-generation provides support for dividends. Best World has consistently generated positive operating cash flows over the years, which have grown from S$0.7m in FY13 to S$17.1m in FY15 on improved financial performance. Committed to a minimum payout of 30% since 2006, we note that the group has consistently paid 43-44% of earnings in dividends over the last three years (FY13-FY15). Supported by strong cash flow generation, we believe that Best World will likely maintain a 44% payout ahead. At current prices, this represents a prospective yield of 3.5% for FY17F. Cash Flow Statement (S$m)
FY Dec 2013A 2014A 2015A 2016F 2017F 2018F Pre-Tax Profit 1.93 5.65 17.0 43.5 59.3 70.3
Dep. & Amort. 1.50 2.59 2.78 2.71 2.97 3.05
Tax Paid (0.6) (1.3) (1.4) (4.6) (13.9) (19.0)
Assoc. & JV Inc/(loss) 0.0 0.0 0.0 0.0 0.0 0.0
Chg in Wkg.Cap. (1.7) 3.74 0.31 (7.4) 9.21 0.67
Other Operating CF (0.4) 0.41 (1.6) 0.0 0.0 0.0
Net Operating CF 0.71 11.1 17.1 34.2 57.6 55.0
Capital Exp.(net) (1.1) (0.9) (1.1) (11.0) (5.5) (5.5)
Other Invts.(net) 0.0 1.02 (1.7) 0.0 0.0 0.0
Invts in Assoc. & JV 0.0 (7.1) 0.0 0.0 0.0 0.0
Div from Assoc & JV 0.0 0.0 0.0 0.0 0.0 0.0
Other Investing CF 3.13 0.18 0.31 0.0 0.0 0.0
Net Investing CF 2.05 (6.8) (2.5) (11.0) (5.5) (5.5)
Div Paid (1.2) (1.3) (2.2) (13.0) (17.7) (20.9)
Chg in Gross Debt 3.50 2.33 (5.8) 0.0 0.0 0.0
Capital Issues 0.0 3.09 0.0 0.0 0.0 0.0
Other Financing CF 0.01 (0.7) (0.3) 0.0 0.0 0.0
Net Financing CF 2.28 3.40 (8.3) (13.0) (17.7) (20.9)
Currency Adjustments 0.0 0.0 0.0 0.0 0.0 0.0
Chg in Cash 5.04 7.69 6.27 10.2 34.4 28.6
Opg CFPS (S cts) 1.19 3.39 7.62 15.1 17.6 19.7
Free CFPS (S cts) (0.2) 4.69 7.27 8.42 18.9 18.0 Source: Company, DBS Bank
Capital Expenditure
0.0
2.0
4.0
6.0
8.0
10.0
12.0
2014A 2015A 2016F 2017F 2018F
Capital Expenditure (-)
S$m
Expect dividend payout to remain at 44% ahead.
Page 40
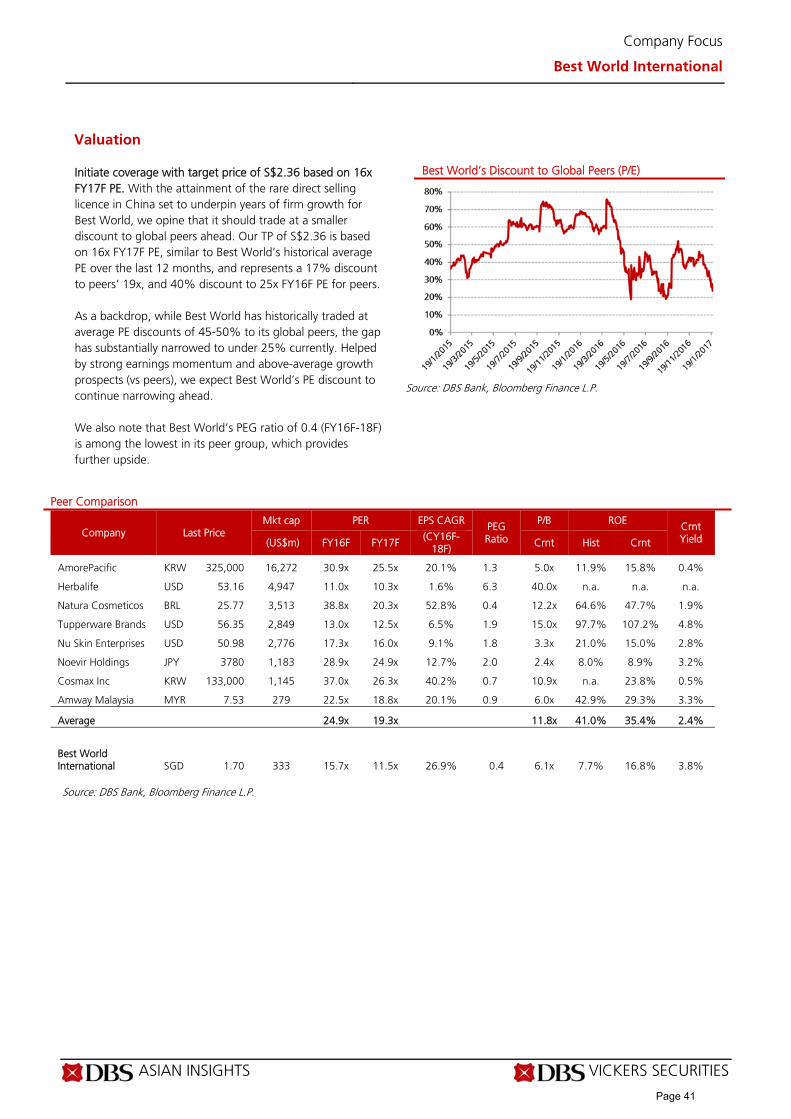
ASIAN INSIGHTS VICKERS SECURITIES Page 23
Company Focus
Best World International
Valuation Initiate coverage with target price of S$2.36 based on 16x FY17F PE. With the attainment of the rare direct selling licence in China set to underpin years of firm growth for Best World, we opine that it should trade at a smaller discount to global peers ahead. Our TP of S$2.36 is based on 16x FY17F PE, similar to Best World’s historical average PE over the last 12 months, and represents a 17% discount to peers’ 19x, and 40% discount to 25x FY16F PE for peers. As a backdrop, while Best World has historically traded at average PE discounts of 45-50% to its global peers, the gap has substantially narrowed to under 25% currently. Helped by strong earnings momentum and above-average growth prospects (vs peers), we expect Best World’s PE discount to continue narrowing ahead. We also note that Best World’s PEG ratio of 0.4 (FY16F-18F) is among the lowest in its peer group, which provides further upside.
Best World’s Discount to Global Peers (P/E)
Source: DBS Bank, Bloomberg Finance L.P.
Peer Comparison
Company Last Price Mkt cap PER EPS CAGR PEG
Ratio
P/B ROE Crnt Yield (US$m) FY16F FY17F
(CY16F-18F) Crnt Hist Crnt
AmorePacific KRW 325,000 16,272 30.9x 25.5x 20.1% 1.3 5.0x 11.9% 15.8% 0.4%
Herbalife USD 53.16 4,947 11.0x 10.3x 1.6% 6.3 40.0x n.a. n.a. n.a.
Natura Cosmeticos BRL 25.77 3,513 38.8x 20.3x 52.8% 0.4 12.2x 64.6% 47.7% 1.9%
Tupperware Brands USD 56.35 2,849 13.0x 12.5x 6.5% 1.9 15.0x 97.7% 107.2% 4.8%
Nu Skin Enterprises USD 50.98 2,776 17.3x 16.0x 9.1% 1.8 3.3x 21.0% 15.0% 2.8%
Noevir Holdings JPY 3780 1,183 28.9x 24.9x 12.7% 2.0 2.4x 8.0% 8.9% 3.2%
Cosmax Inc KRW 133,000 1,145 37.0x 26.3x 40.2% 0.7 10.9x n.a. 23.8% 0.5%
Amway Malaysia MYR 7.53 279 22.5x 18.8x 20.1% 0.9 6.0x 42.9% 29.3% 3.3%
Average 24.9x 19.3x 11.8x 41.0% 35.4% 2.4%
Best World International SGD 1.70 333 15.7x 11.5x 26.9%
0.4 6.1x 7.7% 16.8% 3.8%
Source: DBS Bank, Bloomberg Finance L.P.
Page 41
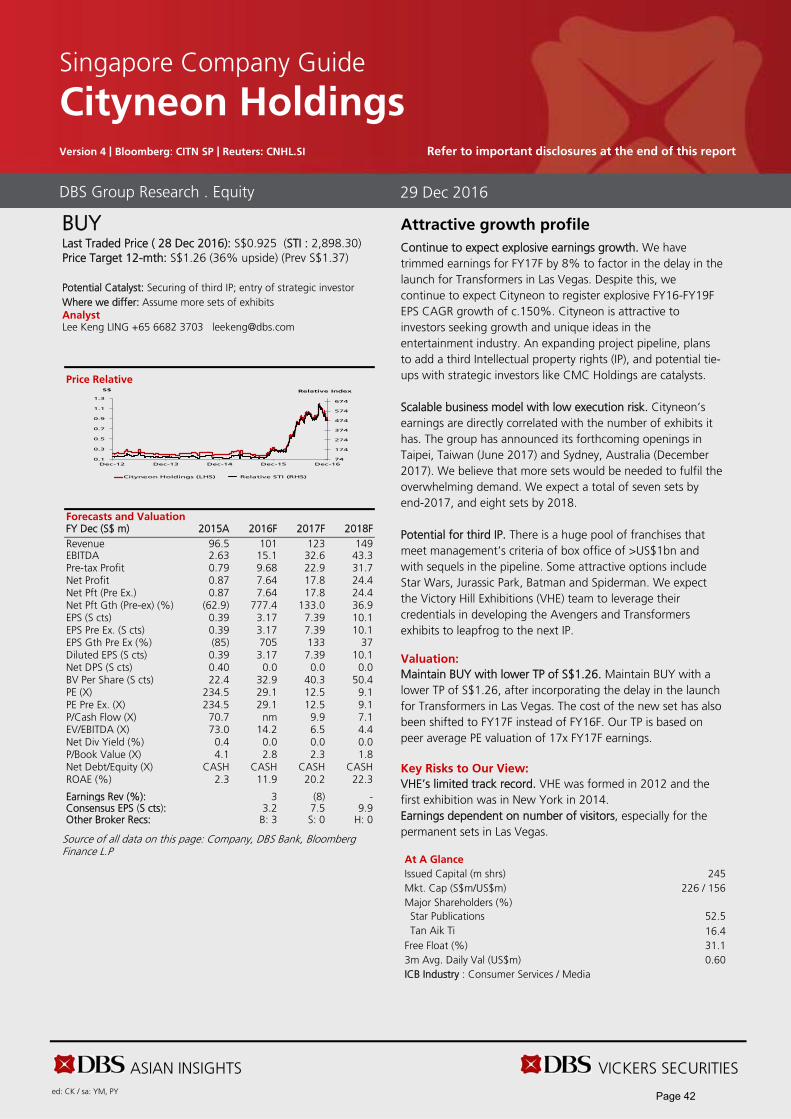
ASIAN INSIGHTS VICKERS SECURITIES ed: CK / sa: YM, PY
BUY Last Traded Price ( 28 Dec 2016): S$0.925 (STI : 2,898.30) Price Target 12-mth: S$1.26 (36% upside) (Prev S$1.37) Potential Catalyst: Securing of third IP; entry of strategic investor Where we differ: Assume more sets of exhibits Analyst Lee Keng LING +65 6682 3703 [email protected]
Price Relative
Forecasts and Valuation FY Dec (S$ m) 2015A 2016F 2017F 2018F Revenue 96.5 101 123 149 EBITDA 2.63 15.1 32.6 43.3 Pre-tax Profit 0.79 9.68 22.9 31.7 Net Profit 0.87 7.64 17.8 24.4 Net Pft (Pre Ex.) 0.87 7.64 17.8 24.4 Net Pft Gth (Pre-ex) (%) (62.9) 777.4 133.0 36.9 EPS (S cts) 0.39 3.17 7.39 10.1 EPS Pre Ex. (S cts) 0.39 3.17 7.39 10.1 EPS Gth Pre Ex (%) (85) 705 133 37 Diluted EPS (S cts) 0.39 3.17 7.39 10.1 Net DPS (S cts) 0.40 0.0 0.0 0.0 BV Per Share (S cts) 22.4 32.9 40.3 50.4 PE (X) 234.5 29.1 12.5 9.1 PE Pre Ex. (X) 234.5 29.1 12.5 9.1 P/Cash Flow (X) 70.7 nm 9.9 7.1 EV/EBITDA (X) 73.0 14.2 6.5 4.4 Net Div Yield (%) 0.4 0.0 0.0 0.0 P/Book Value (X) 4.1 2.8 2.3 1.8 Net Debt/Equity (X) CASH CASH CASH CASH ROAE (%) 2.3 11.9 20.2 22.3 Earnings Rev (%): 3 (8) - Consensus EPS (S cts): 3.2 7.5 9.9 Other Broker Recs: B: 3 S: 0 H: 0
Source of all data on this page: Company, DBS Bank, Bloomberg Finance L.P
Attractive growth profile
Continue to expect explosive earnings growth. We have trimmed earnings for FY17F by 8% to factor in the delay in the launch for Transformers in Las Vegas. Despite this, we continue to expect Cityneon to register explosive FY16-FY19F EPS CAGR growth of c.150%. Cityneon is attractive to investors seeking growth and unique ideas in the entertainment industry. An expanding project pipeline, plans to add a third Intellectual property rights (IP), and potential tie-ups with strategic investors like CMC Holdings are catalysts. Scalable business model with low execution risk. Cityneon’s earnings are directly correlated with the number of exhibits it has. The group has announced its forthcoming openings in Taipei, Taiwan (June 2017) and Sydney, Australia (December 2017). We believe that more sets would be needed to fulfil the overwhelming demand. We expect a total of seven sets by end-2017, and eight sets by 2018. Potential for third IP. There is a huge pool of franchises that meet management’s criteria of box office of >US$1bn and with sequels in the pipeline. Some attractive options include Star Wars, Jurassic Park, Batman and Spiderman. We expect the Victory Hill Exhibitions (VHE) team to leverage their credentials in developing the Avengers and Transformers exhibits to leapfrog to the next IP. Valuation:
Maintain BUY with lower TP of S$1.26. Maintain BUY with a lower TP of S$1.26, after incorporating the delay in the launch for Transformers in Las Vegas. The cost of the new set has also been shifted to FY17F instead of FY16F. Our TP is based on peer average PE valuation of 17x FY17F earnings. Key Risks to Our View:
VHE’s limited track record. VHE was formed in 2012 and the first exhibition was in New York in 2014. Earnings dependent on number of visitors, especially for the permanent sets in Las Vegas. At A Glance Issued Capital (m shrs) 245 Mkt. Cap (S$m/US$m) 226 / 156 Major Shareholders (%) Star Publications 52.5 Tan Aik Ti 16.4
Free Float (%) 31.1 3m Avg. Daily Val (US$m) 0.60 ICB Industry : Consumer Services / Media
DBS Group Research . Equity 29 Dec 2016
Singapore Company Guide
Cityneon Holdings Version 4 | Bloomberg: CITN SP | Reuters: CNHL.SI Refer to important disclosures at the end of this report
74
174
274
374
474
574
674
0.1
0.3
0.5
0.7
0.9
1.1
1.3
Dec-12 Dec-13 Dec-14 Dec-15 Dec-16
Relative IndexS$
Cityneon Holdings (LHS) Relative STI (RHS)
Page 42
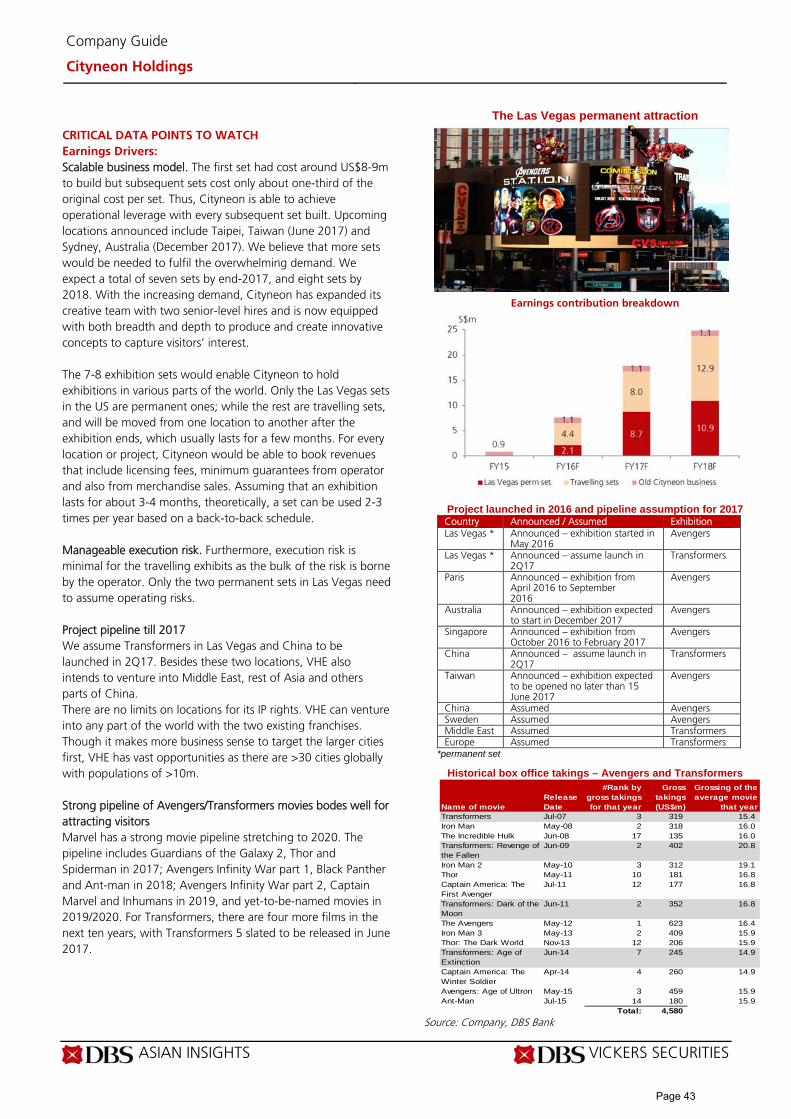
ASIAN INSIGHTS VICKERS SECURITIES Page 2
Company Guide
Cityneon Holdings
CRITICAL DATA POINTS TO WATCH
Earnings Drivers:
Scalable business model. The first set had cost around US$8-9m to build but subsequent sets cost only about one-third of the original cost per set. Thus, Cityneon is able to achieve operational leverage with every subsequent set built. Upcoming locations announced include Taipei, Taiwan (June 2017) and Sydney, Australia (December 2017). We believe that more sets would be needed to fulfil the overwhelming demand. We expect a total of seven sets by end-2017, and eight sets by 2018. With the increasing demand, Cityneon has expanded its creative team with two senior-level hires and is now equipped with both breadth and depth to produce and create innovative concepts to capture visitors’ interest. The 7-8 exhibition sets would enable Cityneon to hold exhibitions in various parts of the world. Only the Las Vegas sets in the US are permanent ones; while the rest are travelling sets, and will be moved from one location to another after the exhibition ends, which usually lasts for a few months. For every location or project, Cityneon would be able to book revenues that include licensing fees, minimum guarantees from operator and also from merchandise sales. Assuming that an exhibition lasts for about 3-4 months, theoretically, a set can be used 2-3 times per year based on a back-to-back schedule. Manageable execution risk. Furthermore, execution risk is minimal for the travelling exhibits as the bulk of the risk is borne by the operator. Only the two permanent sets in Las Vegas need to assume operating risks. Project pipeline till 2017 We assume Transformers in Las Vegas and China to be launched in 2Q17. Besides these two locations, VHE also intends to venture into Middle East, rest of Asia and others parts of China. There are no limits on locations for its IP rights. VHE can venture into any part of the world with the two existing franchises. Though it makes more business sense to target the larger cities first, VHE has vast opportunities as there are >30 cities globally with populations of >10m. Strong pipeline of Avengers/Transformers movies bodes well for attracting visitors Marvel has a strong movie pipeline stretching to 2020. The pipeline includes Guardians of the Galaxy 2, Thor and Spiderman in 2017; Avengers Infinity War part 1, Black Panther and Ant-man in 2018; Avengers Infinity War part 2, Captain Marvel and Inhumans in 2019, and yet-to-be-named movies in 2019/2020. For Transformers, there are four more films in the next ten years, with Transformers 5 slated to be released in June 2017.
The Las Vegas permanent attraction
Earnings contribution breakdown
Project launched in 2016 and pipeline assumption for 2017 Country Announced / Assumed Exhibition Las Vegas * Announced – exhibition started in
May 2016 Avengers
Las Vegas * Announced – assume launch in 2Q17
Transformers
Paris Announced – exhibition from April 2016 to September 2016
Avengers
Australia Announced – exhibition expected to start in December 2017
Avengers
Singapore Announced – exhibition from October 2016 to February 2017
Avengers
China Announced – assume launch in 2Q17
Transformers
Taiwan Announced – exhibition expected to be opened no later than 15 June 2017
Avengers
China Assumed Avengers Sweden Assumed Avengers Middle East Assumed Transformers Europe Assumed Transformers
*permanent set
Historical box office takings – Avengers and Transformers
Source: Company, DBS Bank
Name of movieRelease Date
#Rank by gross takings for that year
Gross takings (US$m)
Grossing of the average movie
that yearTransformers Jul-07 3 319 15.4Iron Man May-08 2 318 16.0The Incredible Hulk Jun-08 17 135 16.0Transformers: Revenge of the Fallen
Jun-09 2 402 20.8
Iron Man 2 May-10 3 312 19.1Thor May-11 10 181 16.8Captain America: The First Avenger
Jul-11 12 177 16.8
Transformers: Dark of the Moon
Jun-11 2 352 16.8
The Avengers May-12 1 623 16.4Iron Man 3 May-13 2 409 15.9Thor: The Dark World Nov-13 12 206 15.9Transformers: Age of Extinction
Jun-14 7 245 14.9
Captain America: The Winter Soldier
Apr-14 4 260 14.9
Avengers: Age of Ultron May-15 3 459 15.9Ant-Man Jul-15 14 180 15.9
Total: 4,580
Page 43
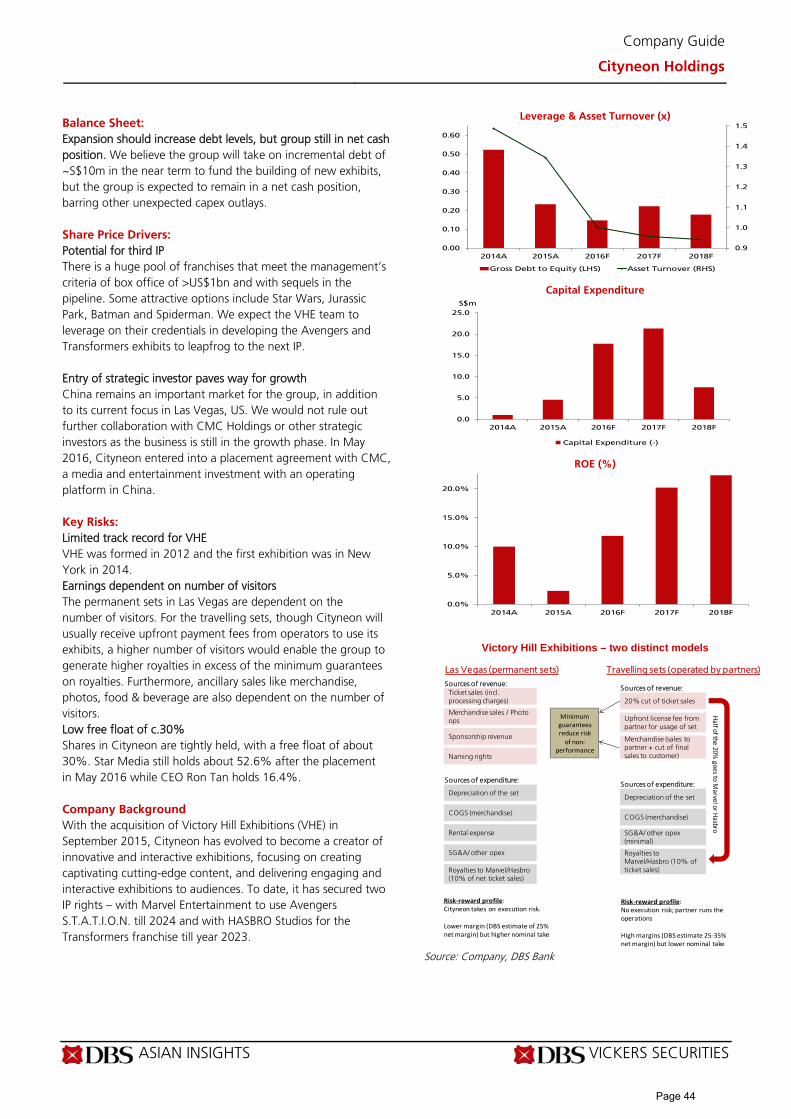
ASIAN INSIGHTS VICKERS SECURITIES Page 3
Company Guide
Cityneon Holdings
Balance Sheet:
Expansion should increase debt levels, but group still in net cash position. We believe the group will take on incremental debt of ~S$10m in the near term to fund the building of new exhibits, but the group is expected to remain in a net cash position, barring other unexpected capex outlays. Share Price Drivers:
Potential for third IP There is a huge pool of franchises that meet the management’s criteria of box office of >US$1bn and with sequels in the pipeline. Some attractive options include Star Wars, Jurassic Park, Batman and Spiderman. We expect the VHE team to leverage on their credentials in developing the Avengers and Transformers exhibits to leapfrog to the next IP. Entry of strategic investor paves way for growth China remains an important market for the group, in addition to its current focus in Las Vegas, US. We would not rule out further collaboration with CMC Holdings or other strategic investors as the business is still in the growth phase. In May 2016, Cityneon entered into a placement agreement with CMC, a media and entertainment investment with an operating platform in China. Key Risks:
Limited track record for VHE VHE was formed in 2012 and the first exhibition was in New York in 2014. Earnings dependent on number of visitors The permanent sets in Las Vegas are dependent on the number of visitors. For the travelling sets, though Cityneon will usually receive upfront payment fees from operators to use its exhibits, a higher number of visitors would enable the group to generate higher royalties in excess of the minimum guarantees on royalties. Furthermore, ancillary sales like merchandise, photos, food & beverage are also dependent on the number of visitors. Low free float of c.30% Shares in Cityneon are tightly held, with a free float of about 30%. Star Media still holds about 52.6% after the placement in May 2016 while CEO Ron Tan holds 16.4%. Company Background
With the acquisition of Victory Hill Exhibitions (VHE) in September 2015, Cityneon has evolved to become a creator of innovative and interactive exhibitions, focusing on creating captivating cutting-edge content, and delivering engaging and interactive exhibitions to audiences. To date, it has secured two IP rights – with Marvel Entertainment to use Avengers S.T.A.T.I.O.N. till 2024 and with HASBRO Studios for the Transformers franchise till year 2023.
Leverage & Asset Turnover (x)
Capital Expenditure
ROE (%)
Victory Hill Exhibitions – two distinct models
Source: Company, DBS Bank
0.9
1.0
1.1
1.2
1.3
1.4
1.5
0.00
0.10
0.20
0.30
0.40
0.50
0.60
2014A 2015A 2016F 2017F 2018F
Gross Debt to Equity (LHS) Asset Turnover (RHS)
0.0
5.0
10.0
15.0
20.0
25.0
2014A 2015A 2016F 2017F 2018F
Capital Expenditure (-)
S$m
0.0%
5.0%
10.0%
15.0%
20.0%
2014A 2015A 2016F 2017F 2018F
Las Vegas (permanent sets)
Ticket sales (incl. processing charges)
Merchandise sales / Photo ops
Sponsorship revenue
Naming rights
Sources of revenue:
Depreciation of the set
Sources of expenditure:
COGS (merchandise)
Rental expense
SG&A/ other opex
Royalties to Marvel/Hasbro (10% of net ticket sales)
Travelling sets (operated by partners)
20% cut of ticket sales
Upfront license fee from partner for usage of set
Merchandise (sales to partner + cut of final sales to customer)
Sources of revenue:
Depreciation of the set
Sources of expenditure:
COGS (merchandise)
SG&A/ other opex(minimal)
Royalties to Marvel/Hasbro (10% of ticket sales)
Half of the 20%
goes to Marvel or H
asbro
Risk‐reward profile:No execution risk; partner runs the operations
High margins (DBS estimate 25‐35% net margin) but lower nominal take
Risk‐reward profile:Cityneon takes on execution risk.
Lower margin (DBS estimate of 25% net margin) but higher nominal take
Minimum guarantees reduce risk
of non‐performance
Page 44
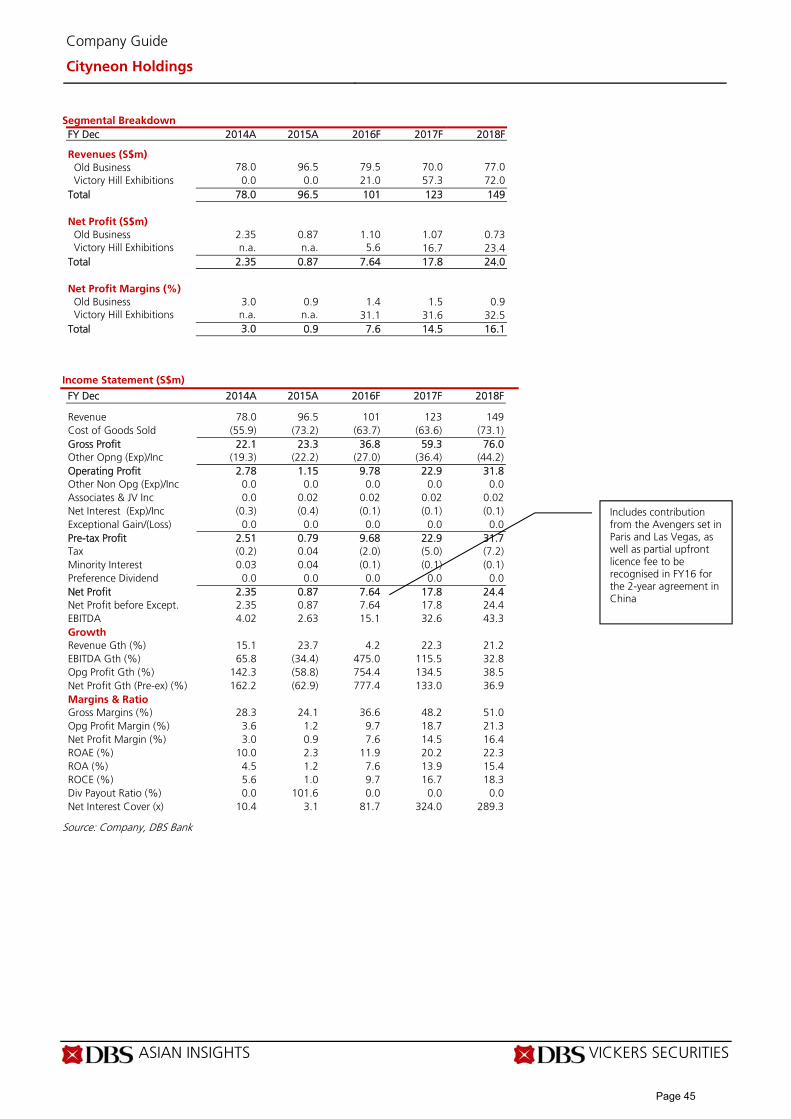
ASIAN INSIGHTS VICKERS SECURITIES Page 4
Company Guide
Cityneon Holdings
Segmental Breakdown
FY Dec 2014A 2015A 2016F 2017F 2018F Revenues (S$m) Old Business 78.0 96.5 79.5 70.0 77.0 Victory Hill Exhibitions 0.0 0.0 21.0 57.3 72.0 Total 78.0 96.5 101 123 149 Net Profit (S$m) Old Business 2.35 0.87 1.10 1.07 0.73 Victory Hill Exhibitions n.a. n.a. 5.6 16.7 23.4 Total 2.35 0.87 7.64 17.8 24.0
Net Profit Margins (%)
Old Business 3.0 0.9 1.4 1.5 0.9 Victory Hill Exhibitions n.a. n.a. 31.1 31.6 32.5 Total 3.0 0.9 7.6 14.5 16.1
Income Statement (S$m)
FY Dec 2014A 2015A 2016F 2017F 2018F Revenue 78.0 96.5 101 123 149 Cost of Goods Sold (55.9) (73.2) (63.7) (63.6) (73.1) Gross Profit 22.1 23.3 36.8 59.3 76.0 Other Opng (Exp)/Inc (19.3) (22.2) (27.0) (36.4) (44.2) Operating Profit 2.78 1.15 9.78 22.9 31.8 Other Non Opg (Exp)/Inc 0.0 0.0 0.0 0.0 0.0 Associates & JV Inc 0.0 0.02 0.02 0.02 0.02 Net Interest (Exp)/Inc (0.3) (0.4) (0.1) (0.1) (0.1) Exceptional Gain/(Loss) 0.0 0.0 0.0 0.0 0.0 Pre-tax Profit 2.51 0.79 9.68 22.9 31.7 Tax (0.2) 0.04 (2.0) (5.0) (7.2) Minority Interest 0.03 0.04 (0.1) (0.1) (0.1) Preference Dividend 0.0 0.0 0.0 0.0 0.0 Net Profit 2.35 0.87 7.64 17.8 24.4 Net Profit before Except. 2.35 0.87 7.64 17.8 24.4 EBITDA 4.02 2.63 15.1 32.6 43.3 Growth Revenue Gth (%) 15.1 23.7 4.2 22.3 21.2 EBITDA Gth (%) 65.8 (34.4) 475.0 115.5 32.8 Opg Profit Gth (%) 142.3 (58.8) 754.4 134.5 38.5 Net Profit Gth (Pre-ex) (%) 162.2 (62.9) 777.4 133.0 36.9 Margins & Ratio Gross Margins (%) 28.3 24.1 36.6 48.2 51.0 Opg Profit Margin (%) 3.6 1.2 9.7 18.7 21.3 Net Profit Margin (%) 3.0 0.9 7.6 14.5 16.4 ROAE (%) 10.0 2.3 11.9 20.2 22.3 ROA (%) 4.5 1.2 7.6 13.9 15.4 ROCE (%) 5.6 1.0 9.7 16.7 18.3 Div Payout Ratio (%) 0.0 101.6 0.0 0.0 0.0 Net Interest Cover (x) 10.4 3.1 81.7 324.0 289.3
Source: Company, DBS Bank
Includes contribution from the Avengers set in Paris and Las Vegas, as well as partial upfront licence fee to be recognised in FY16 for the 2-year agreement in China
Page 45
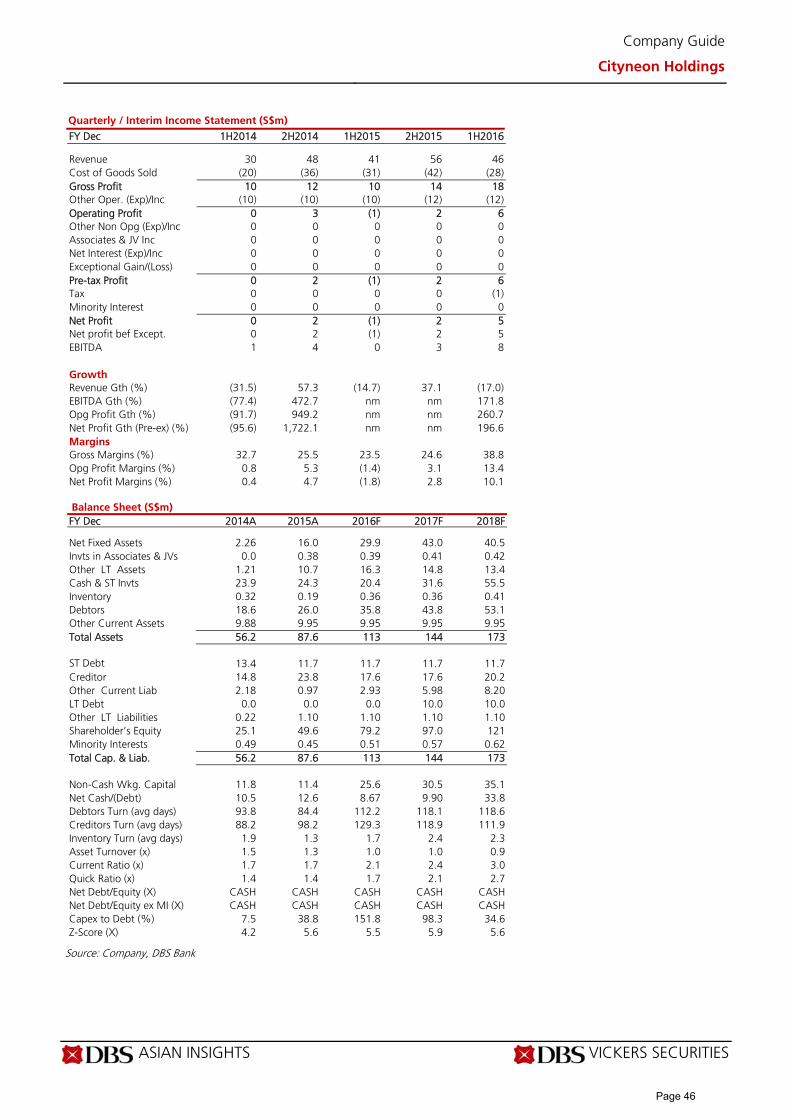
ASIAN INSIGHTS VICKERS SECURITIES Page 5
Company Guide
Cityneon Holdings
Quarterly / Interim Income Statement (S$m)
FY Dec 1H2014 2H2014 1H2015 2H2015 1H2016 Revenue 30 48 41 56 46 Cost of Goods Sold (20) (36) (31) (42) (28) Gross Profit 10 12 10 14 18 Other Oper. (Exp)/Inc (10) (10) (10) (12) (12) Operating Profit 0 3 (1) 2 6 Other Non Opg (Exp)/Inc 0 0 0 0 0 Associates & JV Inc 0 0 0 0 0 Net Interest (Exp)/Inc 0 0 0 0 0 Exceptional Gain/(Loss) 0 0 0 0 0 Pre-tax Profit 0 2 (1) 2 6 Tax 0 0 0 0 (1) Minority Interest 0 0 0 0 0 Net Profit 0 2 (1) 2 5 Net profit bef Except. 0 2 (1) 2 5 EBITDA 1 4 0 3 8 Growth Revenue Gth (%) (31.5) 57.3 (14.7) 37.1 (17.0) EBITDA Gth (%) (77.4) 472.7 nm nm 171.8 Opg Profit Gth (%) (91.7) 949.2 nm nm 260.7 Net Profit Gth (Pre-ex) (%) (95.6) 1,722.1 nm nm 196.6 Margins Gross Margins (%) 32.7 25.5 23.5 24.6 38.8 Opg Profit Margins (%) 0.8 5.3 (1.4) 3.1 13.4 Net Profit Margins (%) 0.4 4.7 (1.8) 2.8 10.1
Balance Sheet (S$m)
FY Dec 2014A 2015A 2016F 2017F 2018F Net Fixed Assets 2.26 16.0 29.9 43.0 40.5 Invts in Associates & JVs 0.0 0.38 0.39 0.41 0.42 Other LT Assets 1.21 10.7 16.3 14.8 13.4 Cash & ST Invts 23.9 24.3 20.4 31.6 55.5 Inventory 0.32 0.19 0.36 0.36 0.41 Debtors 18.6 26.0 35.8 43.8 53.1 Other Current Assets 9.88 9.95 9.95 9.95 9.95 Total Assets 56.2 87.6 113 144 173 ST Debt 13.4 11.7 11.7 11.7 11.7 Creditor 14.8 23.8 17.6 17.6 20.2 Other Current Liab 2.18 0.97 2.93 5.98 8.20 LT Debt 0.0 0.0 0.0 10.0 10.0 Other LT Liabilities 0.22 1.10 1.10 1.10 1.10 Shareholder’s Equity 25.1 49.6 79.2 97.0 121 Minority Interests 0.49 0.45 0.51 0.57 0.62 Total Cap. & Liab. 56.2 87.6 113 144 173 Non-Cash Wkg. Capital 11.8 11.4 25.6 30.5 35.1 Net Cash/(Debt) 10.5 12.6 8.67 9.90 33.8 Debtors Turn (avg days) 93.8 84.4 112.2 118.1 118.6 Creditors Turn (avg days) 88.2 98.2 129.3 118.9 111.9 Inventory Turn (avg days) 1.9 1.3 1.7 2.4 2.3 Asset Turnover (x) 1.5 1.3 1.0 1.0 0.9 Current Ratio (x) 1.7 1.7 2.1 2.4 3.0 Quick Ratio (x) 1.4 1.4 1.7 2.1 2.7 Net Debt/Equity (X) CASH CASH CASH CASH CASH Net Debt/Equity ex MI (X) CASH CASH CASH CASH CASH Capex to Debt (%) 7.5 38.8 151.8 98.3 34.6 Z-Score (X) 4.2 5.6 5.5 5.9 5.6
Source: Company, DBS Bank
Page 46

ASIAN INSIGHTS VICKERS SECURITIES Page 6
Company Guide
Cityneon Holdings
Cash Flow Statement (S$m)
FY Dec 2014A 2015A 2016F 2017F 2018F Pre-Tax Profit 2.51 0.79 9.68 22.9 31.7 Dep. & Amort. 1.24 1.47 5.34 9.66 11.5 Tax Paid 0.03 (0.2) 0.0 (2.0) (5.0) Assoc. & JV Inc/(loss) 0.0 0.0 0.0 0.0 0.0 Chg in Wkg.Cap. 5.85 0.80 (16.1) (8.0) (6.7) Other Operating CF (0.1) 0.07 0.0 0.0 0.0 Net Operating CF 9.55 2.89 (1.1) 22.6 31.4 Capital Exp.(net) (1.0) (4.5) (17.8) (21.3) (7.5) Other Invts.(net) 0.0 (1.1) 0.0 0.0 0.0 Invts in Assoc. & JV 0.0 (0.4) 0.0 0.0 0.0 Div from Assoc & JV 0.0 0.0 0.0 0.0 0.0 Other Investing CF 0.08 (10.0) (7.0) 0.0 0.0 Net Investing CF (0.9) (16.0) (24.8) (21.3) (7.5) Div Paid 0.0 (0.9) 0.0 0.0 0.0 Chg in Gross Debt 0.73 (3.1) 0.0 10.0 0.0 Capital Issues 0.0 15.7 22.0 0.0 0.0 Other Financing CF 0.0 0.87 0.0 0.0 0.0 Net Financing CF 0.69 12.6 22.0 10.0 0.0 Currency Adjustments 0.39 0.85 0.0 0.0 0.0 Chg in Cash 9.71 0.39 (3.9) 11.2 23.9 Opg CFPS (S cts) 4.18 0.95 6.22 12.7 15.8 Free CFPS (S cts) 9.65 (0.7) (7.8) 0.51 9.93
Source: Company, DBS Bank
Target Price & Ratings History
Source: DBS Bank
Analyst: Lee Keng LING
S.No.Date of Report
Closing Price
12-mth Target Price
Rat ing
1: 30 May 16 0.79 1.03 BUY
2: 03 Jun 16 0.85 1.03 BUY
3: 14 Jun 16 0.81 1.05 BUY
4: 29 Jun 16 0.91 1.20 BUY
5: 05 Jul 16 0.95 1.20 BUY
6: 12 Aug 16 1.01 1.37 BUY
7: 15 Aug 16 1.02 1.37 BUY
8: 10 Oct 16 0.93 1.37 BUY
Note : Share price and Target price are adjusted for corporate actions.
1
2
3
4
5
6
78
0.23
0.43
0.63
0.83
1.03
1.23
Dec-15 Apr-16 Aug-16 Dec-16
S$
Assume 7 sets by end-2017 and 8 sets for 2018
Page 47

ASIAN INSIGHTS VICKERS SECURITIES ed: JS / sa:YM, PY
BUY Last Traded Price ( 7 Feb 2017): S$0.435 (STI : 3,071.64) Price Target 12-mth: S$0.51 (17% upside) (Prev S$0.50) Potential Catalyst: Earnings recovery, M&A Where we differ: Higher on better cost management and margins Analyst Alfie YEO +65 6682 3717 [email protected] Andy SIM CFA +65 6682 3718 [email protected]
What’s New 3Q17 results in line, weak revenue offset by
higher margins
Outlook driven by store expansion and better
gross margins
Maintain BUY, TP S$0.51 on 10x FY17/18F earnings
Price Relative
Forecasts and Valuation FY Mar (S$ m) 2016A 2017F 2018F 2019F Revenue 770 750 783 812 EBITDA 68.7 69.0 69.3 71.7 Pre-tax Profit 29.4 34.0 34.7 35.8 Net Profit 20.3 25.7 26.8 27.6 Net Pft (Pre Ex.) 20.4 25.7 26.8 27.6 Net Pft Gth (Pre-ex) (%) 17.3 26.2 4.2 3.1 EPS (S cts) 3.82 4.97 5.18 5.34 EPS Pre Ex. (S cts) 3.84 4.97 5.18 5.34 EPS Gth Pre Ex (%) 22 30 4 3 Diluted EPS (S cts) 3.79 4.95 5.16 5.32 Net DPS (S cts) 1.29 1.65 1.72 1.77 BV Per Share (S cts) 55.8 59.8 63.3 66.8 PE (X) 11.4 8.8 8.4 8.2 PE Pre Ex. (X) 11.3 8.8 8.4 8.2 P/Cash Flow (X) 7.3 10.2 9.6 8.4 EV/EBITDA (X) 6.6 6.5 6.5 6.2 Net Div Yield (%) 3.0 3.8 4.0 4.1 P/Book Value (X) 0.8 0.7 0.7 0.7 Net Debt/Equity (X) 0.8 0.7 0.7 0.6 ROAE (%) 6.9 8.5 8.4 8.2 Earnings Rev (%): 1 3 (1) Consensus EPS (S cts): 4.50 5.00 5.20 Other Broker Recs: B: 2 S: 0 H: 0
Source of all data on this page: Company, DBS Bank, Bloomberg Finance L.P
Tracking expectations Maintain BUY on attractive valuations. We maintain BUY on Courts Asia (Courts) with TP of S$0.51. The company is on track to post core earnings growth of 30% y-o-y on the back of better cost controls, stronger gross margins and lower interest costs. Courts’ store network expansion plans in Indonesia and Malaysia are progressing well, and will benefit from the expected acceleration in GDP growth, and consumer sentiment recovery regionally in 2017. Valuation is compelling at 8x FY18F PE (near -0.5SD of its historical forward PE valuation) and 0.7x P/B. The stock also offers dividend yield of 3.8% for FY17F. Earnings recovery supported by more stores, product margins. Earnings recovery would be led by revenue growth from more new stores, effective cost controls and sustainable improvement in margins. Indonesia’s planned expansion to nine stores by end of FY17F is on track, having opened its Bogor Trade Mall store in December 2017. Malaysia is also moving towards its target of 70 stores by the end of FY17F after opening its Semenyih Store in December. Courts is increasing its bundled services offerings (currently at 6-7% of sales), a bolt on value added service for installation, setup, delivery, extended warranty for electrical, furnishing and IT products sales. This helped gross margins to expand in FY17F. The success of this service should help to support higher gross margins going forward. Valuation:
We maintain BUY as we continue to see value in the stock’s current valuations. Our target price is S$0.51, based on 10x blended FY17/18F PE, pegged to -1SD of its historical average valuation. Key Risks to Our View:
Interest rate increase and regional consumer sentiment. Courts’ credit business is sensitive to changes in interest rates. Interest rate increases would raise working capital financing costs, leading to lower credit yield spreads. As a regional retailer of consumer products, Courts is sensitive to wealth and domestic consumer sentiment changes in the markets where it operates. At A Glance Issued Capital (m shrs) 514 Mkt. Cap (S$m/US$m) 224 / 158 Major Shareholders (%) Singapore Retail Group Ltd (%) 74.3 Teng Lian Ngiek (%) 5.7
Free Float (%) 20.0 3m Avg. Daily Val (US$m) 0.03 ICB Industry : Consumer Services / General Retailers
DBS Group Research . Equity 8 Feb 2017
Singapore Company Guide
Courts Asia Version 5 | Bloomberg: COURTS SP | Reuters: COUR.SI Refer to important disclosures at the end of this report
32
52
72
92
112
132
152
172
192
212
0.3
0.4
0.5
0.6
0.7
0.8
0.9
1.0
1.1
1.2
1.3
Feb-13 Feb-14 Feb-15 Feb-16 Feb-17
Relative IndexS$
Courts Asia (LHS) Relative STI (RHS)
Page 48
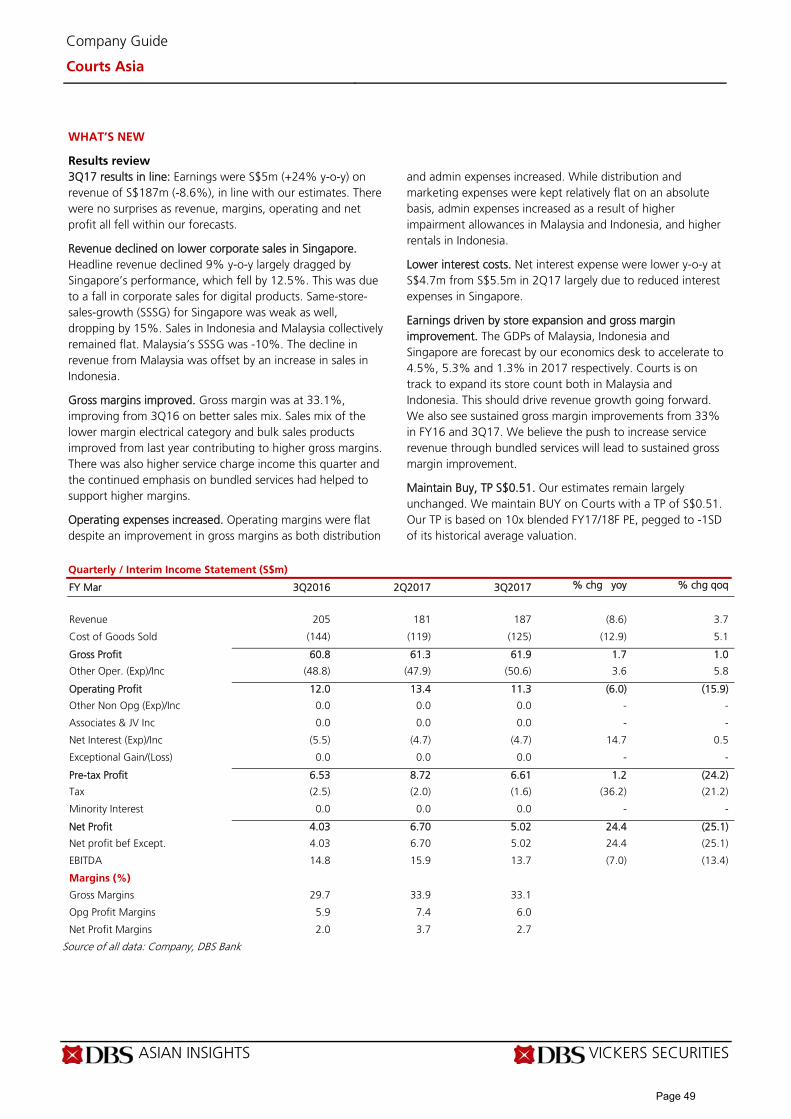
ASIAN INSIGHTS VICKERS SECURITIES Page 2
Company Guide
Courts Asia
WHAT’S NEW
Results review 3Q17 results in line: Earnings were S$5m (+24% y-o-y) on revenue of S$187m (-8.6%), in line with our estimates. There were no surprises as revenue, margins, operating and net profit all fell within our forecasts.
Revenue declined on lower corporate sales in Singapore. Headline revenue declined 9% y-o-y largely dragged by Singapore’s performance, which fell by 12.5%. This was due to a fall in corporate sales for digital products. Same-store-sales-growth (SSSG) for Singapore was weak as well, dropping by 15%. Sales in Indonesia and Malaysia collectively remained flat. Malaysia’s SSSG was -10%. The decline in revenue from Malaysia was offset by an increase in sales in Indonesia.
Gross margins improved. Gross margin was at 33.1%, improving from 3Q16 on better sales mix. Sales mix of the lower margin electrical category and bulk sales products improved from last year contributing to higher gross margins. There was also higher service charge income this quarter and the continued emphasis on bundled services had helped to support higher margins.
Operating expenses increased. Operating margins were flat despite an improvement in gross margins as both distribution
and admin expenses increased. While distribution and marketing expenses were kept relatively flat on an absolute basis, admin expenses increased as a result of higher impairment allowances in Malaysia and Indonesia, and higher rentals in Indonesia.
Lower interest costs. Net interest expense were lower y-o-y at S$4.7m from S$5.5m in 2Q17 largely due to reduced interest expenses in Singapore.
Earnings driven by store expansion and gross margin improvement. The GDPs of Malaysia, Indonesia and Singapore are forecast by our economics desk to accelerate to 4.5%, 5.3% and 1.3% in 2017 respectively. Courts is on track to expand its store count both in Malaysia and Indonesia. This should drive revenue growth going forward. We also see sustained gross margin improvements from 33% in FY16 and 3Q17. We believe the push to increase service revenue through bundled services will lead to sustained gross margin improvement.
Maintain Buy, TP S$0.51. Our estimates remain largely unchanged. We maintain BUY on Courts with a TP of S$0.51. Our TP is based on 10x blended FY17/18F PE, pegged to -1SD of its historical average valuation.
Quarterly / Interim Income Statement (S$m)
FY Mar 3Q2016 2Q2017 3Q2017 % chg yoy % chg qoq
Revenue 205 181 187 (8.6) 3.7
Cost of Goods Sold (144) (119) (125) (12.9) 5.1
Gross Profit 60.8 61.3 61.9 1.7 1.0
Other Oper. (Exp)/Inc (48.8) (47.9) (50.6) 3.6 5.8
Operating Profit 12.0 13.4 11.3 (6.0) (15.9)
Other Non Opg (Exp)/Inc 0.0 0.0 0.0 - -
Associates & JV Inc 0.0 0.0 0.0 - -
Net Interest (Exp)/Inc (5.5) (4.7) (4.7) 14.7 0.5
Exceptional Gain/(Loss) 0.0 0.0 0.0 - -
Pre-tax Profit 6.53 8.72 6.61 1.2 (24.2)
Tax (2.5) (2.0) (1.6) (36.2) (21.2)
Minority Interest 0.0 0.0 0.0 - -
Net Profit 4.03 6.70 5.02 24.4 (25.1)
Net profit bef Except. 4.03 6.70 5.02 24.4 (25.1)
EBITDA 14.8 15.9 13.7 (7.0) (13.4)
Margins (%)
Gross Margins 29.7 33.9 33.1
Opg Profit Margins 5.9 7.4 6.0
Net Profit Margins 2.0 3.7 2.7
Source of all data: Company, DBS Bank
Page 49
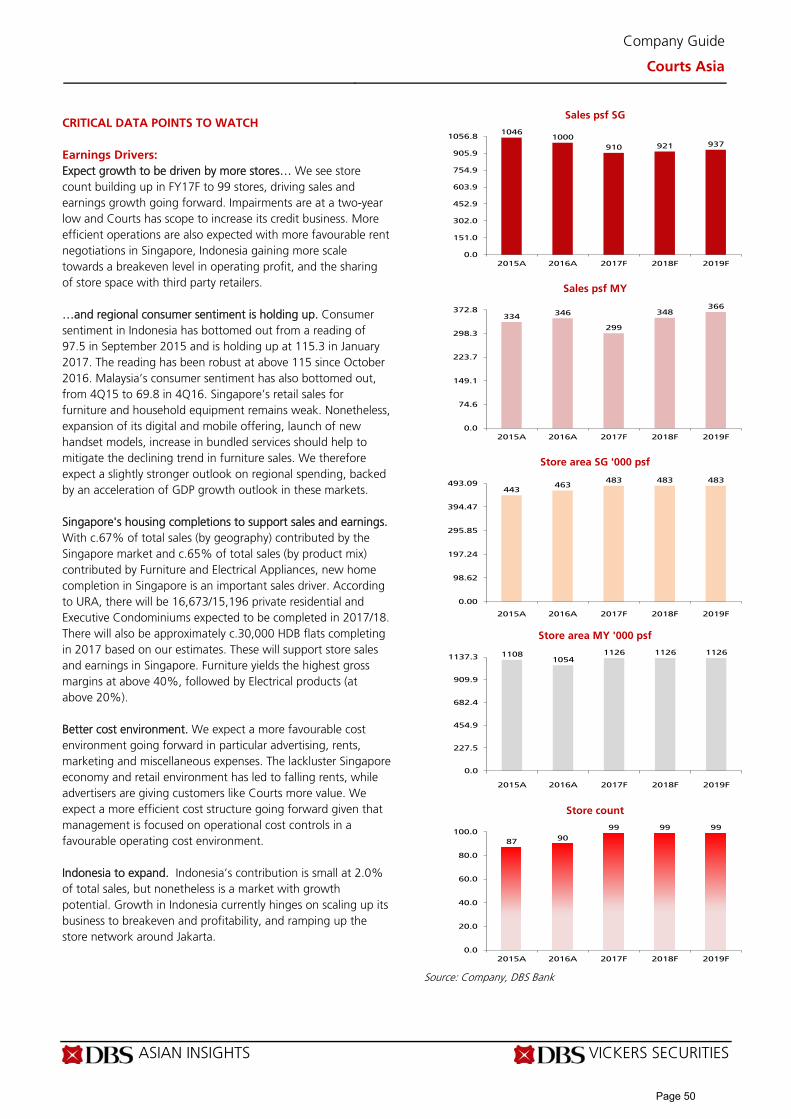
ASIAN INSIGHTS VICKERS SECURITIES Page 3
Company Guide
Courts Asia
CRITICAL DATA POINTS TO WATCH
Earnings Drivers:
Expect growth to be driven by more stores… We see store count building up in FY17F to 99 stores, driving sales and earnings growth going forward. Impairments are at a two-year low and Courts has scope to increase its credit business. More efficient operations are also expected with more favourable rent negotiations in Singapore, Indonesia gaining more scale towards a breakeven level in operating profit, and the sharing of store space with third party retailers. …and regional consumer sentiment is holding up. Consumer sentiment in Indonesia has bottomed out from a reading of 97.5 in September 2015 and is holding up at 115.3 in January 2017. The reading has been robust at above 115 since October 2016. Malaysia’s consumer sentiment has also bottomed out, from 4Q15 to 69.8 in 4Q16. Singapore’s retail sales for furniture and household equipment remains weak. Nonetheless, expansion of its digital and mobile offering, launch of new handset models, increase in bundled services should help to mitigate the declining trend in furniture sales. We therefore expect a slightly stronger outlook on regional spending, backed by an acceleration of GDP growth outlook in these markets. Singapore's housing completions to support sales and earnings. With c.67% of total sales (by geography) contributed by the Singapore market and c.65% of total sales (by product mix) contributed by Furniture and Electrical Appliances, new home completion in Singapore is an important sales driver. According to URA, there will be 16,673/15,196 private residential and Executive Condominiums expected to be completed in 2017/18. There will also be approximately c.30,000 HDB flats completing in 2017 based on our estimates. These will support store sales and earnings in Singapore. Furniture yields the highest gross margins at above 40%, followed by Electrical products (at above 20%). Better cost environment. We expect a more favourable cost environment going forward in particular advertising, rents, marketing and miscellaneous expenses. The lackluster Singapore economy and retail environment has led to falling rents, while advertisers are giving customers like Courts more value. We expect a more efficient cost structure going forward given that management is focused on operational cost controls in a favourable operating cost environment. Indonesia to expand. Indonesia’s contribution is small at 2.0% of total sales, but nonetheless is a market with growth potential. Growth in Indonesia currently hinges on scaling up its business to breakeven and profitability, and ramping up the store network around Jakarta.
Sales psf SG
Sales psf MY
Store area SG '000 psf
Store area MY '000 psf
Store count
Source: Company, DBS Bank
10461000
910 921 937
0.0
151.0
302.0
452.9
603.9
754.9
905.9
1056.8
2015A 2016A 2017F 2018F 2019F
334346
299
348366
0.0
74.6
149.1
223.7
298.3
372.8
2015A 2016A 2017F 2018F 2019F
443463
483 483 483
0.00
98.62
197.24
295.85
394.47
493.09
2015A 2016A 2017F 2018F 2019F
11081054
1126 1126 1126
0.0
227.5
454.9
682.4
909.9
1137.3
2015A 2016A 2017F 2018F 2019F
8790
99 99 99
0.0
20.0
40.0
60.0
80.0
100.0
2015A 2016A 2017F 2018F 2019F
Page 50
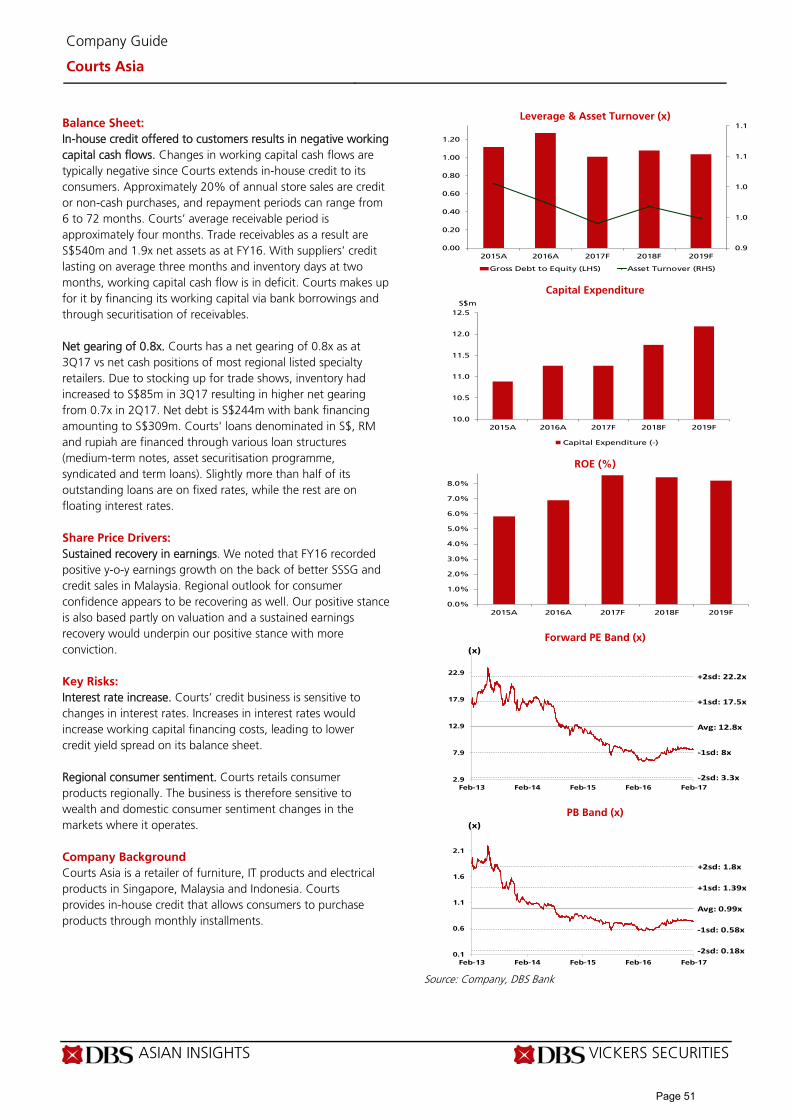
ASIAN INSIGHTS VICKERS SECURITIES Page 4
Company Guide
Courts Asia
Balance Sheet:
In-house credit offered to customers results in negative working capital cash flows. Changes in working capital cash flows are typically negative since Courts extends in-house credit to its consumers. Approximately 20% of annual store sales are credit or non-cash purchases, and repayment periods can range from 6 to 72 months. Courts’ average receivable period is approximately four months. Trade receivables as a result are S$540m and 1.9x net assets as at FY16. With suppliers’ credit lasting on average three months and inventory days at two months, working capital cash flow is in deficit. Courts makes up for it by financing its working capital via bank borrowings and through securitisation of receivables. Net gearing of 0.8x. Courts has a net gearing of 0.8x as at 3Q17 vs net cash positions of most regional listed specialty retailers. Due to stocking up for trade shows, inventory had increased to S$85m in 3Q17 resulting in higher net gearing from 0.7x in 2Q17. Net debt is S$244m with bank financing amounting to S$309m. Courts' loans denominated in S$, RM and rupiah are financed through various loan structures (medium-term notes, asset securitisation programme, syndicated and term loans). Slightly more than half of its outstanding loans are on fixed rates, while the rest are on floating interest rates. Share Price Drivers:
Sustained recovery in earnings. We noted that FY16 recorded positive y-o-y earnings growth on the back of better SSSG and credit sales in Malaysia. Regional outlook for consumer confidence appears to be recovering as well. Our positive stance is also based partly on valuation and a sustained earnings recovery would underpin our positive stance with more conviction. Key Risks:
Interest rate increase. Courts’ credit business is sensitive to changes in interest rates. Increases in interest rates would increase working capital financing costs, leading to lower credit yield spread on its balance sheet. Regional consumer sentiment. Courts retails consumer products regionally. The business is therefore sensitive to wealth and domestic consumer sentiment changes in the markets where it operates. Company Background
Courts Asia is a retailer of furniture, IT products and electrical products in Singapore, Malaysia and Indonesia. Courts provides in-house credit that allows consumers to purchase products through monthly installments.
Leverage & Asset Turnover (x)
Capital Expenditure
ROE (%)
Forward PE Band (x)
PB Band (x)
Source: Company, DBS Bank
0.9
1.0
1.0
1.1
1.1
0.00
0.20
0.40
0.60
0.80
1.00
1.20
2015A 2016A 2017F 2018F 2019F
Gross Debt to Equity (LHS) Asset Turnover (RHS)
10.0
10.5
11.0
11.5
12.0
12.5
2015A 2016A 2017F 2018F 2019F
Capital Expenditure (-)
S$m
0.0%
1.0%
2.0%
3.0%
4.0%
5.0%
6.0%
7.0%
8.0%
2015A 2016A 2017F 2018F 2019F
Avg: 12.8x
+1sd: 17.5x
+2sd: 22.2x
‐1sd: 8x
‐2sd: 3.3x2.9
7.9
12.9
17.9
22.9
Feb-13 Feb-14 Feb-15 Feb-16 Feb-17
(x)
Avg: 0.99x
+1sd: 1.39x
+2sd: 1.8x
‐1sd: 0.58x
‐2sd: 0.18x0.1
0.6
1.1
1.6
2.1
Feb-13 Feb-14 Feb-15 Feb-16 Feb-17
(x)
Page 51
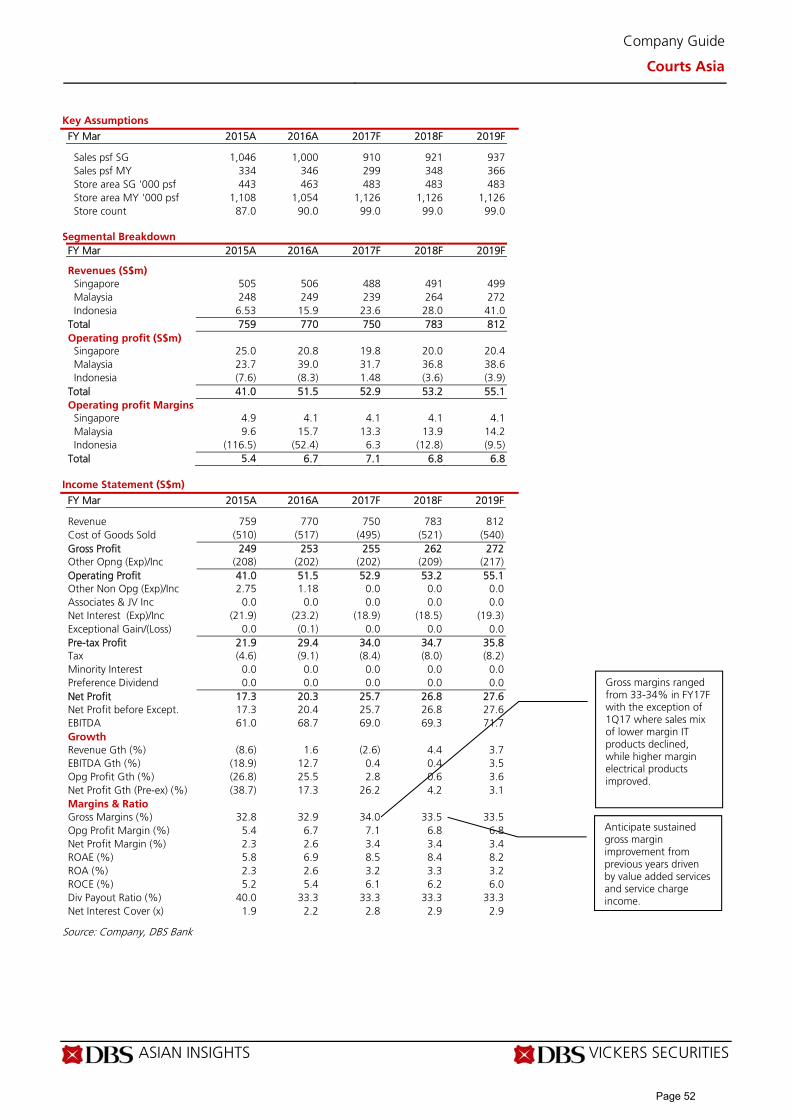
ASIAN INSIGHTS VICKERS SECURITIES Page 5
Company Guide
Courts Asia
Key Assumptions
FY Mar 2015A 2016A 2017F 2018F 2019F Sales psf SG 1,046 1,000 910 921 937 Sales psf MY 334 346 299 348 366 Store area SG '000 psf 443 463 483 483 483 Store area MY '000 psf 1,108 1,054 1,126 1,126 1,126 Store count 87.0 90.0 99.0 99.0 99.0
Segmental Breakdown
FY Mar 2015A 2016A 2017F 2018F 2019F Revenues (S$m) Singapore 505 506 488 491 499 Malaysia 248 249 239 264 272 Indonesia 6.53 15.9 23.6 28.0 41.0 Total 759 770 750 783 812 Operating profit (S$m)
Singapore 25.0 20.8 19.8 20.0 20.4 Malaysia 23.7 39.0 31.7 36.8 38.6 Indonesia (7.6) (8.3) 1.48 (3.6) (3.9) Total 41.0 51.5 52.9 53.2 55.1 Operating profit Margins Singapore 4.9 4.1 4.1 4.1 4.1 Malaysia 9.6 15.7 13.3 13.9 14.2 Indonesia (116.5) (52.4) 6.3 (12.8) (9.5) Total 5.4 6.7 7.1 6.8 6.8
Income Statement (S$m)
FY Mar 2015A 2016A 2017F 2018F 2019F Revenue 759 770 750 783 812 Cost of Goods Sold (510) (517) (495) (521) (540) Gross Profit 249 253 255 262 272 Other Opng (Exp)/Inc (208) (202) (202) (209) (217) Operating Profit 41.0 51.5 52.9 53.2 55.1 Other Non Opg (Exp)/Inc 2.75 1.18 0.0 0.0 0.0 Associates & JV Inc 0.0 0.0 0.0 0.0 0.0 Net Interest (Exp)/Inc (21.9) (23.2) (18.9) (18.5) (19.3) Exceptional Gain/(Loss) 0.0 (0.1) 0.0 0.0 0.0 Pre-tax Profit 21.9 29.4 34.0 34.7 35.8 Tax (4.6) (9.1) (8.4) (8.0) (8.2) Minority Interest 0.0 0.0 0.0 0.0 0.0 Preference Dividend 0.0 0.0 0.0 0.0 0.0 Net Profit 17.3 20.3 25.7 26.8 27.6 Net Profit before Except. 17.3 20.4 25.7 26.8 27.6 EBITDA 61.0 68.7 69.0 69.3 71.7 Growth Revenue Gth (%) (8.6) 1.6 (2.6) 4.4 3.7 EBITDA Gth (%) (18.9) 12.7 0.4 0.4 3.5 Opg Profit Gth (%) (26.8) 25.5 2.8 0.6 3.6 Net Profit Gth (Pre-ex) (%) (38.7) 17.3 26.2 4.2 3.1 Margins & Ratio Gross Margins (%) 32.8 32.9 34.0 33.5 33.5 Opg Profit Margin (%) 5.4 6.7 7.1 6.8 6.8 Net Profit Margin (%) 2.3 2.6 3.4 3.4 3.4 ROAE (%) 5.8 6.9 8.5 8.4 8.2 ROA (%) 2.3 2.6 3.2 3.3 3.2 ROCE (%) 5.2 5.4 6.1 6.2 6.0 Div Payout Ratio (%) 40.0 33.3 33.3 33.3 33.3 Net Interest Cover (x) 1.9 2.2 2.8 2.9 2.9
Source: Company, DBS Bank
Gross margins ranged from 33-34% in FY17F with the exception of 1Q17 where sales mix of lower margin IT products declined, while higher margin electrical products improved.
Anticipate sustained gross margin improvement from previous years driven by value added services and service charge income.
Page 52

ASIAN INSIGHTS VICKERS SECURITIES Page 6
Company Guide
Courts Asia
Quarterly / Interim Income Statement (S$m)
FY Mar 3Q2016 4Q2016 1Q2017 2Q2017 3Q2017 Revenue 205 181 196 181 187 Cost of Goods Sold (144) (123) (125) (119) (125) Gross Profit 60.8 58.3 70.9 61.3 61.9 Other Oper. (Exp)/Inc (48.8) (48.0) (53.1) (47.9) (50.6) Operating Profit 12.0 10.3 17.7 13.4 11.3 Other Non Opg (Exp)/Inc 0.0 0.0 0.0 0.0 0.0 Associates & JV Inc 0.0 0.0 0.0 0.0 0.0 Net Interest (Exp)/Inc (5.5) (4.9) (4.9) (4.7) (4.7) Exceptional Gain/(Loss) 0.0 0.0 0.0 0.0 0.0 Pre-tax Profit 6.53 5.40 12.8 8.72 6.61 Tax (2.5) (1.2) (3.4) (2.0) (1.6) Minority Interest 0.0 0.0 0.0 0.0 0.0 Net Profit 4.03 4.18 9.42 6.70 5.02 Net profit bef Except. 4.03 4.18 9.46 6.70 5.02 EBITDA 14.8 12.9 20.5 15.9 13.7 Growth Revenue Gth (%) 10.0 (11.4) 8.3 (8.0) 3.7 EBITDA Gth (%) (18.1) (12.6) 58.4 (22.5) (13.4) Opg Profit Gth (%) (21.8) (14.3) 72.8 (24.5) (15.9) Net Profit Gth (Pre-ex) (%) (33.0) 3.7 126.1 (29.2) (25.1) Margins Gross Margins (%) 29.7 32.1 36.1 33.9 33.1 Opg Profit Margins (%) 5.9 5.7 9.0 7.4 6.0 Net Profit Margins (%) 2.0 2.3 4.8 3.7 2.7
Balance Sheet (S$m)
FY Mar 2015A 2016A 2017F 2018F 2019F Net Fixed Assets 26.8 24.8 22.6 21.0 19.4 Invts in Associates & JVs 0.0 0.0 0.0 0.0 0.0 Other LT Assets 274 320 312 322 330 Cash & ST Invts 114 148 88.4 130 138 Inventory 83.6 77.8 85.3 89.9 93.2 Debtors 260 249 267 279 289 Other Current Assets 3.04 0.43 0.43 0.43 0.43 Total Assets 762 819 776 842 870 ST Debt 4.01 131 20.0 20.0 20.0 Creditor 122 139 138 145 151 Other Current Liab 4.02 6.13 6.13 6.13 6.13 LT Debt 328 240 292 333 338 Other LT Liabilities 7.09 11.0 11.0 11.0 11.0 Shareholder’s Equity 297 292 309 327 345 Minority Interests 0.0 0.0 0.0 0.0 0.0 Total Cap. & Liab. 762 819 776 842 870 Non-Cash Wkg. Capital 221 182 209 218 226 Net Cash/(Debt) (217) (224) (224) (223) (219) Debtors Turn (avg days) 117.5 120.7 125.6 127.3 127.7 Creditors Turn (avg days) 92.5 95.2 105.6 102.3 103.1 Inventory Turn (avg days) 64.3 58.8 62.2 63.3 63.8 Asset Turnover (x) 1.0 1.0 0.9 1.0 0.9 Current Ratio (x) 3.5 1.7 2.7 2.9 2.9 Quick Ratio (x) 2.9 1.4 2.2 2.4 2.4 Net Debt/Equity (X) 0.7 0.8 0.7 0.7 0.6 Net Debt/Equity ex MI (X) 0.7 0.8 0.7 0.7 0.6 Capex to Debt (%) 3.3 3.0 3.6 3.3 3.4 Z-Score (X) 2.1 1.8 2.1 2.0 2.1
Source: Company, DBS Bank
Driven by better higher margin electrical products improved.
Page 53
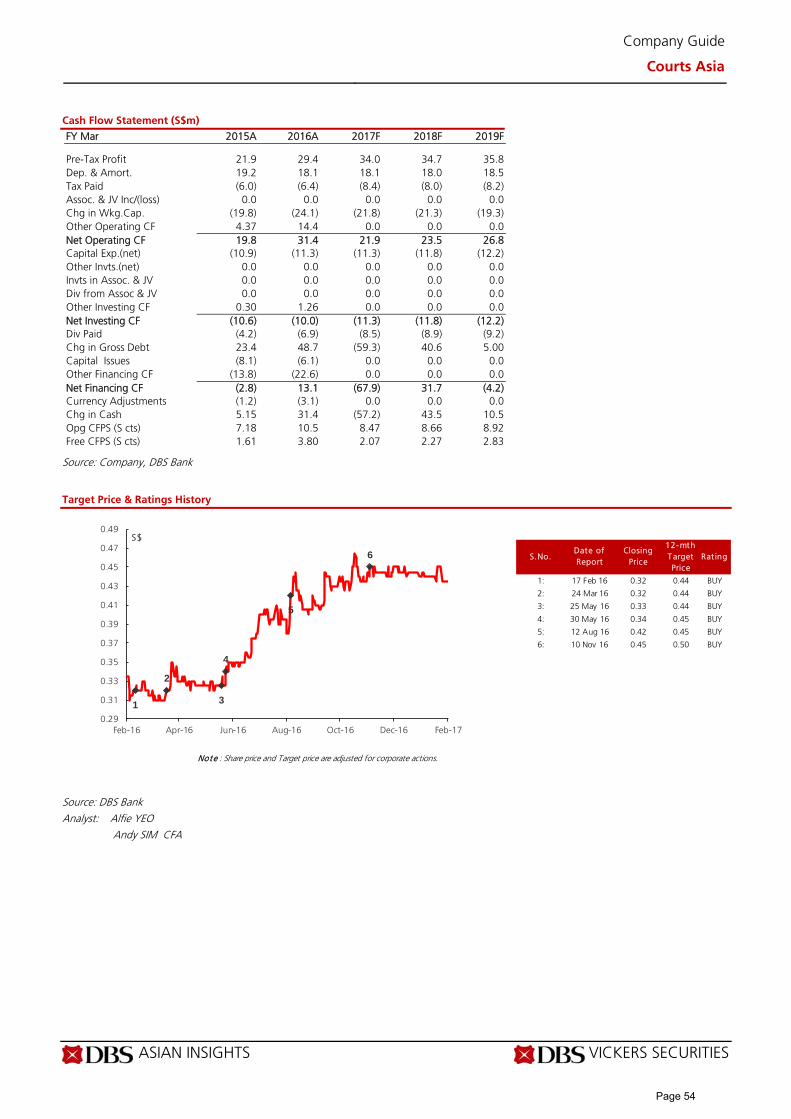
ASIAN INSIGHTS VICKERS SECURITIES Page 7
Company Guide
Courts Asia
Cash Flow Statement (S$m)
FY Mar 2015A 2016A 2017F 2018F 2019F Pre-Tax Profit 21.9 29.4 34.0 34.7 35.8 Dep. & Amort. 19.2 18.1 18.1 18.0 18.5 Tax Paid (6.0) (6.4) (8.4) (8.0) (8.2) Assoc. & JV Inc/(loss) 0.0 0.0 0.0 0.0 0.0 Chg in Wkg.Cap. (19.8) (24.1) (21.8) (21.3) (19.3) Other Operating CF 4.37 14.4 0.0 0.0 0.0 Net Operating CF 19.8 31.4 21.9 23.5 26.8 Capital Exp.(net) (10.9) (11.3) (11.3) (11.8) (12.2) Other Invts.(net) 0.0 0.0 0.0 0.0 0.0 Invts in Assoc. & JV 0.0 0.0 0.0 0.0 0.0 Div from Assoc & JV 0.0 0.0 0.0 0.0 0.0 Other Investing CF 0.30 1.26 0.0 0.0 0.0 Net Investing CF (10.6) (10.0) (11.3) (11.8) (12.2) Div Paid (4.2) (6.9) (8.5) (8.9) (9.2) Chg in Gross Debt 23.4 48.7 (59.3) 40.6 5.00 Capital Issues (8.1) (6.1) 0.0 0.0 0.0 Other Financing CF (13.8) (22.6) 0.0 0.0 0.0 Net Financing CF (2.8) 13.1 (67.9) 31.7 (4.2) Currency Adjustments (1.2) (3.1) 0.0 0.0 0.0 Chg in Cash 5.15 31.4 (57.2) 43.5 10.5 Opg CFPS (S cts) 7.18 10.5 8.47 8.66 8.92 Free CFPS (S cts) 1.61 3.80 2.07 2.27 2.83
Source: Company, DBS Bank
Target Price & Ratings History
Source: DBS Bank
Analyst: Alfie YEO
Andy SIM CFA
S.No.Date of Report
Closing Price
12-mth Target Price
Rat ing
1: 17 Feb 16 0.32 0.44 BUY
2: 24 Mar 16 0.32 0.44 BUY
3: 25 May 16 0.33 0.44 BUY
4: 30 May 16 0.34 0.45 BUY
5: 12 Aug 16 0.42 0.45 BUY
6: 10 Nov 16 0.45 0.50 BUY
Note : Share price and Target price are adjusted for corporate actions.
1
2
3
4
5
6
0.29
0.31
0.33
0.35
0.37
0.39
0.41
0.43
0.45
0.47
0.49
Feb-16 Apr-16 Jun-16 Aug-16 Oct-16 Dec-16 Feb-17
S$
Page 54

ASIAN INSIGHTS VICKERS SECURITIES ed: TH / sa: YM, PY
BUY
Last Traded Price ( 6 Feb 2017): S$1.035 (STI : 3,056.91) Price Target 12-mth: S$1.26 (22% upside) (Prev S$1.18) Potential Catalyst: Consistent 4Q16 earnings delivery Where we differ: N/A Analyst Ben SANTOSO +65 6682 3707 [email protected]
What’s New FY16F/17F earnings revised by +2%/-9%
4Q16 earnings to sequentially moderate 24% on seasonally lower DOC breeding, feed margins
Reduced JPFA's contribution to flatten EBITDA growth, driven by rising contributions from Dairy/Animal Protein outside Indonesia
BUY rating reiterated
Price Relative
Forecasts and Valuation FY Dec (US$m) 2015A 2016F 2017F 2018F Revenue 2,787 3,028 3,202 3,449 EBITDA 292 444 448 537 Pre-tax Profit 112 315 298 401 Net Profit 64.7 153 148 206 Net Pft (ex. BA gains) 64.0 153 148 206 Net Pft (Pre Ex.) 70.3 153 148 206 Net Pft Gth (Pre-ex) (%) (1.5) 118.2 (3.3) 39.0 EPS (S cts) 5.16 12.2 11.8 16.5 EPS Pre Ex. (S cts) 5.61 12.2 11.8 16.5 EPS Gth Pre Ex (%) (2) 118 (3) 39 Diluted EPS (S cts) 5.16 12.2 11.8 16.5 Net DPS (S cts) 0.0 0.0 0.0 0.0 BV Per Share (S cts) 53.5 65.8 77.6 94.1 PE (X) 20.0 8.4 8.7 6.3 PE Pre Ex. (X) 18.4 8.4 8.7 6.3 P/Cash Flow (X) 5.1 6.6 5.4 3.7 EV/EBITDA (X) 8.0 5.4 5.5 4.6 Net Div Yield (%) 0.0 0.0 0.0 0.0 P/Book Value (X) 1.9 1.6 1.3 1.1 Net Debt/Equity (X) 0.7 0.4 0.4 0.2 ROAE (%) 9.7 20.5 16.5 19.2 Earnings Rev (%): 2 (9) 29 Consensus EPS (S cts): 11.6 12.8 13.4 Other Broker Recs: B: 2 S: 0 H: 0
Source of all data on this page: Company, DBS Bank, Bloomberg Finance L.P.
Benefitting from diversified model Attractive valuation. Japfa Limited (JAP) is involved in all major animal proteins across different geographies in Asia. It currently trades at a significant discount to its sum-of-parts valuation despite delivering consistent earnings growth from Indonesia, China, Vietnam, Myanmar and India, where per capita demand for dairy, animal protein and branded consumer food is rising. JAP’s FY16F-18F EBITDA CAGR of 10% justifies implied 6.3x forward EV/EBITDA multiple. FY16F/17F earnings adjusted by +2%/-9%. On expectations of stable prices in Indonesia this year, we trimmed day-old-chick (DOC) and live broiler ASP; adjusted local corn costs higher, and imputed slightly weaker Rupiah vis-à-vis our previous forecasts. We expect Japfa Comfeed's (JPFA) FY17F EBITDA contribution to moderate, as feed margins normalise. We also reduced Diary's FY17F EBITDA slightly on lower expected volumes; as we believe our previous forecasts were too aggressive. Insignificant changes were applied to FY17F EBITDA contributions from Animal Protein outside Indonesia and Consumer Products. BUY rating reiterated for 22% upside. JAP’s diversified business model makes its EBITDA growth delivery more resilient than JPFA. Following a 55% EBITDA growth in FY16F, JAP’s FY17F EBITDA should expand 1%. This will be driven by rising contribution in Animal Protein outside Indonesia, Dairy and Consumer Food segments – offset by lower contribution from JPFA (in the absence of cheaper feed wheat feedstock and gains from sale of Australian cattle ranch). Valuation:
Changes to our forecasts trimmed the counter’s EV by 4% but also lowered net debt by 17% – resulting in a 2% increase in equity value to US$0.87/share. Our SOP-based TP (pegged to FY17F EV/EBITDA) is likewise raised to S$1.26 after imputing stronger US Dollar exchange rate. Key Risks to Our View:
JAP’s share price is driven by DOC, broiler and swine prices as well as China raw milk price movements and the USD/IDR exchange rate. A strong recovery in the group’s ASP and/or Rupiah would boost JAP’s share price higher than our fair value, and vice versa. At A Glance Issued Capital (m shrs) 1,765 Mkt. Cap (S$m/US$m) 1,826 / 1,295 Major Shareholders (%) Rangi Management Limited 52.6 Morze International Limited 16.0 Tasburgh Limited 7.2
Free Float (%) 24.2 3m Avg. Daily Val (US$m) 1.5 ICB Industry : Consumer Goods / Food Producers
DBS Group Research . Equity 10 Feb 2017
Singapore Company Guide
Japfa Ltd Version 9 | Bloomberg: JAP SP | Reuters: JAPF.SI Refer to important disclosures at the end of this report
32
52
72
92
112
132
152
172
192
212
0.3
0.4
0.5
0.6
0.7
0.8
0.9
1.0
1.1
1.2
Aug-14 Feb-15 Aug-15 Feb-16 Aug-16
Relative IndexS$
Page 55
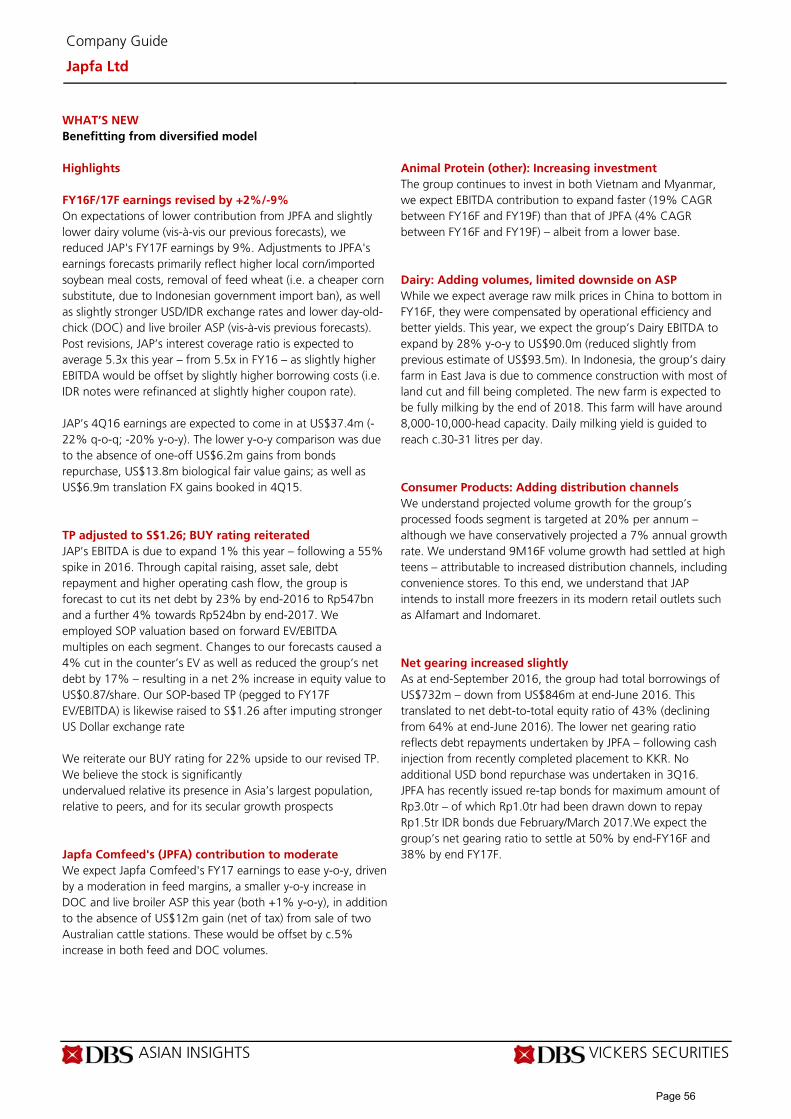
ASIAN INSIGHTS VICKERS SECURITIES Page 2
Company Guide
Japfa Ltd
WHAT’S NEW
Benefitting from diversified model Highlights
FY16F/17F earnings revised by +2%/-9% On expectations of lower contribution from JPFA and slightly lower dairy volume (vis-à-vis our previous forecasts), we reduced JAP's FY17F earnings by 9%. Adjustments to JPFA's earnings forecasts primarily reflect higher local corn/imported soybean meal costs, removal of feed wheat (i.e. a cheaper corn substitute, due to Indonesian government import ban), as well as slightly stronger USD/IDR exchange rates and lower day-old-chick (DOC) and live broiler ASP (vis-à-vis previous forecasts). Post revisions, JAP’s interest coverage ratio is expected to average 5.3x this year – from 5.5x in FY16 – as slightly higher EBITDA would be offset by slightly higher borrowing costs (i.e. IDR notes were refinanced at slightly higher coupon rate). JAP’s 4Q16 earnings are expected to come in at US$37.4m (-22% q-o-q; -20% y-o-y). The lower y-o-y comparison was due to the absence of one-off US$6.2m gains from bonds repurchase, US$13.8m biological fair value gains; as well as US$6.9m translation FX gains booked in 4Q15.
TP adjusted to S$1.26; BUY rating reiterated
JAP’s EBITDA is due to expand 1% this year – following a 55% spike in 2016. Through capital raising, asset sale, debt repayment and higher operating cash flow, the group is forecast to cut its net debt by 23% by end-2016 to Rp547bn and a further 4% towards Rp524bn by end-2017. We employed SOP valuation based on forward EV/EBITDA multiples on each segment. Changes to our forecasts caused a 4% cut in the counter’s EV as well as reduced the group’s net debt by 17% – resulting in a net 2% increase in equity value to US$0.87/share. Our SOP-based TP (pegged to FY17F EV/EBITDA) is likewise raised to S$1.26 after imputing stronger US Dollar exchange rate We reiterate our BUY rating for 22% upside to our revised TP. We believe the stock is significantly undervalued relative its presence in Asia’s largest population, relative to peers, and for its secular growth prospects
Japfa Comfeed's (JPFA) contribution to moderate
We expect Japfa Comfeed's FY17 earnings to ease y-o-y, driven by a moderation in feed margins, a smaller y-o-y increase in DOC and live broiler ASP this year (both +1% y-o-y), in addition to the absence of US$12m gain (net of tax) from sale of two Australian cattle stations. These would be offset by c.5% increase in both feed and DOC volumes.
Animal Protein (other): Increasing investment
The group continues to invest in both Vietnam and Myanmar, we expect EBITDA contribution to expand faster (19% CAGR between FY16F and FY19F) than that of JPFA (4% CAGR between FY16F and FY19F) – albeit from a lower base.
Dairy: Adding volumes, limited downside on ASP
While we expect average raw milk prices in China to bottom in FY16F, they were compensated by operational efficiency and better yields. This year, we expect the group’s Dairy EBITDA to expand by 28% y-o-y to US$90.0m (reduced slightly from previous estimate of US$93.5m). In Indonesia, the group’s dairy farm in East Java is due to commence construction with most of land cut and fill being completed. The new farm is expected to be fully milking by the end of 2018. This farm will have around 8,000-10,000-head capacity. Daily milking yield is guided to reach c.30-31 litres per day.
Consumer Products: Adding distribution channels
We understand projected volume growth for the group’s processed foods segment is targeted at 20% per annum – although we have conservatively projected a 7% annual growth rate. We understand 9M16F volume growth had settled at high teens – attributable to increased distribution channels, including convenience stores. To this end, we understand that JAP intends to install more freezers in its modern retail outlets such as Alfamart and Indomaret.
Net gearing increased slightly
As at end-September 2016, the group had total borrowings of US$732m – down from US$846m at end-June 2016. This translated to net debt-to-total equity ratio of 43% (declining from 64% at end-June 2016). The lower net gearing ratio reflects debt repayments undertaken by JPFA – following cash injection from recently completed placement to KKR. No additional USD bond repurchase was undertaken in 3Q16. JPFA has recently issued re-tap bonds for maximum amount of Rp3.0tr – of which Rp1.0tr had been drawn down to repay Rp1.5tr IDR bonds due February/March 2017.We expect the group’s net gearing ratio to settle at 50% by end-FY16F and 38% by end FY17F.
Page 56
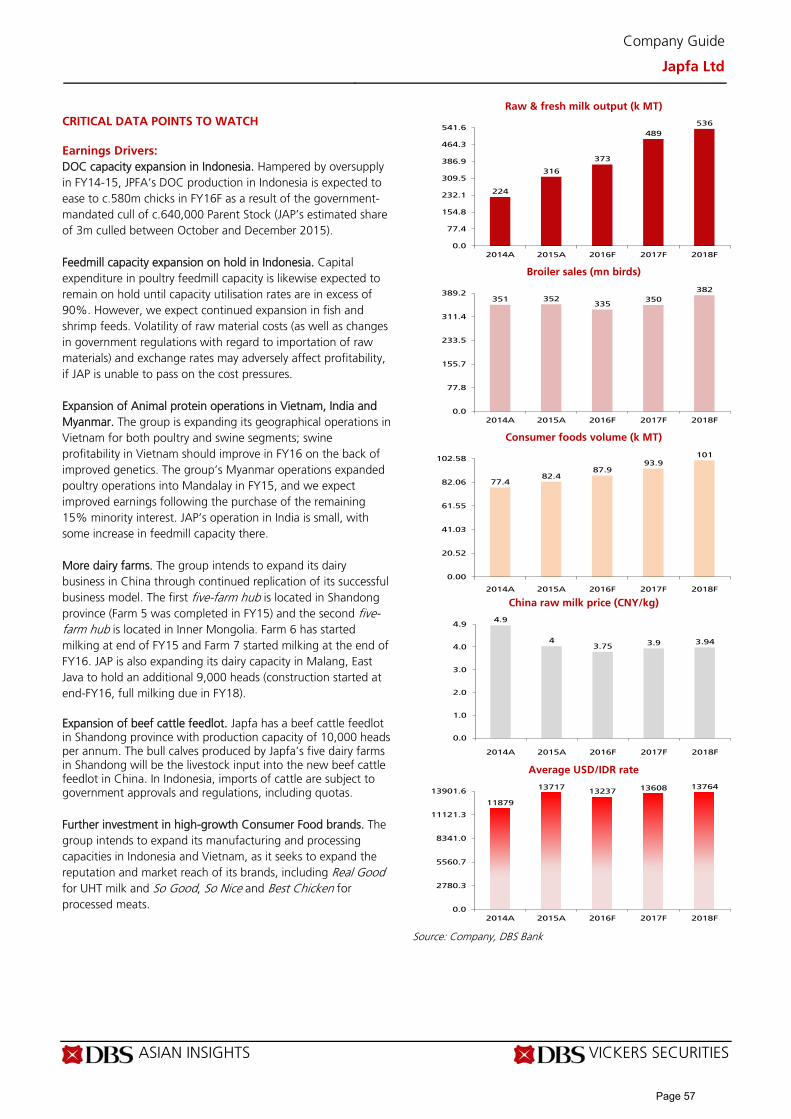
ASIAN INSIGHTS VICKERS SECURITIES Page 3
Company Guide
Japfa Ltd
CRITICAL DATA POINTS TO WATCH Earnings Drivers:
DOC capacity expansion in Indonesia. Hampered by oversupply in FY14-15, JPFA’s DOC production in Indonesia is expected to ease to c.580m chicks in FY16F as a result of the government-mandated cull of c.640,000 Parent Stock (JAP’s estimated share of 3m culled between October and December 2015). Feedmill capacity expansion on hold in Indonesia. Capital expenditure in poultry feedmill capacity is likewise expected to remain on hold until capacity utilisation rates are in excess of 90%. However, we expect continued expansion in fish and shrimp feeds. Volatility of raw material costs (as well as changes in government regulations with regard to importation of raw materials) and exchange rates may adversely affect profitability, if JAP is unable to pass on the cost pressures. Expansion of Animal protein operations in Vietnam, India and Myanmar. The group is expanding its geographical operations in Vietnam for both poultry and swine segments; swine profitability in Vietnam should improve in FY16 on the back of improved genetics. The group’s Myanmar operations expanded poultry operations into Mandalay in FY15, and we expect improved earnings following the purchase of the remaining 15% minority interest. JAP’s operation in India is small, with some increase in feedmill capacity there. More dairy farms. The group intends to expand its dairy business in China through continued replication of its successful business model. The first five-farm hub is located in Shandong province (Farm 5 was completed in FY15) and the second five-farm hub is located in Inner Mongolia. Farm 6 has started milking at end of FY15 and Farm 7 started milking at the end of FY16. JAP is also expanding its dairy capacity in Malang, East Java to hold an additional 9,000 heads (construction started at end-FY16, full milking due in FY18). Expansion of beef cattle feedlot. Japfa has a beef cattle feedlot in Shandong province with production capacity of 10,000 heads per annum. The bull calves produced by Japfa’s five dairy farms in Shandong will be the livestock input into the new beef cattle feedlot in China. In Indonesia, imports of cattle are subject to government approvals and regulations, including quotas. Further investment in high-growth Consumer Food brands. The group intends to expand its manufacturing and processing capacities in Indonesia and Vietnam, as it seeks to expand the reputation and market reach of its brands, including Real Good for UHT milk and So Good, So Nice and Best Chicken for processed meats.
Raw & fresh milk output (k MT)
Broiler sales (mn birds)
Consumer foods volume (k MT)
China raw milk price (CNY/kg)
Average USD/IDR rate
Source: Company, DBS Bank
224
316
373
489
536
0.0
77.4
154.8
232.1
309.5
386.9
464.3
541.6
2014A 2015A 2016F 2017F 2018F
351 352335
350
382
0.0
77.8
155.7
233.5
311.4
389.2
2014A 2015A 2016F 2017F 2018F
77.482.4
87.993.9
101
0.00
20.52
41.03
61.55
82.06
102.58
2014A 2015A 2016F 2017F 2018F
4.9
43.75 3.9 3.94
0.0
1.0
2.0
3.0
4.0
4.9
2014A 2015A 2016F 2017F 2018F
11879
1371713237 13608 13764
0.0
2780.3
5560.7
8341.0
11121.3
13901.6
2014A 2015A 2016F 2017F 2018F
Page 57
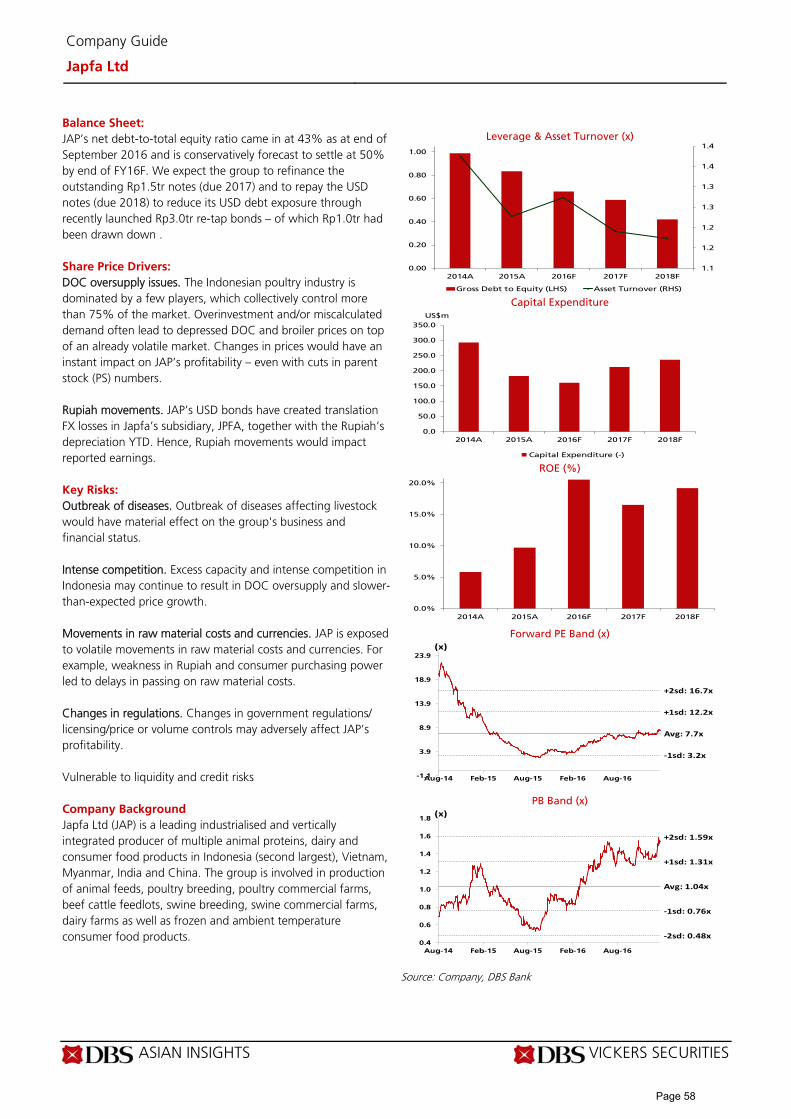
ASIAN INSIGHTS VICKERS SECURITIES Page 4
Company Guide
Japfa Ltd
Balance Sheet:
JAP’s net debt-to-total equity ratio came in at 43% as at end of September 2016 and is conservatively forecast to settle at 50% by end of FY16F. We expect the group to refinance the outstanding Rp1.5tr notes (due 2017) and to repay the USD notes (due 2018) to reduce its USD debt exposure through recently launched Rp3.0tr re-tap bonds – of which Rp1.0tr had been drawn down . Share Price Drivers:
DOC oversupply issues. The Indonesian poultry industry is dominated by a few players, which collectively control more than 75% of the market. Overinvestment and/or miscalculated demand often lead to depressed DOC and broiler prices on top of an already volatile market. Changes in prices would have an instant impact on JAP’s profitability – even with cuts in parent stock (PS) numbers. Rupiah movements. JAP’s USD bonds have created translation FX losses in Japfa’s subsidiary, JPFA, together with the Rupiah’s depreciation YTD. Hence, Rupiah movements would impact reported earnings. Key Risks:
Outbreak of diseases. Outbreak of diseases affecting livestock would have material effect on the group's business and financial status. Intense competition. Excess capacity and intense competition in Indonesia may continue to result in DOC oversupply and slower-than-expected price growth. Movements in raw material costs and currencies. JAP is exposed to volatile movements in raw material costs and currencies. For example, weakness in Rupiah and consumer purchasing power led to delays in passing on raw material costs. Changes in regulations. Changes in government regulations/ licensing/price or volume controls may adversely affect JAP’s profitability. Vulnerable to liquidity and credit risks Company Background
Japfa Ltd (JAP) is a leading industrialised and vertically integrated producer of multiple animal proteins, dairy and consumer food products in Indonesia (second largest), Vietnam, Myanmar, India and China. The group is involved in production of animal feeds, poultry breeding, poultry commercial farms, beef cattle feedlots, swine breeding, swine commercial farms, dairy farms as well as frozen and ambient temperature consumer food products.
Leverage & Asset Turnover (x)
Capital Expenditure
ROE (%)
Forward PE Band (x)
PB Band (x)
Source: Company, DBS Bank
1.1
1.2
1.2
1.3
1.3
1.4
1.4
0.00
0.20
0.40
0.60
0.80
1.00
2014A 2015A 2016F 2017F 2018F
Gross Debt to Equity (LHS) Asset Turnover (RHS)
0.0
50.0
100.0
150.0
200.0
250.0
300.0
350.0
2014A 2015A 2016F 2017F 2018F
Capital Expenditure (-)
US$m
0.0%
5.0%
10.0%
15.0%
20.0%
2014A 2015A 2016F 2017F 2018F
Avg: 7.7x
+1sd: 12.2x
+2sd: 16.7x
‐1sd: 3.2x
-1.1
3.9
8.9
13.9
18.9
23.9
Aug-14 Feb-15 Aug-15 Feb-16 Aug-16
(x)
Avg: 1.04x
+1sd: 1.31x
+2sd: 1.59x
‐1sd: 0.76x
‐2sd: 0.48x0.4
0.6
0.8
1.0
1.2
1.4
1.6
1.8
Aug-14 Feb-15 Aug-15 Feb-16 Aug-16
(x)
Page 58
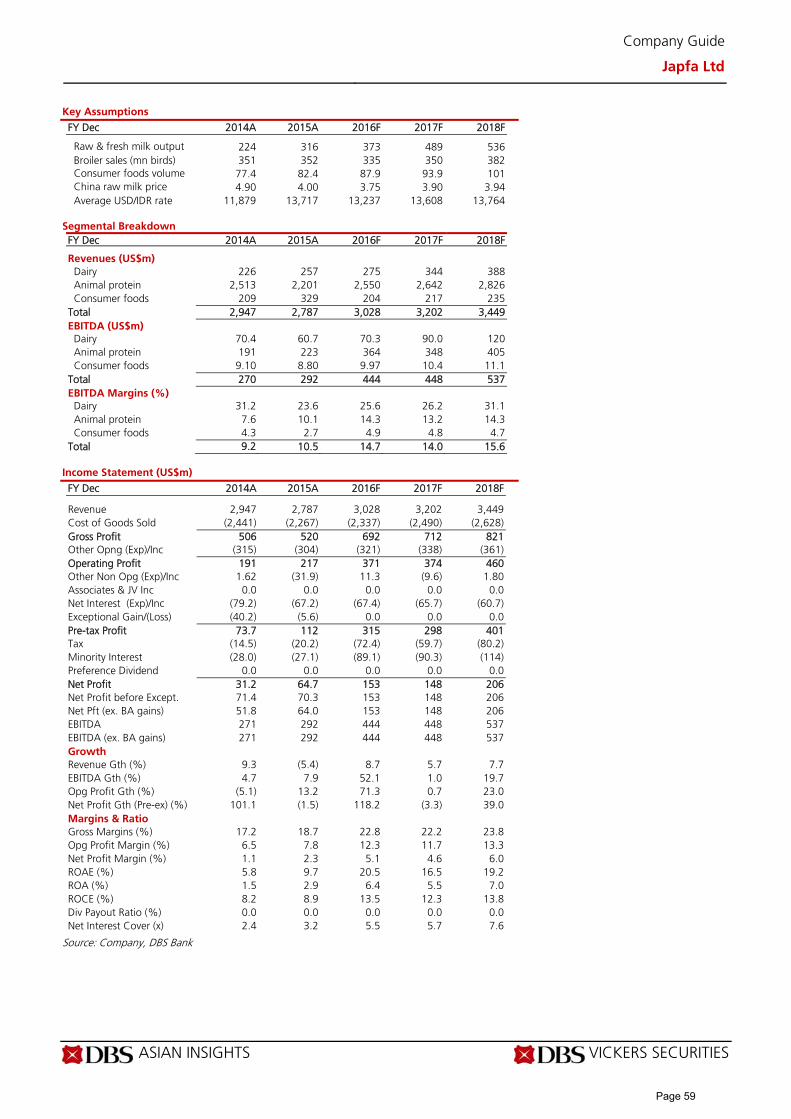
ASIAN INSIGHTS VICKERS SECURITIES Page 5
Company Guide
Japfa Ltd
Key Assumptions
FY Dec 2014A 2015A 2016F 2017F 2018F Raw & fresh milk output 224 316 373 489 536 Broiler sales (mn birds) 351 352 335 350 382 Consumer foods volume 77.4 82.4 87.9 93.9 101 China raw milk price 4.90 4.00 3.75 3.90 3.94 Average USD/IDR rate 11,879 13,717 13,237 13,608 13,764
Segmental Breakdown
FY Dec 2014A 2015A 2016F 2017F 2018F Revenues (US$m) Dairy 226 257 275 344 388 Animal protein 2,513 2,201 2,550 2,642 2,826 Consumer foods 209 329 204 217 235 Total 2,947 2,787 3,028 3,202 3,449 EBITDA (US$m)
Dairy 70.4 60.7 70.3 90.0 120 Animal protein 191 223 364 348 405 Consumer foods 9.10 8.80 9.97 10.4 11.1 Total 270 292 444 448 537 EBITDA Margins (%)
Dairy 31.2 23.6 25.6 26.2 31.1 Animal protein 7.6 10.1 14.3 13.2 14.3 Consumer foods 4.3 2.7 4.9 4.8 4.7 Total 9.2 10.5 14.7 14.0 15.6
Income Statement (US$m)
FY Dec 2014A 2015A 2016F 2017F 2018F Revenue 2,947 2,787 3,028 3,202 3,449 Cost of Goods Sold (2,441) (2,267) (2,337) (2,490) (2,628) Gross Profit 506 520 692 712 821 Other Opng (Exp)/Inc (315) (304) (321) (338) (361) Operating Profit 191 217 371 374 460 Other Non Opg (Exp)/Inc 1.62 (31.9) 11.3 (9.6) 1.80 Associates & JV Inc 0.0 0.0 0.0 0.0 0.0 Net Interest (Exp)/Inc (79.2) (67.2) (67.4) (65.7) (60.7) Exceptional Gain/(Loss) (40.2) (5.6) 0.0 0.0 0.0 Pre-tax Profit 73.7 112 315 298 401 Tax (14.5) (20.2) (72.4) (59.7) (80.2) Minority Interest (28.0) (27.1) (89.1) (90.3) (114) Preference Dividend 0.0 0.0 0.0 0.0 0.0 Net Profit 31.2 64.7 153 148 206 Net Profit before Except. 71.4 70.3 153 148 206 Net Pft (ex. BA gains) 51.8 64.0 153 148 206 EBITDA 271 292 444 448 537 EBITDA (ex. BA gains) 271 292 444 448 537 Growth Revenue Gth (%) 9.3 (5.4) 8.7 5.7 7.7 EBITDA Gth (%) 4.7 7.9 52.1 1.0 19.7 Opg Profit Gth (%) (5.1) 13.2 71.3 0.7 23.0 Net Profit Gth (Pre-ex) (%) 101.1 (1.5) 118.2 (3.3) 39.0 Margins & Ratio Gross Margins (%) 17.2 18.7 22.8 22.2 23.8 Opg Profit Margin (%) 6.5 7.8 12.3 11.7 13.3 Net Profit Margin (%) 1.1 2.3 5.1 4.6 6.0 ROAE (%) 5.8 9.7 20.5 16.5 19.2 ROA (%) 1.5 2.9 6.4 5.5 7.0 ROCE (%) 8.2 8.9 13.5 12.3 13.8 Div Payout Ratio (%) 0.0 0.0 0.0 0.0 0.0 Net Interest Cover (x) 2.4 3.2 5.5 5.7 7.6
Source: Company, DBS Bank
Page 59

ASIAN INSIGHTS VICKERS SECURITIES Page 6
Company Guide
Japfa Ltd
Quarterly / Interim Income Statement (US$m)
FY Dec 3Q2015 4Q2015 1Q2016 2Q2016 3Q2016 Revenue 695 712 718 782 788 Cost of Goods Sold (557) (559) (571) (591) (601) Gross Profit 138 153 146 191 187 Other Oper. (Exp)/Inc (72.5) (77.5) (91.0) (82.8) (81.9) Operating Profit 65.8 75.3 55.1 108 105 Other Non Opg (Exp)/Inc (21.2) 7.87 9.89 (1.2) 5.95 Associates & JV Inc 0.0 0.0 0.0 0.0 0.0 Net Interest (Exp)/Inc (17.2) (15.2) (15.4) (15.1) (13.9) Exceptional Gain/(Loss) (9.3) 13.8 (1.6) (10.8) 5.75 Pre-tax Profit 18.1 81.7 48.0 80.8 103 Tax (7.7) (6.8) (10.9) (11.2) (24.2) Minority Interest (2.4) (28.2) (13.7) (25.0) (31.0) Net Profit 7.99 46.7 23.4 44.6 48.0 Net profit bef Except. 17.3 33.0 25.0 55.4 42.3 EBITDA 92.0 95.1 76.6 132 131 Growth Revenue Gth (%) (1.3) 2.4 0.8 9.0 0.8 EBITDA Gth (%) 45.3 3.4 (19.5) 72.9 (1.0) Opg Profit Gth (%) 49.3 14.3 (26.8) 95.6 (2.3) Net Profit Gth (Pre-ex) (%) (15.6) 91.1 (24.2) 121.7 (23.7) Margins Gross Margins (%) 19.9 21.5 20.4 24.4 23.8 Opg Profit Margins (%) 9.5 10.6 7.7 13.8 13.4 Net Profit Margins (%) 1.1 6.6 3.3 5.7 6.1
Balance Sheet (US$m)
FY Dec 2014A 2015A 2016F 2017F 2018F Net Fixed Assets 834 835 854 911 979 Invts in Associates & JVs 0.0 0.0 0.0 0.0 0.0 Other LT Assets 310 331 491 564 650 Cash & ST Invts 287 148 301 365 349 Inventory 598 609 546 582 614 Debtors 151 132 147 155 167 Other Current Assets 148 157 208 253 288 Total Assets 2,327 2,213 2,546 2,831 3,047 ST Debt 476 330 476 556 359 Creditor 233 260 205 218 231 Other Current Liab 25.0 20.3 46.8 40.0 51.3 LT Debt 507 510 405 365 436 Other LT Liabilities 91.4 83.2 81.4 79.8 78.2 Shareholder’s Equity 662 671 824 972 1,179 Minority Interests 332 338 509 599 713 Total Cap. & Liab. 2,327 2,213 2,546 2,831 3,047 Non-Cash Wkg. Capital 639 618 649 732 787 Net Cash/(Debt) (697) (693) (580) (556) (446) Debtors Turn (avg days) 17.7 18.5 16.8 17.2 17.0 Creditors Turn (avg days) 32.9 41.0 37.5 32.0 32.1 Inventory Turn (avg days) 87.5 100.4 93.2 85.3 85.6 Asset Turnover (x) 1.4 1.2 1.3 1.2 1.2 Current Ratio (x) 1.6 1.7 1.7 1.7 2.2 Quick Ratio (x) 0.6 0.5 0.6 0.6 0.8 Net Debt/Equity (X) 0.7 0.7 0.4 0.4 0.2 Net Debt/Equity ex MI (X) 1.1 1.0 0.7 0.6 0.4 Capex to Debt (%) 29.8 21.7 18.2 23.0 29.6 Z-Score (X) 2.5 2.6 2.7 2.7 2.9
Source: Company, DBS Bank
Page 60

ASIAN INSIGHTS VICKERS SECURITIES Page 7
Company Guide
Japfa Ltd
Cash Flow Statement (US$m)
FY Dec 2014A 2015A 2016F 2017F 2018F Pre-Tax Profit 73.7 112 315 298 401 Dep. & Amort. 62.2 71.9 74.0 75.6 77.8 Tax Paid (37.8) (20.2) (72.4) (59.7) (80.2) Assoc. & JV Inc/(loss) 0.0 0.0 0.0 0.0 0.0 Chg in Wkg.Cap. (88.4) 11.8 (140) (102) (82.0) Other Operating CF 0.12 0.08 0.02 0.03 0.03 Net Operating CF 125 254 197 240 351 Capital Exp.(net) (293) (182) (160) (212) (236) Other Invts.(net) 0.01 0.0 0.0 0.0 0.0 Invts in Assoc. & JV 0.0 0.0 0.0 0.0 0.0 Div from Assoc & JV 0.0 0.0 0.0 0.0 0.0 Other Investing CF (5.9) (3.6) (2.9) (2.9) (3.0) Net Investing CF (299) (186) (163) (215) (239) Div Paid (3.7) 0.0 0.0 0.0 0.0 Chg in Gross Debt 68.1 (132) 39.9 40.8 (126) Capital Issues 198 0.0 0.0 0.0 0.0 Other Financing CF (27.3) (75.3) 79.4 (2.0) (1.9) Net Financing CF 235 (207) 119 38.9 (128) Currency Adjustments 0.0 0.0 0.0 0.0 0.0 Chg in Cash 61.6 (139) 153 64.5 (16.5) Opg CFPS (S cts) 17.0 19.4 26.8 27.3 34.5 Free CFPS (S cts) (13.4) 5.75 2.91 2.28 9.18
Source: Company, DBS Bank
Target Price & Ratings History
Source: DBS Bank Analyst: Ben SANTOSO
S.No.Date of Report
Closing Price
12-mth Target Price
Rat ing
1: 01 Mar 16 0.51 0.90 BUY
2: 02 Mar 16 0.51 0.90 BUY
3: 22 Apr 16 0.70 0.90 BUY
4: 29 Apr 16 0.70 1.10 BUY
5: 05 May 16 0.70 1.10 BUY
6: 09 Jun 16 0.80 1.10 BUY
7: 14 Jun 16 0.78 1.10 BUY
8: 27 Jul 16 0.84 0.96 HOLD
9: 15 Aug 16 0.81 0.97 BUY
10: 21 Sep 16 0.80 0.97 BUY
11: 28 Oct 16 0.84 1.18 BUY
Note : Share price and Target price are adjusted for corporate actions.
1
2
3
4
5
6
7
8
9
10
11
0.43
0.53
0.63
0.73
0.83
0.93
1.03
Feb-16 Apr-16 Jun-16 Aug-16 Oct-16 Dec-16 Feb-17
S$
Page 61
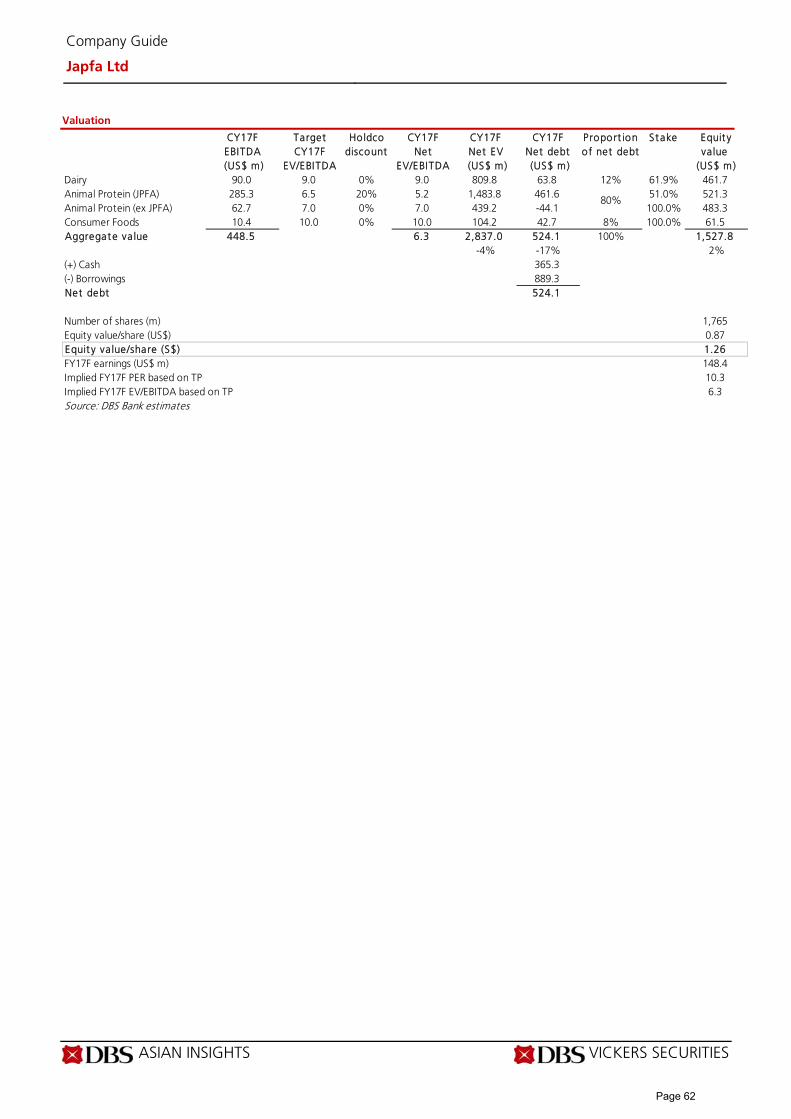
ASIAN INSIGHTS VICKERS SECURITIES Page 8
Company Guide
Japfa Ltd
Valuation
CY17F Target Holdco CY17F CY17F CY17F Proport ion Stake Equit yEBITDA CY17F discount Net Net EV Net debt of net debt value
(US$ m) EV/EBITDA EV/EBITDA (US$ m) (US$ m) (US$ m)Dairy 90.0 9.0 0% 9.0 809.8 63.8 12% 61.9% 461.7Animal Protein (JPFA) 285.3 6.5 20% 5.2 1,483.8 461.6 51.0% 521.3Animal Protein (ex JPFA) 62.7 7.0 0% 7.0 439.2 -44.1 100.0% 483.3Consumer Foods 10.4 10.0 0% 10.0 104.2 42.7 8% 100.0% 61.5Aggregate va lue 448.5 6.3 2,837.0 524.1 100% 1,527.8
-4% -17% 2%(+) Cash 365.3(-) Borrowings 889.3Net debt 524.1
Number of shares (m) 1,765Equity value/share (US$) 0.87Equit y value/share (S$) 1.26FY17F earnings (US$ m) 148.4Implied FY17F PER based on TP 10.3Implied FY17F EV/EBITDA based on TP 6.3Source: DBS Bank estimates
80%
Page 62

ASIAN INSIGHTS VICKERS SECURITIES ed: TH / sa: JC, PY
BUY Last Traded Price ( 28 Dec 2016): S$0.45 (STI : 2,898.30) Price Target 12-mth: S$0.56 (24% upside) Potential Catalyst: Earnings-accretive acquisitions Analyst Lee Keng LING +65 6682 3703 [email protected]
Price Relative
Forecasts and Valuation FY Mar (S$ m) 2016A 2017F 2018F 2019F Revenue 38.3 99.2 143 174 EBITDA 19.4 31.6 41.7 47.9 Pre-tax Profit 9.99 22.2 29.9 36.2 Net Profit 8.90 18.4 24.9 30.0 Net Pft (Pre Ex.) 8.90 18.4 24.9 30.0 Net Pft Gth (Pre-ex) (%) 73.4 107.1 34.9 20.8 EPS (S cts) 0.98 1.76 2.37 2.86 EPS Pre Ex. (S cts) 0.98 1.76 2.37 2.86 EPS Gth Pre Ex (%) 59 79 35 21 Diluted EPS (S cts) 0.98 1.76 2.37 2.86 Net DPS (S cts) 0.0 0.0 0.0 0.0 BV Per Share (S cts) 4.00 6.93 9.31 12.2 PE (X) 45.7 25.6 19.0 15.7 PE Pre Ex. (X) 45.7 25.6 19.0 15.7 P/Cash Flow (X) nm 30.1 20.1 14.4 EV/EBITDA (X) 21.0 14.4 11.4 9.7 Net Div Yield (%) 0.0 0.0 0.0 0.0 P/Book Value (X) 11.2 6.5 4.8 3.7 Net Debt/Equity (X) CASH CASH 0.1 CASH ROAE (%) 32.1 33.8 29.2 26.7 Earnings Rev (%): - - - Consensus EPS (S cts): 1.40 2.20 2.50 Other Broker Recs: B: 2 S: 0 H: 0
Source of all data on this page: Company, DBS Bank, Bloomberg Finance L.P
Growth intact
Growth supported by core business; cinemas to build recurring income. We project mm2 to grow at an EPS CAGR of 50% from FY16-FY19, underpinned by growth in productions, expansion into the China market, and contributions from cinema operations and entertainment company, UnUsUal Group. Contribution from the newly proposed acquisition of 13 cinemas in Malaysia, which would propel mm2 Asia to become a top four player in Malaysia, is expected to be from FY18F onwards. In terms of its core production business, we expect North Asia, including China, Hong Kong and Taiwan, to contribute >70% of core revenue from FY17F, up from 23% in FY16. Upside to earnings could come from more projects, especially in China where budgets are much higher. 1H17 earnings doubled. mm2 reported a net profit of S$8.9m (+97% y-o-y) for 1H17. We expect a stronger 2H, mainly from the full impact from UnUsUal and the Mega cinemas acquired. UnUsUal listing. The successful listing of UnUsUal, which mm2 acquired at 10.2x PE back in February 2016, would enable mm2 to crystallise gains and unlock value, and allow UnUsUal to tap on public funds for expansion. Valuation:
Maintain BUY and TP of S$0.56. We maintain our earnings forecasts for FY17F and FY18F but we have removed the revenue from the Distribution segment, to be in line with the group’s reporting format. We have also added forecasts for FY19F. Maintain BUY. Our TP of S$0.56 is pegged to FY18F earnings and peers’ average of 24x. Key Risks to Our View:
No long-term financing arrangements for productions. The commencement of each production is dependent on mm2’s ability to secure funding. Availability of good scripts. Lack of good scripts for production may lead to less support from stakeholders. At A Glance Issued Capital (m shrs) 1,029 Mkt. Cap (S$m/US$m) 463 / 319 Major Shareholders (%) Wee Chye Ang 45.9 Yeo Khee Seng 9.2 Starhbu Ltd 8.6
Free Float (%) 36.4 3m Avg. Daily Val (US$m) 1.1 ICB Industry : Consumer Services / Media
DBS Group Research . Equity 29 Dec 2016
Singapore Company Guide
mm2 Asia Version 8 | Bloomberg: MM2 SP | Reuters: MM2A.SI Refer to important disclosures at the end of this report
68
168
268
368
468
568
668
768
868
968
0.0
0.1
0.1
0.2
0.2
0.3
0.3
0.4
0.4
0.5
0.5
Dec-14 Jun-15 Dec-15 Jun-16 Dec-16
Relative IndexS$
mm2 Asia (LHS) Relative STI (RHS)
Page 63
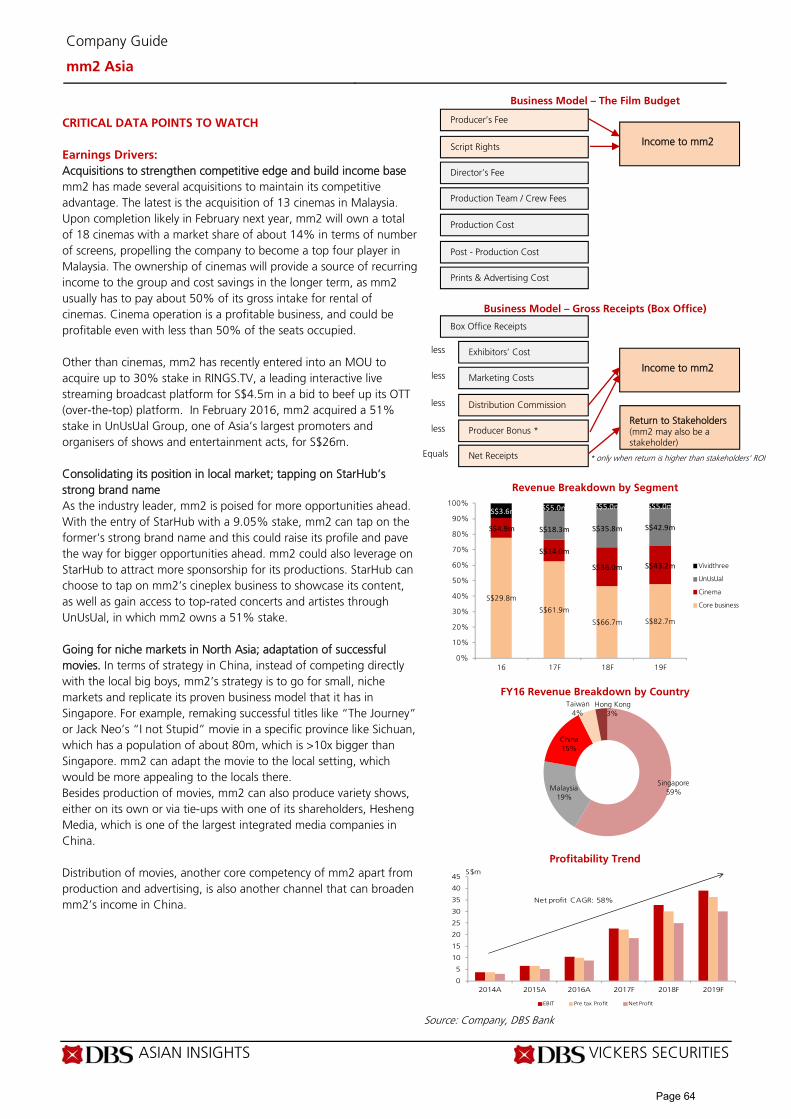
ASIAN INSIGHTS VICKERS SECURITIES Page 2
Company Guide
mm2 Asia
CRITICAL DATA POINTS TO WATCH
Earnings Drivers:
Acquisitions to strengthen competitive edge and build income base mm2 has made several acquisitions to maintain its competitive advantage. The latest is the acquisition of 13 cinemas in Malaysia. Upon completion likely in February next year, mm2 will own a total of 18 cinemas with a market share of about 14% in terms of number of screens, propelling the company to become a top four player in Malaysia. The ownership of cinemas will provide a source of recurring income to the group and cost savings in the longer term, as mm2 usually has to pay about 50% of its gross intake for rental of cinemas. Cinema operation is a profitable business, and could be profitable even with less than 50% of the seats occupied. Other than cinemas, mm2 has recently entered into an MOU to acquire up to 30% stake in RINGS.TV, a leading interactive live streaming broadcast platform for S$4.5m in a bid to beef up its OTT (over-the-top) platform. In February 2016, mm2 acquired a 51% stake in UnUsUal Group, one of Asia’s largest promoters and organisers of shows and entertainment acts, for S$26m. Consolidating its position in local market; tapping on StarHub’s strong brand name As the industry leader, mm2 is poised for more opportunities ahead. With the entry of StarHub with a 9.05% stake, mm2 can tap on the former's strong brand name and this could raise its profile and pave the way for bigger opportunities ahead. mm2 could also leverage on StarHub to attract more sponsorship for its productions. StarHub can choose to tap on mm2’s cineplex business to showcase its content, as well as gain access to top-rated concerts and artistes through UnUsUal, in which mm2 owns a 51% stake. Going for niche markets in North Asia; adaptation of successful movies. In terms of strategy in China, instead of competing directly with the local big boys, mm2’s strategy is to go for small, niche markets and replicate its proven business model that it has in Singapore. For example, remaking successful titles like “The Journey” or Jack Neo’s “I not Stupid” movie in a specific province like Sichuan, which has a population of about 80m, which is >10x bigger than Singapore. mm2 can adapt the movie to the local setting, which would be more appealing to the locals there. Besides production of movies, mm2 can also produce variety shows, either on its own or via tie-ups with one of its shareholders, Hesheng Media, which is one of the largest integrated media companies in China. Distribution of movies, another core competency of mm2 apart from production and advertising, is also another channel that can broaden mm2’s income in China.
Business Model – The Film Budget
Business Model – Gross Receipts (Box Office)
Revenue Breakdown by Segment
FY16 Revenue Breakdown by Country
Profitability Trend
Source: Company, DBS Bank
S$29.8m
S$61.9m
S$66.7m S$82.7m
S$4.9m
S$14.0m
S$36.0m S$43.2m
S$18.3m S$35.8m S$42.9m
S$3.6m S$5.0m S$5.0m S$5.0m
0%
10%
20%
30%
40%
50%
60%
70%
80%
90%
100%
16 17F 18F 19F
Vividthree
UnUsUal
Cinema
Core business
Singapore59%Malaysia
19%
China15%
Taiwan4%
Hong Kong3%
0
5
10
15
20
25
30
35
40
45
2014A 2015A 2016A 2017F 2018F 2019F
EBIT Pre tax Profit Net Profit
S$m
Net profit CAGR: 58%
Equals
less
less
less
less
Producer’s Fee
Script Rights
Director’s Fee
Production Team / Crew Fees
Production Cost
Post - Production Cost
Prints & Advertising Cost
Income to mm2
Box Office Receipts
Exhibitors’ Cost
Distribution Commission
Marketing Costs
Producer Bonus *
Net Receipts
Income to mm2
Return to Stakeholders (mm2 may also be a stakeholder)
* only when return is higher than stakeholders’ ROI
Page 64
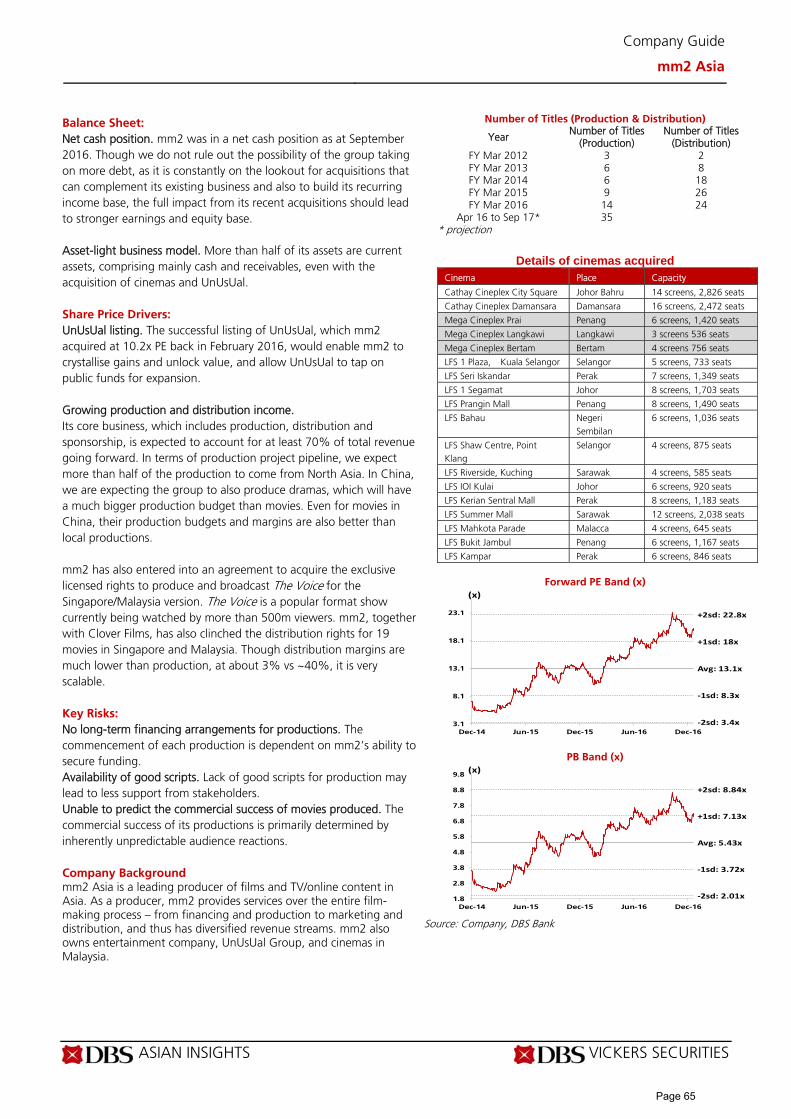
ASIAN INSIGHTS VICKERS SECURITIES Page 3
Company Guide
mm2 Asia
Balance Sheet:
Net cash position. mm2 was in a net cash position as at September 2016. Though we do not rule out the possibility of the group taking on more debt, as it is constantly on the lookout for acquisitions that can complement its existing business and also to build its recurring income base, the full impact from its recent acquisitions should lead to stronger earnings and equity base. Asset-light business model. More than half of its assets are current assets, comprising mainly cash and receivables, even with the acquisition of cinemas and UnUsUal. Share Price Drivers:
UnUsUal listing. The successful listing of UnUsUal, which mm2 acquired at 10.2x PE back in February 2016, would enable mm2 to crystallise gains and unlock value, and allow UnUsUal to tap on public funds for expansion. Growing production and distribution income. Its core business, which includes production, distribution and sponsorship, is expected to account for at least 70% of total revenue going forward. In terms of production project pipeline, we expect more than half of the production to come from North Asia. In China, we are expecting the group to also produce dramas, which will have a much bigger production budget than movies. Even for movies in China, their production budgets and margins are also better than local productions. mm2 has also entered into an agreement to acquire the exclusive licensed rights to produce and broadcast The Voice for the Singapore/Malaysia version. The Voice is a popular format show currently being watched by more than 500m viewers. mm2, together with Clover Films, has also clinched the distribution rights for 19 movies in Singapore and Malaysia. Though distribution margins are much lower than production, at about 3% vs ~40%, it is very scalable. Key Risks:
No long-term financing arrangements for productions. The commencement of each production is dependent on mm2’s ability to secure funding. Availability of good scripts. Lack of good scripts for production may lead to less support from stakeholders. Unable to predict the commercial success of movies produced. The commercial success of its productions is primarily determined by inherently unpredictable audience reactions. Company Background mm2 Asia is a leading producer of films and TV/online content in Asia. As a producer, mm2 provides services over the entire film-making process – from financing and production to marketing and distribution, and thus has diversified revenue streams. mm2 also owns entertainment company, UnUsUal Group, and cinemas in Malaysia.
Number of Titles (Production & Distribution)
Year Number of Titles
(Production) Number of Titles
(Distribution) FY Mar 2012 3 2 FY Mar 2013 6 8 FY Mar 2014 6 18 FY Mar 2015 9 26 FY Mar 2016 14 24
Apr 16 to Sep 17* 35 * projection
Details of cinemas acquired
Cinema Place Capacity
Cathay Cineplex City Square Johor Bahru 14 screens, 2,826 seats
Cathay Cineplex Damansara Damansara 16 screens, 2,472 seats
Mega Cineplex Prai Penang 6 screens, 1,420 seats
Mega Cineplex Langkawi Langkawi 3 screens 536 seats
Mega Cineplex Bertam Bertam 4 screens 756 seats
LFS 1 Plaza, Kuala Selangor Selangor 5 screens, 733 seats
LFS Seri Iskandar Perak 7 screens, 1,349 seats
LFS 1 Segamat Johor 8 screens, 1,703 seats
LFS Prangin Mall Penang 8 screens, 1,490 seats
LFS Bahau Negeri Sembilan
6 screens, 1,036 seats
LFS Shaw Centre, Point Klang
Selangor 4 screens, 875 seats
LFS Riverside, Kuching Sarawak 4 screens, 585 seats
LFS IOI Kulai Johor 6 screens, 920 seats
LFS Kerian Sentral Mall Perak 8 screens, 1,183 seats
LFS Summer Mall Sarawak 12 screens, 2,038 seats
LFS Mahkota Parade Malacca 4 screens, 645 seats
LFS Bukit Jambul Penang 6 screens, 1,167 seats
LFS Kampar Perak 6 screens, 846 seats
Forward PE Band (x)
PB Band (x)
Source: Company, DBS Bank
Avg: 13.1x
+1sd: 18x
+2sd: 22.8x
‐1sd: 8.3x
‐2sd: 3.4x3.1
8.1
13.1
18.1
23.1
Dec-14 Jun-15 Dec-15 Jun-16 Dec-16
(x)
Avg: 5.43x
+1sd: 7.13x
+2sd: 8.84x
‐1sd: 3.72x
‐2sd: 2.01x1.8
2.8
3.8
4.8
5.8
6.8
7.8
8.8
9.8
Dec-14 Jun-15 Dec-15 Jun-16 Dec-16
(x)
Page 65

ASIAN INSIGHTS VICKERS SECURITIES Page 4
Company Guide
mm2 Asia
Segmental Breakdown
FY Mar 2015A 2016A 2017F 2018F 2019F Revenues (S$m) Core Business 24.3 29.8 61.9 66.7 82.7 Production 51.9 56.7 72.7 TV Content 10.0 10.0 10.0 Cinema 4.9 14.0 36.0 43.2 UnUsUal 18.3 35.8 42.9 Vividthree 3.6 5.0 5.0 5.0 Total 24.3 38.3 99.2 143.4 173.8 Gross profit (S$m)
Core Business 9.6 13.1 22.3 24.2 30.6 Production 20.8 22.7 29.1 TV Content 1.5 1.5 1.5 Cinema 2.8 7.7 19.8 23.8 UnUsUal 6.8 13.2 15.9 Vividthree 2.5 3.5 3.5 3.5 Total 9.6 18.4 40.2 60.7 73.7 Gross profit Margins (%)
Core Business 39% 44% 36% 36% 37% Production 40% 40% 40% TV Content 15% 15% 15% Cinema 57% 55% 55% 55% UnUsUal 37% 37% 37% Vividthree 69% 70% 70% 70%
Total 39% 48% 41% 42% 42% Income Statement (S$m)
FY Mar 2015A 2016A 2017F 2018F 2019F Revenue 24.3 38.3 99.2 143 174 Cost of Goods Sold (14.7) (20.0) (59.0) (82.7) (100) Gross Profit 9.58 18.4 40.2 60.7 73.7 Other Opng (Exp)/Inc (3.0) (8.0) (17.7) (28.0) (34.8) Operating Profit 6.62 10.4 22.6 32.7 38.9 Other Non Opg (Exp)/Inc 0.0 0.0 0.0 0.0 0.0 Associates & JV Inc 0.0 0.0 0.0 0.0 0.0 Net Interest (Exp)/Inc 0.00 (0.4) (0.4) (2.8) (2.8) Exceptional Gain/(Loss) 0.0 0.0 0.0 0.0 0.0 Pre-tax Profit 6.58 9.99 22.2 29.9 36.2 Tax (1.5) (1.1) (3.8) (5.1) (6.1) Minority Interest 0.0 0.0 0.0 0.0 0.0 Preference Dividend 0.0 0.0 0.0 0.0 0.0 Net Profit 5.08 8.90 18.4 24.9 30.0 Net Profit before Except. 5.13 8.90 18.4 24.9 30.0 EBITDA 9.92 19.4 31.6 41.7 47.9 Growth Revenue Gth (%) 50.7 57.9 158.8 44.5 21.2 EBITDA Gth (%) 38.5 95.2 63.0 32.2 14.9 Opg Profit Gth (%) 78.3 56.7 117.6 44.9 19.0 Net Profit Gth (Pre-ex) (%) 68.1 73.4 107.1 34.9 20.8 Margins & Ratio Gross Margins (%) 39.5 48.0 40.6 42.3 42.4 Opg Profit Margin (%) 27.3 27.1 22.8 22.8 22.4 Net Profit Margin (%) 20.9 23.2 18.6 17.3 17.3 ROAE (%) 44.5 32.1 33.8 29.2 26.7 ROA (%) 18.5 16.7 17.0 13.3 12.0 ROCE (%) 37.7 27.3 28.4 19.5 17.5 Div Payout Ratio (%) 0.0 0.0 0.0 0.0 0.0 Net Interest Cover (x) NM 26.8 58.3 11.7 14.0
Source: Company, DBS Bank
Partial contributions from UnUsUal
Includes contribution from latest acquisition of Lotus cinemas
Page 66
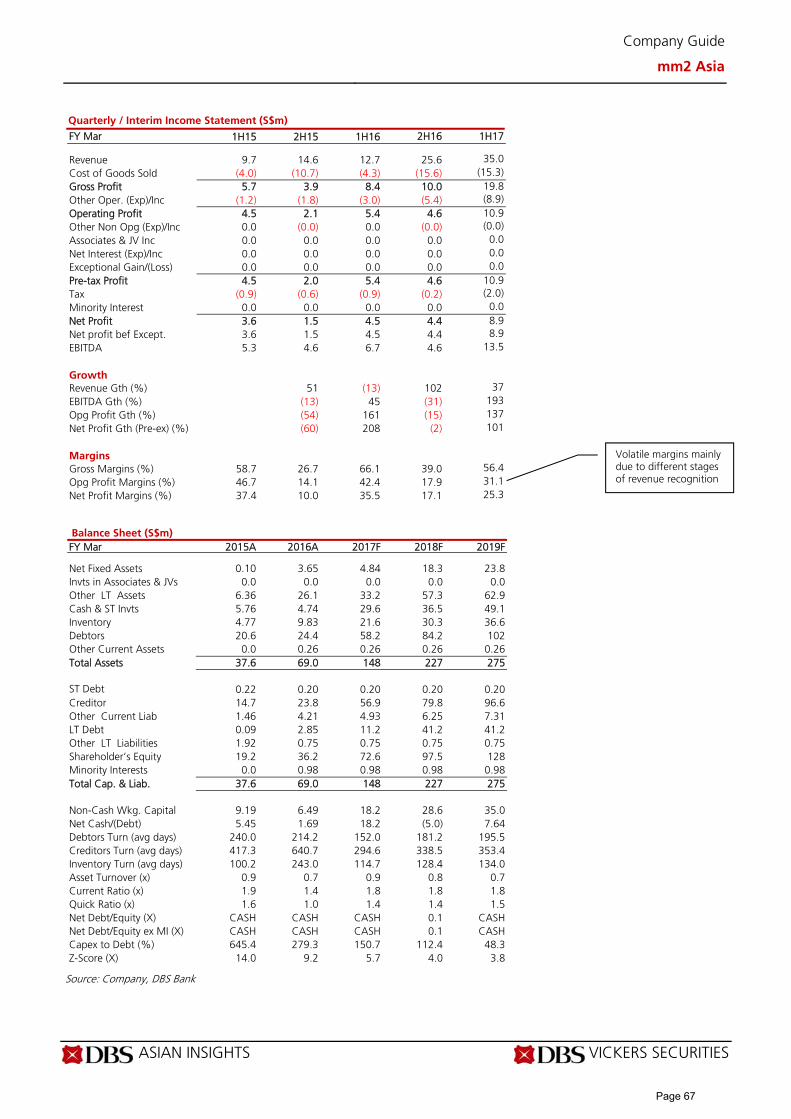
ASIAN INSIGHTS VICKERS SECURITIES Page 5
Company Guide
mm2 Asia
Quarterly / Interim Income Statement (S$m)
FY Mar 1H15 2H15 1H16 2H16 1H17 Revenue 9.7 14.6 12.7 25.6 35.0 Cost of Goods Sold (4.0) (10.7) (4.3) (15.6) (15.3) Gross Profit 5.7 3.9 8.4 10.0 19.8 Other Oper. (Exp)/Inc (1.2) (1.8) (3.0) (5.4) (8.9) Operating Profit 4.5 2.1 5.4 4.6 10.9 Other Non Opg (Exp)/Inc 0.0 (0.0) 0.0 (0.0) (0.0) Associates & JV Inc 0.0 0.0 0.0 0.0 0.0 Net Interest (Exp)/Inc 0.0 0.0 0.0 0.0 0.0 Exceptional Gain/(Loss) 0.0 0.0 0.0 0.0 0.0 Pre-tax Profit 4.5 2.0 5.4 4.6 10.9 Tax (0.9) (0.6) (0.9) (0.2) (2.0) Minority Interest 0.0 0.0 0.0 0.0 0.0 Net Profit 3.6 1.5 4.5 4.4 8.9 Net profit bef Except. 3.6 1.5 4.5 4.4 8.9 EBITDA 5.3 4.6 6.7 4.6 13.5 Growth Revenue Gth (%) 51 (13) 102 37 EBITDA Gth (%) (13) 45 (31) 193 Opg Profit Gth (%) (54) 161 (15) 137 Net Profit Gth (Pre-ex) (%) (60) 208 (2) 101 Margins Gross Margins (%) 58.7 26.7 66.1 39.0 56.4 Opg Profit Margins (%) 46.7 14.1 42.4 17.9 31.1 Net Profit Margins (%) 37.4 10.0 35.5 17.1 25.3
Balance Sheet (S$m)
FY Mar 2015A 2016A 2017F 2018F 2019F Net Fixed Assets 0.10 3.65 4.84 18.3 23.8 Invts in Associates & JVs 0.0 0.0 0.0 0.0 0.0 Other LT Assets 6.36 26.1 33.2 57.3 62.9 Cash & ST Invts 5.76 4.74 29.6 36.5 49.1 Inventory 4.77 9.83 21.6 30.3 36.6 Debtors 20.6 24.4 58.2 84.2 102 Other Current Assets 0.0 0.26 0.26 0.26 0.26 Total Assets 37.6 69.0 148 227 275 ST Debt 0.22 0.20 0.20 0.20 0.20 Creditor 14.7 23.8 56.9 79.8 96.6 Other Current Liab 1.46 4.21 4.93 6.25 7.31 LT Debt 0.09 2.85 11.2 41.2 41.2 Other LT Liabilities 1.92 0.75 0.75 0.75 0.75 Shareholder’s Equity 19.2 36.2 72.6 97.5 128 Minority Interests 0.0 0.98 0.98 0.98 0.98 Total Cap. & Liab. 37.6 69.0 148 227 275 Non-Cash Wkg. Capital 9.19 6.49 18.2 28.6 35.0 Net Cash/(Debt) 5.45 1.69 18.2 (5.0) 7.64 Debtors Turn (avg days) 240.0 214.2 152.0 181.2 195.5 Creditors Turn (avg days) 417.3 640.7 294.6 338.5 353.4 Inventory Turn (avg days) 100.2 243.0 114.7 128.4 134.0 Asset Turnover (x) 0.9 0.7 0.9 0.8 0.7 Current Ratio (x) 1.9 1.4 1.8 1.8 1.8 Quick Ratio (x) 1.6 1.0 1.4 1.4 1.5 Net Debt/Equity (X) CASH CASH CASH 0.1 CASH Net Debt/Equity ex MI (X) CASH CASH CASH 0.1 CASH Capex to Debt (%) 645.4 279.3 150.7 112.4 48.3 Z-Score (X) 14.0 9.2 5.7 4.0 3.8
Source: Company, DBS Bank
Volatile margins mainly due to different stages of revenue recognition
Page 67
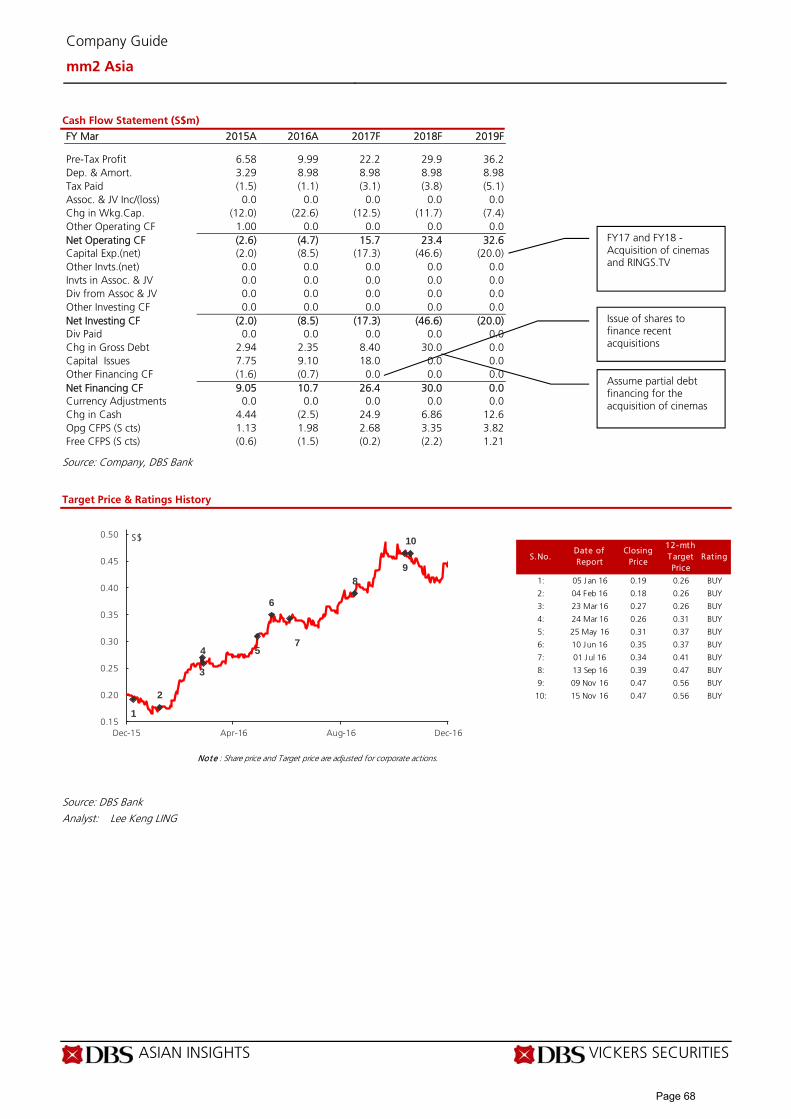
ASIAN INSIGHTS VICKERS SECURITIES Page 6
Company Guide
mm2 Asia
Cash Flow Statement (S$m)
FY Mar 2015A 2016A 2017F 2018F 2019F
Pre-Tax Profit 6.58 9.99 22.2 29.9 36.2 Dep. & Amort. 3.29 8.98 8.98 8.98 8.98 Tax Paid (1.5) (1.1) (3.1) (3.8) (5.1) Assoc. & JV Inc/(loss) 0.0 0.0 0.0 0.0 0.0 Chg in Wkg.Cap. (12.0) (22.6) (12.5) (11.7) (7.4) Other Operating CF 1.00 0.0 0.0 0.0 0.0 Net Operating CF (2.6) (4.7) 15.7 23.4 32.6 Capital Exp.(net) (2.0) (8.5) (17.3) (46.6) (20.0) Other Invts.(net) 0.0 0.0 0.0 0.0 0.0 Invts in Assoc. & JV 0.0 0.0 0.0 0.0 0.0 Div from Assoc & JV 0.0 0.0 0.0 0.0 0.0 Other Investing CF 0.0 0.0 0.0 0.0 0.0 Net Investing CF (2.0) (8.5) (17.3) (46.6) (20.0) Div Paid 0.0 0.0 0.0 0.0 0.0 Chg in Gross Debt 2.94 2.35 8.40 30.0 0.0 Capital Issues 7.75 9.10 18.0 0.0 0.0 Other Financing CF (1.6) (0.7) 0.0 0.0 0.0 Net Financing CF 9.05 10.7 26.4 30.0 0.0 Currency Adjustments 0.0 0.0 0.0 0.0 0.0 Chg in Cash 4.44 (2.5) 24.9 6.86 12.6 Opg CFPS (S cts) 1.13 1.98 2.68 3.35 3.82 Free CFPS (S cts) (0.6) (1.5) (0.2) (2.2) 1.21
Source: Company, DBS Bank
Target Price & Ratings History
Source: DBS Bank
Analyst: Lee Keng LING
S.No.Date of Report
Closing Price
12-mth Target Price
Rat ing
1: 05 Jan 16 0.19 0.26 BUY
2: 04 Feb 16 0.18 0.26 BUY
3: 23 Mar 16 0.27 0.26 BUY
4: 24 Mar 16 0.26 0.31 BUY
5: 25 May 16 0.31 0.37 BUY
6: 10 Jun 16 0.35 0.37 BUY
7: 01 Jul 16 0.34 0.41 BUY
8: 13 Sep 16 0.39 0.47 BUY
9: 09 Nov 16 0.47 0.56 BUY
10: 15 Nov 16 0.47 0.56 BUY
Note : Share price and Target price are adjusted for corporate actions.
1
2
3
4 5
6
7
89
10
0.15
0.20
0.25
0.30
0.35
0.40
0.45
0.50
Dec-15 Apr-16 Aug-16 Dec-16
S$
Issue of shares to finance recent acquisitions
Assume partial debt financing for the acquisition of cinemas
FY17 and FY18 - Acquisition of cinemas and RINGS.TV
Page 68

Market Focus
Small Mid Cap
DBS Bank Ltd recommendations are based an Absolute Total Return* Rating system, defined as follows:
STRONG BUY (>20% total return over the next 3 months, with identifiable share price catalysts within this time frame)
BUY (>15% total return over the next 12 months for small caps, >10% for large caps)
HOLD (-10% to +15% total return over the next 12 months for small caps, -10% to +10% for large caps)
FULLY VALUED (negative total return i.e. > -10% over the next 12 months)
SELL (negative total return of > -20% over the next 3 months, with identifiable catalysts within this time frame)
Share price appreciation + dividends
Completed Date: 21 Feb 2017 09:05:52 (SGT) Dissemination Date: 21 Feb 2017 13:23:45 (SGT)
Traders Spectrum’s product is oriented towards readers with a short-term trading horizon. It aims to highlight topical themes, which may move stock prices on a daily basis. Readers should be aware that “TS Take” relies more on assessments of technical factors, likely sentiment responses and short term money flows, rather than on fundamental analysis. As such the “TS Take” may from time to time conflict with fundamental ratings (where stocks are ranked to Strong Buy, Buy, Hold, Fully Valued and Sell on a 12 month basis), which are maintained by DBS Bank Ltd analysts. In keeping with the short-term orientation of the product, a stock highlighted may or may not be covered or commented on an ongoing basis.
GENERAL DISCLOSURE/DISCLAIMER This report is prepared by DBS Bank Ltd. This report is solely intended for the clients of DBS Bank Ltd, DBS Vickers Securities (Singapore) Pte Ltd, its respective connected and associated corporations and affiliates only and no part of this document may be (i) copied, photocopied or duplicated in any form or by any means or (ii) redistributed without the prior written consent of DBS Bank Ltd.
The research set out in this report is based on information obtained from sources believed to be reliable, but we (which collectively refers to DBS Bank Ltd, its respective connected and associated corporations, affiliates and their respective directors, officers, employees and agents (collectively, the “DBS Group”)) do not make any representation or warranty as to its accuracy, completeness or correctness. Opinions expressed are subject to change without notice. This document is prepared for general circulation. Any recommendation contained in this document does not have regard to the specific investment objectives, financial situation and the particular needs of any specific addressee. This document is for the information of addressees only and is not to be taken in substitution for the exercise of judgement by addressees, who should obtain separate independent legal or financial advice. The DBS Group accepts no liability whatsoever for any direct, indirect and/or consequential loss (including any claims for loss of profit) arising from any use of and/or reliance upon this document and/or further communication given in relation to this document. This document is not to be construed as an offer or a solicitation of an offer to buy or sell any securities. The DBS Group, along with its affiliates and/or persons associated with any of them may from time to time have interests in the securities mentioned in this document. The DBS Group may have positions in, and may effect transactions in securities mentioned herein and may also perform or seek to perform broking, investment banking and other banking services for these companies.
Any valuations, opinions, estimates, forecasts, ratings or risk assessments herein constitutes a judgment as of the date of this report, and there can be no assurance that future results or events will be consistent with any such valuations, opinions, estimates, forecasts, ratings or risk assessments. The information in this document is subject to change without notice, its accuracy is not guaranteed, it may be incomplete or condensed and it may not contain all material information concerning the company (or companies) referred to in this report and the DBS Group is under no obligation to update the information in this report.
This publication has not been reviewed or authorized by any regulatory authority in Singapore, Hong Kong or elsewhere. There is no planned schedule or frequency for updating research publication relating to any issuer.
The valuations, opinions, estimates, forecasts, ratings or risk assessments described in this report were based upon a number of estimates and assumptions and are inherently subject to significant uncertainties and contingencies. It can be expected that one or more of the estimates on which the valuations, opinions, estimates, forecasts, ratings or risk assessments were based will not materialize or will vary significantly from actual results. Therefore, the inclusion of the valuations, opinions, estimates, forecasts, ratings or risk assessments described herein IS NOT TO BE RELIED UPON as a representation and/or warranty by the DBS Group (and/or any persons associated with the aforesaid entities), that:
(a) such valuations, opinions, estimates, forecasts, ratings or risk assessments or their underlying assumptions will be achieved, and (b) there is any assurance that future results or events will be consistent with any such valuations, opinions, estimates, forecasts, ratings or risk
assessments stated therein.
Please contact the primary analyst for valuation methodologies and assumptions associated with the covered companies or price targets.
Page 69
Market Focus
Small Mid Cap
Any assumptions made in this report that refers to commodities, are for the purposes of making forecasts for the company (or companies) mentioned herein. They are not to be construed as recommendations to trade in the physical commodity or in the futures contract relating to the commodity referred to in this report. DBS Vickers Securities (USA) Inc ("DBSVUSA")"), a U.S.-registered broker-dealer, does not have its own investment banking or research department, has not participated in any public offering of securities as a manager or co-manager or in any other investment banking transaction in the past twelve months and does not engage in market-making. ANALYST CERTIFICATION The research analyst(s) primarily responsible for the content of this research report, in part or in whole, certifies that the views about the companies and their securities expressed in this report accurately reflect his/her personal views. The analyst(s) also certifies that no part of his/her compensation was, is, or will be, directly, or indirectly, related to specific recommendations or views expressed in the report. The DBS Group has procedures in place to eliminate, avoid and manage any potential conflicts of interests that may arise in connection with the production of research reports. As of 21 Feb 2017 the analyst(s) and his/her spouse and/or relatives who are financially dependent on the analyst(s), do not hold interests in the securities recommended in this report (“interest” includes direct or indirect ownership of securities). The research analyst(s) responsible for this report operates as part of a separate and independent team to the investment banking function of the DBS Group and procedures are in place to ensure that confidential information held by either the research or investment banking function is handled appropriately. COMPANY-SPECIFIC / REGULATORY DISCLOSURES
1. DBS Bank Ltd., DBS Vickers Securities (Singapore) Pte Ltd (“DBSVS”), their subsidiaries and/or other affiliates have proprietary positions in Venture Corporation, Mapletree Greater China Commercial Trust, Mapletree Logistics Trust, SPH REIT, Ascott, Residence Trust, M1, Keppel Infrastructure Trust, Frasers Centrepoint Trust, YTL Starhill Global REIT, Parkway Life Real Estate Investment Trust, Sheng Siong Group, CDL Hospitality Trusts., Frasers Logistics & Industrial Trust, Keppel DC REIT, Frasers Hospitality Trust, CapitaLand Retail China Trust, OUE Hospitality Trust, Far East Hospitality Trust, Frasers Commercial Trust, Ascendas Hospitality Trust, Ezion Holdings, Indofood Agri Resources, Cambridge Industrial Trust, Manulife US Real Estate Inv, Cache Logistics Trust, RHT Health Trust, Soilbuild Business Space Reit, Croesus Retail Trust, Cosco Corporation, Midas Holdings, Ezra Holdings recommended in this report as of 31 Jan 2017.
2. DBS Bank Ltd does not market make in equity securities of the issuer(s) or company(ies) mentioned in this Research Report.
3. DBS Bank Ltd, DBS Vickers Securities (Singapore) Pte Ltd (''DBSVS''), their subsidiaries and/or other affiliates have a net long position exceeding 0.5% of the total issued share capital in Mapletree Greater China Commercial Trust, Mapletree Logistics Trust, Ascott Residence Trust, M1, YTL Starhill Global REIT, CDL Hospitality Trusts, Frasers Logistics & Industrial Trust, Keppel DC REIT, Frasers Hospitality Trust, CapitaLand Retail China Trust, Frasers Commercial Trust, Manulife US Real Estate Inv, Cache Logistics Trust, RHT Health Trust, Soilbuild Business Space Reit, Croesus Retail Trust recommended in this report as of 31 Jan 2017.
4. DBS Bank Ltd., DBSVS, DBSVUSA, their subsidiaries and/or other affiliates beneficially own a total of 1% of any class of common equity securities of Mapletree Greater China Commercial Trust, Ascott Residence Trust, M1, YTL Starhill Global REIT, CDL, Hospitality Trusts, Frasers Logistics & Industrial Trust, Keppel DC REIT, Frasers Hospitality Trust, Frasers Commercial Trust, Manulife US Real Estate Inv, Soilbuild Business Space Reit, Croesus Retail Trust as of 31 Jan 2017.
5. DBS Bank Ltd., DBSVS, DBSVUSA, their subsidiaries and/or other affiliates beneficially own a total of 5% of any class of common equity securities of Croesus Retail Trust as of 31 Jan 2017.
Compensation for investment banking services:
6. DBS Bank Ltd., DBSVS, their subsidiaries and/or other affiliates of DBSVUSA have received compensation, within the past 12 months for investment banking services from Mapletree Greater China Commercial Trust, Mapletree Logistics Trust, Ascott Residence Trust, Japfa Ltd, YTL Starhill Global REIT, Parkway Life Real Estate Investment Trust, Perennial Real Estate Holdings, Frasers Logistics & Industrial Trust. Keppel DC REIT, Frasers Hospitality Trust, OUE Hospitality Trust, Frasers Commercial Trust, OUE Commercial REIT, Ascendas Hospitality Trust, Ezion Holdings, Manulife US Real Estate Inv, RHT Health Trust, Soilbuild Business Space Reit, Croesus Retail Trust, Midas Holdings, Courts Asia, Procurri Corporation Ezra Holdings as of 31 Jan 2017.
Page 70

Market Focus
Small Mid Cap
7. DBS Bank Ltd., DBSVS, their subsidiaries and/or other affiliates of DBSVUSA have managed or co-managed a public offering ofsecurities for Mapletree Greater China Commercial Trust, Mapletree Logistics Trust, Ascott Residence Trust, YTL Starhill GlobalREIT, Parkway Life Real Estate Investment Trust, Perennial Real Estate Holdings, Frasers Logistics & Industrial Trust. Keppel DCREIT, Frasers Hospitality Trust, OUE Hospitality Trust, Frasers Commercial Trust, Ascendas Hospitality Trust, Ezion Holdings,Manulife US Real Estate Inv, RHT Health Trust, Soilbuild Business Space Reit, Croesus Retail Trust, Midas Holdings, Courts Asia,Procurri Corporation Ezra Holdings in the past 12 months, as of 31 Jan 2017.
8. DBSVUSA does not have its own investment banking or research department, nor has it participated in any public offering ofsecurities as a manager or co-manager or in any other investment banking transaction in the past twelve months. Any USpersons wishing to obtain further information, including any clarification on disclosures in this disclaimer, or to effect atransaction in any security discussed in this document should contact DBSVUSA exclusively.
Directorship/trustee interests
9. Tan Su Shan, a member of DBS Group Executive Committee, is an Independent Non-Executive Director of Mapletree GreaterChina as of 1 Feb 2017
Disclosure of previous investment recommendation produced
10. DBS Bank Ltd, DBS Vickers Securities (Singapore) Pte Ltd (''DBSVS''), their subsidiaries and/or other affiliates may have publishedother investment recommendations in respect of the same securities / instruments recommended in this research report duringthe preceding 12 months. Please contact the primary analyst listed in the first page of this report to view previous investmentrecommendations published by DBS Bank Ltd, DBS Vickers Securities (Singapore) Pte Ltd (''DBSVS''), their subsidiaries and/orother affiliates in the preceding 12 months.
RESTRICTIONS ON DISTRIBUTION
General This report is not directed to, or intended for distribution to or use by, any person or entity who is a citizen or resident of or located in any locality, state, country or other jurisdiction where such distribution, publication, availability or use would be contrary to law or regulation.
Australia This report is being distributed in Australia by DBS Bank Ltd. (“DBS”) or DBS Vickers Securities (Singapore) Pte Ltd (“DBSVS”), both of which are exempted from the requirement to hold an Australian Financial Services Licence under the Corporation Act 2001 (“CA”) in respect of financial services provided to the recipients. Both DBS and DBSVS are regulated by the Monetary Authority of Singapore under the laws of Singapore, which differ from Australian laws. Distribution of this report is intended only for “wholesale investors” within the meaning of the CA.
Hong Kong This report is being distributed in Hong Kong by or on behalf of, and is attributable to DBS Vickers (Hong Kong) Limited which is licensed and regulated by the Hong Kong Securities and Futures Commission and/or by DBS Bank (Hong Kong) Limited which is regulated by the Hong Kong Monetary Authority and the Securities and Futures Commission. Where this publication relates to a research report, unless otherwise stated in the research report(s), DBS Bank (Hong Kong) Limited is not the issuer of the research report(s). This publication including any research report(s) is/are distributed on the express understanding that, whilst the information contained within is believed to be reliable, the information has not been independently verified by DBS Bank (Hong Kong) Limited. This report is intended for distribution in Hong Kong only to professional investors (as defined in the Securities and Futures Ordinance (Chapter 571 of the Laws of Hong Kong) and any rules promulgated thereunder.)
For any query regarding the materials herein, please contact Paul Yong (CE. No. ASE988) at [email protected].
Indonesia This report is being distributed in Indonesia by PT DBS Vickers Sekuritas Indonesia.
Page 71

Market Focus
Small Mid Cap
Malaysia This report is distributed in Malaysia by AllianceDBS Research Sdn Bhd ("ADBSR"). Recipients of this report, received from ADBSR are to contact the undersigned at 603-2604 3333 in respect of any matters arising from or in connection with this report. In addition to the General Disclosure/Disclaimer found at the preceding page, recipients of this report are advised that ADBSR (the preparer of this report), its holding company Alliance Investment Bank Berhad, their respective connected and associated corporations, affiliates, their directors, officers, employees, agents and parties related or associated with any of them may have positions in, and may effect transactions in the securities mentioned herein and may also perform or seek to perform broking, investment banking/corporate advisory and other services for the subject companies. They may also have received compensation and/or seek to obtain compensation for broking, investment banking/corporate advisory and other services from the subject companies.
Wong Ming Tek, Executive Director, ADBSR
Singapore This report is distributed in Singapore by DBS Bank Ltd (Company Regn. No. 196800306E) or DBSVS (Company Regn No. 198600294G), both of which are Exempt Financial Advisers as defined in the Financial Advisers Act and regulated by the Monetary Authority of Singapore. DBS Bank Ltd and/or DBSVS, may distribute reports produced by its respective foreign entities, affiliates or other foreign research houses pursuant to an arrangement under Regulation 32C of the Financial Advisers Regulations. Where the report is distributed in Singapore to a person who is not an Accredited Investor, Expert Investor or an Institutional Investor, DBS Bank Ltd accepts legal responsibility for the contents of the report to such persons only to the extent required by law. Singapore recipients should contact DBS Bank Ltd at 6327 2288 for matters arising from, or in connection with the report.
Thailand This report is being distributed in Thailand by DBS Vickers Securities (Thailand) Co Ltd. Research reports distributed are only intended for institutional clients only and no other person may act upon it.
United Kingdom
This report is produced by DBS Bank Ltd which is regulated by the Monetary Authority of Singapore.
This report is disseminated in the United Kingdom by DBS Vickers Securities (UK) Ltd, ("DBSVUK"). DBSVUK is authorised and regulated by the Financial Conduct Authority in the United Kingdom.
In respect of the United Kingdom, this report is solely intended for the clients of DBSVUK, its respective connected and associated corporations and affiliates only and no part of this document may be (i) copied, photocopied or duplicated in any form or by any means or (ii) redistributed without the prior written consent of DBSVUK. This communication is directed at persons having professional experience in matters relating to investments. Any investment activity following from this communication will only be engaged in with such persons. Persons who do not have professional experience in matters relating to investments should not rely on this communication.
Dubai This research report is being distributed in The Dubai International Financial Centre (“DIFC”) by DBS Bank Ltd., (DIFC Branch) having its office at PO Box 506538, 3rd Floor, Building 3, East Wing, Gate Precinct, Dubai International Financial Centre (DIFC), Dubai, United Arab Emirates. DBS Bank Ltd., (DIFC Branch) is regulated by The Dubai Financial Services Authority. This research report is intended only for professional clients (as defined in the DFSA rulebook) and no other person may act upon it.
Page 72
Market Focus
Small Mid Cap
United States This report was prepared by DBS Bank Limited. DBSVUSA did not participate in its preparation. The research analyst(s)
named on this report are not registered as research analysts with FINRA and are not associated persons of DBSVUSA. The research analyst(s) are not subject to FINRA Rule 2241 restrictions on analyst compensation, communications with a subject company, public appearances and trading securities held by a research analyst. This report is being distributed in the United States by DBSVUSA, which accepts responsibility for its contents. This report may only be distributed to Major U.S. Institutional Investors (as defined in SEC Rule 15a-6) and to such other institutional investors and qualified persons as DBSVUSA may authorize. Any U.S. person receiving this report who wishes to effect transactions in any securities referred to herein should contact DBSVUSA directly and not its affiliate.
Other jurisdictions
In any other jurisdictions, except if otherwise restricted by laws or regulations, this report is intended only for qualified, professional, institutional or sophisticated investors as defined in the laws and regulations of such jurisdictions.
DBS Bank Ltd. 12 Marina Boulevard, Marina Bay Financial Centre Tower 3
Singapore 018982 Tel. 65-6878 8888
e-mail: [email protected] Company Regn. No. 196800306E1
Page 73