Embed Size (px)
Citation preview
ed: CK/ sa: PY, CS
Rediscovering their mojo
• Industrial S-REITs remain the choice sector given their
multi-year pivot into new economy assets
• Close to 90% of AUM are now invested into new
economy industrial asset classes that exhibit robust
growth and capital upside.
• Pipelines are even more important for REITs to gain
access and grow
• Prefer A-REIT, FLCT and MLT, and mid-cap industrial
REITS like ALLT and EREIT
Industrial S-REITs are the “new economy” plays.
Investors have often baulked at the industrial S-REITs’ tight
yields of c.5.7% (4.5% for large caps) but we believe that this
premium is justified. With the sector’s earnings resilience
proven during the COVID-19 recession and with economies
re-opening, we believe that sector remains on a firm footing
to deliver decent growth of more than 3% CAGR over FY21-
23F. Our preference is to for investors to invest alongside
structural growth trends within the new economy assets of
logistics, data centres and business parks, which we believe
will deliver a potent mix of growth, capital upside. Picks, MLT,
FLCT, AREIT, ALLT and EREIT.
Sponsor’s role in shaping an acquisition pipeline
crucial in Industrial REITs’ continued pivot to new
economy assets. Industrial REITs have been actively
growing their portfolios in recent years, with more than
S$6.7bn announced and completed YTD, which now
contribute close to 90% of assets. However, with competition
from funds, returns are increasingly looking compressed and
as such, sponsor’s pipeline and ability to kick-start greenfield
or brownfield developments will be an edge going forward.
Amongst the S-REITs, we remain most attracted to FLCT, MLT
and AREIT for their continued access to pipelines that can
potentially grow their AUM by 13%-40% while
redevelopments to rejuvenate some of their ageing assets
will offer added upside to NAVs.
Time for large cap industrial S-REITs to reclaim their
stage. With the average yield spreads between large and
mid-cap industrial S-REITs converging to a 5-year average
spread of c.2.1%, partly due to the latter’s share price
strength due to news of EPRA NAREIT indexation. Looking
ahead, we believe investors will refocus on ability to drive
sustainable growth and expect that large cap S-REITs,
especially those with pipelines to see relative superior
returns.
STI : 3,071.23
Analyst
Dale LAI +65 66823715
Derek TAN +65 6682 3716
Source: DBS Bank, Bloomberg Finance L.P.
Closing price as of 22 Sep 2021
ARA LOGOS Logistics Trust : AALT is a real estate investment trust
that invests in quality income-producing real estate used for
logistics purposes, as well as real estate-related assets, in Asia-
Pacific.
Ascendas Real Estate Investment Trust: AREIT is Singapore’s first
and largest listed business space and industrial real estate
investment trust. It has a diversified portfolio comprising assets in
Singapore, UK, Australia and recently the US.
Frasers Logistics & Commercial Trust : FLCT is a REIT which invests
in prime logistics and commercial properties.
Mapletree Logistics Trust : MapleTree Logistics is a real estate
investment trust which invests in logistics warehouses in the Asia
Pacific region.
ESR-REIT : ESR-REIT is a REIT which invest primarily in industrial
assets located in Singapore
.
DBS Group Research . Equity
23 Sep 2021
Singapore Industry Focus
Singapore Industrial REITs
Refer to important disclosures at the end of this report
STOCKS
12-mth
Price Mkt Cap Target Price Performance (%)
S$ US$m S$ 3 mth 12 mth Rating
ARA LOGOS
Logistics Trust 0.94 1,008 1.00 13.9 49.2 BUY
Frasers Logistics
& Commercial
Trust 1.51 4,099 1.85 9.4 6.3 BUY
Mapletree
Industrial Trust 2.85 5,603 3.35 2.5 (14.9) BUY
Mapletree
Logistics Trust 2.08 6,595 2.35 3.0 2.0 BUY
Keppel DC REIT 2.51 3,031 3.00 (1.6) (17.2) BUY
AIMS APAC REIT 1.42 743 1.60 (2.1) 17.7 HOLD
Ascendas REIT 3.08 9,490 4.00 5.1 (6.1) BUY
EC World REIT 0.79 472 0.90 (1.9) 19.7 BUY
ESR-REIT 0.47 1,333 0.53 13.4 17.7 BUY
Sabana Shari'ah
Compliant REIT 0.43 335 0.49 0.0 14.9 BUY
Ascendas India
Trust 1.39 1,184 1.85 0.7 6.0 BUY
Industry Focus
Singapore Industrial REITs
Page 2
Leveraged into the new economy
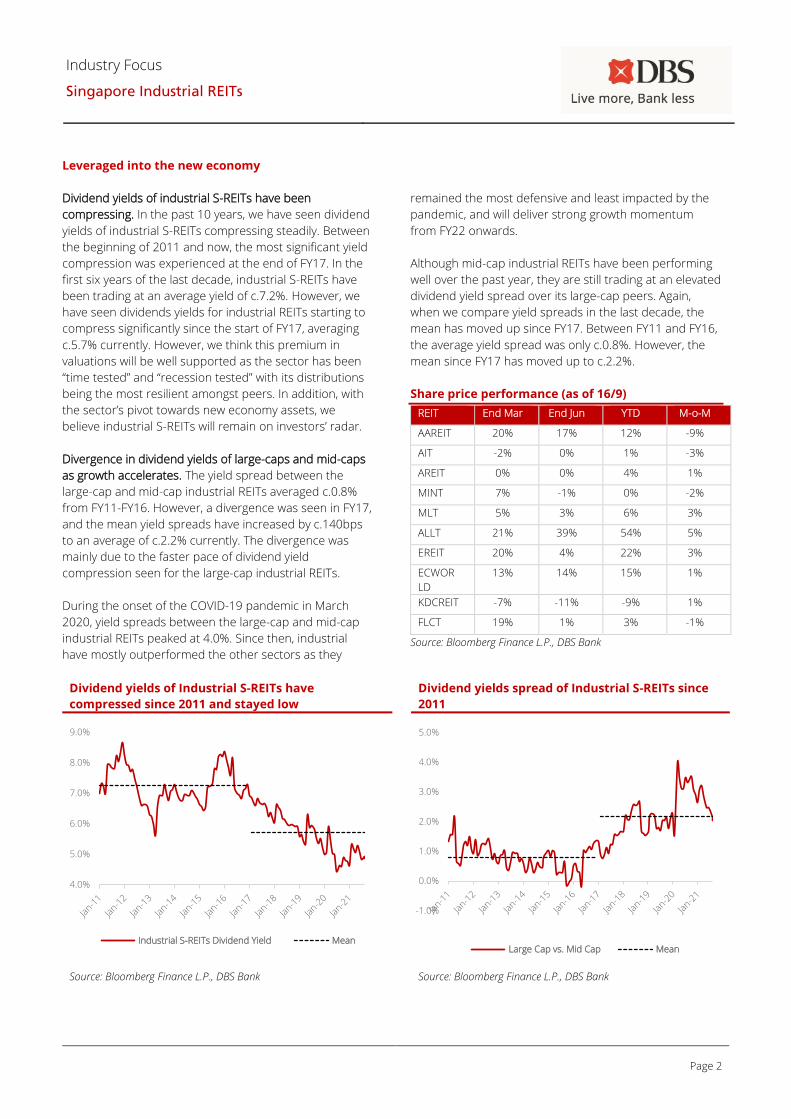
Dividend yields of industrial S-REITs have been
compressing. In the past 10 years, we have seen dividend
yields of industrial S-REITs compressing steadily. Between
the beginning of 2011 and now, the most significant yield
compression was experienced at the end of FY17. In the
first six years of the last decade, industrial S-REITs have
been trading at an average yield of c.7.2%. However, we
have seen dividends yields for industrial REITs starting to
compress significantly since the start of FY17, averaging
c.5.7% currently. However, we think this premium in
valuations will be well supported as the sector has been
“time tested” and “recession tested” with its distributions
being the most resilient amongst peers. In addition, with
the sector’s pivot towards new economy assets, we
believe industrial S-REITs will remain on investors’ radar.
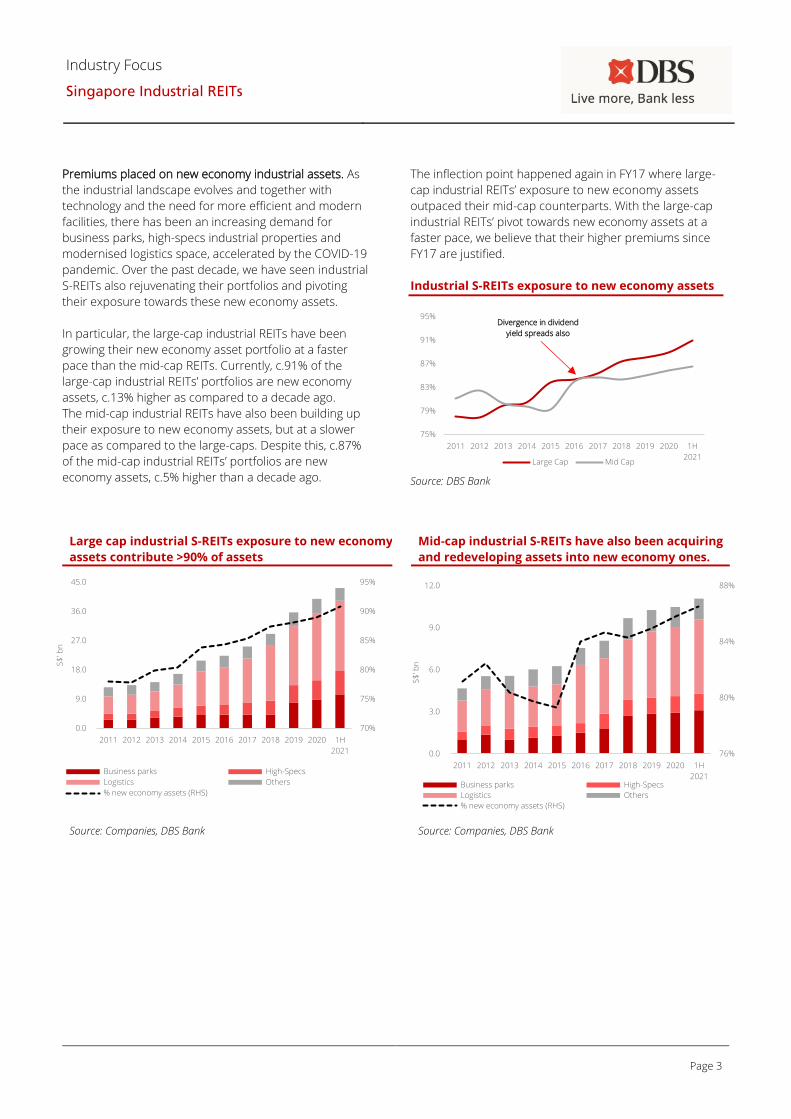
Divergence in dividend yields of large-caps and mid-caps
as growth accelerates. The yield spread between the
large-cap and mid-cap industrial REITs averaged c.0.8%
from FY11-FY16. However, a divergence was seen in FY17,
and the mean yield spreads have increased by c.140bps
to an average of c.2.2% currently. The divergence was
mainly due to the faster pace of dividend yield
compression seen for the large-cap industrial REITs.
During the onset of the COVID-19 pandemic in March
2020, yield spreads between the large-cap and mid-cap
industrial REITs peaked at 4.0%. Since then, industrial
have mostly outperformed the other sectors as they
remained the most defensive and least impacted by the
pandemic, and will deliver strong growth momentum
from FY22 onwards.
Although mid-cap industrial REITs have been performing
well over the past year, they are still trading at an elevated
dividend yield spread over its large-cap peers. Again,
when we compare yield spreads in the last decade, the
mean has moved up since FY17. Between FY11 and FY16,
the average yield spread was only c.0.8%. However, the
mean since FY17 has moved up to c.2.2%.
Share price performance (as of 16/9)
REIT End Mar End Jun YTD M-o-M
AAREIT 20% 17% 12% -9%
AIT -2% 0% 1% -3%
AREIT 0% 0% 4% 1%
MINT 7% -1% 0% -2%
MLT 5% 3% 6% 3%
ALLT 21% 39% 54% 5%
EREIT 20% 4% 22% 3%
ECWOR
LD
13% 14% 15% 1%
KDCREIT -7% -11% -9% 1%
FLCT 19% 1% 3% -1%
Source: Bloomberg Finance L.P., DBS Bank
Dividend yields of Industrial S-REITs have
compressed since 2011 and stayed low
Dividend yields spread of Industrial S-REITs since
2011
Source: Bloomberg Finance L.P., DBS Bank
Source: Bloomberg Finance L.P., DBS Bank
4.0%
5.0%
6.0%
7.0%
8.0%
9.0%
Industrial S-REITs Dividend Yield Mean
-1.0%
0.0%
1.0%
2.0%
3.0%
4.0%
5.0%
Large Cap vs. Mid Cap Mean
Industry Focus
Singapore Industrial REITs
Page 3
Premiums placed on new economy industrial assets. As
the industrial landscape evolves and together with
technology and the need for more efficient and modern
facilities, there has been an increasing demand for
business parks, high-specs industrial properties and
modernised logistics space, accelerated by the COVID-19
pandemic. Over the past decade, we have seen industrial
S-REITs also rejuvenating their portfolios and pivoting
their exposure towards these new economy assets.
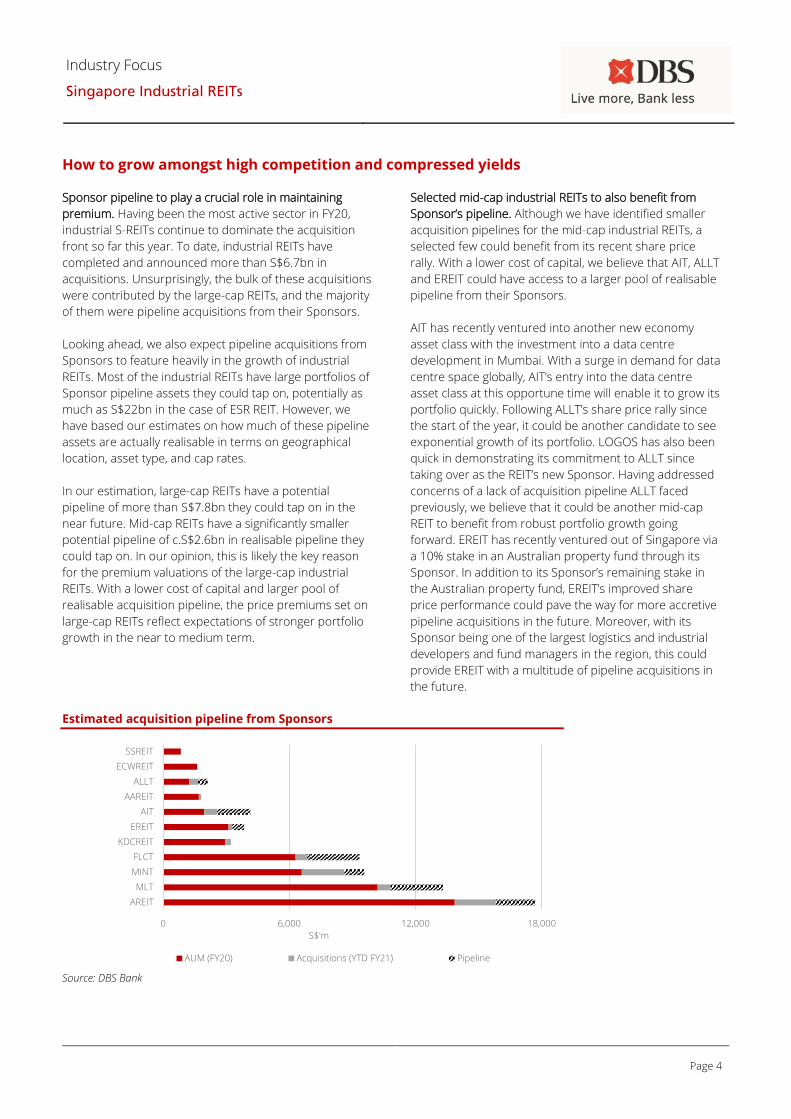
In particular, the large-cap industrial REITs have been
growing their new economy asset portfolio at a faster
pace than the mid-cap REITs. Currently, c.91% of the
large-cap industrial REITs’ portfolios are new economy
assets, c.13% higher as compared to a decade ago.
The mid-cap industrial REITs have also been building up
their exposure to new economy assets, but at a slower
pace as compared to the large-caps. Despite this, c.87%
of the mid-cap industrial REITs’ portfolios are new
economy assets, c.5% higher than a decade ago.
The inflection point happened again in FY17 where large-
cap industrial REITs’ exposure to new economy assets
outpaced their mid-cap counterparts. With the large-cap
industrial REITs’ pivot towards new economy assets at a
faster pace, we believe that their higher premiums since
FY17 are justified.
Industrial S-REITs exposure to new economy assets
Source: DBS Bank
Large cap industrial S-REITs exposure to new economy
assets contribute >90% of assets
Mid-cap industrial S-REITs have also been acquiring
and redeveloping assets into new economy ones.
Source: Companies, DBS Bank Source: Companies, DBS Bank
70%
75%
80%
85%
90%
95%
0.0
9.0
18.0
27.0
36.0
45.0
2011 2012 2013 2014 2015 2016 2017 2018 2019 2020 1H
2021
S$
' bn
Business parks High-Specs
Logistics Others
% new economy assets (RHS)
76%
80%
84%
88%
0.0
3.0
6.0
9.0
12.0
2011 2012 2013 2014 2015 2016 2017 2018 2019 2020 1H
2021
S$
' bn
Business parks High-Specs
Logistics Others
% new economy assets (RHS)
75%
79%
83%
87%
91%
95%
2011 2012 2013 2014 2015 2016 2017 2018 2019 2020 1H
2021Large Cap Mid Cap
Divergence in dividend
yield spreads also
occurred in FY17
Industry Focus
Singapore Industrial REITs
Page 4
How to grow amongst high competition and compressed yields
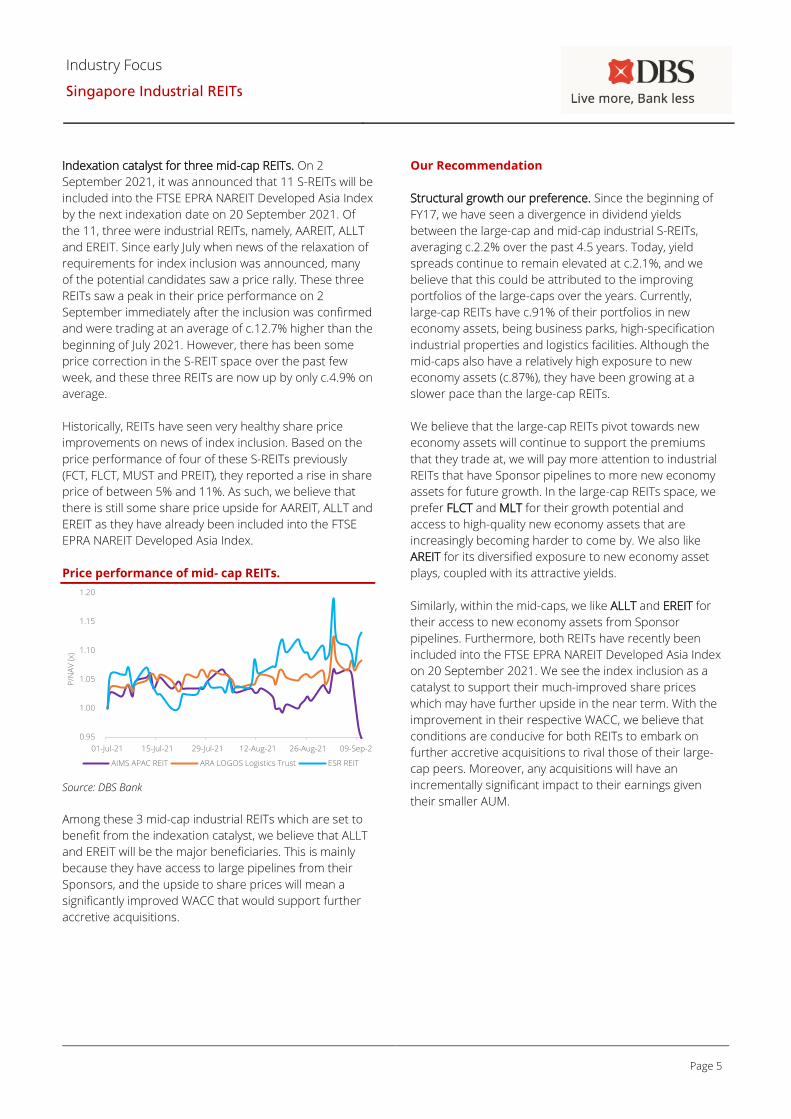
Sponsor pipeline to play a crucial role in maintaining
premium. Having been the most active sector in FY20,
industrial S-REITs continue to dominate the acquisition
front so far this year. To date, industrial REITs have
completed and announced more than S$6.7bn in
acquisitions. Unsurprisingly, the bulk of these acquisitions
were contributed by the large-cap REITs, and the majority
of them were pipeline acquisitions from their Sponsors.
Looking ahead, we also expect pipeline acquisitions from
Sponsors to feature heavily in the growth of industrial
REITs. Most of the industrial REITs have large portfolios of
Sponsor pipeline assets they could tap on, potentially as
much as S$22bn in the case of ESR REIT. However, we
have based our estimates on how much of these pipeline
assets are actually realisable in terms on geographical
location, asset type, and cap rates.
In our estimation, large-cap REITs have a potential
pipeline of more than S$7.8bn they could tap on in the
near future. Mid-cap REITs have a significantly smaller
potential pipeline of c.S$2.6bn in realisable pipeline they
could tap on. In our opinion, this is likely the key reason
for the premium valuations of the large-cap industrial
REITs. With a lower cost of capital and larger pool of
realisable acquisition pipeline, the price premiums set on
large-cap REITs reflect expectations of stronger portfolio
growth in the near to medium term.
Selected mid-cap industrial REITs to also benefit from
Sponsor’s pipeline. Although we have identified smaller
acquisition pipelines for the mid-cap industrial REITs, a
selected few could benefit from its recent share price
rally. With a lower cost of capital, we believe that AIT, ALLT
and EREIT could have access to a larger pool of realisable
pipeline from their Sponsors.
AIT has recently ventured into another new economy
asset class with the investment into a data centre
development in Mumbai. With a surge in demand for data
centre space globally, AIT’s entry into the data centre
asset class at this opportune time will enable it to grow its
portfolio quickly. Following ALLT’s share price rally since
the start of the year, it could be another candidate to see
exponential growth of its portfolio. LOGOS has also been
quick in demonstrating its commitment to ALLT since
taking over as the REIT’s new Sponsor. Having addressed
concerns of a lack of acquisition pipeline ALLT faced
previously, we believe that it could be another mid-cap
REIT to benefit from robust portfolio growth going
forward. EREIT has recently ventured out of Singapore via
a 10% stake in an Australian property fund through its
Sponsor. In addition to its Sponsor’s remaining stake in
the Australian property fund, EREIT’s improved share
price performance could pave the way for more accretive
pipeline acquisitions in the future. Moreover, with its
Sponsor being one of the largest logistics and industrial
developers and fund managers in the region, this could
provide EREIT with a multitude of pipeline acquisitions in
the future.
Estimated acquisition pipeline from Sponsors
Source: DBS Bank
0 6,000 12,000 18,000
AREIT
MLT
MINT
FLCT
KDCREIT
EREIT
AIT
AAREIT
ALLT
ECWREIT
SSREIT
S$'m
AUM (FY20) Acquisitions (YTD FY21) Pipeline
Industry Focus
Singapore Industrial REITs
Page 5
Indexation catalyst for three mid-cap REITs. On 2
September 2021, it was announced that 11 S-REITs will be
included into the FTSE EPRA NAREIT Developed Asia Index
by the next indexation date on 20 September 2021. Of
the 11, three were industrial REITs, namely, AAREIT, ALLT
and EREIT. Since early July when news of the relaxation of
requirements for index inclusion was announced, many
of the potential candidates saw a price rally. These three
REITs saw a peak in their price performance on 2
September immediately after the inclusion was confirmed
and were trading at an average of c.12.7% higher than the
beginning of July 2021. However, there has been some
price correction in the S-REIT space over the past few
week, and these three REITs are now up by only c.4.9% on
average.
Historically, REITs have seen very healthy share price
improvements on news of index inclusion. Based on the
price performance of four of these S-REITs previously
(FCT, FLCT, MUST and PREIT), they reported a rise in share
price of between 5% and 11%. As such, we believe that
there is still some share price upside for AAREIT, ALLT and
EREIT as they have already been included into the FTSE
EPRA NAREIT Developed Asia Index.
Price performance of mid- cap REITs.
Source: DBS Bank
Among these 3 mid-cap industrial REITs which are set to
benefit from the indexation catalyst, we believe that ALLT
and EREIT will be the major beneficiaries. This is mainly
because they have access to large pipelines from their
Sponsors, and the upside to share prices will mean a
significantly improved WACC that would support further
accretive acquisitions.
Our Recommendation
Structural growth our preference. Since the beginning of
FY17, we have seen a divergence in dividend yields
between the large-cap and mid-cap industrial S-REITs,
averaging c.2.2% over the past 4.5 years. Today, yield
spreads continue to remain elevated at c.2.1%, and we
believe that this could be attributed to the improving
portfolios of the large-caps over the years. Currently,
large-cap REITs have c.91% of their portfolios in new
economy assets, being business parks, high-specification
industrial properties and logistics facilities. Although the
mid-caps also have a relatively high exposure to new
economy assets (c.87%), they have been growing at a
slower pace than the large-cap REITs.
We believe that the large-cap REITs pivot towards new
economy assets will continue to support the premiums
that they trade at, we will pay more attention to industrial
REITs that have Sponsor pipelines to more new economy
assets for future growth. In the large-cap REITs space, we
prefer FLCT and MLT for their growth potential and
access to high-quality new economy assets that are
increasingly becoming harder to come by. We also like
AREIT for its diversified exposure to new economy asset
plays, coupled with its attractive yields.
Similarly, within the mid-caps, we like ALLT and EREIT for
their access to new economy assets from Sponsor
pipelines. Furthermore, both REITs have recently been
included into the FTSE EPRA NAREIT Developed Asia Index
on 20 September 2021. We see the index inclusion as a
catalyst to support their much-improved share prices
which may have further upside in the near term. With the
improvement in their respective WACC, we believe that
conditions are conducive for both REITs to embark on
further accretive acquisitions to rival those of their large-
cap peers. Moreover, any acquisitions will have an
incrementally significant impact to their earnings given
their smaller AUM.
0.95
1.00
1.05
1.10
1.15
1.20
01-Jul-21 15-Jul-21 29-Jul-21 12-Aug-21 26-Aug-21 09-Sep-21
P/N
AV
(x)
AIMS APAC REIT ARA LOGOS Logistics Trust ESR REIT
Industry Focus
Singapore Industrial REITs
Page 6
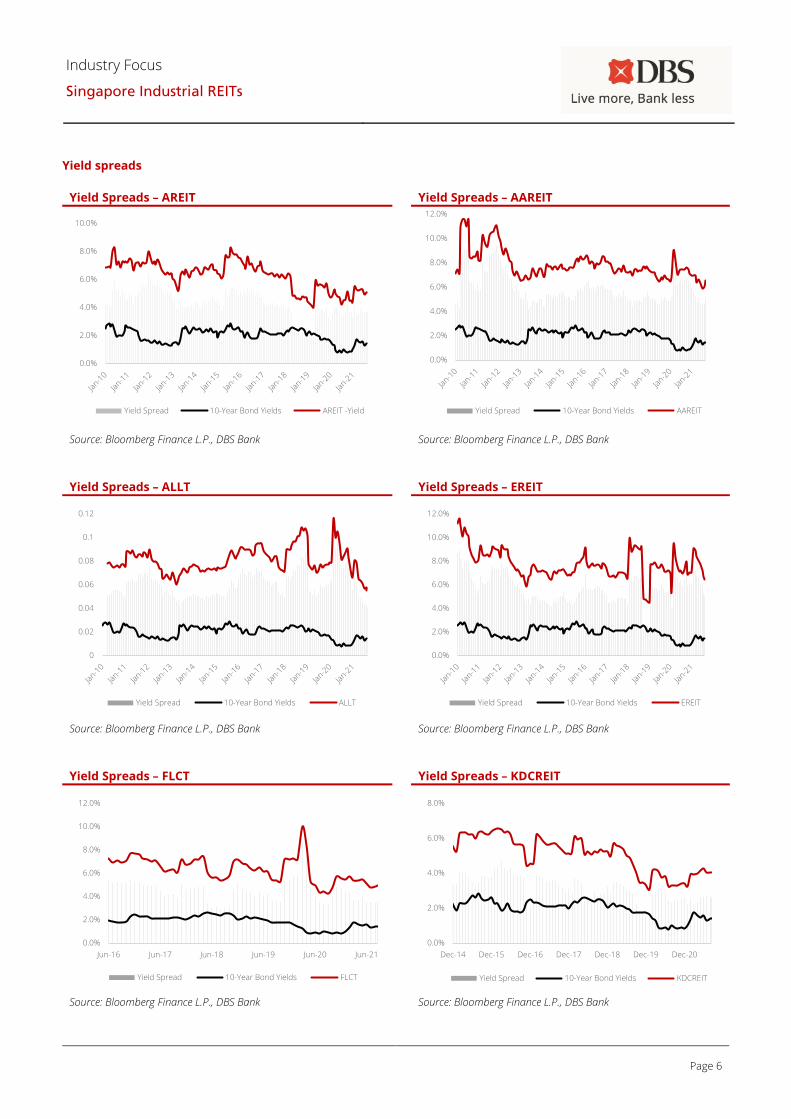
Yield spreads
Yield Spreads – AREIT Yield Spreads – AAREIT
Source: Bloomberg Finance L.P., DBS Bank Source: Bloomberg Finance L.P., DBS Bank
Yield Spreads – ALLT Yield Spreads – EREIT
Source: Bloomberg Finance L.P., DBS Bank Source: Bloomberg Finance L.P., DBS Bank
Yield Spreads – FLCT Yield Spreads – KDCREIT
Source: Bloomberg Finance L.P., DBS Bank Source: Bloomberg Finance L.P., DBS Bank
0.0%
2.0%
4.0%
6.0%
8.0%
10.0%
Yield Spread 10-Year Bond Yields AREIT -Yield
0.0%
2.0%
4.0%
6.0%
8.0%
10.0%
12.0%
Yield Spread 10-Year Bond Yields AAREIT
0.0%
2.0%
4.0%
6.0%
8.0%
10.0%
12.0%
Yield Spread 10-Year Bond Yields EREIT
0
0.02
0.04
0.06
0.08
0.1
0.12
Yield Spread 10-Year Bond Yields ALLT
0.0%
2.0%
4.0%
6.0%
8.0%
10.0%
12.0%
Jun-16 Jun-17 Jun-18 Jun-19 Jun-20 Jun-21
Yield Spread 10-Year Bond Yields FLCT
0.0%
2.0%
4.0%
6.0%
8.0%
Dec-14 Dec-15 Dec-16 Dec-17 Dec-18 Dec-19 Dec-20
Yield Spread 10-Year Bond Yields KDCREIT
Industry Focus
Singapore Industrial REITs
Page 7
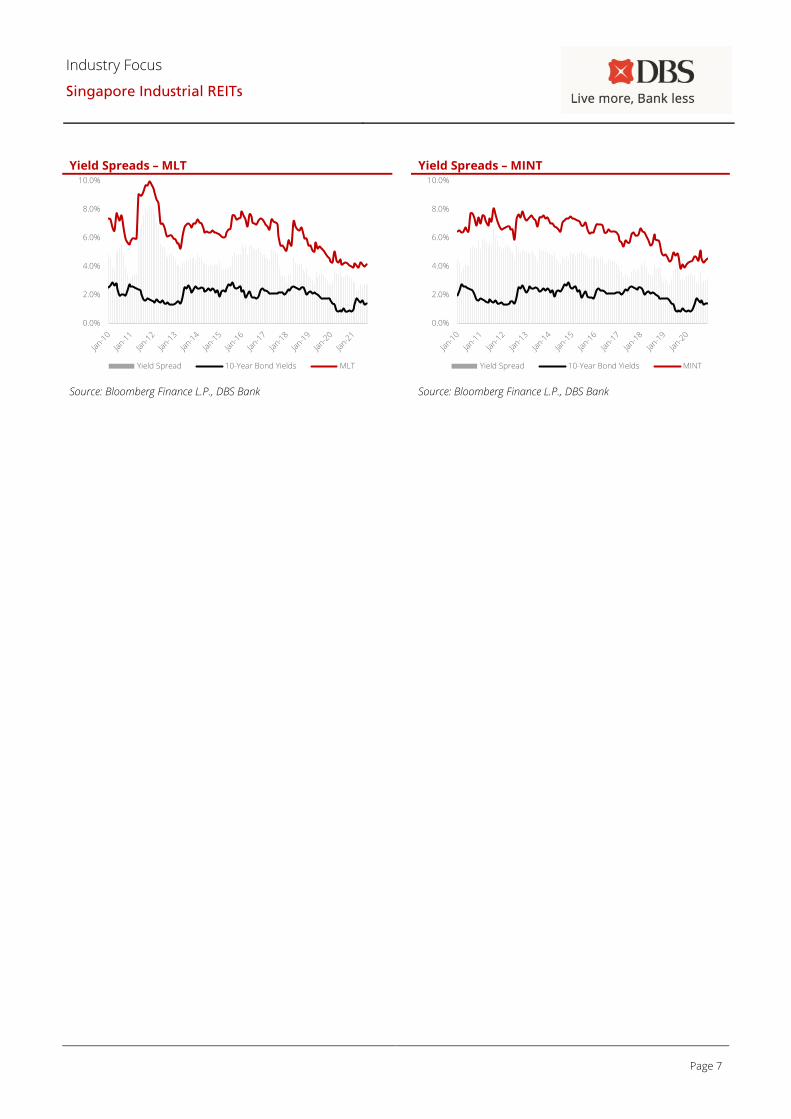
Yield Spreads – MLT Yield Spreads – MINT
Source: Bloomberg Finance L.P., DBS Bank Source: Bloomberg Finance L.P., DBS Bank
0.0%
2.0%
4.0%
6.0%
8.0%
10.0%
Yield Spread 10-Year Bond Yields MLT
0.0%
2.0%
4.0%
6.0%
8.0%
10.0%
Yield Spread 10-Year Bond Yields MINT
Industry Focus
Singapore Industrial REITs
Page 8
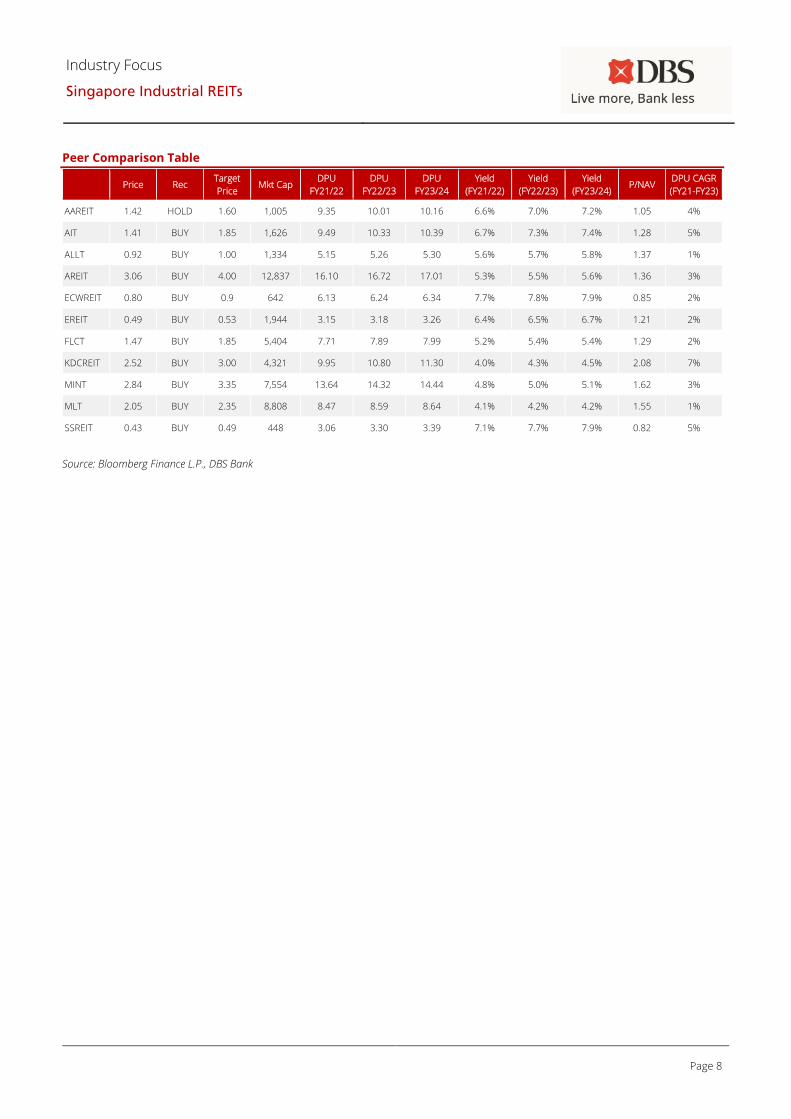
Peer Comparison Table
Price Rec Target
Price Mkt Cap
DPU
FY21/22
DPU
FY22/23
DPU
FY23/24
Yield
(FY21/22)
Yield
(FY22/23)
Yield
(FY23/24) P/NAV
DPU CAGR
(FY21-FY23)
AAREIT 1.42 HOLD 1.60 1,005 9.35 10.01 10.16 6.6% 7.0% 7.2% 1.05 4%
AIT 1.41 BUY 1.85 1,626 9.49 10.33 10.39 6.7% 7.3% 7.4% 1.28 5%
ALLT 0.92 BUY 1.00 1,334 5.15 5.26 5.30 5.6% 5.7% 5.8% 1.37 1%
AREIT 3.06 BUY 4.00 12,837 16.10 16.72 17.01 5.3% 5.5% 5.6% 1.36 3%
ECWREIT 0.80 BUY 0.9 642 6.13 6.24 6.34 7.7% 7.8% 7.9% 0.85 2%
EREIT 0.49 BUY 0.53 1,944 3.15 3.18 3.26 6.4% 6.5% 6.7% 1.21 2%
FLCT 1.47 BUY 1.85 5,404 7.71 7.89 7.99 5.2% 5.4% 5.4% 1.29 2%
KDCREIT 2.52 BUY 3.00 4,321 9.95 10.80 11.30 4.0% 4.3% 4.5% 2.08 7%
MINT 2.84 BUY 3.35 7,554 13.64 14.32 14.44 4.8% 5.0% 5.1% 1.62 3%
MLT 2.05 BUY 2.35 8,808 8.47 8.59 8.64 4.1% 4.2% 4.2% 1.55 1%
SSREIT 0.43 BUY 0.49 448 3.06 3.30 3.39 7.1% 7.7% 7.9% 0.82 5%
Source: Bloomberg Finance L.P., DBS Bank
Industry Focus
Singapore Industrial REITs
Page 9
DBS Bank recommendations are based on an Absolute Total Return* Rating system, defined as follows:
STRONG BUY (>20% total return over the next 3 months, with identifiable share price catalysts within this time frame)
BUY (>15% total return over the next 12 months for small caps, >10% for large caps)
HOLD (-10% to +15% total return over the next 12 months for small caps, -10% to +10% for large caps)
FULLY VALUED (negative total return, i.e., > -10% over the next 12 months)
SELL (negative total return of > -20% over the next 3 months, with identifiable share price catalysts within this time frame)
*Share price appreciation + dividends
Completed Date: 23 Sep 2021 06:32:18 (SGT)
Dissemination Date: 23 Sep 2021 06:45:22 (SGT)
Sources for all charts and tables are DBS Bank unless otherwise specified.
GENERAL DISCLOSURE/DISCLAIMER
This report is prepared by DBS Bank Ltd. This report is solely intended for the clients of DBS Bank Ltd, DBS Vickers Securities (Singapore) Pte
Ltd, its respective connected and associated corporations and affiliates only and no part of this document may be (i) copied, photocopied or
duplicated in any form or by any means or (ii) redistributed without the prior written consent of DBS Bank Ltd.
The research set out in this report is based on information obtained from sources believed to be reliable, but we (which collectively refers to
DBS Bank Ltd, its respective connected and associated corporations, affiliates and their respective directors, officers, employees and agents
(collectively, the “DBS Group”) have not conducted due diligence on any of the companies, verified any information or sources or taken into
account any other factors which we may consider to be relevant or appropriate in preparing the research. Accordingly, we do not make any
representation or warranty as to the accuracy, completeness or correctness of the research set out in this report. Opinions expressed are
subject to change without notice. This research is prepared for general circulation. Any recommendation contained in this document does
not have regard to the specific investment objectives, financial situation and the particular needs of any specific addressee. This document
is for the information of addressees only and is not to be taken in substitution for the exercise of judgement by addressees, who should
obtain separate independent legal or financial advice. The DBS Group accepts no liability whatsoever for any direct, indirect and/or
consequential loss (including any claims for loss of profit) arising from any use of and/or reliance upon this document and/or further
communication given in relation to this document. This document is not to be construed as an offer or a solicitation of an offer to buy or sell
any securities. The DBS Group, along with its affiliates and/or persons associated with any of them may from time to time have interests in
the securities mentioned in this document. The DBS Group, may have positions in, and may effect transactions in securities mentioned
herein and may also perform or seek to perform broking, investment banking and other banking services for these companies.
Any valuations, opinions, estimates, forecasts, ratings or risk assessments herein constitutes a judgment as of the date of this report, and
there can be no assurance that future results or events will be consistent with any such valuations, opinions, estimates, forecasts, ratings or
risk assessments. The information in this document is subject to change without notice, its accuracy is not guaranteed, it may be incomplete
or condensed, it may not contain all material information concerning the company (or companies) referred to in this report and the DBS
Group is under no obligation to update the information in this report.
This publication has not been reviewed or authorized by any regulatory authority in Singapore, Hong Kong or elsewhere. There is no
planned schedule or frequency for updating research publication relating to any issuer.
The valuations, opinions, estimates, forecasts, ratings or risk assessments described in this report were based upon a number of estimates
and assumptions and are inherently subject to significant uncertainties and contingencies. It can be expected that one or more of the
estimates on which the valuations, opinions, estimates, forecasts, ratings or risk assessments were based will not materialize or will vary
significantly from actual results. Therefore, the inclusion of the valuations, opinions, estimates, forecasts, ratings or risk assessments
described herein IS NOT TO BE RELIED UPON as a representation and/or warranty by the DBS Group (and/or any persons associated with
the aforesaid entities), that:
(a) such valuations, opinions, estimates, forecasts, ratings or risk assessments or their underlying assumptions will be achieved, and
(b) there is any assurance that future results or events will be consistent with any such valuations, opinions, estimates, forecasts, ratings or
risk assessments stated therein.
Industry Focus
Singapore Industrial REITs
Page 10
Please contact the primary analyst for valuation methodologies and assumptions associated with the covered companies or price targets.
Any assumptions made in this report that refers to commodities, are for the purposes of making forecasts for the company (or companies)
mentioned herein. They are not to be construed as recommendations to trade in the physical commodity or in the futures contract relating
to the commodity referred to in this report.
DBSVUSA, a US-registered broker-dealer, does not have its own investment banking or research department, has not participated in any
public offering of securities as a manager or co-manager or in any other investment banking transaction in the past twelve months and does
not engage in market-making.
ANALYST CERTIFICATION
The research analyst(s) primarily responsible for the content of this research report, in part or in whole, certifies that the views about the
companies and their securities expressed in this report accurately reflect his/her personal views. The analyst(s) also certifies that no part of
his/her compensation was, is, or will be, directly or indirectly, related to specific recommendations or views expressed in the report. The
research analyst (s) primarily responsible for the content of this research report, in part or in whole, certifies that he or his associate1 does
not serve as an officer of the issuer or the new listing applicant (which includes in the case of a real estate investment trust, an officer of the
management company of the real estate investment trust; and in the case of any other entity, an officer or its equivalent counterparty of the
entity who is responsible for the management of the issuer or the new listing applicant) and the research analyst(s) primarily responsible for
the content of this research report or his associate does not have financial interests2 in relation to an issuer or a new listing applicant that
the analyst reviews. DBS Group has procedures in place to eliminate, avoid and manage any potential conflicts of interests that may arise in
connection with the production of research reports. The research analyst(s) responsible for this report operates as part of a separate and
independent team to the investment banking function of the DBS Group and procedures are in place to ensure that confidential
information held by either the research or investment banking function is handled appropriately. There is no direct link of DBS Group's
compensation to any specific investment banking function of the DBS Group.
COMPANY-SPECIFIC / REGULATORY DISCLOSURES
1. DBS Bank Ltd, DBS HK, DBS Vickers Securities (Singapore) Pte Ltd (''DBSVS'') or their subsidiaries and/or other affiliates have proprietary
positions in ARA LOGOS Logistics Trust, Frasers Logistics & Commercial Trust, Mapletree Industrial Trust, Mapletree Logistics Trust,
Keppel DC REIT, AIMS APAC REIT, Ascendas REIT, ESR-REIT, Ascendas India Trust, recommended in this report as of 31 Aug 2021.
2. Neither DBS Bank Ltd nor DBS HK market makes in equity securities of the issuer(s) or company(ies) mentioned in this Research Report.
3. DBS Bank Ltd, DBS HK, DBSVS, their subsidiaries and/or other affiliates have a net long position exceeding 0.5% of the total issued share
capital in ARA LOGOS Logistics Trust, Frasers Logistics & Commercial Trust, Mapletree Industrial Trust, Mapletree Logistics Trust, Keppel
DC REIT, Ascendas REIT, recommended in this report as of 31 Aug 2021.
4. DBS Bank Ltd, DBS HK, DBSVS, DBSVUSA or their subsidiaries and/or other affiliates beneficially own a total of 1% of any class of
common equity securities of ARA LOGOS Logistics Trust, Frasers Logistics & Commercial Trust, Mapletree Industrial Trust, Keppel DC
REIT, Ascendas REIT as of 31 Aug 2021.
1 An associate is defined as (i) the spouse, or any minor child (natural or adopted) or minor step-child, of the analyst; (ii) the trustee of a trust
of which the analyst, his spouse, minor child (natural or adopted) or minor step-child, is a beneficiary or discretionary object; or (iii) another
person accustomed or obliged to act in accordance with the directions or instructions of the analyst.
2 Financial interest is defined as interests that are commonly known financial interest, such as investment in the securities in respect of an
issuer or a new listing applicant, or financial accommodation arrangement between the issuer or the new listing applicant and the firm or
analysis. This term does not include commercial lending conducted at arm's length, or investments in any collective investment scheme
other than an issuer or new listing applicant notwithstanding the fact that the scheme has investments in securities in respect of an issuer
or a new listing applicant.
Industry Focus
Singapore Industrial REITs
Page 11
Compensation for investment banking services:
5. DBS Bank Ltd, DBS HK, DBSVS their subsidiaries and/or other affiliates of DBSVUSA have received compensation, within the past 12
months for investment banking services from ARA LOGOS Logistics Trust, Frasers Logistics & Commercial Trust, Mapletree Industrial
Trust, Mapletree Logistics Trust, Keppel DC REIT, Ascendas REIT, ESR-REIT, as of 31 Aug 2021.
6. DBS Bank Ltd, DBS HK, DBSVS their subsidiaries and/or other affiliates of DBSVUSA, within the next 3 months, will receive or intend to
seek compensation for investment banking services from AIMS APAC REIT, as of 31 Aug 2021.
7. DBS Bank Ltd, DBS HK, DBSVS, their subsidiaries and/or other affiliates of DBSVUSA have managed or co-managed a public offering of
securities for ARA LOGOS Logistics Trust, Frasers Logistics & Commercial Trust, Mapletree Industrial Trust, Mapletree Logistics Trust,
Keppel DC REIT, Ascendas REIT, ESR-REIT, in the past 12 months, as of 31 Aug 2021.
8. DBSVUSA does not have its own investment banking or research department, nor has it participated in any public offering of securities
as a manager or co-manager or in any other investment banking transaction in the past twelve months. Any US persons wishing to
obtain further information, including any clarification on disclosures in this disclaimer, or to effect a transaction in any security discussed
in this document should contact DBSVUSA exclusively.
Disclosure of previous investment recommendation produced:
9. DBS Bank Ltd, DBS Vickers Securities (Singapore) Pte Ltd (''DBSVS''), their subsidiaries and/or other affiliates may have published other
investment recommendations in respect of the same securities / instruments recommended in this research report during the
preceding 12 months. Please contact the primary analyst listed in the first page of this report to view previous investment
recommendations published by DBS Bank Ltd, DBS Vickers Securities (Singapore) Pte Ltd (''DBSVS''), their subsidiaries and/or other
affiliates in the preceding 12 months.
RESTRICTIONS ON DISTRIBUTION
General This report is not directed to, or intended for distribution to or use by, any person or entity who is a citizen or
resident of or located in any locality, state, country or other jurisdiction where such distribution, publication,
availability or use would be contrary to law or regulation.
Australia This report is being distributed in Australia by DBS Bank Ltd (“DBS”), DBS Vickers Securities (Singapore) Pte Ltd
(“DBSVS”) or DBSV HK. DBS Bank Ltd holds Australian Financial Services Licence no. 475946.
DBS, DBSVS and DBSV HK are exempted from the requirement to hold an Australian Financial Services Licence
under the Corporation Act 2001 (“CA”) in respect of financial services provided to the recipients. Both DBS and
DBSVS are regulated by the Monetary Authority of Singapore under the laws of Singapore, and DBSV HK is
regulated by the Hong Kong Securities and Futures Commission under the laws of Hong Kong, which differ from
Australian laws.
Distribution of this report is intended only for “wholesale investors” within the meaning of the CA.
Hong Kong This report has been prepared by a person(s) who is not licensed by the Hong Kong Securities and Futures
Commission to carry on the regulated activity of advising on securities in Hong Kong pursuant to the Securities and
Futures Ordinance (Chapter 571 of the Laws of Hong Kong). This report is being distributed in Hong Kong and is
attributable to DBS Bank (Hong Kong) Limited (''DBS HK''), a registered institution registered with the Hong Kong
Securities and Futures Commission to carry on the regulated activity of advising on securities pursuant to the
Securities and Futures Ordinance (Chapter 571 of the Laws of Hong Kong). DBS Bank Ltd., Hong Kong Branch is a
limited liability company incorporated in Singapore.
For any query regarding the materials herein, please contact Carol Wu (Reg No. AH8283) at [email protected]
Indonesia This report is being distributed in Indonesia by PT DBS Vickers Sekuritas Indonesia.
Industry Focus
Singapore Industrial REITs
Page 12
Malaysia This report is distributed in Malaysia by AllianceDBS Research Sdn Bhd ("ADBSR"). Recipients of this report,
received from ADBSR are to contact the undersigned at 603-2604 3333 in respect of any matters arising from or in
connection with this report. In addition to the General Disclosure/Disclaimer found at the preceding page,
recipients of this report are advised that ADBSR (the preparer of this report), its holding company Alliance
Investment Bank Berhad, their respective connected and associated corporations, affiliates, their directors, officers,
employees, agents and parties related or associated with any of them may have positions in, and may effect
transactions in the securities mentioned herein and may also perform or seek to perform broking, investment
banking/corporate advisory and other services for the subject companies. They may also have received
compensation and/or seek to obtain compensation for broking, investment banking/corporate advisory and other
services from the subject companies.
Wong Ming Tek, Executive Director, ADBSR
Singapore This report is distributed in Singapore by DBS Bank Ltd (Company Regn. No. 196800306E) or DBSVS (Company
Regn No. 198600294G), both of which are Exempt Financial Advisers as defined in the Financial Advisers Act and
regulated by the Monetary Authority of Singapore. DBS Bank Ltd and/or DBSVS, may distribute reports produced
by its respective foreign entities, affiliates or other foreign research houses pursuant to an arrangement under
Regulation 32C of the Financial Advisers Regulations. Where the report is distributed in Singapore to a person who
is not an Accredited Investor, Expert Investor or an Institutional Investor, DBS Bank Ltd accepts legal responsibility
for the contents of the report to such persons only to the extent required by law. Singapore recipients should
contact DBS Bank Ltd at 6327 2288 for matters arising from, or in connection with the report.
Thailand This report is being distributed in Thailand by DBS Vickers Securities (Thailand) Co Ltd.
United
Kingdom
This report is produced by DBS Bank Ltd which is regulated by the Monetary Authority of Singapore.
This report is disseminated in the United Kingdom by DBS Vickers Securities (UK) Ltd, ("DBSVUK"). DBSVUK is
authorised and regulated by the Financial Conduct Authority in the United Kingdom.
In respect of the United Kingdom, this report is solely intended for the clients of DBSVUK, its respective connected
and associated corporations and affiliates only and no part of this document may be (i) copied, photocopied or
duplicated in any form or by any means or (ii) redistributed without the prior written consent of DBSVUK. This
communication is directed at persons having professional experience in matters relating to investments. Any
investment activity following from this communication will only be engaged in with such persons. Persons who do
not have professional experience in matters relating to investments should not rely on this communication.
Dubai
International
Financial
Centre
This research report is being distributed by DBS Bank Ltd., (DIFC Branch) having its office at units 608 - 610, 6th
Floor, Gate Precinct Building 5, PO Box 506538, Dubai International Financial Centre (DIFC), Dubai, United Arab
Emirates. DBS Bank Ltd., (DIFC Branch) is regulated by The Dubai Financial Services Authority. This research report
is intended only for professional clients (as defined in the DFSA rulebook) and no other person may act upon it.
United Arab
Emirates
This report is provided by DBS Bank Ltd (Company Regn. No. 196800306E) which is an Exempt Financial Adviser as
defined in the Financial Advisers Act and regulated by the Monetary Authority of Singapore. This report is for
information purposes only and should not be relied upon or acted on by the recipient or considered as a
solicitation or inducement to buy or sell any financial product. It does not constitute a personal recommendation
or take into account the particular investment objectives, financial situation, or needs of individual clients. You
should contact your relationship manager or investment adviser if you need advice on the merits of buying, selling
or holding a particular investment. You should note that the information in this report may be out of date and it is
not represented or warranted to be accurate, timely or complete. This report or any portion thereof may not be
reprinted, sold or redistributed without our written consent.
Industry Focus
Singapore Industrial REITs
Page 13
United States This report was prepared by DBS Bank Ltd. DBSVUSA did not participate in its preparation. The research
analyst(s) named on this report are not registered as research analysts with FINRA and are not associated persons
of DBSVUSA. The research analyst(s) are not subject to FINRA Rule 2241 restrictions on analyst compensation,
communications with a subject company, public appearances and trading securities held by a research analyst.
This report is being distributed in the United States by DBSVUSA, which accepts responsibility for its contents. This
report may only be distributed to Major U.S. Institutional Investors (as defined in SEC Rule 15a-6) and to such other
institutional investors and qualified persons as DBSVUSA may authorize. Any U.S. person receiving this report who
wishes to effect transactions in any securities referred to herein should contact DBSVUSA directly and not its
affiliate.
Other
jurisdictions
In any other jurisdictions, except if otherwise restricted by laws or regulations, this report is intended only for
qualified, professional, institutional or sophisticated investors as defined in the laws and regulations of such
jurisdictions.
DBS Regional Research Offices
HONG KONG
DBS (Hong Kong) Ltd
Contact: Carol Wu
13th Floor One Island East,
18 Westlands Road,
Quarry Bay, Hong Kong
Tel: 852 3668 4181
Fax: 852 2521 1812
e-mail: [email protected]
MALAYSIA
AllianceDBS Research Sdn Bhd
Contact: Wong Ming Tek
19th Floor, Menara Multi-Purpose,
Capital Square,
8 Jalan Munshi Abdullah 50100
Kuala Lumpur, Malaysia.
Tel.: 603 2604 3333
Fax: 603 2604 3921
e-mail: [email protected]
Co. Regn No. 198401015984
(128540-U)
SINGAPORE
DBS Bank Ltd
Contact: Janice Chua
12 Marina Boulevard,
Marina Bay Financial Centre Tower 3
Singapore 018982
Tel: 65 6878 8888
e-mail: [email protected]
Company Regn. No. 196800306E
THAILAND
DBS Vickers Securities (Thailand) Co Ltd
Contact: Chanpen Sirithanarattanakul
989 Siam Piwat Tower Building,
9th, 14th-15th Floor
Rama 1 Road, Pathumwan,
Bangkok Thailand 10330
Tel. 66 2 857 7831
Fax: 66 2 658 1269
e-mail: [email protected]
Company Regn. No 0105539127012
Securities and Exchange Commission,
Thailand
INDONESIA
PT DBS Vickers Sekuritas (Indonesia)
Contact: Maynard Priajaya Arif
DBS Bank Tower
Ciputra World 1, 32/F
Jl. Prof. Dr. Satrio Kav. 3-5
Jakarta 12940, Indonesia
Tel: 62 21 3003 4900
Fax: 6221 3003 4943
e-mail: [email protected]


![[Najib Razali] Islamic REITS - prres.net REITs.pdfDo Islamic REITs Behave Differently from Conventional REITs? – Empirical Evidence from Malaysian REITs Sing Tien Foo National University](https://img.pdfslide.us/doc/110x75/5abe8db57f8b9a7e418d14eb/najib-razali-islamic-reits-prres-reitspdfdo-islamic-reits-behave-differently.jpg)