Embed Size (px)
Citation preview
SINGAPORE CORPORATE DEBT MARKET DEVELOPMENT 2015 SINGAPORE – GLOBAL CITY, WORLD OF OPPORTUNITIES


| MONETARY AUTHORITY OF SINGAPORE
1
Contents
Foreword
2
Key Highlights
4
About the Report
5
Findings
Investors Issuers and Issuances Intermediaries and Infrastructure
6
9
12
18
| MONETARY AUTHORITY OF SINGAPORE
2
Foreword
Despite a cyclical slowdown, Asia’s long-term economic prospects remain underpinned by rising urbanisation, policy-led reforms and increasing financial integration. At the same time, Asia’s economic development has made it a magnet for international investors seeking to ride on the region’s growth opportunities. Well-functioning capital markets are a critical enabler of Asia’s growth and development. Whereas Asia’s equity markets are relatively well-developed, its debt markets are notably less deep and less diverse than those in US and Europe. Over the past decade, Asia’s debt market has broadened and deepened considerably. Total outstanding bonds in Asia ex-Japan grew at a compound annual growth rate (CAGR) of 17% to reach USD 8.2 trillion in 2014 as more investors and issuers entered the debt market. Singapore’s debt capital market grew well in 2014 and continued to attract a variety of issuers and investors from around the world.
Total debt issuance reached a record high of SGD 200 billion.
Record number of 149 issuers, including 62 first-time issuers.
Renminbi (“RMB”) bonds grew 153% from 2013 with issuances exceeding RMB 35 billion.
As new bank capital and liquidity rules take effect, long-term bank financing will become more expensive over time, and long-term assets such as infrastructure will need to rely more on capital markets for debt financing. As an indication of this demand for financing, the Asia-Pacific region is expected to represent almost 60% of global infrastructure creation by 2025. Secondary markets will also need to be strengthened as typical liquidity providers like banks will face tougher new regulations.
| MONETARY AUTHORITY OF SINGAPORE
3
12
1 SIFMA, 2009-2014: http://www.sifma.org/uploadedFiles/Research/Statistics/StatisticsFiles/CM-US-Bond-Market-
SIFMA.xls?n=07073 2 Morgan Stanley and Oliver Wyman, “Liquidity Conundrum: Shifting risks, what it means”, 19 March 2015.
We also need to take into account a new market structure that is emerging globally. The amount of outstanding bonds has burgeoned. As an indication, outstanding long-term debt in Singapore has grown by 60% while the US corporate debt market has grown by 30%1 in the last five years. Yet US dealer inventory in bonds is estimated by to have shrunk by 25-30% in the same period and could shrink by a further 10-20%2. Meanwhile, bond inventory is increasingly held by the buy-side, including the likes of asset managers, pension funds and insurers. And they are slowly finding ways to trade directly with each other, bypassing banks. Singapore has the right ingredients to build a strong debt market ecosystem, comprising large fixed income asset managers, major global banks with strong franchises and fixed income desks located here, a good mix of trading venues that bring together different user bases and offer different trading protocols. An effective bond market ecosystem will depend on five “I”s:
Investors
Issuers and Issuances
Intermediaries and Infrastructure MAS will focus our efforts on strengthening these pillars in the months ahead.

| MONETARY AUTHORITY OF SINGAPORE
4
Key Highlights
0
50
100
150
200
250
300
350
2010 2011 2012 2013 2014
Overview of Singapore Corporate Debt Market by Outstanding (2010 - 2014) SGD Bn
Short-Term (ST) Non-SGD Debt
Long-Term (LT) Non-SGD Debt
Short-Term (ST) SGDDebt
Long-Term (LT) SGDDebt
Currency Breakdown of All Issuances (2014)
USD 59.1% AUD 2.2% CNH/CNY 4.2%
EUR 2.3% GBP 16.0% HKD 1.8%
IDR 0.5% INR 0.1% JPY 0.3%
MYR 0.3% NZD 0.1% SGD 13.0%
0
50
100
150
200
250
2010 2011 2012 2013 2014
Short-Term (ST) Non-SGD Debt
Long-Term (LT) Non-SGD Debt
Short-Term (ST) SGD Debt
Long-Term (LT) SGD Debt
Overview of Singapore Corporate Debt Market (By Issuance Volume, SGD Bn)
| MONETARY AUTHORITY OF SINGAPORE
5
About The Report
The Monetary Authority of Singapore (MAS) conducted its annual survey of the Singapore corporate debt markets, for the year ending 31 December 2014.
The annual survey of the Singapore corporate debt market covered debt issues arranged by financial institutions in Singapore. This new-format Singapore Corporate Debt Market Development Report improves on the annual debt market survey. Besides reporting on how Singapore’s debt market has grown over the year, it aims to draw attention to topical issues and structural challenges in Asia’s debt markets. In this context, it will highlight how Singapore is building out its international debt capital market to play a purposeful role in addressing these issues and challenges to support Asia’s growth.
| MONETARY AUTHORITY OF SINGAPORE
6
3
3 Corporate debt refers to issuances by corporates, financial institutions, statutory boards/government agencies, supranationals, and
special purpose vehicles.
Findings
Debt Market Growth
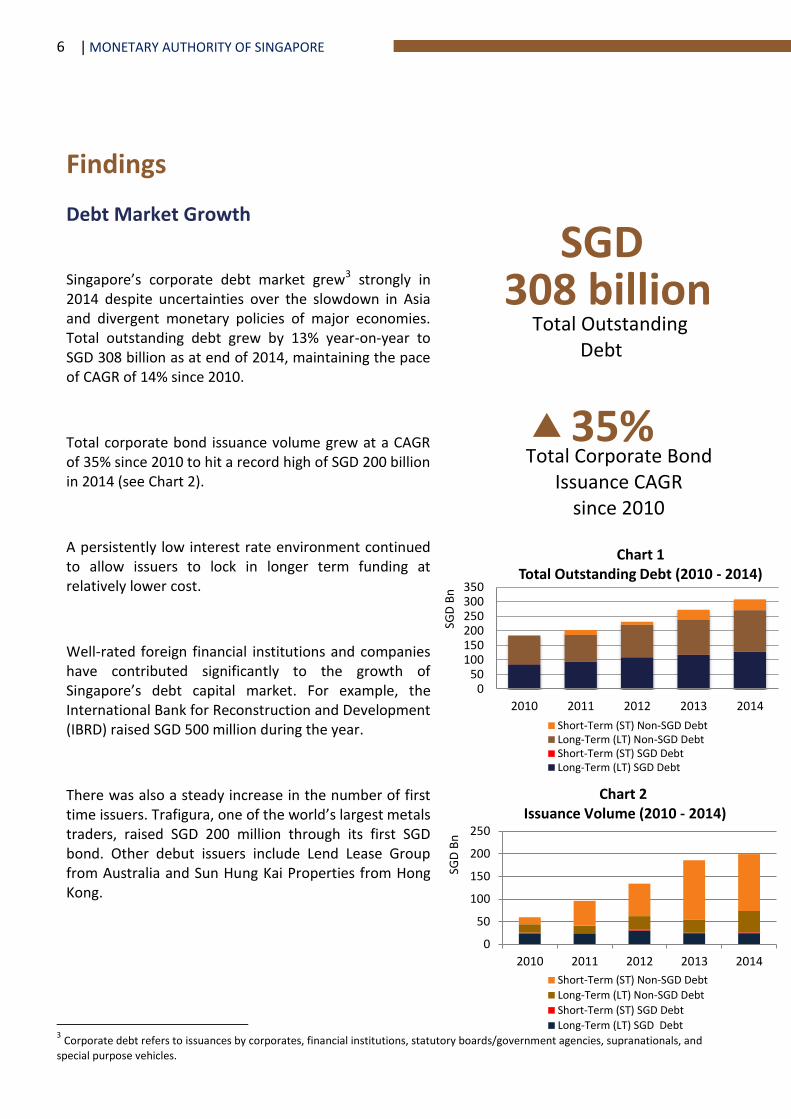
Singapore’s corporate debt market grew3 strongly in 2014 despite uncertainties over the slowdown in Asia and divergent monetary policies of major economies. Total outstanding debt grew by 13% year-on-year to SGD 308 billion as at end of 2014, maintaining the pace of CAGR of 14% since 2010.
Total corporate bond issuance volume grew at a CAGR of 35% since 2010 to hit a record high of SGD 200 billion in 2014 (see Chart 2).
A persistently low interest rate environment continued to allow issuers to lock in longer term funding at relatively lower cost.
Well-rated foreign financial institutions and companies have contributed significantly to the growth of Singapore’s debt capital market. For example, the International Bank for Reconstruction and Development (IBRD) raised SGD 500 million during the year.
There was also a steady increase in the number of first time issuers. Trafigura, one of the world’s largest metals traders, raised SGD 200 million through its first SGD bond. Other debut issuers include Lend Lease Group from Australia and Sun Hung Kai Properties from Hong Kong.
050
100150200250300350
2010 2011 2012 2013 2014
Chart 1 Total Outstanding Debt (2010 - 2014)
Short-Term (ST) Non-SGD DebtLong-Term (LT) Non-SGD DebtShort-Term (ST) SGD DebtLong-Term (LT) SGD Debt
35% Total Corporate Bond
Issuance CAGR since 2010
SGD 308 billion
Total Outstanding Debt
0
50
100
150
200
250
2010 2011 2012 2013 2014
Short-Term (ST) Non-SGD Debt
Long-Term (LT) Non-SGD Debt
Short-Term (ST) SGD Debt
Long-Term (LT) SGD Debt
Chart 2 Issuance Volume (2010 - 2014)
SGD
Bn
SG
D B
n

| MONETARY AUTHORITY OF SINGAPORE
7
Increasing Diversity of Issuers
The SGD corporate debt market continued to attract a diverse range of issuers in 2014. Non-property companies (38%) were the largest issuers in the SGD market, up from 17% in 2013. The other major issuers were financial institutions (19%), government agencies and statutory boards (16%), special purpose vehicles (13%), property corporates (12%) and supranational (2%) (see Chart 3). Local issuers remained significant in the SGD market. The Housing & Development Board was the largest non-financial institution issuer with SGD 4 billion in issuances. Its largest issue was a 3.1% SGD 900 million 10–year bond under its SGD 32 billion Multicurrency Medium Term Note ("MTN") Programme.
In the non-SGD market, financial institutions contributed nearly three quarters of the total issuances (see Chart 4). Nomura International Funding Pte Ltd issued more than SGD 2.3 billion in various foreign currencies including USD, EUR, AUD, IDR and NZD. The maturity of these instruments ranged from 3 to 30 years.
Chart 4 Non SGD Denominated Debt Issuer Profile (2014)
(Based on Issuance Volume) Financial Institutions73.6%
Special Purpose Vehicles4.9%
Government Agencies /Statutory Boards 0%
Supranational 0.3%
Corporation (Property)1.3%
Corporation (excludingProperty) 19.8%
Chart 3 SGD Denominated Debt Issuer Profile (2014)
(Based on Issuance Volume) Financial Institutions19.4%
Special PurposeVehicles 13.4%
Government Agencies /Statutory Boards 15.5%
Supranational 1.9%
Corporation (Property)12.0%
Corporation (excludingProperty) 37.8%
| MONETARY AUTHORITY OF SINGAPORE
8
AUD, 1.7% CNH/CNY,
3.7%
EUR, 2.5%
GBP, 18.6%
HKD, 1.8%
IDR, 0.6%
INR, 0.1%
JPY, 0.1% NZD, 0.2%
SGD, 5.1%
USD, 65.7%
2014
Singapore as a Multi-Currency Fixed Income Hub
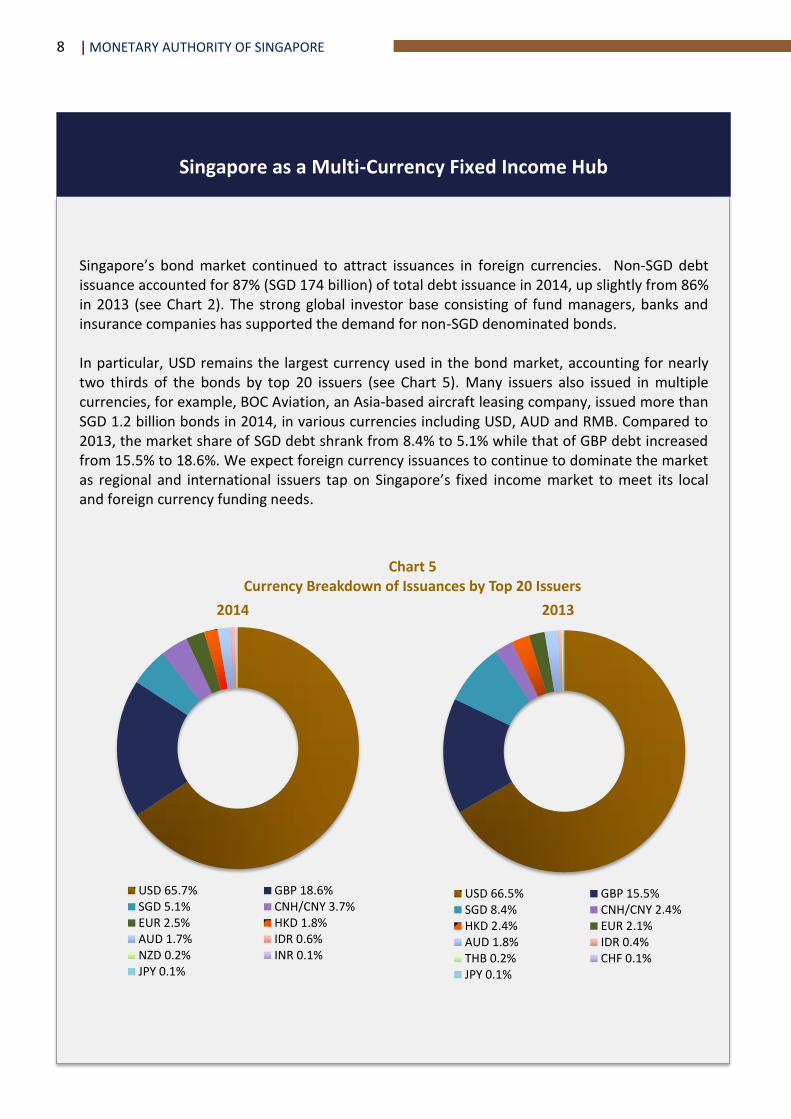
Singapore’s bond market continued to attract issuances in foreign currencies. Non-SGD debt issuance accounted for 87% (SGD 174 billion) of total debt issuance in 2014, up slightly from 86% in 2013 (see Chart 2). The strong global investor base consisting of fund managers, banks and insurance companies has supported the demand for non-SGD denominated bonds. In particular, USD remains the largest currency used in the bond market, accounting for nearly two thirds of the bonds by top 20 issuers (see Chart 5). Many issuers also issued in multiple currencies, for example, BOC Aviation, an Asia-based aircraft leasing company, issued more than SGD 1.2 billion bonds in 2014, in various currencies including USD, AUD and RMB. Compared to 2013, the market share of SGD debt shrank from 8.4% to 5.1% while that of GBP debt increased from 15.5% to 18.6%. We expect foreign currency issuances to continue to dominate the market as regional and international issuers tap on Singapore’s fixed income market to meet its local and foreign currency funding needs.
Chart 5 Currency Breakdown of Issuances by Top 20 Issuers
USD 65.7% GBP 18.6%SGD 5.1% CNH/CNY 3.7%EUR 2.5% HKD 1.8%AUD 1.7% IDR 0.6%NZD 0.2% INR 0.1%JPY 0.1%
2014 2013
USD 66.5% GBP 15.5%SGD 8.4% CNH/CNY 2.4%HKD 2.4% EUR 2.1%AUD 1.8% IDR 0.4%THB 0.2% CHF 0.1%JPY 0.1%

| MONETARY AUTHORITY OF SINGAPORE
9
Investors
A wide range of investors, with different investment profiles, participates in Singapore’s bond market:
Financial institutions were able to access a deep money market for liquidity management;
Fund managers and insurance companies provided healthy take up of long term issues, as these entities usually adopt longer term investment horizons;
Private banks accounted for almost half of investments into SGD debt, with private banking clients driving demand for high yield corporate SGD bonds;
Fund managers and banks are the key investors in non-SGD issues, as most of these institutional investors from US and Europe had mandates to invest in USD, GBP and EUR products.
Chart 6 Investors in ST issuances Investors in SGD issuances
Investors in LT issuances Investors in Non-SGD issuances
FIs 61.7%
Funds 23.4%
Private Banking 6.5%
Corporates 3.8%
Insurance 2.4%
Retail 1.0%
Others 1.3%
Private Banking 43.5%FIs 21.6%Funds 13.7%Insurance 13.0%Retail 3.0%Others 3.0%Corporates 2.3%
Funds 32.3%FIs 27.4%Private Banking 23.8%Insurance 10.5%Others 3.1%Corporate 2.2%Retail 0.7%
FIs 53.8%Funds 28.5%Private Banking 8.0%Insurance 4.1%Corporates 3.3%Others 1.7%Retail 0.6%

| MONETARY AUTHORITY OF SINGAPORE
10
-
500
1,000
1,500
2,000
2,500
2009 2010 2011 2012 2013 2014S$
bil
lio
n
Discretionary
-
500
1,000
1,500
2,000
2,500
2009 2010 2011 2012 2013 2014
S$ b
illi
on
Discretionary
More Fixed Income Managers are setting up in Singapore
The presence of a strong institutional investor base has anchored the growth of Singapore’s capital market and benefited issuers looking to diversify their funding sources, and achieve efficient cost of funding. As at end-2014, aggregate assets under management (“AUM”) reached SGD 2.4 trillion, of which 81% was sourced from outside Singapore. About SGD 500 billion in AUM was allocated to fixed income managers. Many top fixed income fund managers in Singapore increased their investments in 2014. Aside from traditional managers, alternative investment managers like hedge funds and private equity funds also started investing in fixed income securities.
Equities 50%
Bonds 21%
Alternatives 15%
CIS 10%
Cash/MoneyMarket 4%
Asia Pacific68%
Europe 13%
North America11%
Rest of World8%
Chart 7
Assets under Management
-
500
1,000
1,500
2,000
2,500
2009 2010 2011 2012 2013 2014
SGD
Bn
Discretionary Advisory
Investment of Funds by Asset Class
Investment of Funds by Region Sources of Funds by Region
Asia Pacific54%
Europe 19%
North America18%
Rest of World9%
| MONETARY AUTHORITY OF SINGAPORE
11
4
4 MAS Response to Feedback Received – Facilitating Bond Offerings to Retail Investors, 23 December 2014
IMPROVING RETAIL ACCESS TO THE BOND MARKET While institutional investors will continue to anchor demand for corporate debt issued in Singapore, there is scope to broaden the investor base through retail participation. There are already four bond offerings to retail investors this year alone, all of which were oversubscribed, compared to the total of four retail bond offerings between 2001 and 2014. MAS will be introducing regulatory changes to facilitate bond offerings to retail investors.
Seasoning framework: Retail investors can access wholesale bonds issued by eligible issuers without a prospectus after the bonds have been listed for six months. To facilitate retail investment, such bonds can be re-denominated into smaller lot sizes. In addition, eligible issuers will have the option of making offers of new bonds to retail investors after the seasoning period, as long as the new bonds have the same terms as the seasoned bonds.
Exempt bond issuers: Bonds issued by issuers that satisfy certain thresholds which are higher than the eligibility criteria under the seasoning framework can be offered directly to retail investors at the start of an offer without a prospectus. The issuer will need to provide investors with a simplified disclosure document as well as a product highlight sheet.
An estimated 120 issuers in Singapore can potentially avail themselves to the seasoning framework, and about 60 of these issuers are potential exempt bond issuers4. Retail investors can look forward to a broader range of investment opportunities in the debt capital market, while eligible issuers will enjoy greater convenience in offering high quality fixed income assets to retail investors.
| MONETARY AUTHORITY OF SINGAPORE
12
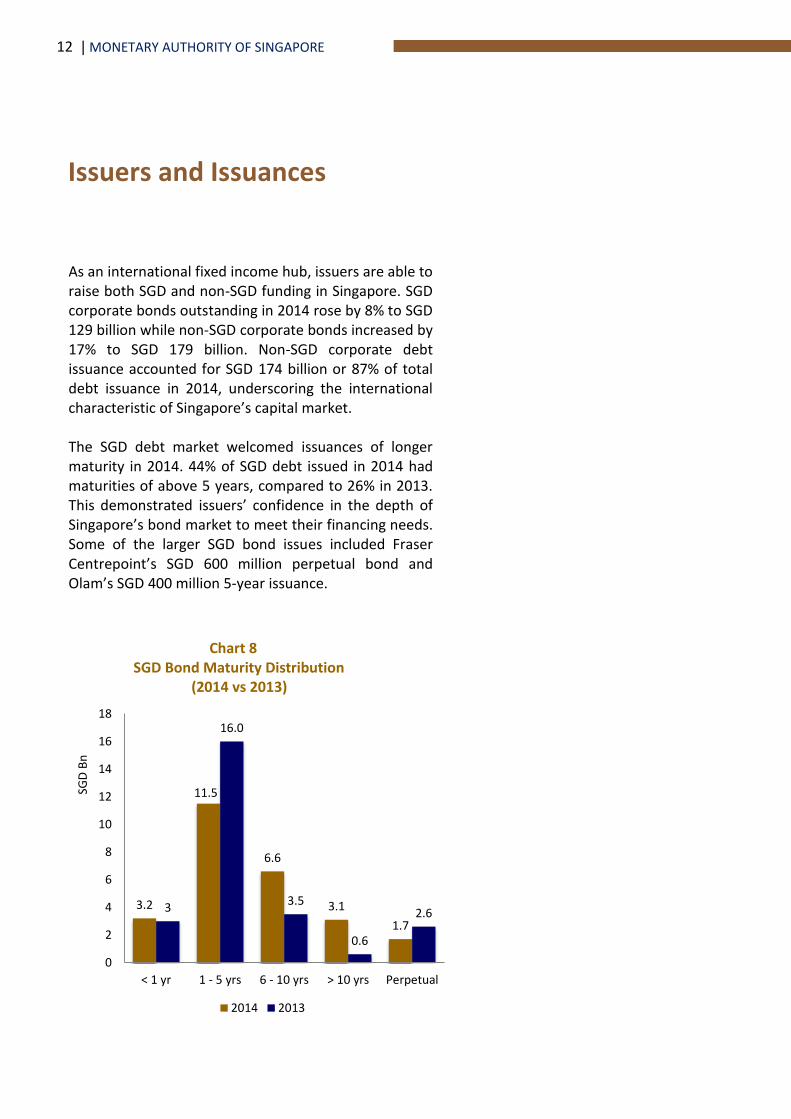
As an international fixed income hub, issuers are able to raise both SGD and non-SGD funding in Singapore. SGD corporate bonds outstanding in 2014 rose by 8% to SGD 129 billion while non-SGD corporate bonds increased by 17% to SGD 179 billion. Non-SGD corporate debt issuance accounted for SGD 174 billion or 87% of total debt issuance in 2014, underscoring the international characteristic of Singapore’s capital market. The SGD debt market welcomed issuances of longer maturity in 2014. 44% of SGD debt issued in 2014 had maturities of above 5 years, compared to 26% in 2013. This demonstrated issuers’ confidence in the depth of Singapore’s bond market to meet their financing needs. Some of the larger SGD bond issues included Fraser Centrepoint’s SGD 600 million perpetual bond and Olam’s SGD 400 million 5-year issuance.
Issuers and Issuances
1
< 1 yr 1 - 5 yrs 6 - 10 yrs > 10 yrs Perpetual
Issu
ance
Vo
lum
e (
S$ B
n)
#REF! Column2 Column1
Chart 8 SGD Bond Maturity Distribution (2014 vs 2013)
3.2
11.5
6.6
3.1
1.7
3
16.0
3.5
0.6
2.6
0
2
4
6
8
10
12
14
16
18
< 1 yr 1 - 5 yrs 6 - 10 yrs > 10 yrs Perpetual
SGD
Bn
2014 2013
| MONETARY AUTHORITY OF SINGAPORE
13
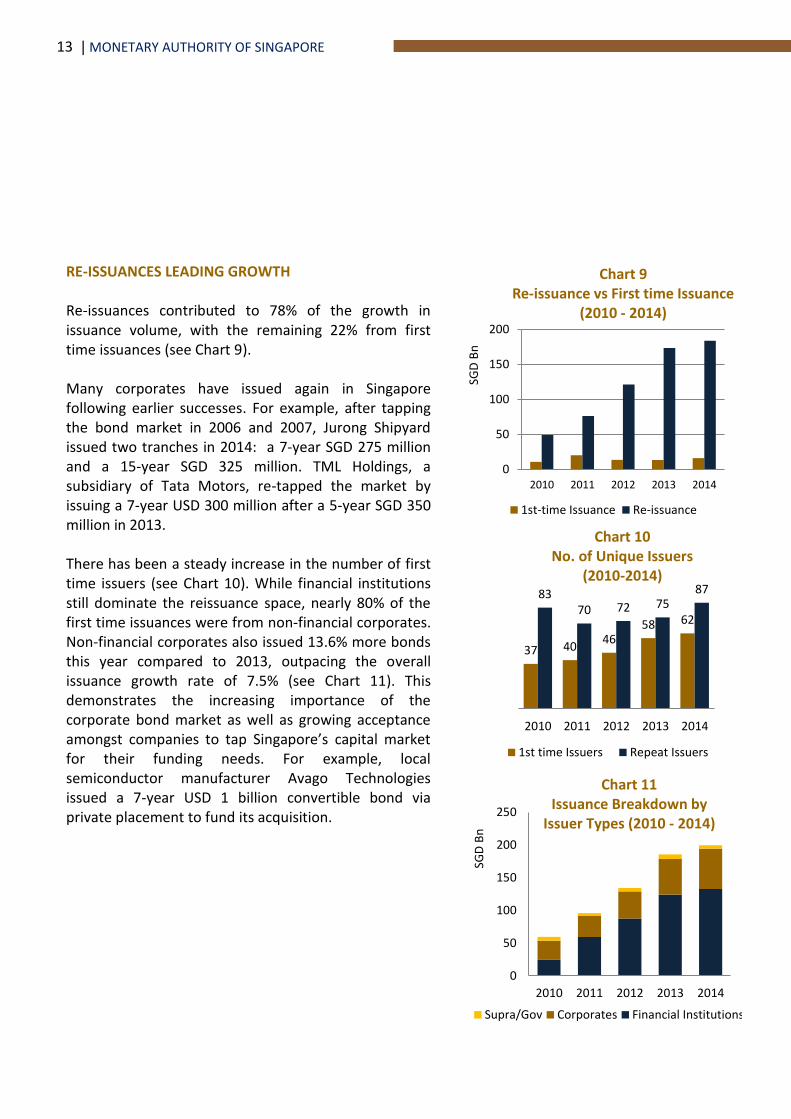
RE-ISSUANCES LEADING GROWTH Re-issuances contributed to 78% of the growth in issuance volume, with the remaining 22% from first time issuances (see Chart 9). Many corporates have issued again in Singapore following earlier successes. For example, after tapping the bond market in 2006 and 2007, Jurong Shipyard issued two tranches in 2014: a 7-year SGD 275 million and a 15-year SGD 325 million. TML Holdings, a subsidiary of Tata Motors, re-tapped the market by issuing a 7-year USD 300 million after a 5-year SGD 350 million in 2013. There has been a steady increase in the number of first time issuers (see Chart 10). While financial institutions still dominate the reissuance space, nearly 80% of the first time issuances were from non-financial corporates. Non-financial corporates also issued 13.6% more bonds this year compared to 2013, outpacing the overall issuance growth rate of 7.5% (see Chart 11). This demonstrates the increasing importance of the corporate bond market as well as growing acceptance amongst companies to tap Singapore’s capital market for their funding needs. For example, local semiconductor manufacturer Avago Technologies issued a 7-year USD 1 billion convertible bond via private placement to fund its acquisition.
0
50
100
150
200
2010 2011 2012 2013 2014SG
D B
n
Chart 9 Re-issuance vs First time Issuance
(2010 - 2014)
1st-time Issuance Re-issuance
37 40 46
58 62
83 70 72 75
87
2010 2011 2012 2013 2014
1st time Issuers Repeat Issuers
0
50
100
150
200
250
2010 2011 2012 2013 2014
Supra/Gov Corporates Financial Institutions
Chart 11 Issuance Breakdown by
Issuer Types (2010 - 2014)
SGD
Bn
Chart 10 No. of Unique Issuers
(2010-2014)
| MONETARY AUTHORITY OF SINGAPORE
14
5
5 The assumption of 40-years tenor is adopted for all perpetual capital securities issuances.
More Long-dated Bonds Issued
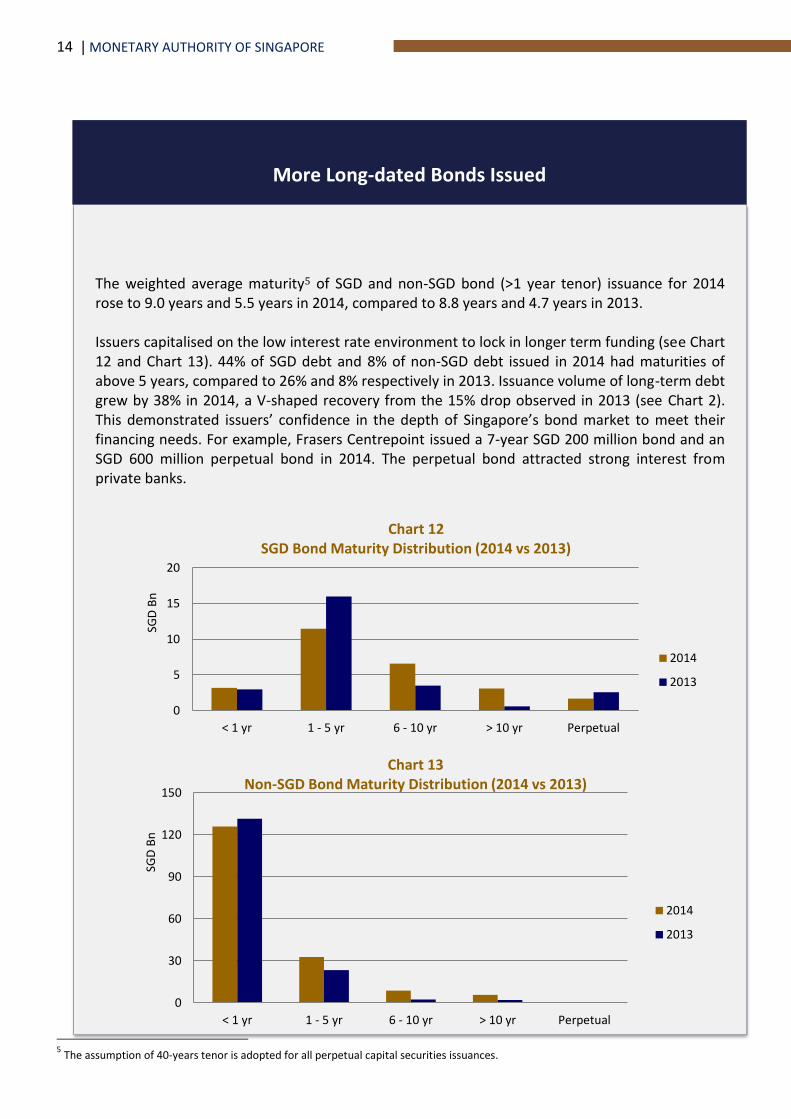
The weighted average maturity5 of SGD and non-SGD bond (>1 year tenor) issuance for 2014 rose to 9.0 years and 5.5 years in 2014, compared to 8.8 years and 4.7 years in 2013. Issuers capitalised on the low interest rate environment to lock in longer term funding (see Chart 12 and Chart 13). 44% of SGD debt and 8% of non-SGD debt issued in 2014 had maturities of above 5 years, compared to 26% and 8% respectively in 2013. Issuance volume of long-term debt grew by 38% in 2014, a V-shaped recovery from the 15% drop observed in 2013 (see Chart 2). This demonstrated issuers’ confidence in the depth of Singapore’s bond market to meet their financing needs. For example, Frasers Centrepoint issued a 7-year SGD 200 million bond and an SGD 600 million perpetual bond in 2014. The perpetual bond attracted strong interest from private banks.
0
5
10
15
20
< 1 yr 1 - 5 yr 6 - 10 yr > 10 yr Perpetual
Chart 12 SGD Bond Maturity Distribution (2014 vs 2013)
2014
2013
SGD
Bn
0
30
60
90
120
150
< 1 yr 1 - 5 yr 6 - 10 yr > 10 yr Perpetual
Chart 13 Non-SGD Bond Maturity Distribution (2014 vs 2013)
2014
2013
SGD
Bn
| MONETARY AUTHORITY OF SINGAPORE
15
6
6 China to widen its economic influence by “One Belt, One Road”, The Business Times, 12 August 2015
ASIAN LOCAL CURRENCY ISSUES Growth in the coming years will be led by Asian issuers, underpinned by two factors: China’s “One Belt, One Road” initiative seeks to establish infrastructure links, including railways, highways, oil and gas pipelines, power grids, internet networks and maritime, across central, west and south Asia to Europe and Africa. The total investment in infrastructure projects could reach RMB 1.5 trillion in the coming years6. This development strategy is expected to catalyse greater bond issuances including offshore RMB bonds by Chinese companies to fund trade and investment activities in the region. Under a new framework announced by the Reserve Bank of India in September 2015, Indian corporates will be allowed to issue Rupee-denominated bonds overseas as part of their external commercial borrowings (“ECB”). This will enable them to diversify their funding base – Indian companies borrowed some USD 26 billion under the ECB framework in 2014 – and achieve more efficient cost of funding. Several Public Sector Undertakings have responded positively to the new framework and are expected to tap the new funding channel starting 2016. With a deep pool of India-oriented investors, and with more than 80% of overseas Indian bonds listed on the Singapore Exchange (including Reliance Industries Ltd, National Thermal Power Corporation Ltd, ONGC Videsh Ltd), we can expect to see more offshore Rupee-denominated bond issuances in Singapore. Anchored by a broad community of asset managers and institutional investors seeking investment opportunities in Asia, Singapore continues to provide a deep and liquid debt capital market for companies in the region to meet their funding needs. MAS will continue to work with financial institutions, investors and corporates to explore opportunities for offshore RMB and Rupee bond issuances and encourage more corporates to leverage on Singapore’s debt capital markets capabilities for their funding needs.
| MONETARY AUTHORITY OF SINGAPORE
16
0
10
20
30
40
50
60
Issuance Outstanding
2013
2014
Strong Growth of RMB Bonds
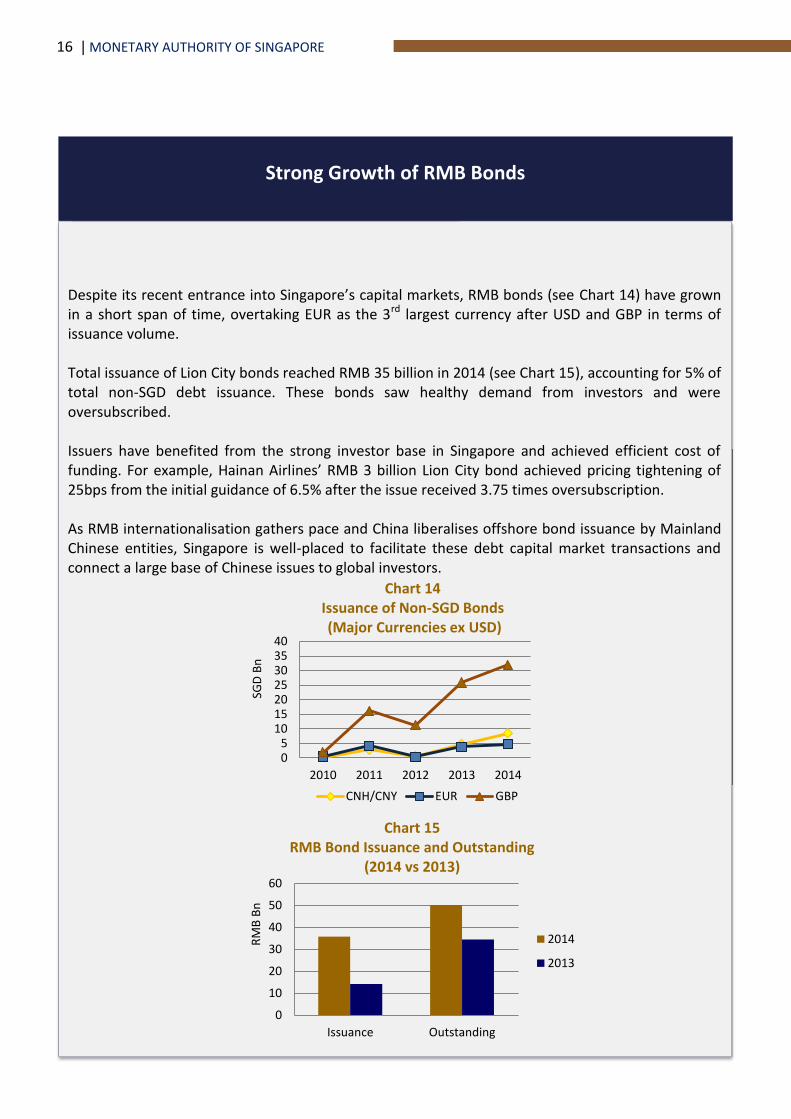
Despite its recent entrance into Singapore’s capital markets, RMB bonds (see Chart 14) have grown in a short span of time, overtaking EUR as the 3rd largest currency after USD and GBP in terms of issuance volume. Total issuance of Lion City bonds reached RMB 35 billion in 2014 (see Chart 15), accounting for 5% of total non-SGD debt issuance. These bonds saw healthy demand from investors and were oversubscribed. Issuers have benefited from the strong investor base in Singapore and achieved efficient cost of funding. For example, Hainan Airlines’ RMB 3 billion Lion City bond achieved pricing tightening of 25bps from the initial guidance of 6.5% after the issue received 3.75 times oversubscription. As RMB internationalisation gathers pace and China liberalises offshore bond issuance by Mainland Chinese entities, Singapore is well-placed to facilitate these debt capital market transactions and connect a large base of Chinese issues to global investors.
05
10152025303540
2010 2011 2012 2013 2014
SGD
Bn
CNH/CNY EUR GBP
Chart 14 Issuance of Non-SGD Bonds (Major Currencies ex USD)
0
10
20
30
40
50
60
Issuance Outstanding
2014
2013
Chart 15 RMB Bond Issuance and Outstanding
(2014 vs 2013)
RM
B B
n
| MONETARY AUTHORITY OF SINGAPORE
17
MAS issued MAS Notice 648 on 31 December 2013 to allow locally-incorporated banks to issue covered bonds to diversify their funding sources and broaden their long-term funding tools. The Notice was amended on 4 June 2015 following industry consultation to allow greater flexibility when issuing covered bonds in Singapore. The revised MAS Notice 648 accommodated an alternative structure whereby a trust is declared over the assets in the cover pool, and the beneficial interest under the trust is transferred to a special purpose vehicle. This new structure would be subject to safeguards, including adequate and independently-verified ring fencing arrangements over the legal arrangement. The revised Notice also clarified that residential mortgage loans with a loan-to-value (“LTV”) in excess of 80% may be retained in the cover pool. This is subject to the condition that only the portion of the loan amounting to an LTV of 80% may be used towards fulfilling the minimum over-collateralisation requirement of 103%, while the entire loan amount has to be counted towards the 4% encumbrance limit. Lastly, queries pertaining to the computation of total assets for the purpose of complying with the 4% encumbrance limit have also been addressed. On 16 June 2015, DBS announced that it had established a USD 10 billion covered bond programme and issued its first USD 1 billion fixed rate covered bonds due 2018 later that month. With the inaugural issuance of covered bonds by DBS, Singapore is the third jurisdiction in Asia Pacific (together with Australia and Korea) with covered bond issuances.
Covered Bonds
| MONETARY AUTHORITY OF SINGAPORE
18
7
7 SGX announced its plan in November 2014 to launch a bond trading platform, SGX Bond Pro, for Asian corporate bonds
Intermediaries and Infrastructure
ENLARGING THE SECONDARY MARKET Post global financial crisis, bond market liquidity has declined, arising from a confluence of regulatory reforms, central banks’ low interest rate policies which induced a ‘search for yield” and reduced dealer inventory. As banks’ capacity to warehouse risks on their books reduces, there has been a pronounced shift to an agency model where dealers act as brokers to facilitate trades between two parties. Electronic trading aims to aggregate liquidity across all market participants, including investors and dealers. Such trading venues could help to centralise liquidity, reduce reliance on dealer inventory and lead to increased turnover. With incumbent platform operators improving their bond offerings and new entrants7 looking to grow in Asia, we are hopeful that this will strengthen the electronic trading landscape and facilitate direct trading between market participants. As part of efforts to facilitate trading, MAS established the Securities Repo Facility (SRF) in May 2015 to provide an avenue for eligible counterparties to borrow SGD corporate bonds for the purpose of market making. This reduces the risk that market makers face in fulfilling transactions while end-investors will in turn benefit from the certainty of being able to enter and exit their positions with minimal price slippage.

Monetary Authority of Singapore 10 Shenton Way
MAS Building Singapore 079117 www.mas.gov.sg