Embed Size (px)
Citation preview
Food & Beverages│Singapore│Equity research│September 14, 2016
Company Note │ Alpha series
IMPORTANT DISCLOSURES, INCLUDING ANY REQUIRED RESEARCH CERTIFICATIONS, ARE PROVIDED AT THE END OF THIS REPORT. IF THIS REPORT IS DISTRIBUTED IN THE UNITED STATES IT IS DISTRIBUTED BY CIMB SECURITIES (USA), INC. AND IS CONSIDERED THIRD-PARTY AFFILIATED RESEARCH.
Powered by the EFA Platform
Auric Pacific Group Ltd A bread and butter investment
Auric is a diversified F&B play with a portfolio of well-established brands. ■ We expect Auric to return to sustainable profitability from FY16 onwards. ■ Its bread and butter business is a prized asset with leading market positions. ■ Management buying shares reveals confidence and commitment. ■ Significant net cash position at 48% of market cap. Initiate coverage with Add. ■
A diversified F&B play with a portfolio of well-established brands Auric manufactures and distributes fast-moving consumer goods in Singapore and Malaysia. Its house brands, such as Sunshine bread, SCS butter and Buttercup, have leading positions in the local markets. Auric also has a food retail arm, managing and operating a chain of food courts under the Food Junction brand in Singapore and Malaysia, as well as over 130 Delifrance cafe outlets in Singapore and Hong Kong.
Losses and rationalisation behind, sustainable profit ahead We expect Auric to return to sustainable profitability from FY16 onwards thanks to its rationalisation efforts (including the closure of a number of loss-making Delifrance cafes and a few restaurants) that were mostly done in FY15. In fact, Auric’s core net profit had returned into the black as early as 2Q15, but the turnaround was masked by non-recurring losses (e.g. impairment of goodwill) related to its rationalisation exercises. Auric’s quarterly core net profit has since widened from S$3m in 2Q15 to S$7m in 2Q16.
Bread and butter business is a prized asset Employing merely c.S$10m equity and little debt, Auric’s food manufacturing business (c.40% of group FY16F profit) delivered yearly pretax profit of S$6m-11m in FY12-15. We think the remarkable return roots from the leading local market shares of Sunshine Bread, SCS and Buttercup, which have provided Auric with economic moats against competition. We applaud Auric’s strategy to refocus on its bread and butter business.
Strong balance sheet with significant net cash position Auric had S$69m net cash as at end-2Q16, equivalent to 48% of its market cap. We expect the net cash position to be further built up ahead, with the steady cashflow from its bread and butter business and the expected turnaround of the food retail business. We prefer Auric to utilise the cash to pay dividend and to pursue organic growth, instead of venturing into uncharted territory via M&As which it has a patchy track record in.
Management’s determined buying of shares reveals confidence Dr Andy Adhiwana, group CEO (appointed on 9 May 16) and son-in-law of Indonesian tycoon Dr Stephen Riady (who is deemed to have interest in 49.28% shares of Auric via his HK-listco Lippo China Resources Limited), has been aggressively buying Auric’s shares from the open market since 1 Sep 15. With the latest purchase done on 2 Sep 16, Dr Adhiwana has acquired a total of 6.3m Auric shares, or 5.01% of Auric’s total issued cap, with purchase prices ranging from S$0.72 to S$1.15 apiece.
Very compelling valuation; initiate coverage with Add Auric currently trades at 9.6x/8.8x FY16/17 P/E (5.2x/4.0x if ex-net-cash) vs. its bakery peers averaging at 15.9x/13.1x (other major F&B brand owners at 24.8x/21.4x). Our target price of S$1.69 is based on a 20% liquidity discount to a conservatively-estimated FY16 SOP value. Sustainable profitability is a key potential re-rating catalyst; expensive M&A is a key risk.
▎Singapore
ADD Consensus ratings*: Buy 0 Hold 0 Sell 0
Current price: S$1.16 Target price: S$1.69 Previous target: S$ Up/downside: 45.9% CIMB / Consensus: na
Reuters: AURI.SI Bloomberg: AP SP Market cap: US$106.4m S$145.1m Average daily turnover: US$0.05m S$0.07m Current shares o/s: 125.7m Free float: 24.4% * Source: Bloomberg Key changes in this note
No change.
Source: Bloomberg Price performance 1M 3M 12M Absolute (%) 12.1 31.3 45.3 Relative (%) 13.8 30.1 47.7 Major shareholders % held Lippo China Resources Limited 49.3 Dr Andy Adhiwana 26.9
Analyst(s)
Roy CHEN, CFA T (65) 6210 8685 E [email protected] William TNG, CFA T (65) 6210 8676 E [email protected]
[ X ]
SOURCE: COMPANY DATA, CIMB FORECASTS
Financial Summary Dec-14A Dec-15A Dec-16F Dec-17F Dec-18FRevenue (S$m) 424.1 432.6 426.8 438.3 450.3Operating EBITDA (S$m) 17.25 24.38 32.91 34.75 36.05Net Profit (S$m) 0.23 (40.84) 8.50 16.45 17.62Core EPS (S$) (0.01) 0.06 0.12 0.13 0.14Core EPS Growth (61%) 118% 8% 7%FD Core P/E (x) NA 20.89 9.57 8.82 8.24DPS (S$) 0.020 0.020 - 0.020 0.020Dividend Yield 1.73% 1.73% 0.00% 1.73% 1.73%EV/EBITDA (x) 6.10 4.15 2.41 1.94 1.49P/FCFE (x) NA 152.6 7.7 10.2 8.9Net Gearing (19.4%) (27.8%) (39.1%) (42.5%) (46.2%)P/BV (x) 0.70 0.91 0.86 0.79 0.73ROE (0.34%) 3.77% 9.20% 9.33% 9.23%% Change In Core EPS Estimates CIMB/consensus EPS (x)
85
112
138
165
0.600
0.800
1.000
1.200Price Close Relative to FSSTI (RHS)
1
1
2
Sep-15 Dec-15 Mar-16 Jun-16
Vol m

Food & Beverages│Singapore│Equity research│September 14, 2016
2
A bread and butter investment Investment Summary Owner of well-established brands Auric Pacific owns, manufactures and distributes a number of well-established household brands, including Sunshine bread, SCS butter and Buttercup which have leading market positions in Singapore and Malaysia. It also has the distributorship for a portfolio of over a hundred agency brands. For its food retail business, Auric manages and operates 17 Food Junction food courts in Singapore and Malaysia, and more than 130 Delifrance (a French-styled café concept) outlets in Singapore and Hong Kong.
Figure 1: Auric owns a number of well-established household brands (Sunshine bread, SCS butter and Buttercup etc.)
Figure 2: Auric also has the distributorship for a portfolio of agency brands
SOURCE: COMPANY SOURCE: COMPANY
Figure 3: Auric manages and operates 17 food courts in Singapore and Malaysia under the Food Junction brand
Figure 4: Auric manages and operates more than 130 Delifrance outlets in Singapore and Hong Kong
SOURCE: COMPANY SOURCE: COMPANY
Losses and rationalisation are behind, sustainable profit ahead Previous M&As resulted in years of losses - The acquisitions of Delifrance (completed in Dec 07) and Food Junction Group (controlling stake acquired in Sep 08, delisted in mid-2013) have proven to be costlier than management had previously expected. Over the eight years from the time the businesses were

Food & Beverages│Singapore│Equity research│September 14, 2016
3
consolidated into the group in FY08 till FY15, Delifrance and Food Junction Group recorded total pre-tax losses of over S$120m (including impairment losses of S$58.5m on intangible assets, which previously arose from the acquisition of Delifrance and Food Junction Group).
See Appendix for more information on the history of the group, including its past M&A activities (page 18 of the report).
Figure 5: Reported pretax losses of Delifrance and Food Junction Group in FY08-15
SOURCES: CIMB, COMPANY REPORTS
Weeding, consolidating, rationalising and enhancing - Since FY13, the group has adopted a strategy of “weeding, consolidating, rationalising and enhancing”. In FY13-15, a number of loss-marking food retail outlets were shut down, including Delifrance’s entire Malaysia operations and a number of restaurants previously operated under Food Junction Group (we note that, although the restaurant part of Food Junction has been loss making, Food Junction’s food court business was always profitable).
Over the years, the number of Delifrance outlets has been reduced from over 230 in FY07 (when Auric acquired Delifrance) to c.130 as at end-FY15, while the number of restaurants under Food Junction Group has also been reduced from its peak of over 10 restaurants to only two as of today (14 Sep 16). Auric’s significant rationalisation efforts came with necessary pains. The significant exceptional losses (mainly the impairment losses on goodwill and trademarks) related to the rationalisation exercises of Delifrance and Food Junction Group’s restaurant business sent Auric’s net profit into the red in FY13 (S$21.9m loss) and FY15 (S$40.8m loss), while FY14 net profit was at a mere S$0.2m.
Returning into sustainable profitability - According to management, most of the rationalisation exercises have been completed in FY15. Intangible assets related to Delifrance have been fully amortised/impaired to date and we believe the risk of further impairment on the remaining intangible assets related to Food Junction Group (S$30.2m as at end-FY15) to be low, given that Food Junction Group should return into sustainable profitability going forward. We note that, even if further impairment losses are recognised, they should not concern investors, because 1) such items are non-recurring and non-cash in nature, and 2) they have no impact on our valuation.
With the above considerations, we believe FY16 to mark the year that Auric (as a group) returns into sustainable profitability. We particularly note that Auric’s core net profit has in fact achieved a turnaround as early as 2Q15 at S$3.0m and since increased to S$7.0m in 2Q16. However, the turnaround and improvement in core profitability have been masked by the non-recurring losses (including impairments on intangible assets and financial investment) during the period.
-7.5-10.1
-2.4-4.9
-2.8
-18.5
-6.1
-45.3
0.8 2.1 1.5 2.4
-7.9
-12.6
-5.4 -4.9
-50.0
-40.0
-30.0
-20.0
-10.0
0.0
10.0
FY08 FY09 FY10 FY11 FY12 FY13 FY14 FY15
Delifrance (S$'m) Food Junction Group (S'm)
Delifrance and Food Junction Group recorded total pretax losses of over S$120m during FY08-15
Food & Beverages│Singapore│Equity research│September 14, 2016
4
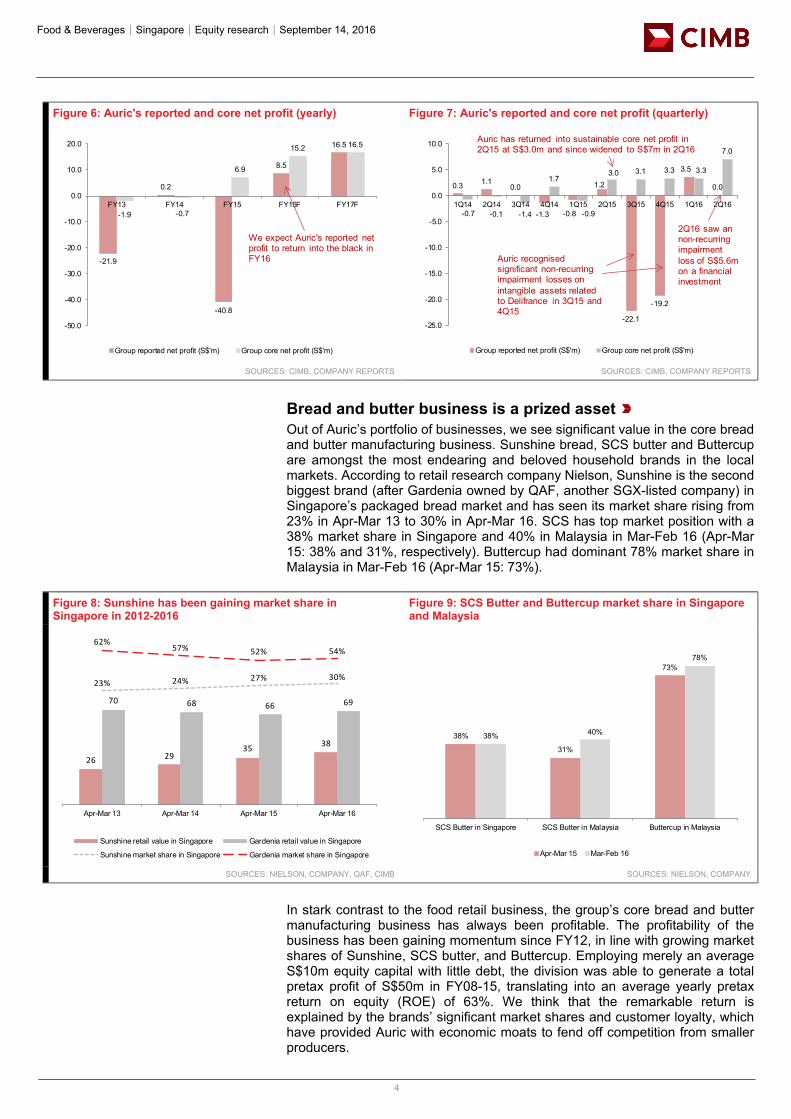
Figure 6: Auric's reported and core net profit (yearly) Figure 7: Auric's reported and core net profit (quarterly)
SOURCES: CIMB, COMPANY REPORTS SOURCES: CIMB, COMPANY REPORTS
Bread and butter business is a prized asset Out of Auric’s portfolio of businesses, we see significant value in the core bread and butter manufacturing business. Sunshine bread, SCS butter and Buttercup are amongst the most endearing and beloved household brands in the local markets. According to retail research company Nielson, Sunshine is the second biggest brand (after Gardenia owned by QAF, another SGX-listed company) in Singapore’s packaged bread market and has seen its market share rising from 23% in Apr-Mar 13 to 30% in Apr-Mar 16. SCS has top market position with a 38% market share in Singapore and 40% in Malaysia in Mar-Feb 16 (Apr-Mar 15: 38% and 31%, respectively). Buttercup had dominant 78% market share in Malaysia in Mar-Feb 16 (Apr-Mar 15: 73%).
Figure 8: Sunshine has been gaining market share in Singapore in 2012-2016
Figure 9: SCS Butter and Buttercup market share in Singapore and Malaysia
SOURCES: NIELSON, COMPANY, QAF, CIMB SOURCES: NIELSON, COMPANY
In stark contrast to the food retail business, the group’s core bread and butter manufacturing business has always been profitable. The profitability of the business has been gaining momentum since FY12, in line with growing market shares of Sunshine, SCS butter, and Buttercup. Employing merely an average S$10m equity capital with little debt, the division was able to generate a total pretax profit of S$50m in FY08-15, translating into an average yearly pretax return on equity (ROE) of 63%. We think that the remarkable return is explained by the brands’ significant market shares and customer loyalty, which have provided Auric with economic moats to fend off competition from smaller producers.
-21.9
0.2
-40.8
8.5
16.5
-1.9 -0.7
6.9
15.2 16.5
-50.0
-40.0
-30.0
-20.0
-10.0
0.0
10.0
20.0
FY13 FY14 FY15 FY16F FY17F
Group reported net profit (S$'m) Group core net profit (S$'m)
We expect Auric's reported net profit to return into the black in FY16
0.3 1.10.0
-1.3 -0.8
1.2
-22.1
-19.2
3.5
0.0
-0.7 -0.1 -1.4
1.7
-0.9
3.0 3.1 3.3 3.3
7.0
-25.0
-20.0
-15.0
-10.0
-5.0
0.0
5.0
10.0
1Q14 2Q14 3Q14 4Q14 1Q15 2Q15 3Q15 4Q15 1Q16 2Q16
Group reported net profit (S$'m) Group core net profit (S$'m)
2Q16 saw an non-recurring impairment loss of S$5.6m on a financial investment
Auric recognised significant non-recurring impairment losses on intangible assets related to Delifrance in 3Q15 and 4Q15
Auric has returned into sustainable core net profit in 2Q15 at S$3.0m and since widened to S$7m in 2Q16
26 2935 38
70 68 66 69
23% 24% 27% 30%
62%57% 52% 54%
Apr-Mar 13 Apr-Mar 14 Apr-Mar 15 Apr-Mar 16
Sunshine retail value in Singapore Gardenia retail value in Singapore
Sunshine market share in Singapore Gardenia market share in Singapore
38%
31%
73%
38% 40%
78%
SCS Butter in Singapore SCS Butter in Malaysia Buttercup in Malaysia
Apr-Mar 15 Mar-Feb 16

Food & Beverages│Singapore│Equity research│September 14, 2016
5
Figure 10: Pretax profit of bread and butter business Figure 11: Remarkable pretax ROE of manufacturing business
SOURCES: CIMB, COMPANY REPORTS SOURCES: CIMB, COMPANY REPORTS
In Auric’s FY15 annual report, management revealed that its strategy was to refocus on the core bread and butter business. We welcome this strategy and believe that the brands have more potential that has yet to be realised. Auric may consider expanding its presence in the regional market, either by itself or through partnerships, leveraging on its distribution network and the well-established brands.
Strong balance sheet with significant net cash position Auric had a significant net cash position of S$69m as at end-2Q16, which is equivalent to 48% of its market cap. Given the steady operating cashflow from the bread and butter business as well as the expected turnaround of previously loss-marking food retail business, we expect Auric’s cash position to be further built up.
We think that management should consider utilising the cash position to reward shareholders with dividends (Auric used to pay 2-3 Scts dividend per share in FY10-14 but ceased paying in FY15), and/or to pursue organic growth for its core bread and butter business. Our least preferred option is that Auric uses the cash to venture into uncharted territory via M&As. Auric has a patchy record in this, as can be seen from the years of losses after the previous acquisitions of Delifrance and Food Junction Group.
Figure 12: Net cash position of S$69m as at end-2QFY16 (48% of market cap)
SOURCES: CIMB, COMPANY REPORTS
3.4
5.8
7.2
2.3
6.1
7.3 7.4
10.6
FY08 FY09 FY10 FY11 FY12 FY13 FY14 FY15
PBT of bread and butter manufacturing business (S$'m)
PBT of Auric's manufacturing business rose in FY12-16, in line with the growing market share of Sunshine, SCS Butter and Buttercup
8.16.4
7.6
14.9
10.1
12.8 12.6
7.6
53%
80%104%
20%
49%63% 58%
105%
FY08 FY09 FY10 FY11 FY12 FY13 FY14 FY15
Equity capital employed (S$'m) Pretax return on equity
Average equity capitalutilised: S$10m
Average pretax ROE: 63%
57.552.9
40.544.7
69.2
23% 25%19%
28%
39%
FY12 FY13 FY14 FY15 end-2QFY16
Net cash (S$'m) Net cash as % of equity
Food & Beverages│Singapore│Equity research│September 14, 2016
6
Management buying shares reveals confidence and commitment Adding to our case that Auric would return to sustainable profitability is key management’s determined buying of Auric shares. Dr Andy Adhiwana, Auric’s CEO (appointed on 9 May 16) has been aggressively buying Auric’s shares in the open market since 1 Sep 15. With the last purchase done on 2 Sep 16, Dr Adhiwana has acquired a total of 6.3m Auric shares, or 5.01% of Auric’s total issued cap; his purchase prices were S$0.72-1.15 apiece.
See Appendix for a full list of Dr Adhiwana’s transaction records.
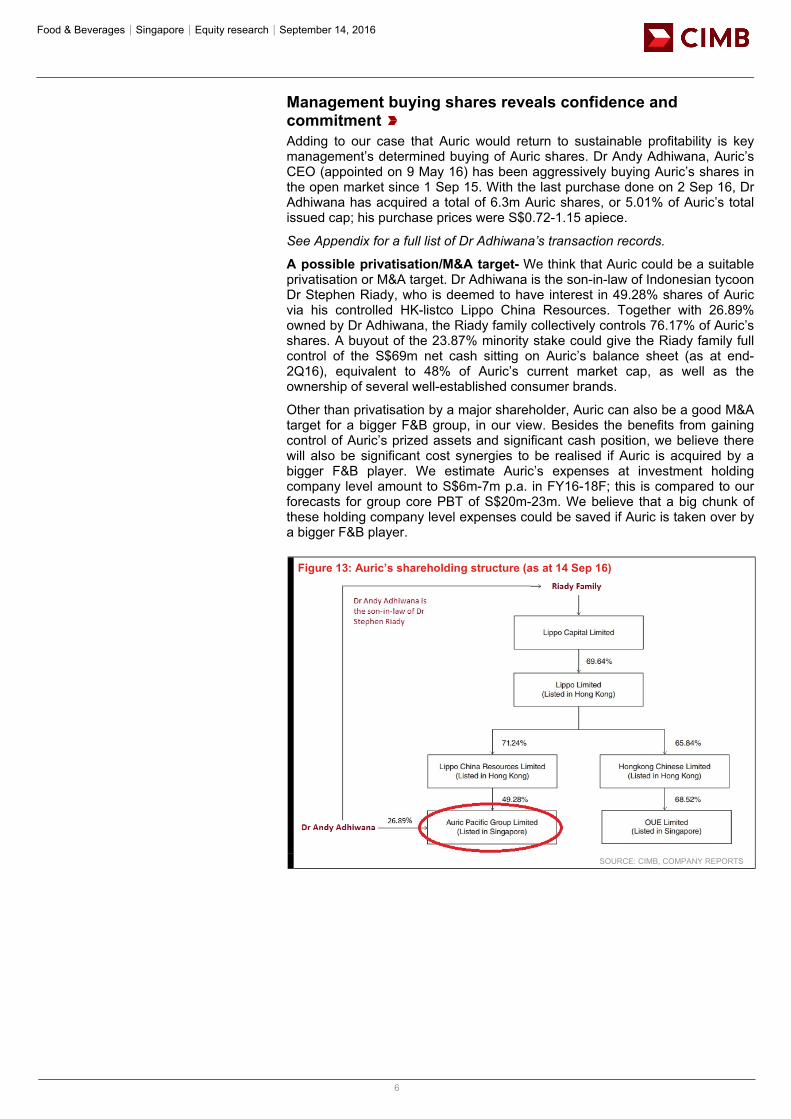
A possible privatisation/M&A target- We think that Auric could be a suitable privatisation or M&A target. Dr Adhiwana is the son-in-law of Indonesian tycoon Dr Stephen Riady, who is deemed to have interest in 49.28% shares of Auric via his controlled HK-listco Lippo China Resources. Together with 26.89% owned by Dr Adhiwana, the Riady family collectively controls 76.17% of Auric’s shares. A buyout of the 23.87% minority stake could give the Riady family full control of the S$69m net cash sitting on Auric’s balance sheet (as at end-2Q16), equivalent to 48% of Auric’s current market cap, as well as the ownership of several well-established consumer brands.
Other than privatisation by a major shareholder, Auric can also be a good M&A target for a bigger F&B group, in our view. Besides the benefits from gaining control of Auric’s prized assets and significant cash position, we believe there will also be significant cost synergies to be realised if Auric is acquired by a bigger F&B player. We estimate Auric’s expenses at investment holding company level amount to S$6m-7m p.a. in FY16-18F; this is compared to our forecasts for group core PBT of S$20m-23m. We believe that a big chunk of these holding company level expenses could be saved if Auric is taken over by a bigger F&B player.
Figure 13: Auric’s shareholding structure (as at 14 Sep 16)
SOURCE: CIMB, COMPANY REPORTS

Food & Beverages│Singapore│Equity research│September 14, 2016
7
Figure 14: Management buying Auric shares Figure 15: Core PBT by business segment (S$'m)
BLOOMBERG, SGX SOURCES: CIMB, COMPANY REPORTS
How cheap is Auric? Auric currently trades at 9.6x/8.8x FY16/17 P/E (5.2x/4.0x if ex-net-cash) vs. its bakery peers averaging at 15.9x/13.1x. Other major F&B brand owners are trading at 24.8x/21.4x FY16/17 P/E. Translating to 13.9x/12.8x FY16/17 P/E (9.5x/8.1x if ex-net-cash), our target price of S$1.69 is based on a 20% liquidity discount to a conservatively-estimated FY16 SOP value.
Figures 16 and 17 demonstrate valuation for Auric based on two scenarios - one including Auric’s significant net cash position (S$0.53 per share) and the other without. We note that, even with Auric’s significant net cash position left unvalued, Auric is worth S$1.26/S$1.42/S$1.58, based on a 0%/10%/20% discount to SOP; this implies a 9%/23%/37% upside from Auric’s current share price.
Figure 16: Auric's valuation with businesses valued at 12x FY17 P/E (adding net cash of S$0.53 per share)
Figure 17: Auric's valuation with businesses valued at 12x FY17 P/E (leaving out net cash of S$0.53 per share)
SOURCES: CIMB SOURCES: CIMB
Please see the Valuation and Recommendation section for more details.
0.6
0.7
0.8
0.9
1
1.1
1.2
1.3
Jan-15 Apr-15 Jul-15 Oct-15 Jan-16 Apr-16 Jul-16
Auric share price
Dr Adhiwana has been aggressively buying Auric shares since 1 Sep 15. With last purchase down on 2 Sep 16, he has acquired 6.3m shares (5.01% of total issued cap) in the open market, with purchase prices ranging from S$0.72 to S$1.15.
12.5
10.5
12.9 13.3 13.6
7.4
10.6 10.811.7 12.5
-5.2
-1.5
3.0 3.5 3.9
-4.1 -4.0
0.0 0.0 0.0
-7.0 -7.5-6.5 -6.6 -6.7
FY14 FY15 FY16F FY17F FY18F
Wholesale and distribution ManufacturingFood Court (Food Junction Group) Food Retail (Delifrance)Investment holding expenses
Cost synergy can be realised if Auric is acquired by a bigger F&B player
82%
64%
46%
2.11
1.90
1.69
No discount to SOP 10% discount to SOP 20% discount to SOP
Target price implied upside from current price Target price (S$)
Our base case scenario
37%
23%
9%
1.58
1.42
1.26
No discount to SOP 10% discount to SOP 20% discount to SOP
Target price implied upside from current price Target price (S$)
Food & Beverages│Singapore│Equity research│September 14, 2016
8
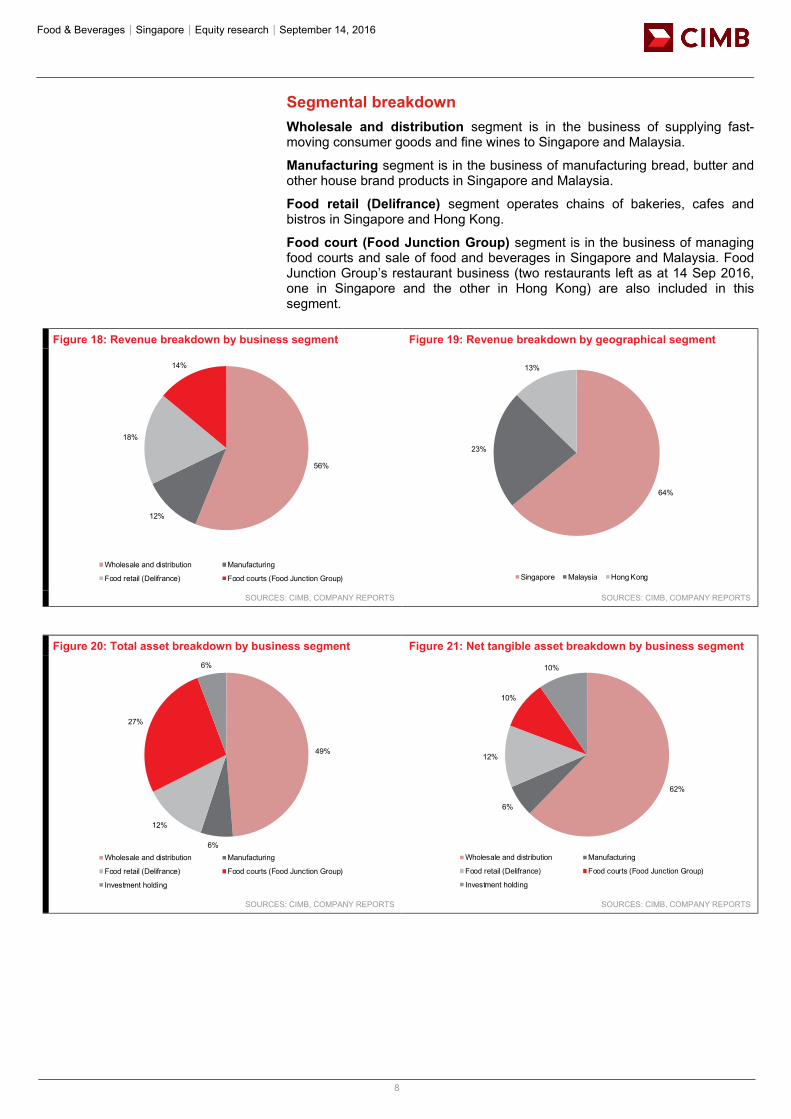
Segmental breakdown Wholesale and distribution segment is in the business of supplying fast-moving consumer goods and fine wines to Singapore and Malaysia.
Manufacturing segment is in the business of manufacturing bread, butter and other house brand products in Singapore and Malaysia.
Food retail (Delifrance) segment operates chains of bakeries, cafes and bistros in Singapore and Hong Kong.
Food court (Food Junction Group) segment is in the business of managing food courts and sale of food and beverages in Singapore and Malaysia. Food Junction Group’s restaurant business (two restaurants left as at 14 Sep 2016, one in Singapore and the other in Hong Kong) are also included in this segment.
Figure 18: Revenue breakdown by business segment Figure 19: Revenue breakdown by geographical segment
SOURCES: CIMB, COMPANY REPORTS SOURCES: CIMB, COMPANY REPORTS
Figure 20: Total asset breakdown by business segment Figure 21: Net tangible asset breakdown by business segment
SOURCES: CIMB, COMPANY REPORTS SOURCES: CIMB, COMPANY REPORTS
56%
12%
18%
14%
Wholesale and distribution Manufacturing
Food retail (Delifrance) Food courts (Food Junction Group)
64%
23%
13%
Singapore Malaysia Hong Kong
49%
6%
12%
27%
6%
Wholesale and distribution Manufacturing
Food retail (Delifrance) Food courts (Food Junction Group)
Investment holding
62%
6%
12%
10%
10%
Wholesale and distribution Manufacturing
Food retail (Delifrance) Food courts (Food Junction Group)
Investment holding
Food & Beverages│Singapore│Equity research│September 14, 2016
9
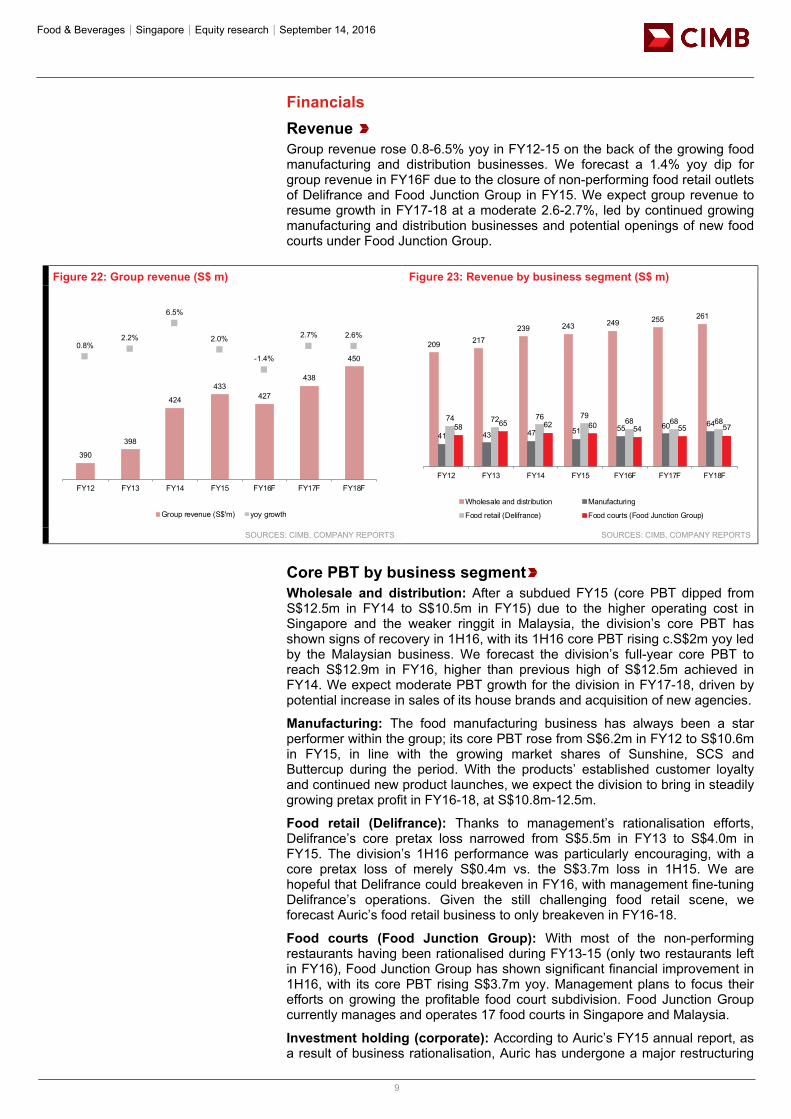
Financials Revenue Group revenue rose 0.8-6.5% yoy in FY12-15 on the back of the growing food manufacturing and distribution businesses. We forecast a 1.4% yoy dip for group revenue in FY16F due to the closure of non-performing food retail outlets of Delifrance and Food Junction Group in FY15. We expect group revenue to resume growth in FY17-18 at a moderate 2.6-2.7%, led by continued growing manufacturing and distribution businesses and potential openings of new food courts under Food Junction Group.
Figure 22: Group revenue (S$ m) Figure 23: Revenue by business segment (S$ m)
SOURCES: CIMB, COMPANY REPORTS SOURCES: CIMB, COMPANY REPORTS
Core PBT by business segment Wholesale and distribution: After a subdued FY15 (core PBT dipped from S$12.5m in FY14 to S$10.5m in FY15) due to the higher operating cost in Singapore and the weaker ringgit in Malaysia, the division’s core PBT has shown signs of recovery in 1H16, with its 1H16 core PBT rising c.S$2m yoy led by the Malaysian business. We forecast the division’s full-year core PBT to reach S$12.9m in FY16, higher than previous high of S$12.5m achieved in FY14. We expect moderate PBT growth for the division in FY17-18, driven by potential increase in sales of its house brands and acquisition of new agencies.
Manufacturing: The food manufacturing business has always been a star performer within the group; its core PBT rose from S$6.2m in FY12 to S$10.6m in FY15, in line with the growing market shares of Sunshine, SCS and Buttercup during the period. With the products’ established customer loyalty and continued new product launches, we expect the division to bring in steadily growing pretax profit in FY16-18, at S$10.8m-12.5m.
Food retail (Delifrance): Thanks to management’s rationalisation efforts, Delifrance’s core pretax loss narrowed from S$5.5m in FY13 to S$4.0m in FY15. The division’s 1H16 performance was particularly encouraging, with a core pretax loss of merely S$0.4m vs. the S$3.7m loss in 1H15. We are hopeful that Delifrance could breakeven in FY16, with management fine-tuning Delifrance’s operations. Given the still challenging food retail scene, we forecast Auric’s food retail business to only breakeven in FY16-18.
Food courts (Food Junction Group): With most of the non-performing restaurants having been rationalised during FY13-15 (only two restaurants left in FY16), Food Junction Group has shown significant financial improvement in 1H16, with its core PBT rising S$3.7m yoy. Management plans to focus their efforts on growing the profitable food court subdivision. Food Junction Group currently manages and operates 17 food courts in Singapore and Malaysia.
Investment holding (corporate): According to Auric’s FY15 annual report, as a result of business rationalisation, Auric has undergone a major restructuring
390
398
424
433427
438
450
0.8%2.2%
6.5%
2.0%
-1.4%
2.7% 2.6%
FY12 FY13 FY14 FY15 FY16F FY17F FY18F
Group revenue (S$'m) yoy growth
209 217239 243 249 255 261
41 43 47 51 55 60 6474 72 76 79
68 68 6858 65 62 60 54 55 57
FY12 FY13 FY14 FY15 FY16F FY17F FY18F
Wholesale and distribution Manufacturing
Food retail (Delifrance) Food courts (Food Junction Group)
Food & Beverages│Singapore│Equity research│September 14, 2016
10
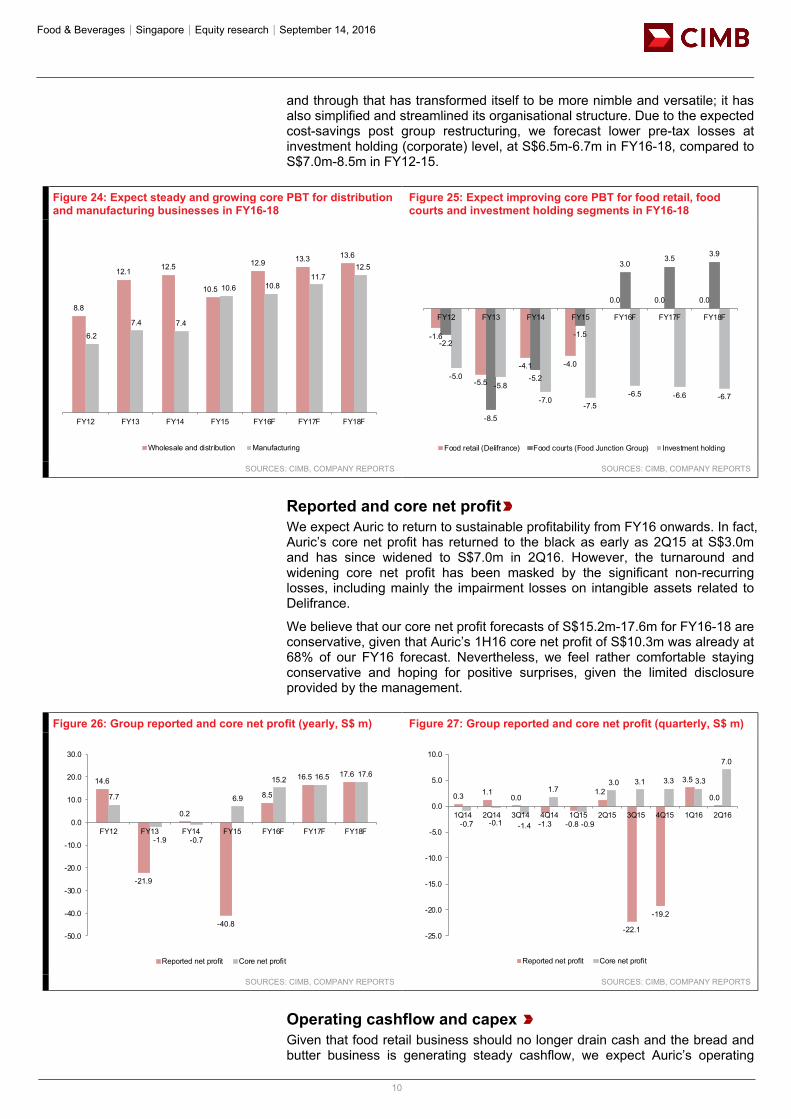
and through that has transformed itself to be more nimble and versatile; it has also simplified and streamlined its organisational structure. Due to the expected cost-savings post group restructuring, we forecast lower pre-tax losses at investment holding (corporate) level, at S$6.5m-6.7m in FY16-18, compared to S$7.0m-8.5m in FY12-15.
Figure 24: Expect steady and growing core PBT for distribution and manufacturing businesses in FY16-18
Figure 25: Expect improving core PBT for food retail, food courts and investment holding segments in FY16-18
SOURCES: CIMB, COMPANY REPORTS SOURCES: CIMB, COMPANY REPORTS
Reported and core net profit We expect Auric to return to sustainable profitability from FY16 onwards. In fact, Auric’s core net profit has returned to the black as early as 2Q15 at S$3.0m and has since widened to S$7.0m in 2Q16. However, the turnaround and widening core net profit has been masked by the significant non-recurring losses, including mainly the impairment losses on intangible assets related to Delifrance.
We believe that our core net profit forecasts of S$15.2m-17.6m for FY16-18 are conservative, given that Auric’s 1H16 core net profit of S$10.3m was already at 68% of our FY16 forecast. Nevertheless, we feel rather comfortable staying conservative and hoping for positive surprises, given the limited disclosure provided by the management.
Figure 26: Group reported and core net profit (yearly, S$ m) Figure 27: Group reported and core net profit (quarterly, S$ m)
SOURCES: CIMB, COMPANY REPORTS SOURCES: CIMB, COMPANY REPORTS
Operating cashflow and capex Given that food retail business should no longer drain cash and the bread and butter business is generating steady cashflow, we expect Auric’s operating
8.8
12.1 12.5
10.5
12.9 13.3 13.6
6.2
7.4 7.4
10.6 10.811.7
12.5
FY12 FY13 FY14 FY15 FY16F FY17F FY18F
Wholesale and distribution Manufacturing
-1.6
-5.5
-4.1 -4.0
0.0 0.0 0.0
-2.2
-8.5
-5.2
-1.5
3.03.5 3.9
-5.0-5.8
-7.0-7.5
-6.5 -6.6 -6.7
FY12 FY13 FY14 FY15 FY16F FY17F FY18F
Food retail (Delifrance) Food courts (Food Junction Group) Investment holding
14.6
-21.9
0.2
-40.8
8.5
16.5 17.6
7.7
-1.9 -0.7
6.9
15.2 16.5 17.6
-50.0
-40.0
-30.0
-20.0
-10.0
0.0
10.0
20.0
30.0
FY12 FY13 FY14 FY15 FY16F FY17F FY18F
Reported net profit Core net profit
0.3 1.10.0
-1.3 -0.8
1.2
-22.1
-19.2
3.5
0.0
-0.7 -0.1 -1.4
1.7
-0.9
3.0 3.1 3.3 3.3
7.0
-25.0
-20.0
-15.0
-10.0
-5.0
0.0
5.0
10.0
1Q14 2Q14 3Q14 4Q14 1Q15 2Q15 3Q15 4Q15 1Q16 2Q16
Reported net profit Core net profit

Food & Beverages│Singapore│Equity research│September 14, 2016
11
cashflow to improve substantially from FY16 onwards. The higher operating cash flow of S$34.5m in FY16 vs. S$27.2m-29.6m in FY17-18 is due mainly to better inventory management at the wholesale and distribution business, as well as the unlocking of working capital from the closure of non-performing food retail outlets. Barring unforeseen business expansion initiatives, we forecast maintenance capex of S$13.3m-13.9m in FY16-18. As such, our free cashflow estimates for Auric in FY16-18 are S$13.6m-21.1m.
Figure 28: Operating cashflow and capex
SOURCES: CIMB, COMPANY REPORTS
Balance sheet strength Auric had a net cash position of S$69.2m (S$69.6m cash less S$0.4m debt) as at end-2Q16, equivalent to 42% of shareholders’ equity and 48% of its current market cap. With the anticipated improvement in free cashflow in FY16-18, we expect Auric’s cash position to be futher built up.
Figure 29: Net cash position (S$ m)
SOURCES: CIMB, COMPANY REPORTS
Dividend With the considerable cash pile inherited from its predecessor Cold Storage Holdings, Auric was able to sustain a long dividend paying record. Dividend was declared even in the loss-making years including FY01-02 (Internet bubble crisis, during which Auric was burnt by its securities investment and investments in tech companies), FY08-09 (Global Financial Crisis, when Auric recognised significant losses from securities investment and fund investment) and FY13 (whereby Auric underwent rationalisation exercises and recognised significant impairment losses, mainly related to Delifrance). FY15 was the only
15.2
5.9 7.0
13.3
34.5
27.229.6
-16.9-13.0
-18.1
-7.8
-13.3 -13.6 -13.9
-1.7
-7.0-11.1
5.6
21.1
13.615.7
FY12 FY13 FY14 FY15 FY16F FY17F FY18F
Operating cashflow Capex Free cash flow
57.552.9
40.544.7
69.2 66.6
80.8
97.223% 25%19%
28%
42% 39%43%
48%
FY12 FY13 FY14 FY15 2Q16 FY16F FY17F FY18F
Net cash/(debt) Net cash/(debt) as % of equity

Food & Beverages│Singapore│Equity research│September 14, 2016
12
year in which both interim and final dividends lapsed within the group’s trackable record since FY97. In FY15, Auric posted net loss of S$40.8m, the highest loss in its history due mainly to impairment of intangible assets.
In view of 1) the expected turnaround and sustainability of Auric’s profitability, 2) the group’s significant net cash position (48% of market cap), and 3) improving free cashflow, we believe that management should reward the shareholders with dividends. We forecast a dividend of 2 Scts p.a. to be declared for FY16-18 (payable in FY17-19), while highlighting the scope for much more dividend.
Figure 30: Dividend (Scts)
SOURCES: CIMB, COMPANY REPORTS
1.5 22
3 3 3
5
5
6.5 7
5
23 3 3
2 2 2 2 21.5 1.5 2 2 2 2 2 2 2
0
1
2
3
4
5
6
7
8
Interim dividend declared Final dividend declared
years in which Auric was loss-making

Food & Beverages│Singapore│Equity research│September 14, 2016
13
Valuation and recommendation Initiate with Add and target price of S$1.69 We value Auric using a Sum of Parts (SOP) methodology, as shown in the table below:
Figure 31: Target price of S$1.69 based on a 20% liquidity discount to FY16 SOP value
SOURCES: CIMB
Key assumptions for the valuation include the following:
1) We value Auric’s manufacturing & distribution business at 12x FY17F P/E, a discount to its bakery peers’ average 13.1x and other major F&B brand owners’ average of 21.4x. Similar to Auric, all these bakery peers as well as general brand owners have their own distribution businesses.
2) We value Auric’s food court business at 12x FY17 P/E. We believe that the 12x FY17 P/E peg applied is fair, if not conservative, given that: 1) food court operation business is a less competitive area compared to the general restaurant businesses which typically trade at low- to high-teens of P/E on the SGX; and 2) Food Junction is a well-recognised food court brand in Singapore.
3) We assign zero value to Auric’s food retail business (Delifrance), as we expect the segment to merely break even in the near future.
4) Similar to how we value Auric’s individual businesses, we capitalise Auric’s holding company losses at 12x its FY17 figure.
5) We separately value Auric’s net cash position at its end-FY16 book value. Noting that most F&B brand owners listed in our comparison table are in net debt positions, we think Auric has the flexibility to pay
FY16F FY17F FY18F
Manufacturing & distribution 242.5 1.93 19.2 20.2 21.1 pegging to 12x FY17 P/E Distribution 10.3 10.6 10.9 Manufacturing 8.9 9.6 10.3
Food Court (Food Junction Group) 34.9 0.28 2.5 2.9 3.2 pegging to 12x FY17 P/E
Food Retail (Delifrance) 0 0.00 0.0 0.0 0.0 assume merely breakeven and assign zero value
Corporate (investment holding) expenses -79.2 -0.63 -6.5 -6.6 -6.7 capitalised @12x FY17 expenses
Group businesses 198.1 1.58 15.2 16.5 17.7
Net cash/(debt) 66.6 0.53 66.6 78.3 92.1 est. book value as at end-FY16F
Other financial investment 0 0.00 assume being fully written off
SOP 264.7 2.11
# of shares (mil) 125.7
liquidity discount 20%
Target price (S$) 1.69
Current price 1.16Target price implied upside/(downside) 46%
FY16F FY17F FY18FCurrent price implied P/E 9.5 8.8 8.2Current price implied P/E (ex-net-cash) 5.2 4.0 3.0
Target price implied P/E 13.9 12.8 12.0Target price implied P/E (ex-net-cash) 9.5 8.1 6.8
Value (S$'m)
Value per share (S$)
Core net profit (S$'m) Valuation basis

Food & Beverages│Singapore│Equity research│September 14, 2016
14
out all its net cash and restructure the group capital by gearing up with more debt.
6) We assign zero value to the investments that Auric has left on its balance sheet (S$2.5m leftover as at end-2Q16) to provide for any further impairment/write-off that Auric could possibly recognise.
7) We apply a 20% liquidity discount to our estimated SOP value per share of S$2.11, to reach our target price of S$1.69. The discount is due to Auric’s poor liquidity in the stock market. Auric is a small cap company with US$106m market cap and 76.17% shares controlled by major shareholder the Riady family.
Translating to FY17/18 P/E of 13.9x/12.8x (9.5x/8.1x if ex-net-cash), we believe that our target price of S$1.69 is relatively conservative, given that peers (bakery players and major brand owners) are trading at 21.9x/18.6x.
Peer comparison
Figure 32: Peer comparison
SOURCES: CIMB, COMPANY REPORTS, BLOOMBERG
Bloomberg PriceTarget
PriceMarket
Cap Core P/E (x)3-year
EPS P/BV (x)Recurring
ROE (%)Dividend Yield (%)
Company Ticker Recom. (lcl curr) (lcl curr) (US$ m) CY2016 CY2017 CAGR (%) CY2016 CY2016 CY2016 CY2017 CY2016
Auric Pacific Ltd AP SP ADD 1.16 1.69 107 9.6 8.8 37.3% 0.86 9.0% 2.4 1.9 0.0%
Bakery companiesQAF Ltd QAF SP Not rated 1.23 na 509 9.5 10.3 na 1.54 16.4% 6.4 6.5 4.1%BreadTalk Group Ltd BREAD SP Not rated 1.01 na 208 22.3 16.0 44.2% 2.03 9.8% 4.5 4.0 1.8%Average of bakery players 15.9 13.1 44.2% 1.78 13.1% 5.5 5.2 2.9%
Other F&B brand owners
Super Group SUPER SP Hold 0.82 0.82 667 20.1 17.0 7.3% 1.67 8.3% 9.3 8.1 2.5%Delfi Ltd DELFI SP Hold 2.28 2.69 1,024 28.1 21.8 na 5.21 16.6% 18.0 14.4 10.7%Thai Beverage THBEV SP Add 0.92 1.14 16,975 21.3 20.0 na 4.72 22.6% 15.9 14.4 3.1%Indofood CBP ICBP IJ Hold 9,425 9,100 8,304 29.8 26.9 15.4% 6.23 21.8% 19.8 17.3 1.4%Yeo Hiap Seng Ltd YHS SP Not rated 1.28 na 545 na na na na na na na naHanwell Holdings Ltd HANW SP Not rated 0.22 na 88 na na na na na na na naFood Empire Holdings Ltd FEH SP Not rated 0.34 na 132 na na na na na na na naAverage of other F&B brand owners 24.8 21.4 11.4% 4.46 17.3% 15.8 13.6 4.4%
Simple average (excl. Auric Pacific) 21.9 18.6 22.3% 3.56 15.9% 12.3 10.8 3.9%
EV/EBITDA (x)

Food & Beverages│Singapore│Equity research│September 14, 2016
15
Risks M&A not necessarily value-accretive Auric has a patchy track record in M&As. Its previous acquisitions of Delifrance and Food Junction Group resulted in significant losses (operating losses and impairment losses) in the subsequent years. Having said that, we believe that management should have learnt from the past - in its FY15 annual report, management admitted that Auric’s previous business diversification initiatives “did not provide the group with the expected returns and value that management had expected” and Auric will be “refocusing on traditional pillars of strength, namely Sunshine Bread, SCS Butter and Buttercup Margarine”.
Competition Auric’s businesses face competition. A possible price war from competing products and parallel imports may erode Auric’s wholesale and distribution margins. Despite the leading positions of Auric’s house brands in the local markets, the group may still occasionally incur higher advertising and promoting expenses to fend off competing promotional activities. Auric also competes with supermarket house brands. The food court business faces competition in bidding for operation rights of new food courts, while food retail (Delifrance) faces competition from alternative dining choices.
Fluctuation of raw material prices Auric’s bread and butter manufacturing business is subject to fluctuations in raw material prices (wheat, milk etc.) although we believe that Auric should be able to pass at least part of the impact to customers due to strong brand awareness and brand loyalty. As for its agency brands, Auric’s margins could face more pressure if the brand principals raise prices.
FX fluctuations Auric reports in Singapore dollar but sales and expenses of its operations in Malaysia and Hong Kong are denominated in the local currencies. Also, some of the agency brands are sourced in US dollars. As a result, Auric’s financial performance is subject to the fluctuations of the US dollar, the Hong Kong dollar and the ringgit against the Singapore dollar.
Figure 33: SWOT analysis
SOURCES: CIMB
Strengths: Opportunities:Diversified businesses, including food manufacturing & distribution, food retail and food court operation
Growing market shares of house brands, potental expansion in the regional markets
Ownership of well-established household brands with leading market postions and customer loyalty
Sourcing new principals and new brands
Strong net cash position A suitable privatisation or M&A targetTurnaround of Delifrance through rationalisation
Weaknesses: Threats:
Patchy M&A track record Pricing war from competitors' brands, including supermarket house brands
Delifrance is not yet profitable and remains vulnerable to stiff competition
Rising rental and labour cost for food retail and food court operation businesses
Financial performance subject to fluctuation of FX and raw material prices
Proliferation of boutique cafes and artisan bakery shops
Food & Beverages│Singapore│Equity research│September 14, 2016
16
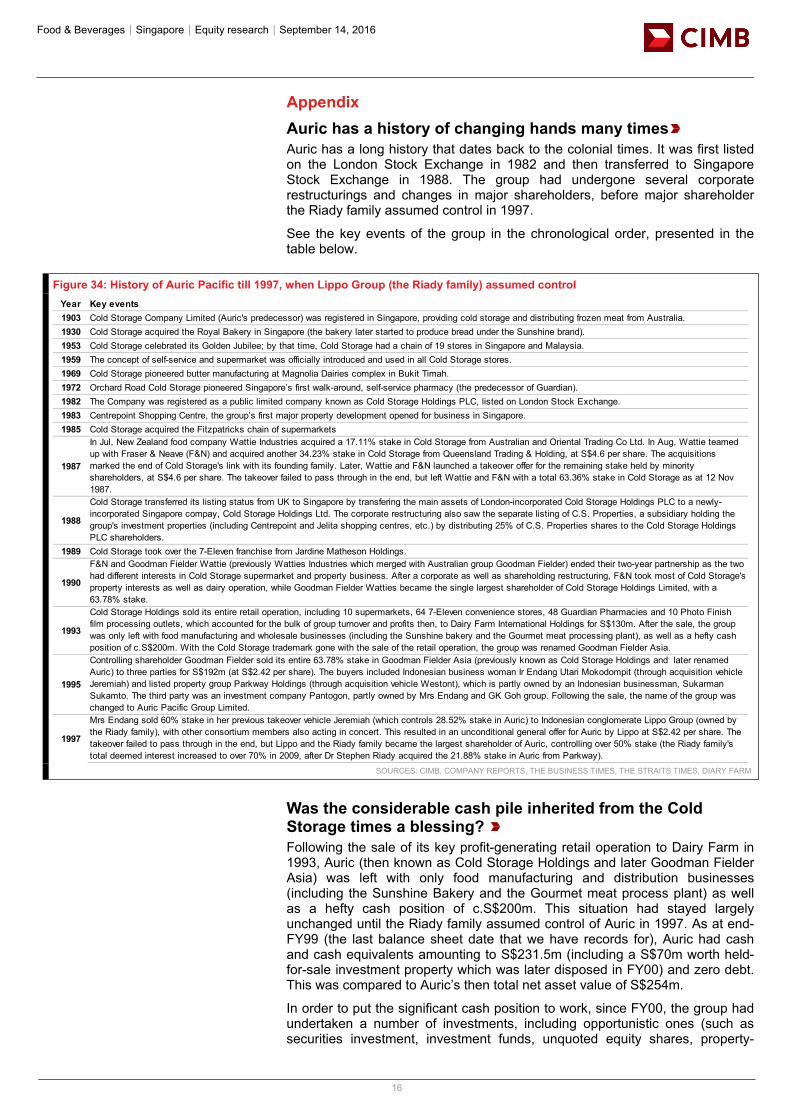
Appendix Auric has a history of changing hands many times Auric has a long history that dates back to the colonial times. It was first listed on the London Stock Exchange in 1982 and then transferred to Singapore Stock Exchange in 1988. The group had undergone several corporate restructurings and changes in major shareholders, before major shareholder the Riady family assumed control in 1997.
See the key events of the group in the chronological order, presented in the table below.
Figure 34: History of Auric Pacific till 1997, when Lippo Group (the Riady family) assumed control
SOURCES: CIMB, COMPANY REPORTS, THE BUSINESS TIMES, THE STRAITS TIMES, DIARY FARM
Was the considerable cash pile inherited from the Cold Storage times a blessing? Following the sale of its key profit-generating retail operation to Dairy Farm in 1993, Auric (then known as Cold Storage Holdings and later Goodman Fielder Asia) was left with only food manufacturing and distribution businesses (including the Sunshine Bakery and the Gourmet meat process plant) as well as a hefty cash position of c.S$200m. This situation had stayed largely unchanged until the Riady family assumed control of Auric in 1997. As at end-FY99 (the last balance sheet date that we have records for), Auric had cash and cash equivalents amounting to S$231.5m (including a S$70m worth held-for-sale investment property which was later disposed in FY00) and zero debt. This was compared to Auric’s then total net asset value of S$254m.
In order to put the significant cash position to work, since FY00, the group had undertaken a number of investments, including opportunistic ones (such as securities investment, investment funds, unquoted equity shares, property-
Year Key events1903 Cold Storage Company Limited (Auric's predecessor) was registered in Singapore, providing cold storage and distributing frozen meat from Australia.1930 Cold Storage acquired the Royal Bakery in Singapore (the bakery later started to produce bread under the Sunshine brand).1953 Cold Storage celebrated its Golden Jubilee; by that time, Cold Storage had a chain of 19 stores in Singapore and Malaysia.1959 The concept of self-service and supermarket was officially introduced and used in all Cold Storage stores. 1969 Cold Storage pioneered butter manufacturing at Magnolia Dairies complex in Bukit Timah. 1972 Orchard Road Cold Storage pioneered Singapore’s first walk-around, self-service pharmacy (the predecessor of Guardian). 1982 The Company was registered as a public limited company known as Cold Storage Holdings PLC, listed on London Stock Exchange.1983 Centrepoint Shopping Centre, the group’s first major property development opened for business in Singapore.1985 Cold Storage acquired the Fitzpatricks chain of supermarkets
1987
In Jul, New Zealand food company Wattie Industries acquired a 17.11% stake in Cold Storage from Australian and Oriental Trading Co Ltd. In Aug, Wattie teamed up with Fraser & Neave (F&N) and acquired another 34.23% stake in Cold Storage from Queensland Trading & Holding, at S$4.6 per share. The acquisitions marked the end of Cold Storage's link with its founding family. Later, Wattie and F&N launched a takeover offer for the remaining stake held by minority shareholders, at S$4.6 per share. The takeover failed to pass through in the end, but left Wattie and F&N with a total 63.36% stake in Cold Storage as at 12 Nov 1987.
1988
Cold Storage transferred its listing status from UK to Singapore by transfering the main assets of London-incorporated Cold Storage Holdings PLC to a newly-incorporated Singapore compay, Cold Storage Holdings Ltd. The corporate restructuring also saw the separate listing of C.S. Properties, a subsidiary holding the group's investment properties (including Centrepoint and Jelita shopping centres, etc.) by distributing 25% of C.S. Properties shares to the Cold Storage Holdings PLC shareholders.
1989 Cold Storage took over the 7-Eleven franchise from Jardine Matheson Holdings.
1990
F&N and Goodman Fielder Wattie (previously Watties Industries which merged with Australian group Goodman Fielder) ended their two-year partnership as the two had different interests in Cold Storage supermarket and property business. After a corporate as well as shareholding restructuring, F&N took most of Cold Storage's property interests as well as dairy operation, while Goodman Fielder Watties became the single largest shareholder of Cold Storage Holdings Limited, with a 63.78% stake.
1993
Cold Storage Holdings sold its entire retail operation, including 10 supermarkets, 64 7-Eleven convenience stores, 48 Guardian Pharmacies and 10 Photo Finish film processing outlets, which accounted for the bulk of group turnover and profits then, to Dairy Farm International Holdings for S$130m. After the sale, the group was only left with food manufacturing and wholesale businesses (including the Sunshine bakery and the Gourmet meat processing plant), as well as a hefty cash position of c.S$200m. With the Cold Storage trademark gone with the sale of the retail operation, the group was renamed Goodman Fielder Asia.
1995
Controlling shareholder Goodman Fielder sold its entire 63.78% stake in Goodman Fielder Asia (previously known as Cold Storage Holdings and later renamed Auric) to three parties for S$192m (at S$2.42 per share). The buyers included Indonesian business woman Ir Endang Utari Mokodompit (through acquisition vehicle Jeremiah) and listed property group Parkway Holdings (through acquisition vehicle Westont), which is partly owned by an Indonesian businessman, Sukarman Sukamto. The third party was an investment company Pantogon, partly owned by Mrs Endang and GK Goh group. Following the sale, the name of the group was changed to Auric Pacific Group Limited.
1997
Mrs Endang sold 60% stake in her previous takeover vehicle Jeremiah (which controls 28.52% stake in Auric) to Indonesian conglomerate Lippo Group (owned by the Riady family), with other consortium members also acting in concert. This resulted in an unconditional general offer for Auric by Lippo at S$2.42 per share. The takeover failed to pass through in the end, but Lippo and the Riady family became the largest shareholder of Auric, controlling over 50% stake (the Riady family's total deemed interest increased to over 70% in 2009, after Dr Stephen Riady acquired the 21.88% stake in Auric from Parkway).

Food & Beverages│Singapore│Equity research│September 14, 2016
17
related investments, etc.) and strategic ones (i.e. acquiring Delifrance and Food Junction Holdings).
Opportunistic investments - overall gain but with additional volatility
A summary of the group’s opportunistic investment activities undertaken during FY00-14 is included in Fig 34. Despite the fact that these investments had added to shareholder value with a total of S$89.4m gain, they also resulted in a more volatile bottomline during the period, due to 1) the lumpy nature of property-related investments, and 2) the cyclical nature of securities and fund investments (realised/unrealised gains recognised in the upcycle while losses were recognised in the downcycle).
Most of the opportunistic investments are left in the past, as management has been gradually shifting their focus towards the core F&B operations, especially after acquiring Delifrance and Food Junction Group in FY06-13.
Figure 35: Opportunistic investments (FY00-14)
SOURCES: CIMB, COMPANY REPORTS
Strategic acquisitions - years of bleeding before a potential turnaround
As part of its business expansion and diversification initiatives, Auric made two strategic acquisitions in FY06-13, i.e. Delifrance Asia in Dec 07 and a controlling stake in Food Junction Holdings in Sep 08 which was subsequently delisted in Jun 13. These acquisitions later turned out to be much costlier than management had previously estimated. In FY08-15, Delifrance and Food Junction Group recorded total pretax losses of over S$120m, including impairment losses of S$58.5m on intangible assets. With management’s significant rationalisation efforts over the past years, we believe that Delifance is finally on track to breakeven, and Food Junction to turn around in FY16.
Figure 36: Pretax losses of Delifrance and Food Junction Group in FY08-15
SOURCES: CIMB, COMPANY REPORTS
Type of investments Description Period of activities Overall gain/loss recognised to date
Investment securities Invested in a number of Singapore and Hong Kong listed securities FY00-12, no new purchase thereafter S$15.2m gain
Investment funds Invested in some unit trust funds managed by external fund managers
FY00-14, no new purchase thereafter S$7.1m loss
Unquoted equity shares Invested in a number of technology-related companies during the internet bubble era
FY00-10, no new purchase thereafter S$20.3m loss
100% interest in Bukit Timah residential development Entered in FY06 and disposed in the same year
S$10.2m gain
50.89% interest in a 5-storey shopping mall in Jakarta Entered in FY05 and disposed in FY07 S$13.9m gain100% interest in a 16-storey commerical block at One Phillip Street Entered in FY06 and disposed in FY08 S$60m gain100% interest in a penthouse unit at 130 Tanjong Rhu Road Entered in FY01 and disposed in FY09 S$1.2m gainInvestment in a property private equity fund Entered in FY10 and disposed in FY13 S$2.7m loss
Other opportunistic investments 17.95% interest in Robinson & Company Limited Entered in FY06 and disposed in FY08 S$19mTotal gain/losses S$89.4m gain
Opportunistic property-related investments
-7.5-10.1
-2.4-4.9
-2.8
-18.5
-6.1
-45.3
0.8 2.1 1.5 2.4
-7.9
-12.6
-5.4 -4.9
-50.0
-40.0
-30.0
-20.0
-10.0
0.0
10.0
FY08 FY09 FY10 FY11 FY12 FY13 FY14 FY15
Delifrance (S$'m) Food Junction Group (S'm)
Delifrance and Food Junction Group recorded total pretax losses of over S$120m during FY08-15
Food & Beverages│Singapore│Equity research│September 14, 2016
18
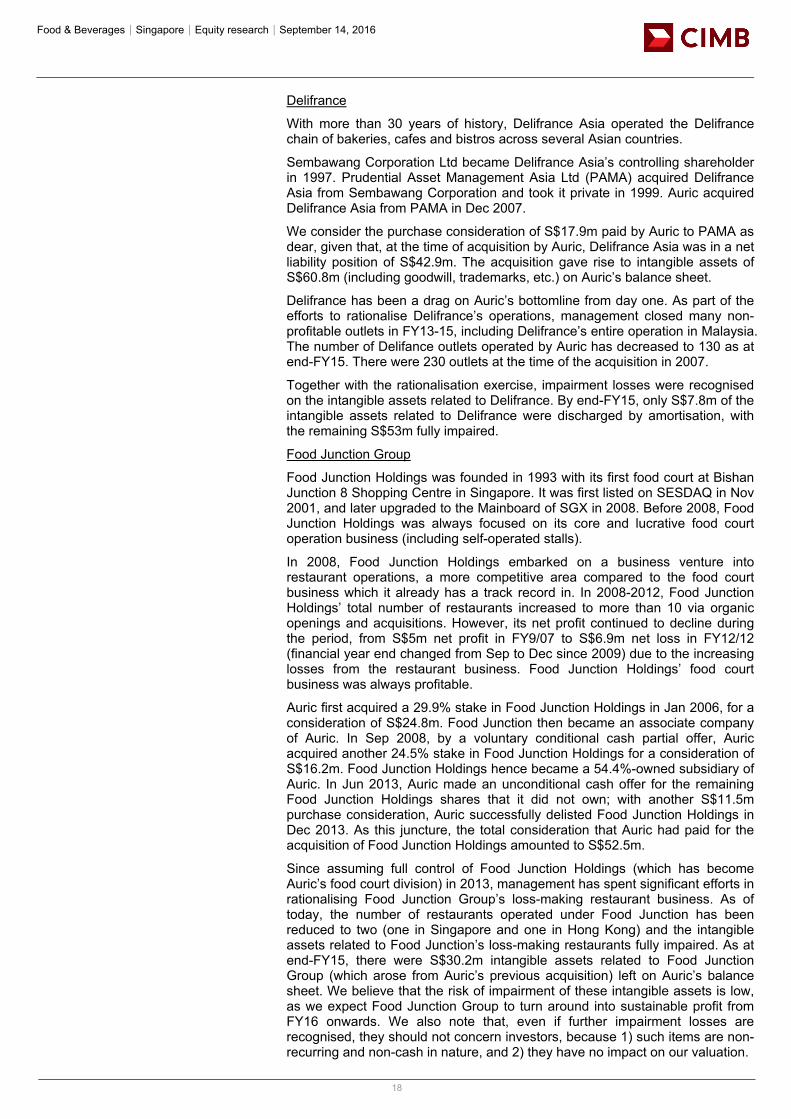
Delifrance
With more than 30 years of history, Delifrance Asia operated the Delifrance chain of bakeries, cafes and bistros across several Asian countries.
Sembawang Corporation Ltd became Delifrance Asia’s controlling shareholder in 1997. Prudential Asset Management Asia Ltd (PAMA) acquired Delifrance Asia from Sembawang Corporation and took it private in 1999. Auric acquired Delifrance Asia from PAMA in Dec 2007.
We consider the purchase consideration of S$17.9m paid by Auric to PAMA as dear, given that, at the time of acquisition by Auric, Delifrance Asia was in a net liability position of S$42.9m. The acquisition gave rise to intangible assets of S$60.8m (including goodwill, trademarks, etc.) on Auric’s balance sheet.
Delifrance has been a drag on Auric’s bottomline from day one. As part of the efforts to rationalise Delifrance’s operations, management closed many non-profitable outlets in FY13-15, including Delifrance’s entire operation in Malaysia. The number of Delifance outlets operated by Auric has decreased to 130 as at end-FY15. There were 230 outlets at the time of the acquisition in 2007.
Together with the rationalisation exercise, impairment losses were recognised on the intangible assets related to Delifrance. By end-FY15, only S$7.8m of the intangible assets related to Delifrance were discharged by amortisation, with the remaining S$53m fully impaired.
Food Junction Group
Food Junction Holdings was founded in 1993 with its first food court at Bishan Junction 8 Shopping Centre in Singapore. It was first listed on SESDAQ in Nov 2001, and later upgraded to the Mainboard of SGX in 2008. Before 2008, Food Junction Holdings was always focused on its core and lucrative food court operation business (including self-operated stalls).
In 2008, Food Junction Holdings embarked on a business venture into restaurant operations, a more competitive area compared to the food court business which it already has a track record in. In 2008-2012, Food Junction Holdings’ total number of restaurants increased to more than 10 via organic openings and acquisitions. However, its net profit continued to decline during the period, from S$5m net profit in FY9/07 to S$6.9m net loss in FY12/12 (financial year end changed from Sep to Dec since 2009) due to the increasing losses from the restaurant business. Food Junction Holdings’ food court business was always profitable.
Auric first acquired a 29.9% stake in Food Junction Holdings in Jan 2006, for a consideration of S$24.8m. Food Junction then became an associate company of Auric. In Sep 2008, by a voluntary conditional cash partial offer, Auric acquired another 24.5% stake in Food Junction Holdings for a consideration of S$16.2m. Food Junction Holdings hence became a 54.4%-owned subsidiary of Auric. In Jun 2013, Auric made an unconditional cash offer for the remaining Food Junction Holdings shares that it did not own; with another S$11.5m purchase consideration, Auric successfully delisted Food Junction Holdings in Dec 2013. As this juncture, the total consideration that Auric had paid for the acquisition of Food Junction Holdings amounted to S$52.5m.
Since assuming full control of Food Junction Holdings (which has become Auric’s food court division) in 2013, management has spent significant efforts in rationalising Food Junction Group’s loss-making restaurant business. As of today, the number of restaurants operated under Food Junction has been reduced to two (one in Singapore and one in Hong Kong) and the intangible assets related to Food Junction’s loss-making restaurants fully impaired. As at end-FY15, there were S$30.2m intangible assets related to Food Junction Group (which arose from Auric’s previous acquisition) left on Auric’s balance sheet. We believe that the risk of impairment of these intangible assets is low, as we expect Food Junction Group to turn around into sustainable profit from FY16 onwards. We also note that, even if further impairment losses are recognised, they should not concern investors, because 1) such items are non-recurring and non-cash in nature, and 2) they have no impact on our valuation.

Food & Beverages│Singapore│Equity research│September 14, 2016
19
Board and key management personnel
Figure 37: Board and key management personnel
SOURCE: COMPANY
Details of Dr Adhiwana’s share purchase activities
Dr Adhiwana is the son-in-law of Dr Stephen Riady, the controlling shareholder of Auric. Dr Adhiwana was appointed Auric’s executive director on 1 Nov 2014 and later appointed as group CEO on 9 May 2016.
Mr Albert Cheok w as appointed a director of Auric Pacif ic Group Limited (“APGL”) on 22 July 2002 and has served as independent non-executive Chairman of APGL since 23 February 2006. He also serves as Chairman of the Remuneration Committee. The Board and Nomination Committee regard him as independent for the f inancial year ending 2016.
Mr Cheok is a vice governor of the Board of Governors of the Malaysian Institute of Corporate Governance. In Singapore, Mr Cheok is the independent non-executive Chairman of Bow sprit Capital Corporation Limited (Manager of First Real Estate Investment Trust). He is also the independent non-executive Chairman of LMIRT Management Ltd (Manager of Lippo Malls Indonesia Retail Trust), International Standard Resources Holdings Limited, AcrossAsia Limited and Amplefield Limited. Elsew here, Mr Cheok holds independent non-executive directorships in Hongkong Chinese Limited, Macau Chinese Bank Limited, Adavale Resources Limited, and China Aircraft Leasing Group Holdings Limited.
Mr Cheok is a banker w ith over 30 years’ experience in banking in the Asia-Pacif ic region. Betw een May 1979 and February 1982, he w as an adviser to the Australian Government Inquiry into the Australian Financial System w hich introduced comprehensive reforms to the Australian banking system. He w as also the Chief Manager at the Reserve Bank of Australia from October 1988 to September 1989 before becoming the Deputy Commissioner of Banking of Hong Kong for about three and a half years, and he w as subsequently appointed as the Executive Director in charge of Banking Supervision at the Hong Kong Monetary Authority from April 1993 to May 1995. Mr Cheok held the position of Chairman of Bangkok Bank Berhad from September 1995 to November 2005 and Vice Chairman of the Export and Industry Bank of the Philippines from February 2006 to April 2012. Mr Cheok w as an independent non-executive director of Metal Reclamation Bhd from July 1988 to June 2015.
Mr Cheok graduated from the University of Adelaide, Australia w ith First Class Honours in Economics. He is a Fellow of the Australian Institute of Certif ied Public Accountants.Dr Stephen Riady w as appointed a director of Auric Pacif ic Group Limited (“APGL”) on 12 May 1997, w hereupon from 10 May 1999 to 22 February 2006, he assumed the role of Group Managing Director. Thereafter, from 23 February 2006 till today, he served as an executive director of APGL and w as last re-elected as director on 29 April 2015. As a member of the APGL Board, Dr Riady serves as a member of its Nomination Committee.
Dr Riady is also an Executive Director of Lippo Limited and has been its Chairman since 1991. He w as appointed aDirector of Lippo China Resources Limited in 1992 and on 25 March 2011, he w as appointed as its Chairman. He has been an Executive Director of Hongkong Chinese Limited since 1992 and on 25 March 2011, he w as appointed its Chairman. Dr Riady has served as executive director of OUE Limited (“OUE”) since 30 November 2006 w hereupon on 9 March 2010, he w as appointed OUE’s Executive Chairman and continues to hold those positions until today.
In public service, Dr Riady w as Hong Kong Affairs Advisor from April 1995 to June 1997 and w as appointed by the Hong Kong and Macao Affairs Off ice of the State Council and Xinhua New s Agency, Hong Kong Branch of the People’s Republic of China (“PRC”). He is also a member of the Committee to Promote Economic Co-operation betw een Fujian and Hong Kong established by the Provincial Government of Fujian, PRC.
Accolades he has received include the Chevalier de L’Ordre des Arts et des Lettres aw arded by the French government, and the Strategic Investment Entrepreneur of the Year in Ernst & Young’s annual Entrepreneur of the Year Aw ards Singapore 2007. He is an Honorary Citizen of Shenzhen, PRC.
Dr Riady is a graduate of the University of Southern California, United States and holds a Master of Business Administration from Golden Gate University, United States. He w as conferred an Honorary Degree of Doctor of Business Administration from Edinburgh Napier University, United Kingdom, and is one of the f irst Honorary University Fellow s installed by the Hong Kong Baptist University.
Dr Andy Adhiw ana w as appointed executive director of Auric Pacif ic Group Limited (“APGL”) on 1 November 2014 and is presently a substantial shareholder of APGL. As executive director, Dr Adhiw ana continues to drive the business development affairs of APGL and its subsidiaries, among other critical responsibilities, a role that he w as involved in w hen he joined APGL as its business development manager in December 2013.
Dr Adhiw ana graduated from the renow ned Heidelberg University and earned a Bachelor of Medicine, Bachelor of Surgery and a Doctorate in Medicine, w here he distinguished himself and w as granted the prestigious “Dr.med.” title w ith cum laude.
Notw ithstanding his distinction in medicine, Dr Adhiw ana pursued his interest in business and enrolled, in the Master of Business Administration programme w ith the National University of Singapore, and w as subsequently aw arded a Master of Business Administration degree.
Mr Yeo w as appointed the Group Chief Financial Off icer in February 2016. He is responsible for the Group’s f inancial systems and controls, group accounting, corporate f inance, treasury and taxation matters.
Mr Yeo has extensive experience in FMCG and retail. Prior to joining Auric Pacif ic, Mr Yeo w as the Group Chief Financial Off icer of a publicly listed company in Singapore since 2011 w here he w as responsible for the group’s f inancial matters.
Mr Yeo holds an MBA from the University of Strathclyde and a Bachelor of Accountancy degree from the National University of Singapore. He is also a FCPA of the Institute of Singapore Chartered Accountants and a member of the Singapore Institute of Directors.
Food & Beverages│Singapore│Equity research│September 14, 2016
20
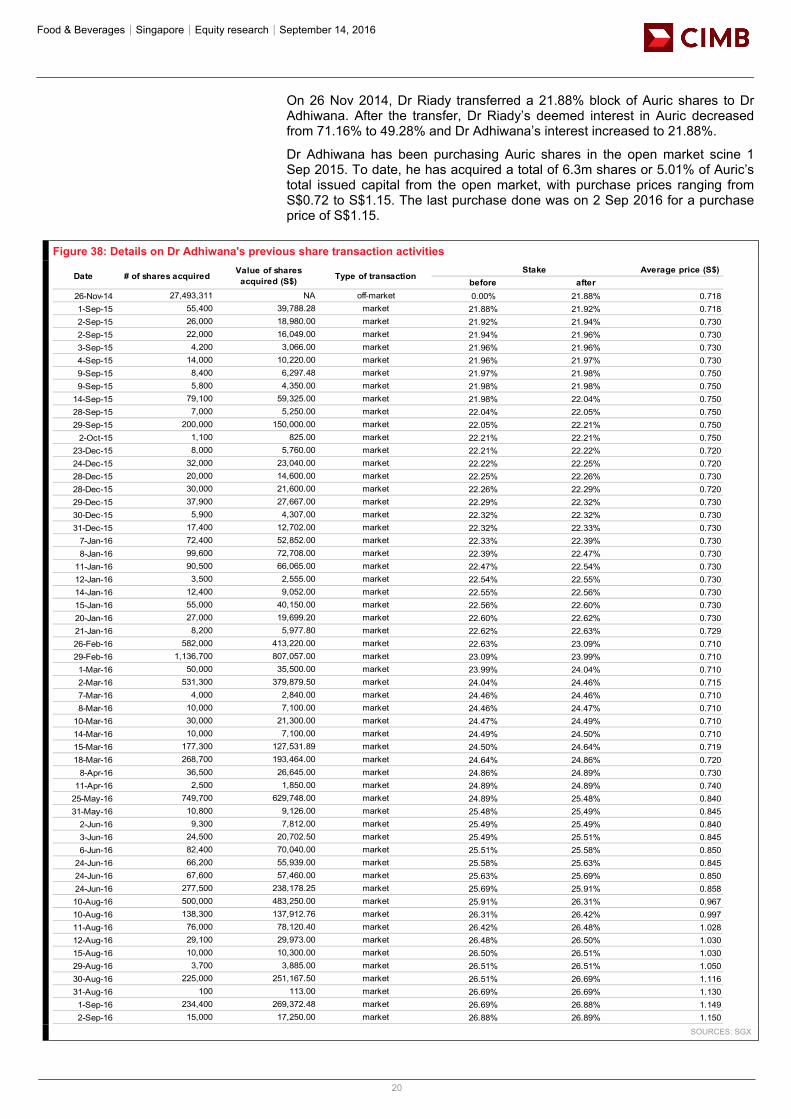
On 26 Nov 2014, Dr Riady transferred a 21.88% block of Auric shares to Dr Adhiwana. After the transfer, Dr Riady’s deemed interest in Auric decreased from 71.16% to 49.28% and Dr Adhiwana’s interest increased to 21.88%.
Dr Adhiwana has been purchasing Auric shares in the open market scine 1 Sep 2015. To date, he has acquired a total of 6.3m shares or 5.01% of Auric’s total issued capital from the open market, with purchase prices ranging from S$0.72 to S$1.15. The last purchase done was on 2 Sep 2016 for a purchase price of S$1.15.
Figure 38: Details on Dr Adhiwana's previous share transaction activities
SOURCES: SGX
Average price (S$)before after
26-Nov-14 27,493,311 NA off-market 0.00% 21.88% 0.7181-Sep-15 55,400 39,788.28 market 21.88% 21.92% 0.7182-Sep-15 26,000 18,980.00 market 21.92% 21.94% 0.7302-Sep-15 22,000 16,049.00 market 21.94% 21.96% 0.7303-Sep-15 4,200 3,066.00 market 21.96% 21.96% 0.7304-Sep-15 14,000 10,220.00 market 21.96% 21.97% 0.7309-Sep-15 8,400 6,297.48 market 21.97% 21.98% 0.7509-Sep-15 5,800 4,350.00 market 21.98% 21.98% 0.750
14-Sep-15 79,100 59,325.00 market 21.98% 22.04% 0.75028-Sep-15 7,000 5,250.00 market 22.04% 22.05% 0.75029-Sep-15 200,000 150,000.00 market 22.05% 22.21% 0.750
2-Oct-15 1,100 825.00 market 22.21% 22.21% 0.75023-Dec-15 8,000 5,760.00 market 22.21% 22.22% 0.72024-Dec-15 32,000 23,040.00 market 22.22% 22.25% 0.72028-Dec-15 20,000 14,600.00 market 22.25% 22.26% 0.73028-Dec-15 30,000 21,600.00 market 22.26% 22.29% 0.72029-Dec-15 37,900 27,667.00 market 22.29% 22.32% 0.73030-Dec-15 5,900 4,307.00 market 22.32% 22.32% 0.73031-Dec-15 17,400 12,702.00 market 22.32% 22.33% 0.730
7-Jan-16 72,400 52,852.00 market 22.33% 22.39% 0.7308-Jan-16 99,600 72,708.00 market 22.39% 22.47% 0.730
11-Jan-16 90,500 66,065.00 market 22.47% 22.54% 0.73012-Jan-16 3,500 2,555.00 market 22.54% 22.55% 0.73014-Jan-16 12,400 9,052.00 market 22.55% 22.56% 0.73015-Jan-16 55,000 40,150.00 market 22.56% 22.60% 0.73020-Jan-16 27,000 19,699.20 market 22.60% 22.62% 0.73021-Jan-16 8,200 5,977.80 market 22.62% 22.63% 0.72926-Feb-16 582,000 413,220.00 market 22.63% 23.09% 0.71029-Feb-16 1,136,700 807,057.00 market 23.09% 23.99% 0.7101-Mar-16 50,000 35,500.00 market 23.99% 24.04% 0.7102-Mar-16 531,300 379,879.50 market 24.04% 24.46% 0.7157-Mar-16 4,000 2,840.00 market 24.46% 24.46% 0.7108-Mar-16 10,000 7,100.00 market 24.46% 24.47% 0.710
10-Mar-16 30,000 21,300.00 market 24.47% 24.49% 0.71014-Mar-16 10,000 7,100.00 market 24.49% 24.50% 0.71015-Mar-16 177,300 127,531.89 market 24.50% 24.64% 0.71918-Mar-16 268,700 193,464.00 market 24.64% 24.86% 0.720
8-Apr-16 36,500 26,645.00 market 24.86% 24.89% 0.73011-Apr-16 2,500 1,850.00 market 24.89% 24.89% 0.740
25-May-16 749,700 629,748.00 market 24.89% 25.48% 0.84031-May-16 10,800 9,126.00 market 25.48% 25,49% 0.845
2-Jun-16 9,300 7,812.00 market 25.49% 25.49% 0.8403-Jun-16 24,500 20,702.50 market 25.49% 25.51% 0.8456-Jun-16 82,400 70,040.00 market 25.51% 25.58% 0.850
24-Jun-16 66,200 55,939.00 market 25.58% 25.63% 0.84524-Jun-16 67,600 57,460.00 market 25.63% 25.69% 0.85024-Jun-16 277,500 238,178.25 market 25.69% 25.91% 0.85810-Aug-16 500,000 483,250.00 market 25.91% 26.31% 0.96710-Aug-16 138,300 137,912.76 market 26.31% 26.42% 0.99711-Aug-16 76,000 78,120.40 market 26.42% 26.48% 1.02812-Aug-16 29,100 29,973.00 market 26.48% 26.50% 1.03015-Aug-16 10,000 10,300.00 market 26.50% 26.51% 1.03029-Aug-16 3,700 3,885.00 market 26.51% 26.51% 1.05030-Aug-16 225,000 251,167.50 market 26.51% 26.69% 1.11631-Aug-16 100 113.00 market 26.69% 26.69% 1.1301-Sep-16 234,400 269,372.48 market 26.69% 26.88% 1.1492-Sep-16 15,000 17,250.00 market 26.88% 26.89% 1.150
StakeDate # of shares acquired Value of shares
acquired (S$) Type of transaction
Food & Beverages│Singapore│Equity research│September 14, 2016
21
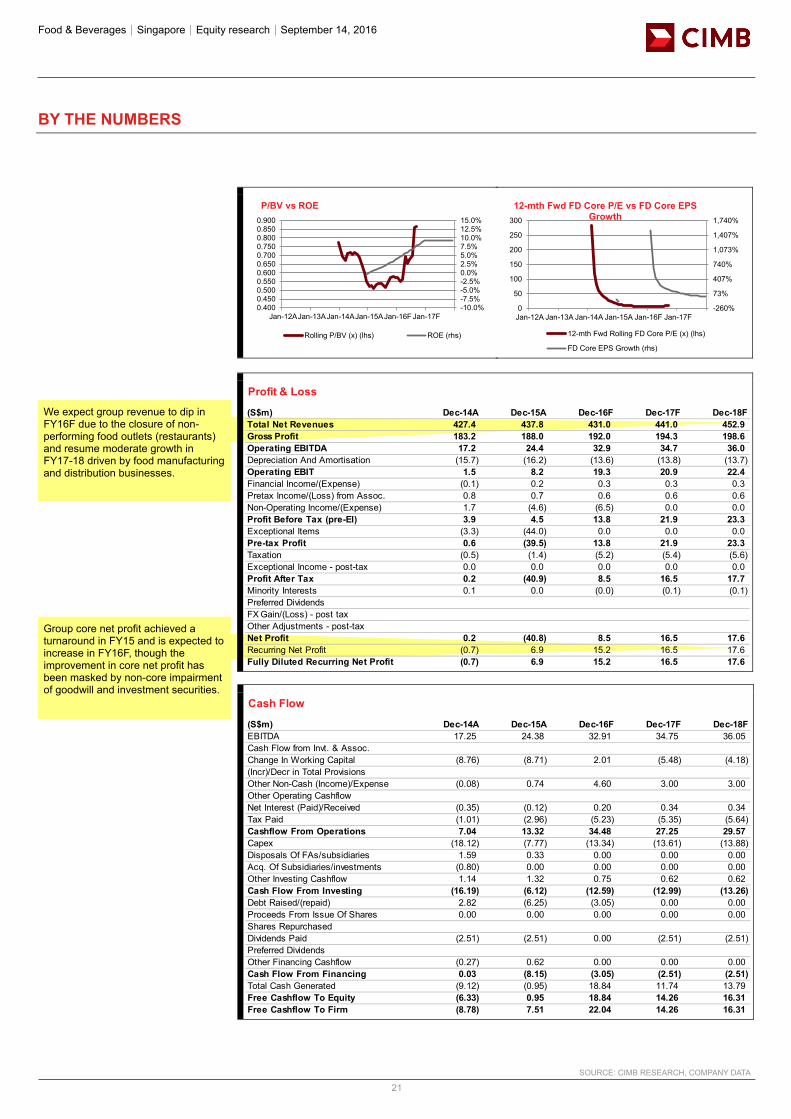
We expect group revenue to dip in FY16F due to the closure of non-performing food outlets (restaurants) and resume moderate growth in FY17-18 driven by food manufacturing and distribution businesses.
Group core net profit achieved a turnaround in FY15 and is expected to increase in FY16F, though the improvement in core net profit has been masked by non-core impairment of goodwill and investment securities.
BY THE NUMBERS
SOURCE: CIMB RESEARCH, COMPANY DATA
-10.0%-7.5%-5.0%-2.5%0.0%2.5%5.0%7.5%10.0%12.5%15.0%
0.4000.4500.5000.5500.6000.6500.7000.7500.8000.8500.900
Jan-12AJan-13AJan-14AJan-15AJan-16F Jan-17F
P/BV vs ROE
Rolling P/BV (x) (lhs) ROE (rhs)
-260%
73%
407%
740%
1,073%
1,407%
1,740%
0
50
100
150
200
250
300
Jan-12A Jan-13A Jan-14A Jan-15A Jan-16F Jan-17F
12-mth Fwd FD Core P/E vs FD Core EPS Growth
12-mth Fwd Rolling FD Core P/E (x) (lhs)
FD Core EPS Growth (rhs)
Profit & Loss
(S$m) Dec-14A Dec-15A Dec-16F Dec-17F Dec-18FTotal Net Revenues 427.4 437.8 431.0 441.0 452.9Gross Profit 183.2 188.0 192.0 194.3 198.6Operating EBITDA 17.2 24.4 32.9 34.7 36.0Depreciation And Amortisation (15.7) (16.2) (13.6) (13.8) (13.7)Operating EBIT 1.5 8.2 19.3 20.9 22.4Financial Income/(Expense) (0.1) 0.2 0.3 0.3 0.3Pretax Income/(Loss) from Assoc. 0.8 0.7 0.6 0.6 0.6Non-Operating Income/(Expense) 1.7 (4.6) (6.5) 0.0 0.0Profit Before Tax (pre-EI) 3.9 4.5 13.8 21.9 23.3Exceptional Items (3.3) (44.0) 0.0 0.0 0.0Pre-tax Profit 0.6 (39.5) 13.8 21.9 23.3Taxation (0.5) (1.4) (5.2) (5.4) (5.6)Exceptional Income - post-tax 0.0 0.0 0.0 0.0 0.0Profit After Tax 0.2 (40.9) 8.5 16.5 17.7Minority Interests 0.1 0.0 (0.0) (0.1) (0.1)Preferred DividendsFX Gain/(Loss) - post taxOther Adjustments - post-taxNet Profit 0.2 (40.8) 8.5 16.5 17.6Recurring Net Profit (0.7) 6.9 15.2 16.5 17.6Fully Diluted Recurring Net Profit (0.7) 6.9 15.2 16.5 17.6
Cash Flow
(S$m) Dec-14A Dec-15A Dec-16F Dec-17F Dec-18FEBITDA 17.25 24.38 32.91 34.75 36.05Cash Flow from Invt. & Assoc.Change In Working Capital (8.76) (8.71) 2.01 (5.48) (4.18)(Incr)/Decr in Total ProvisionsOther Non-Cash (Income)/Expense (0.08) 0.74 4.60 3.00 3.00Other Operating CashflowNet Interest (Paid)/Received (0.35) (0.12) 0.20 0.34 0.34Tax Paid (1.01) (2.96) (5.23) (5.35) (5.64)Cashflow From Operations 7.04 13.32 34.48 27.25 29.57Capex (18.12) (7.77) (13.34) (13.61) (13.88)Disposals Of FAs/subsidiaries 1.59 0.33 0.00 0.00 0.00Acq. Of Subsidiaries/investments (0.80) 0.00 0.00 0.00 0.00Other Investing Cashflow 1.14 1.32 0.75 0.62 0.62Cash Flow From Investing (16.19) (6.12) (12.59) (12.99) (13.26)Debt Raised/(repaid) 2.82 (6.25) (3.05) 0.00 0.00Proceeds From Issue Of Shares 0.00 0.00 0.00 0.00 0.00Shares RepurchasedDividends Paid (2.51) (2.51) 0.00 (2.51) (2.51)Preferred DividendsOther Financing Cashflow (0.27) 0.62 0.00 0.00 0.00Cash Flow From Financing 0.03 (8.15) (3.05) (2.51) (2.51)Total Cash Generated (9.12) (0.95) 18.84 11.74 13.79Free Cashflow To Equity (6.33) 0.95 18.84 14.26 16.31Free Cashflow To Firm (8.78) 7.51 22.04 14.26 16.31
Food & Beverages│Singapore│Equity research│September 14, 2016
22
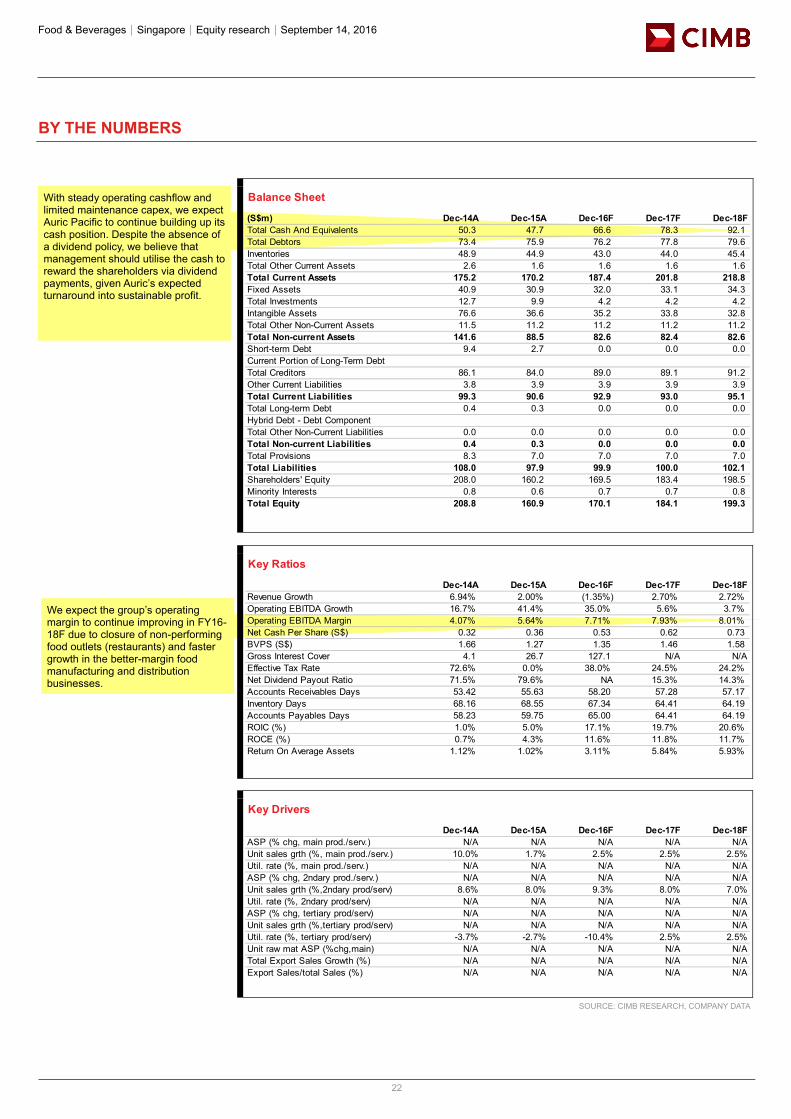
With steady operating cashflow and limited maintenance capex, we expect Auric Pacific to continue building up its cash position. Despite the absence of a dividend policy, we believe that management should utilise the cash to reward the shareholders via dividend payments, given Auric’s expected turnaround into sustainable profit.
We expect the group’s operating margin to continue improving in FY16-18F due to closure of non-performing food outlets (restaurants) and faster growth in the better-margin food manufacturing and distribution businesses.
BY THE NUMBERS
SOURCE: CIMB RESEARCH, COMPANY DATA
Balance Sheet
(S$m) Dec-14A Dec-15A Dec-16F Dec-17F Dec-18FTotal Cash And Equivalents 50.3 47.7 66.6 78.3 92.1Total Debtors 73.4 75.9 76.2 77.8 79.6Inventories 48.9 44.9 43.0 44.0 45.4Total Other Current Assets 2.6 1.6 1.6 1.6 1.6Total Current Assets 175.2 170.2 187.4 201.8 218.8Fixed Assets 40.9 30.9 32.0 33.1 34.3Total Investments 12.7 9.9 4.2 4.2 4.2Intangible Assets 76.6 36.6 35.2 33.8 32.8Total Other Non-Current Assets 11.5 11.2 11.2 11.2 11.2Total Non-current Assets 141.6 88.5 82.6 82.4 82.6Short-term Debt 9.4 2.7 0.0 0.0 0.0Current Portion of Long-Term DebtTotal Creditors 86.1 84.0 89.0 89.1 91.2Other Current Liabilities 3.8 3.9 3.9 3.9 3.9Total Current Liabilities 99.3 90.6 92.9 93.0 95.1Total Long-term Debt 0.4 0.3 0.0 0.0 0.0Hybrid Debt - Debt ComponentTotal Other Non-Current Liabilities 0.0 0.0 0.0 0.0 0.0Total Non-current Liabilities 0.4 0.3 0.0 0.0 0.0Total Provisions 8.3 7.0 7.0 7.0 7.0Total Liabilities 108.0 97.9 99.9 100.0 102.1Shareholders' Equity 208.0 160.2 169.5 183.4 198.5Minority Interests 0.8 0.6 0.7 0.7 0.8Total Equity 208.8 160.9 170.1 184.1 199.3
Key Ratios
Dec-14A Dec-15A Dec-16F Dec-17F Dec-18FRevenue Growth 6.94% 2.00% (1.35%) 2.70% 2.72%Operating EBITDA Growth 16.7% 41.4% 35.0% 5.6% 3.7%Operating EBITDA Margin 4.07% 5.64% 7.71% 7.93% 8.01%Net Cash Per Share (S$) 0.32 0.36 0.53 0.62 0.73BVPS (S$) 1.66 1.27 1.35 1.46 1.58Gross Interest Cover 4.1 26.7 127.1 N/A N/AEffective Tax Rate 72.6% 0.0% 38.0% 24.5% 24.2%Net Dividend Payout Ratio 71.5% 79.6% NA 15.3% 14.3%Accounts Receivables Days 53.42 55.63 58.20 57.28 57.17Inventory Days 68.16 68.55 67.34 64.41 64.19Accounts Payables Days 58.23 59.75 65.00 64.41 64.19ROIC (%) 1.0% 5.0% 17.1% 19.7% 20.6%ROCE (%) 0.7% 4.3% 11.6% 11.8% 11.7%Return On Average Assets 1.12% 1.02% 3.11% 5.84% 5.93%
Key Drivers
Dec-14A Dec-15A Dec-16F Dec-17F Dec-18FASP (% chg, main prod./serv.) N/A N/A N/A N/A N/AUnit sales grth (%, main prod./serv.) 10.0% 1.7% 2.5% 2.5% 2.5%Util. rate (%, main prod./serv.) N/A N/A N/A N/A N/AASP (% chg, 2ndary prod./serv.) N/A N/A N/A N/A N/AUnit sales grth (%,2ndary prod/serv) 8.6% 8.0% 9.3% 8.0% 7.0%Util. rate (%, 2ndary prod/serv) N/A N/A N/A N/A N/AASP (% chg, tertiary prod/serv) N/A N/A N/A N/A N/AUnit sales grth (%,tertiary prod/serv) N/A N/A N/A N/A N/AUtil. rate (%, tertiary prod/serv) -3.7% -2.7% -10.4% 2.5% 2.5%Unit raw mat ASP (%chg,main) N/A N/A N/A N/A N/ATotal Export Sales Growth (%) N/A N/A N/A N/A N/AExport Sales/total Sales (%) N/A N/A N/A N/A N/A
Food & Beverages│Singapore│Equity research│September 14, 2016
23
DISCLAIMER #01 The content of this report (including the views and opinions expressed therein, and the information comprised therein) has been prepared by and belongs to CIMB and is distributed by CIMB. This report is not directed to, or intended for distribution to or use by, any person or entity who is a citizen or resident of or located in any locality, state, country or other jurisdiction where such distribution, publication, availability or use would be contrary to law or regulation. By accepting this report, the recipient hereof represents and warrants that he is entitled to receive such report in accordance with the restrictions set forth below and agrees to be bound by the limitations contained herein (including the “Restrictions on Distributions” set out below). Any failure to comply with these limitations may constitute a violation of law. This publication is being supplied to you strictly on the basis that it will remain confidential. No part of this report may be (i) copied, photocopied, duplicated, stored or reproduced in any form by any means or (ii) redistributed or passed on, directly or indirectly, to any other person in whole or in part, for any purpose without the prior written consent of CIMB. The information contained in this research report is prepared from data believed to be correct and reliable at the time of issue of this report. CIMB may or may not issue regular reports on the subject matter of this report at any frequency and may cease to do so or change the periodicity of reports at any time. CIMB is under no obligation to update this report in the event of a material change to the information contained in this report. CIMB has no, and will not accept any, obligation to (i) check or ensure that the contents of this report remain current, reliable or relevant, (ii) ensure that the content of this report constitutes all the information a prospective investor may require, (iii) ensure the adequacy, accuracy, completeness, reliability or fairness of any views, opinions and information, and accordingly, CIMB, or any of their respective affiliates, or its related persons (and their respective directors, associates, connected persons and/or employees) shall not be liable in any manner whatsoever for any consequences (including but not limited to any direct, indirect or consequential losses, loss of profits and damages) of any reliance thereon or usage thereof. In particular, CIMB disclaims all responsibility and liability for the views and opinions set out in this report. Unless otherwise specified, this report is based upon sources which CIMB considers to be reasonable. Such sources will, unless otherwise specified, for market data, be market data and prices available from the main stock exchange or market where the relevant security is listed, or, where appropriate, any other market. Information on the accounts and business of company(ies) will generally be based on published statements of the company(ies), information disseminated by regulatory information services, other publicly available information and information resulting from our research. Whilst every effort is made to ensure that statements of facts made in this report are accurate, all estimates, projections, forecasts, expressions of opinion and other subjective judgments contained in this report are based on assumptions considered to be reasonable as of the date of the document in which they are contained and must not be construed as a representation that the matters referred to therein will occur. Past performance is not a reliable indicator of future performance. The value of investments may go down as well as up and those investing may, depending on the investments in question, lose more than the initial investment. No report shall constitute an offer or an invitation by or on behalf of CIMB or its affiliates to any person to buy or sell any investments. CIMB, its affiliates and related companies, their directors, associates, connected parties and/or employees may own or have positions in securities of the company(ies) covered in this research report or any securities related thereto and may from time to time add to or dispose of, or may be materially interested in, any such securities. Further, CIMB, its affiliates and its related companies do and seek to do business with the company(ies) covered in this research report and may from time to time act as market maker or have assumed an underwriting commitment in securities of such company(ies), may sell them to or buy them from customers on a principal basis and may also perform or seek to perform significant investment banking, advisory, underwriting or placement services for or relating to such company(ies) as well as solicit such investment, advisory or other services from any entity mentioned in this report. CIMB or its affiliates may enter into an agreement with the company(ies) covered in this report relating to the production of research reports. CIMB may disclose the contents of this report to the company(ies) covered by it and may have amended the contents of this report following such disclosure. The analyst responsible for the production of this report hereby certifies that the views expressed herein accurately and exclusively reflect his or her personal views and opinions about any and all of the issuers or securities analysed in this report and were prepared independently and autonomously. No part of the compensation of the analyst(s) was, is, or will be directly or indirectly related to the inclusion of specific recommendations(s) or view(s) in this report. CIMB prohibits the analyst(s) who prepared this research report from receiving any compensation, incentive or bonus based on specific investment banking transactions or for providing a specific recommendation for, or view of, a particular company. Information barriers and other arrangements may be established where necessary to prevent conflicts of interests arising. However, the analyst(s) may receive compensation that is based on his/their coverage of company(ies) in the performance of his/their duties or the performance of his/their recommendations and the research personnel involved in the preparation of this report may also participate in the solicitation of the businesses as described above. In reviewing this research report, an investor should be aware that any or all of the foregoing, among other things, may give rise to real or potential conflicts of interest. Additional information is, subject to the duties of confidentiality, available on request. Reports relating to a specific geographical area are produced by the corresponding CIMB entity as listed in the table below. The term “CIMB” shall denote, where appropriate, the relevant entity distributing or disseminating the report in the particular jurisdiction referenced below, or, in every other case, CIMB Group Holdings Berhad ("CIMBGH") and its affiliates, subsidiaries and related companies.

Food & Beverages│Singapore│Equity research│September 14, 2016
24
Country CIMB Entity Regulated by Hong Kong CIMB Securities Limited Securities and Futures Commission Hong Kong India CIMB Securities (India) Private Limited Securities and Exchange Board of India (SEBI) Indonesia PT CIMB Securities Indonesia Financial Services Authority of Indonesia Malaysia CIMB Investment Bank Berhad Securities Commission Malaysia Singapore CIMB Research Pte. Ltd. Monetary Authority of Singapore South Korea CIMB Securities Limited, Korea Branch Financial Services Commission and Financial Supervisory Service Taiwan CIMB Securities Limited, Taiwan Branch Financial Supervisory Commission Thailand CIMB Securities (Thailand) Co. Ltd. Securities and Exchange Commission Thailand
(i) As of September 13, 2016 CIMB has a proprietary position in the securities (which may include but not limited to shares, warrants, call warrants and/or any other derivatives) in the following company or companies covered or recommended in this report: (a) Auric Pacific Ltd (ii) As of September 14, 2016, the analyst(s) who prepared this report, and the associate(s), has / have an interest in the securities (which may include but not limited to shares, warrants, call warrants and/or any other derivatives) in the following company or companies covered or recommended in this report: (a) -
This report does not purport to contain all the information that a prospective investor may require. CIMB or any of its affiliates does not make any guarantee, representation or warranty, express or implied, as to the adequacy, accuracy, completeness, reliability or fairness of any such information and opinion contained in this report. Neither CIMB nor any of its affiliates nor its related persons shall be liable in any manner whatsoever for any consequences (including but not limited to any direct, indirect or consequential losses, loss of profits and damages) of any reliance thereon or usage thereof. This report is general in nature and has been prepared for information purposes only. It is intended for circulation amongst CIMB and its affiliates’ clients generally and does not have regard to the specific investment objectives, financial situation and the particular needs of any specific person who may receive this report. The information and opinions in this report are not and should not be construed or considered as an offer, recommendation or solicitation to buy or sell the subject securities, related investments or other financial instruments or any derivative instrument, or any rights pertaining thereto. Investors are advised to make their own independent evaluation of the information contained in this research report, consider their own individual investment objectives, financial situation and particular needs and consult their own professional and financial advisers as to the legal, business, financial, tax and other aspects before participating in any transaction in respect of the securities of company(ies) covered in this research report. The securities of such company(ies) may not be eligible for sale in all jurisdictions or to all categories of investors.
Australia: Despite anything in this report to the contrary, this research is provided in Australia by CIMB Securities (Singapore) Pte. Ltd. and CIMB Securities Limited. This research is only available in Australia to persons who are “wholesale clients” (within the meaning of the Corporations Act 2001 (Cth) and is supplied solely for the use of such wholesale clients and shall not be distributed or passed on to any other person. You represent and warrant that if you are in Australia, you are a “wholesale client”. This research is of a general nature only and has been prepared without taking into account the objectives, financial situation or needs of the individual recipient. CIMB Securities (Singapore) Pte. Ltd. and CIMB Securities Limited do not hold, and are not required to hold an Australian financial services licence. CIMB Securities (Singapore) Pte. Ltd. and CIMB Securities Limited rely on “passporting” exemptions for entities appropriately licensed by the Monetary Authority of Singapore (under ASIC Class Order 03/1102) and the Securities and Futures Commission in Hong Kong (under ASIC Class Order 03/1103). Canada: This research report has not been prepared in accordance with the disclosure requirements of Dealer Member Rule 3400 – Research Restrictions and Disclosure Requirements of the Investment Industry Regulatory Organization of Canada. For any research report distributed by CIBC, further disclosures related to CIBC conflicts of interest can be found at https://researchcentral.cibcwm.com . China: For the purpose of this report, the People’s Republic of China (“PRC”) does not include the Hong Kong Special Administrative Region, the Macau Special Administrative Region or Taiwan. The distributor of this report has not been approved or licensed by the China Securities Regulatory Commission or any other relevant regulatory authority or governmental agency in the PRC. This report contains only marketing information. The distribution of this report is not an offer to buy or sell to any person within or outside PRC or a solicitation to any person within or outside of PRC to buy or sell any instruments described herein. This report is being issued outside the PRC to a limited number of institutional investors and may not be provided to any person other than the original recipient and may not be reproduced or used for any other purpose. France: Only qualified investors within the meaning of French law shall have access to this report. This report shall not be considered as an offer to subscribe to, or used in connection with, any offer for subscription or sale or marketing or direct or indirect distribution of financial instruments and it is not intended as a solicitation for the purchase of any financial instrument. Germany: This report is only directed at persons who are professional investors as defined in sec 31a(2) of the German Securities Trading Act (WpHG). This publication constitutes research of a non-binding nature on the market situation and the investment instruments cited here at the time of the publication of the information. The current prices/yields in this issue are based upon closing prices from Bloomberg as of the day preceding publication. Please note that neither the German Federal Financial Supervisory Agency (BaFin), nor any other supervisory authority exercises any control over the content of this report. Hong Kong: This report is issued and distributed in Hong Kong by CIMB Securities Limited (“CHK”) which is licensed in Hong Kong by the Securities and Futures Commission for Type 1 (dealing in securities), Type 4 (advising on securities) and Type 6 (advising on corporate finance) activities. Any investors wishing to purchase or otherwise deal in the securities covered in this report should contact the Head of Sales at CIMB Securities Limited. The views and opinions in this research report are our own as of the date hereof and are subject to change. If the Financial Services and Markets Act of the United Kingdom or the rules of the Financial Conduct Authority apply to a recipient, our obligations owed to such
Food & Beverages│Singapore│Equity research│September 14, 2016
25
recipient therein are unaffected. CHK has no obligation to update its opinion or the information in this research report. This publication is strictly confidential and is for private circulation only to clients of CHK. CIMB Securities Limited does not make a market on the securities mentioned in the report.
India: This report is issued and distributed in India by CIMB Securities (India) Private Limited (”CIMB India") which is registered with SEBI as a stock-broker under the Securities and Exchange Board of India (Stock Brokers and Sub-Brokers) Regulations, 1992, the Securities and Exchange Board of India (Research Analyst) Regulations, 2014 (SEBI Registration Number INH000000669) and in accordance with the provisions of Regulation 4 (g) of the Securities and Exchange Board of India (Investment Advisers) Regulations, 2013, CIMB India is not required to seek registration with SEBI as an Investment Adviser. The research analysts, strategists or economists principally responsible for the preparation of this research report are segregated from equity stock broking and merchant banking of CIMB India and they have received compensation based upon various factors, including quality, accuracy and value of research, firm profitability or revenues, client feedback and competitive factors. Research analysts', strategists' or economists' compensation is not linked to investment banking or capital markets transactions performed or proposed to be performed by CIMB India or its affiliates.” Indonesia: This report is issued and distributed by PT CIMB Securities Indonesia (“CIMBI”). The views and opinions in this research report are our own as of the date hereof and are subject to change. If the Financial Services and Markets Act of the United Kingdom or the rules of the Financial Conduct Authority apply to a recipient, our obligations owed to such recipient therein are unaffected. CIMBI has no obligation to update its opinion or the information in this research report. Neither this report nor any copy hereof may be distributed in Indonesia or to any Indonesian citizens wherever they are domiciled or to Indonesian residents except in compliance with applicable Indonesian capital market laws and regulations. This research report is not an offer of securities in Indonesia. The securities referred to in this research report have not been registered with the Financial Services Authority (Otoritas Jasa Keuangan) pursuant to relevant capital market laws and regulations, and may not be offered or sold within the territory of the Republic of Indonesia or to Indonesian citizens through a public offering or in circumstances which constitute an offer within the meaning of the Indonesian capital market law and regulations. Ireland: CIMB is not an investment firm authorised in the Republic of Ireland and no part of this document should be construed as CIMB acting as, or otherwise claiming or representing to be, an investment firm authorised in the Republic of Ireland. Malaysia: This report is issued and distributed by CIMB Investment Bank Berhad (“CIMB”) solely for the benefit of and for the exclusive use of our clients. If the Financial Services and Markets Act of the United Kingdom or the rules of the Financial Conduct Authority apply to a recipient, our obligations owed to such recipient therein are unaffected. CIMB has no obligation to update, revise or reaffirm its opinion or the information in this research reports after the date of this report. New Zealand: In New Zealand, this report is for distribution only to persons who are wholesale clients pursuant to section 5C of the Financial Advisers Act 2008. Singapore: This report is issued and distributed by CIMB Research Pte Ltd (“CIMBR”). CIMBR is a financial adviser licensed under the Financial Advisers Act, Cap 110 (“FAA”) for advising on investment products, by issuing or promulgating research analyses or research reports, whether in electronic, print or other form. Accordingly CIMBR is a subject to the applicable rules under the FAA unless it is able to avail itself to any prescribed exemptions. Recipients of this report are to contact CIMB Research Pte Ltd, 50 Raffles Place, #19-00 Singapore Land Tower, Singapore in respect of any matters arising from, or in connection with this report. CIMBR has no obligation to update its opinion or the information in this research report. This publication is strictly confidential and is for private circulation only. If you have not been sent this report by CIMBR directly, you may not rely, use or disclose to anyone else this report or its contents. If the recipient of this research report is not an accredited investor, expert investor or institutional investor, CIMBR accepts legal responsibility for the contents of the report without any disclaimer limiting or otherwise curtailing such legal responsibility. If the recipient is an accredited investor, expert investor or institutional investor, the recipient is deemed to acknowledge that CIMBR is exempt from certain requirements under the FAA and its attendant regulations, and as such, is exempt from complying with the following : (a) Section 25 of the FAA (obligation to disclose product information); (b) Section 27 (duty not to make recommendation with respect to any investment product without having a reasonable basis where you may be reasonably expected to rely on the recommendation) of the FAA; (c) MAS Notice on Information to Clients and Product Information Disclosure [Notice No. FAA-N03]; (d) MAS Notice on Recommendation on Investment Products [Notice No. FAA-N16]; (e) Section 36 (obligation on disclosure of interest in securities), and (f) any other laws, regulations, notices, directive, guidelines, circulars and practice notes which are relates to the above, to the extent permitted by applicable laws, as may be amended from time to time, and any other laws, regulations, notices, directive, guidelines, circulars, and practice notes as we may notify you from time to time. In addition, the recipient who is an accredited investor, expert investor or institutional investor acknowledges that a CIMBR is exempt from Section 27 of the FAA, the recipient will also not be able to file a civil claim against CIMBR for any loss or damage arising from the recipient’s reliance on any recommendation made by CIMBR which would otherwise be a right that is available to the recipient under Section 27 of the FAA, the recipient will also not be able to file a civil claim against CIMBR for any loss or damage arising from the recipient’s reliance on any recommendation made by CIMBR which would otherwise be a right that is available to the recipient under Section 27 of the FAA. CIMB Research Pte Ltd ("CIMBR"), its affiliates and related companies, their directors, associates, connected parties and/or employees may own or have positions in securities of the company(ies) covered in this research report or any securities related thereto and may from time to time add to or dispose of, or may be materially interested in, any such securities. Further, CIMBR, its affiliates and its related companies do and seek to do business with the company(ies) covered in this research report and may from time to time act as market maker or have assumed an underwriting
Food & Beverages│Singapore│Equity research│September 14, 2016
26
commitment in securities of such company(ies), may sell them to or buy them from customers on a principal basis and may also perform or seek to perform significant investment banking, advisory, underwriting or placement services for or relating to such company(ies) as well as solicit such investment, advisory or other services from any entity mentioned in this report. As of September 13, 2016, CIMBR does not have a proprietary position in the recommended securities in this report. CIMB Securities Singapore Pte Ltd and/or CIMB Bank does not make a market on the securities mentioned in the report.
South Korea: This report is issued and distributed in South Korea by CIMB Securities Limited, Korea Branch (“CIMB Korea”) which is licensed as a cash equity broker, and regulated by the Financial Services Commission and Financial Supervisory Service of Korea. In South Korea, this report is for distribution only to professional investors under Article 9(5) of the Financial Investment Services and Capital Market Act of Korea (“FSCMA”). Spain: This document is a research report and it is addressed to institutional investors only. The research report is of a general nature and not personalised and does not constitute investment advice so, as the case may be, the recipient must seek proper advice before adopting any investment decision. This document does not constitute a public offering of securities. CIMB is not registered with the Spanish Comision Nacional del Mercado de Valores to provide investment services. Sweden: This report contains only marketing information and has not been approved by the Swedish Financial Supervisory Authority. The distribution of this report is not an offer to sell to any person in Sweden or a solicitation to any person in Sweden to buy any instruments described herein and may not be forwarded to the public in Sweden. Switzerland: This report has not been prepared in accordance with the recognized self-regulatory minimal standards for research reports of banks issued by the Swiss Bankers’ Association (Directives on the Independence of Financial Research). Taiwan: This research report is not an offer or marketing of foreign securities in Taiwan. The securities as referred to in this research report have not been and will not be registered with the Financial Supervisory Commission of the Republic of China pursuant to relevant securities laws and regulations and may not be offered or sold within the Republic of China through a public offering or in circumstances which constitutes an offer or a placement within the meaning of the Securities and Exchange Law of the Republic of China that requires a registration or approval of the Financial Supervisory Commission of the Republic of China. Thailand: This report is issued and distributed by CIMB Securities (Thailand) Company Limited (“CIMBS”) based upon sources believed to be reliable (but their accuracy, completeness or correctness is not guaranteed). The statements or expressions of opinion herein were arrived at after due and careful consideration for use as information for investment. Such opinions are subject to change without notice and CIMBS has no obligation to update its opinion or the information in this research report. If the Financial Services and Markets Act of the United Kingdom or the rules of the Financial Conduct Authority apply to a recipient, our obligations owed to such recipient are unaffected. CIMB Securities (Thailand) Co., Ltd. may act or acts as Market Maker, and issuer and offerer of Derivative Warrants and Structured Note which may have the following securities as its underlying securities. Investors should carefully read and study the details of the derivative warrants in the prospectus before making investment decisions. AAV, ADVANC, AMATA, ANAN, AOT, AP, BA, BANPU, BBL, BCH, BCP, BDMS, BEAUTY, BEC, BEM, BH, BJCHI, BLA, BLAND, BTS, CBG, CENTEL, CHG, CK, CKP, COM7, CPALL, CPF, CPN, DELTA, DTAC, EGCO, EPG, ERW, GL, GLOBAL, GLOW, GPSC, GUNKUL, HANA, HMPRO, ICHI, IFEC, INTUCH, IRPC, ITD, IVL, JWD, KBANK, KCE, KKP, KTB, KTC, LH, LHBANK, LPN, MAJOR, MINT, MTLS, PLANB, PS, PTG, PTT, PTTEP, PTTGC, QH, ROBINS, RS, S, SAMART, SAWAD, SCB, SCC, SGP, SIRI, SPALI, SPCG, STEC, STPI, SVI, TASCO, TCAP, THAI, THCOM, TISCO, TMB, TOP, TPIPL, TRC, TRUE, TTA, TTCL, TTW, TU, TVO, UNIQ, VGI, VNG, WHA, WORK. Corporate Governance Report: The disclosure of the survey result of the Thai Institute of Directors Association (“IOD”) regarding corporate governance is made pursuant to the policy of the Office of the Securities and Exchange Commission. The survey of the IOD is based on the information of a company listed on the Stock Exchange of Thailand and the Market for Alternative Investment disclosed to the public and able to be accessed by a general public investor. The result, therefore, is from the perspective of a third party. It is not an evaluation of operation and is not based on inside information. The survey result is as of the date appearing in the Corporate Governance Report of Thai Listed Companies. As a result, the survey result may be changed after that date. CIMBS does not confirm nor certify the accuracy of such survey result.
Score Range: 90 - 100 80 - 89 70 - 79 Below 70 or No Survey Result Description: Excellent Very Good Good N/A
United Arab Emirates: The distributor of this report has not been approved or licensed by the UAE Central Bank or any other relevant licensing authorities or governmental agencies in the United Arab Emirates. This report is strictly private and confidential and has not been reviewed by, deposited or registered with UAE Central Bank or any other licensing authority or governmental agencies in the United Arab Emirates. This report is being issued outside the United Arab Emirates to a limited number of institutional investors and must not be provided to any person other than the original recipient and may not be reproduced or used for any other purpose. Further, the information contained in this report is not intended to lead to the sale of investments under any subscription agreement or the conclusion of any other contract of whatsoever nature within the territory of the United Arab Emirates. United Kingdom: In the United Kingdom and European Economic Area, this report is being disseminated by CIMB Securities (UK) Limited (“CIMB UK”). CIMB UK is authorized and regulated by the Financial Conduct Authority and its registered office is at 27 Knightsbridge, London, SW1X7YB. Unless specified to the contrary, this report has been issued and approved for distribution in the U.K. and the EEA by CIMB UK. Investment research issued by CIMB UK has been prepared in accordance with CIMB Group’s policies for managing conflicts of interest arising as a result of publication and distribution of investment research. This report is for distribution only to, and is solely directed at, selected persons on the basis that those persons: (a) are eligible counterparties and professional clients of CIMB UK; (b) have professional experience in matters relating to investments falling within Article 19(5) of the Financial Services and Markets Act 2000 (Financial Promotion) Order 2005 (as amended,
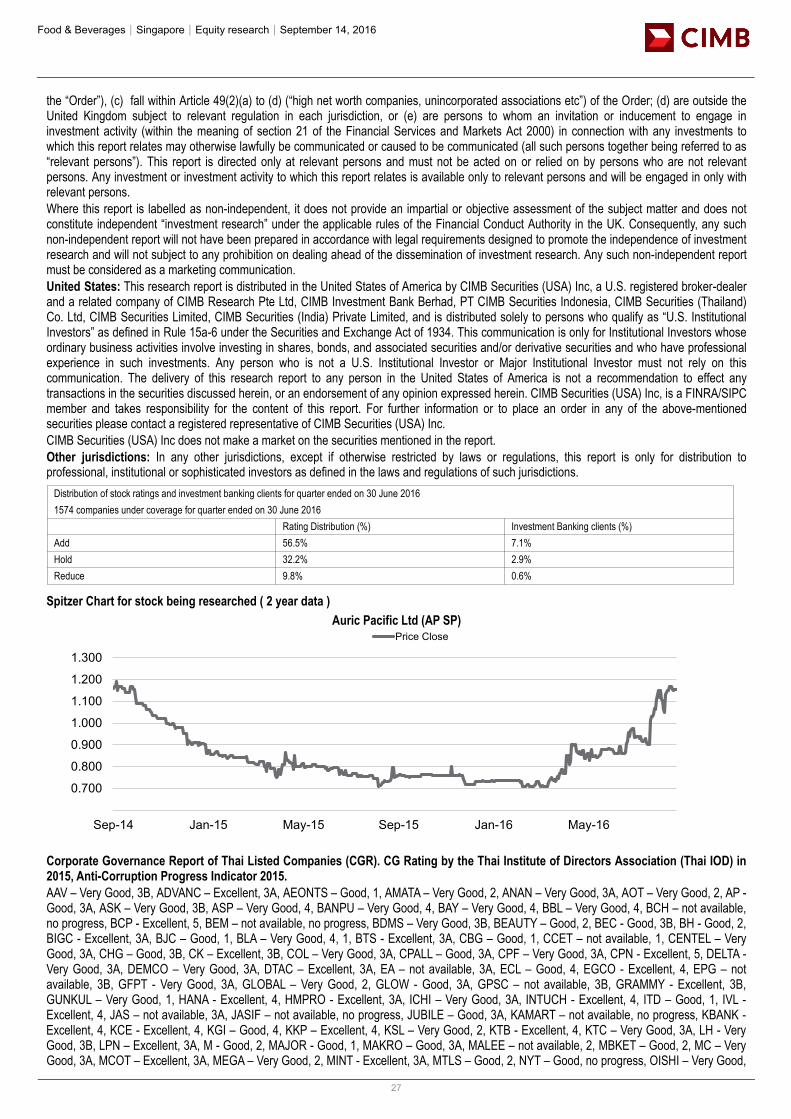
Food & Beverages│Singapore│Equity research│September 14, 2016
27
the “Order”), (c) fall within Article 49(2)(a) to (d) (“high net worth companies, unincorporated associations etc”) of the Order; (d) are outside the United Kingdom subject to relevant regulation in each jurisdiction, or (e) are persons to whom an invitation or inducement to engage in investment activity (within the meaning of section 21 of the Financial Services and Markets Act 2000) in connection with any investments to which this report relates may otherwise lawfully be communicated or caused to be communicated (all such persons together being referred to as “relevant persons”). This report is directed only at relevant persons and must not be acted on or relied on by persons who are not relevant persons. Any investment or investment activity to which this report relates is available only to relevant persons and will be engaged in only with relevant persons. Where this report is labelled as non-independent, it does not provide an impartial or objective assessment of the subject matter and does not constitute independent “investment research” under the applicable rules of the Financial Conduct Authority in the UK. Consequently, any such non-independent report will not have been prepared in accordance with legal requirements designed to promote the independence of investment research and will not subject to any prohibition on dealing ahead of the dissemination of investment research. Any such non-independent report must be considered as a marketing communication. United States: This research report is distributed in the United States of America by CIMB Securities (USA) Inc, a U.S. registered broker-dealer and a related company of CIMB Research Pte Ltd, CIMB Investment Bank Berhad, PT CIMB Securities Indonesia, CIMB Securities (Thailand) Co. Ltd, CIMB Securities Limited, CIMB Securities (India) Private Limited, and is distributed solely to persons who qualify as “U.S. Institutional Investors” as defined in Rule 15a-6 under the Securities and Exchange Act of 1934. This communication is only for Institutional Investors whose ordinary business activities involve investing in shares, bonds, and associated securities and/or derivative securities and who have professional experience in such investments. Any person who is not a U.S. Institutional Investor or Major Institutional Investor must not rely on this communication. The delivery of this research report to any person in the United States of America is not a recommendation to effect any transactions in the securities discussed herein, or an endorsement of any opinion expressed herein. CIMB Securities (USA) Inc, is a FINRA/SIPC member and takes responsibility for the content of this report. For further information or to place an order in any of the above-mentioned securities please contact a registered representative of CIMB Securities (USA) Inc. CIMB Securities (USA) Inc does not make a market on the securities mentioned in the report. Other jurisdictions: In any other jurisdictions, except if otherwise restricted by laws or regulations, this report is only for distribution to professional, institutional or sophisticated investors as defined in the laws and regulations of such jurisdictions.
Spitzer Chart for stock being researched ( 2 year data )
Auric Pacific Ltd (AP SP)
Corporate Governance Report of Thai Listed Companies (CGR). CG Rating by the Thai Institute of Directors Association (Thai IOD) in 2015, Anti-Corruption Progress Indicator 2015. AAV – Very Good, 3B, ADVANC – Excellent, 3A, AEONTS – Good, 1, AMATA – Very Good, 2, ANAN – Very Good, 3A, AOT – Very Good, 2, AP - Good, 3A, ASK – Very Good, 3B, ASP – Very Good, 4, BANPU – Very Good, 4, BAY – Very Good, 4, BBL – Very Good, 4, BCH – not available, no progress, BCP - Excellent, 5, BEM – not available, no progress, BDMS – Very Good, 3B, BEAUTY – Good, 2, BEC - Good, 3B, BH - Good, 2, BIGC - Excellent, 3A, BJC – Good, 1, BLA – Very Good, 4, 1, BTS - Excellent, 3A, CBG – Good, 1, CCET – not available, 1, CENTEL – Very Good, 3A, CHG – Good, 3B, CK – Excellent, 3B, COL – Very Good, 3A, CPALL – Good, 3A, CPF – Very Good, 3A, CPN - Excellent, 5, DELTA - Very Good, 3A, DEMCO – Very Good, 3A, DTAC – Excellent, 3A, EA – not available, 3A, ECL – Good, 4, EGCO - Excellent, 4, EPG – not available, 3B, GFPT - Very Good, 3A, GLOBAL – Very Good, 2, GLOW - Good, 3A, GPSC – not available, 3B, GRAMMY - Excellent, 3B, GUNKUL – Very Good, 1, HANA - Excellent, 4, HMPRO - Excellent, 3A, ICHI – Very Good, 3A, INTUCH - Excellent, 4, ITD – Good, 1, IVL - Excellent, 4, JAS – not available, 3A, JASIF – not available, no progress, JUBILE – Good, 3A, KAMART – not available, no progress, KBANK - Excellent, 4, KCE - Excellent, 4, KGI – Good, 4, KKP – Excellent, 4, KSL – Very Good, 2, KTB - Excellent, 4, KTC – Very Good, 3A, LH - Very Good, 3B, LPN – Excellent, 3A, M - Good, 2, MAJOR - Good, 1, MAKRO – Good, 3A, MALEE – not available, 2, MBKET – Good, 2, MC – Very Good, 3A, MCOT – Excellent, 3A, MEGA – Very Good, 2, MINT - Excellent, 3A, MTLS – Good, 2, NYT – Good, no progress, OISHI – Very Good,
Rating Distribution (%) Investment Banking clients (%)Add 56.5% 7.1%Hold 32.2% 2.9%Reduce 9.8% 0.6%
Distribution of stock ratings and investment banking clients for quarter ended on 30 June 20161574 companies under coverage for quarter ended on 30 June 2016
0.600
0.700
0.800
0.900
1.000
1.100
1.200
1.300
Sep-14 Jan-15 May-15 Sep-15 Jan-16 May-16
Price Close

Food & Beverages│Singapore│Equity research│September 14, 2016
28
3B, PLANB – Good, 3B, PS – Excellent, 3A, PSL - Excellent, 4, PTT - Excellent, 5, PTTEP - Excellent, 4, PTTGC - Excellent, 5, QH – Very Good, 2, RATCH – Excellent, 3A, ROBINS – Excellent, 3A, RS – Very Good, 1, SAMART - Excellent, 3B, SAPPE - Good, 3B, SAT – Excellent, 5, SAWAD – Good, 1, SC – Excellent, 3B, SCB - Excellent, 4, SCBLIF – not available, no progress, SCC – Excellent, 5, SCN – Good, 1, SCCC - Good, 3A, SIM - Excellent, 3B, SIRI - Good, 1, SPALI - Excellent, 3A, SPRC – not available, no progress, STA – Very Good, 1, STEC – Very Good, 3B, SVI – Very Good, 3A, TASCO – Very Good, 3A, TCAP – Very Good, 4, THAI – Very Good, 3A, THANI – Very Good, 5, THCOM – Excellent, 4, THRE – Very Good, 3A, THREL – Very Good, 3A, TICON – Very Good, 3A, TISCO - Excellent, 4, TK – Very Good, 3B, TKN – not available, no progress, TMB - Excellent, 4, TPCH – Good, 3B, TOP - Excellent, 5, TRUE – Very Good, 2, TTW – Very Good, 2, TU – Very Good, 3A, UNIQ – not available, 2, VGI – Excellent, 3A, WHA – Good, 3A, WORK – not available, no progress.
Comprises level 1 to 5 as follows: Level 1: Committed Level 2: Declared Level 3: Established (3A: Established by Declaration of Intent, 3B: Established by Internal Commitment and Policy) Level 4: Certified Level 5: Extended.
CIMB Recommendation Framework Stock Ratings Definition: Add The stock’s total return is expected to exceed 10% over the next 12 months. Hold The stock’s total return is expected to be between 0% and positive 10% over the next 12 months. Reduce The stock’s total return is expected to fall below 0% or more over the next 12 months. The total expected return of a stock is defined as the sum of the: (i) percentage difference between the target price and the current price and (ii) the forward net dividend yields of the stock. Stock price targets have an investment horizon of 12 months.
Sector Ratings Definition: Overweight An Overweight rating means stocks in the sector have, on a market cap-weighted basis, a positive absolute recommendation. Neutral A Neutral rating means stocks in the sector have, on a market cap-weighted basis, a neutral absolute recommendation. Underweight An Underweight rating means stocks in the sector have, on a market cap-weighted basis, a negative absolute recommendation.
Country Ratings Definition: Overweight An Overweight rating means investors should be positioned with an above-market weight in this country relative to benchmark. Neutral A Neutral rating means investors should be positioned with a neutral weight in this country relative to benchmark. Underweight An Underweight rating means investors should be positioned with a below-market weight in this country relative to benchmark.