Embed Size (px)
Citation preview
Simultaneous Production of Methanol and Dimethylether from Synthesis Gas
DOCTORAL THESIS
Submitted to the Department of Chemical
Engineering of the University of Patras
by
Siranush Akarmazyan
In Partial Fulfilment of the Requirements
For the Degree of Doctor of Philosophy
Patras, January 2015

DEDICATED To my Mother
v
Acknowledgement
I would like to express my greatest appreciation to my supervisor Assoc. Prof.
Dimitris Kondarides for accepting me as a PhD student and providing me the opportunity to
engage my research activity in the Laboratory of Heterogeneous Catalysis at the Department
of Chemical Engineering of the University of Patras. I am grateful for his guidance, kind
attitude and support in every aspect of my PhD study.
I express my sincere gratitude to my co-supervisor Ass. Prof. Ch. Papadopoulou for
her support, encouragement and continuous readiness to assist me whenever I was in need.
I would also like to mention my thankfulness to Prof. X. Verykios for his valuable
discussions, suggestions and comments, especially at the beginning of my PhD study.
I express my thanks to Assoc. Prof. K. Triantafyllidis for his suggestions, advice and
willingness to help me with the part of my research work related to zeolite materials.
I‟m also grateful to Ass. Prof. Ch. Matralis for his advice and technical assistance
with the high pressure experimental set-up. In this respect, I greatly appreciate the help of
the master student A. Kouroumlidis. Without his assistance I wouldn‟t be able to handle the
high pressure experimental set-up.
I would like also to express my gratitude to Prof. S. Boghosian, Prof. Ch. Kordulis
and Assoc. Prof. S. Bebelis for their willingness to participate in the Examining Committee
for the final evaluation of my PhD thesis.
I thank to Dr. P. Panagiotopoulou for her support and technical assistance. She was
freely sharing her knowledge and experience whenever there was a need.
I wish to thank also
Dr. S. Karakoulia for the characterization of zeolite materials.
Dr. A. Kambolis for introducing me the B.E.T. technique and helping with the
preparation of some catalytic materials.
Dr. M. Kollia for TEM and HTEM measurements.
Dr. P. Lampropoulou for XRD measurements.
Dr. H. Gasparyan for her suggestions, advice and inspiration throughout my
thesis.
To all my colleagues and friends from the Laboratory of Heterogeneous
Catalysis for their help, support and encouragement.
Finally, my special gratefulness to my family for their endless love and inspiration.
I also want to acknowledge to the following research programs for the financial
support:
“Production of Liquid Fuels (methanol – dimethyl ether) from renewable sources of CO2 and
H2 –A method for Hydrogen storage” Project of the Research Committee of the University
of Patras (project code C.611) funded by the HELBIO S.A, 2009–2010.

vi
The European Union (European Social Fund - ESF) and Greek national funds through the
Operational Program "Education and Lifelong Learning" of the National Strategic Reference
Framework (NSRF) - Research Funding Program: Thales. Investing in knowledge society
through the European Social Fund.
Siranush Akarmazyan
vii
ABSTRACT
Dimethylether is a non-toxic liquefied gas, which is projected to become one
of the fundamental chemical feedstock in the future. Dimethylether can be
produced from syngas via a two-step (indirect) process that involves synthesis of
methanol by hydrogenation of CO/CO2 over a copper based catalyst and
subsequent dehydration of methanol to DME over an acidic catalyst. Alternatively,
DME can be produced in an one-step (direct) process using a hybrid (bifunctional)
catalyst system that permits both methanol synthesis and dehydration in a single
process unit. In the present research work the production of DME has been studied
by applying both the indirect and direct processes. Firstly, the methanol synthesis
and methanol dehydration reactions involved in the indirect process have been
studied separately. Afterwards, these two reactions have been combined in the
direct DME production process by using a hybrid catalyst comprising a methanol
synthesis and a methanol dehydration component.
The methanol synthesis by CO2 hydrogenation has been investigated over
commercial and home-made CuO/ZnO/Al2O3 catalysts with the aim to identify
optimal experimental conditions (CO2:H2 ratio, flow rate, temperature) that could be
then used in the direct conversion of CO2/H2 mixtures into methanol/DME.
Obtained results reveal that the conversion of CO2 and the yields of reaction
products (CH3OH and CO) increase when the concentration of H2 in the feed and the
reaction contact time are increased. It was found that both Cu+/Cu0 species are
important for the conversion of CO2/H2, although the presence of Cuo seems to be
more important for selectivity/yield of methanol. The stability of the
CuO/ZnO/Al2O3 catalyst has been also investigated. It was observed that the main
reason for the deactivation of catalyst is the water produced via the methanol
synthesis and reverse water gas shift reactions. However, the catalytic activity and
products selectivity were recovered slowly to their original levels after applying a
regeneration procedure, indicating that deactivation by water is reversible.
The dehydration of methanol to dimethylether (DME) has been investigated
over a range of catalysts including alumina, silica-alumina and zeolites with
different physicochemical characteristics. The effects of temperature and the
presence of water vapour in the feed on catalytic performance have been studied in
detail. The reactivity of catalysts has been evaluated by determining the reaction
rates per gram of catalyst per acid site (total: Brönsted+Lewis) and per
Brönsted/Lewis mole ratio. In addition, the reaction mechanism has been
viii
investigated over a selected catalyst, with the use of transient-MS and in situ
DRIFTS techniques.
Results obtained for alumina catalysts show that the catalytic activity and
selectivity are determined to a large extent by the textural properties, degree of
crystallinity and total amount of acid sites of catalysts. In particular, the methanol
conversion curve shifts toward lower reaction temperatures with an increase of
specific surface area. However, the enhanced catalytic activity of high-SSA samples
cannot be attributed solely to the higher amount of surface acid sites, implying that
the reaction rate is determined to a large extent from other parameters, such as
textural properties and degree of crystallinity. Results of mechanistic studies
indicate that interaction of methanol with the Al2O3 surface results in the formation
of two kinds of methoxy groups of different adsorption strength. Evidence is
provided that DME evolution is associated with methoxy species that are weakly
adsorbed on the Al2O3 surface, whereas more strongly held species decompose to
yield surface formate and, eventually, CH4 and CO in the gas phase.
Results obtained over zeolite catalysts show that catalytic performance
depends on the topology of zeolites due to differences in micropore structure and
Si/Al ratio as well as on the number, strength and nature of active acid sites. The
activity of zeolite catalysts for the methanol dehydration to DME follows the order
ZSM-5 > Ferrierite > Mordenite ~ Beta ~ USY > H-Y. The strong Brönsted acid sites
of ZSM-5 zeolites with relatively high Si/Al ratio represent the most active sites in
methanol dehydration to DME reaction. However, the overall reactivity of the ZSM-5
zeolites is also affected by the balance of the Brönsted to Lewis acid sites. The
activity of Beta and USY zeolites is determined by both Lewis and Brönsted acid
sites. The moderate/low reactivity of Ferrierite, Mordenite and H-Y zeolite are
determined by the abundant Brönsted acid sites of relatively weak/moderate
strength.
The direct CO2 hydrogenation to methanol/DME has been investigated using
admixed catalysts comprising a methanol synthesis (commercial copper based
catalyst: CZA1) and a methanol dehydration component (different alumia/zeolite
catalysts: γ-Al2O3, ZSM-5, W/γ-Al2O3, USY(6), Ferrierite(10)). It has been revealed
that the conversion of CO2 is always lower than the corresponding equilibrium
values predicted by thermodynamics, indicating operation in the kinetic regime. The
nature of the methanol dehydration component of the admixed catalysts was found
to be important for both CO2 conversion and methanol dehydration. In particular,
DME selectivity/yield, depends strongly on the nature of acid sites (both Lewis and
ix
Brönsted) as well as the textural (meso/macro porosity) and topological properties
of methanol dehydration component of the admixed catalysts. The yield of DME
obtained at a temperature of 250oC decreases following the order CZA1/ZSM-5,
CZA1/USY(6) > CZA1/Ferrierite(10) > CZA1/ W/γ-Al2O3 >> CZA1/γ-Al2O3. The long-
term stability experiments conducted over selected bifunctional catalytic systems
revealed that the catalysts deactivate with time-on-stream, mainly due to water
produced via methanol synthesis, methanol dehydration and reverse water gas shift
reactions. In case of the CZA1/ZSM-5 admixed catalyst the catalytic activity and
products selectivity were almost recovered after regeneration indicating that
deactivation by water is reversible.
x
Curriculum Vitae
Name/Surname: Siranush Akarmazyan
Address: Solonos 25 Rio-Patras, Greece,
Email: [email protected],
Date of Birth: 16.03.1985
EDUCATION
2001-2006 Chemical Engineer of Chemical Technology of Organic Materials at the
State Engineering University of Armenia (Polytechnic) in the
Department of Chemical Technologies and Environmental
Engineering, with honors degree.
2005-2006 Diploma thesis with a subject: “Development of convenient methods
of synthesis of halogenalkenoic acids on the basis of the reaction of
liquid phase oxidation of halogenvinyl compounds”, (Supervisor
Associate Professor A. Mikaelyan).
2009-2013 PhD candidate at the Laboratory of Heterogeneous Catalysis of the
Department of Chemical Engineering, University of Patras, Greece.
2013-2014 Part work of PhD has been carried out in the Chemistry Department of
the same university. The subject of the thesis is “Simultaneous
production of methanol/dimethyl ether from synthesis gas,
(Supervisor Associate Professor D. Kondarides).
PARTICIPATION IN RESEARCH PROGRAMMES
Production of Liquid Fuels (methanol – dimethyl ether) from renewable sources of
CO2 and H2 – A method for Hydrogen storage” Project of the Research Committee of
the University of Patras (project code C.611) funded by the HELBIO S.A.
The European Union (European Social Fund - ESF) and Greek national funds
through the Operational Program "Education and Lifelong Learning" of the
National Strategic Reference Framework (NSRF) - Research Funding Program:
Thales. Investing in knowledge society through the European Social Fund.
CONFERENCES
S.S. Akarmazyan, Mikaelyan A.R., Asatryan N.L., Torosyan G.H., “Recent
Development of Convenient methods of synthesis of chloro carboxylic acids on the
xi
basis of liquid phase oxidation of substituted vinyl chlorides”, XVII International
Conference on Chemical Reactors, CHEMREACTOR-17, Athens-Crete Greece, May
15-19 2006 (poster presentation).
S.S. Akarmazyan, A.R. Mikaelyan, N.L. Asatryan, G.H. Torosyan, “ Utilization of
halogen-organic wastes via liquid phase oxidation of substituted vinyl chlorides”,
Workshop INTAS–South-Caucasus 2006 Scientific Cooperation and Collaborative
Call, Tbilisi, Georgia, April 19-21 2006 (poster presentation).
S.S. Akarmazyan, P. Panagiotopoulou, A. Kambolis, Ch. Papadopoulou, D.I.
Kondarides, “Methanol dehydration to dimethylether over acid catalysts”, 11th
Panhellenic Symposium Catalysis, Athens-Greece, October 22-23 2010. (oral
presentation).
S.S. Akarmazyan, Ch. Papadopoulou, D.I. Kondarides, “Methanol dehydration to
dimethylether over Al2O3-based catalysts”, Advances in Catalysis for biomass
valorization, CAT4BIO2012, Thessaloniki Greece, July 8-11, 2012. (oral
presentation).
S.S. Akarmazyan, S.A. Karakoulia, K.S. Triantafyllidis, D.I. Kondarides, “Effects of
the physicochemical characteristics of zeolites on their catalytic performance for the
methanol dehydration reaction to dimethylether (DME)”, 6th International FEZA
Conference, Germany, September 8-11, 2014 (poster presentation).
S.S. Akarmazyan, S.A. Karakoulia, K.S. Triantafyllidis, D.I. Kondarides, “Methanol
dehydration to dimethylether over zeolite catalysts” 13th Panhellenic Symposium
Catalysis, Palaio Agio Athanasio Pellas, Greece, October 16-18, 2014 (oral
presentation).
PUBLICATIONS S.S Akarmazyan, N. Asatryan, M. Avdalyan, A. Mikaelyan, “The synthesis of α-
chloro-carboxylic asides via catalytic liquid phase oxidation of chloro-vinylic
compounds by molecular oxygen”, The book of abstracts of annual scientific
conference of SEUA, volume 1, page 121-124, Yerevan 2005.
S. S. Akarmazyan, N. Asatryan, A. Mikaelyan, "Liquid phase catalytic (TiO2) oxidation
of 1,3-dichloro-2-butene", The book of abstracts of annual scientific conference of
SEUA, 2007.
Siranush S. Akarmazyan, Paraskevi Panagiotopoulou, Anastasios Kambolis,
Christina Papadopoulou, Dimitris I. Kondarides, “Methanol dehydration to
dimethylehter over Al2O3 catalysts”, Applied Catalysis B: Environmental, Volume 145,
Pages 136-148, 2014
S.S. Akarmazyan, S.A. Karakoulia, K.S. Triantafyllidis, D.I. Kondarides, “Effect of
zeolite‟s structure, acidity and crystal size on the methanol to dimethylether (DME)
reaction”, in preparation.

xii
KNOWLEDGE OF LANGUAGES
Armenian (native)
English
Greek
Russian
xiii
Table of Contents
List of Figures ------------------------------------------------------------------------------ xviii
List of Tables ------------------------------------------------------------------------------ xxix
List of Schemes --------------------------------------------------------------------------- xxx
CHAPTER 1
INTRODUCTION
1.1 Introduction -------------------------------------------------------------------------- 1
1.2 DME: Properties --------------------------------------------------------------------- 2
1.3 DME: Perspectives ------------------------------------------------------------------ 2
1.3.1 DME as an alternative transportation fuel ------------------------------- 2
1.3.2 DME as a fuel for gas turbines ------------------------------------------- 5
1.3.3 DME as a fuel for indoor uses -------------------------------------------- 6
1.3.4 DME as an alternative aerosol propellant ------------------------------- 6
1.3.5 DME as a hydrogen source and carrier ---------------------------------- 7
1.3.6 DME for direct Fuel cells (DDMEFCs) ------------------------------------- 7
1.3.7 DME as a chemical intermediate ----------------------------------------- 8
1.4 DME: Demand, manufacturing plants and production costs ----------------- 9
1.5 DME: Environment and safety issues ------------------------------------------------ 10
1.6 DME production ------------------------------------------------------------------------------ 11
1.6.1 Methanol synthesis from CO2/CO hydrogenation -------------------- 13
1.6.1.1 Cu/Zn/Al2O3 catalyst: The role of each component ---------- 16
1.6.1.2 Reduction of Cu/Zn/ Al2O3 catalyst --------------------------- 17
1.6.1.3 Deactivation of copper-based catalyst ------------------------- 17
1.6.1.4 Operational conditions, CO2 conversion and MeOH yield ---- 18
1.6.2 DME synthesis from methanol dehydration ------------------------ 20
1.6.3 Direct Methanol/DME synthesis from CO2 -------------------------- 25
1.7 Aim and motivation of the present study -------------------------------------- 28
1.8 Main issues and tasks of the present study ---------------------------------- 29
1.9 References --------------------------------------------------------------------------- 31
CHAPTER 2
THERMODYNAMIC ANALYSIS
2.1 Introduction -------------------------------------------------------------------------- 37
2.2 Thermodynamic evaluation of chemical equilibrium ----------------------- 38
2.3 CO2 hydrogenation to methanol ------------------------------------------------ 41
xiv
2.4 CO hydrogenation to methanol -------------------------------------------------- 45
2.5 The water gas shift reaction ----------------------------------------------------- 47
2.6 Methanol dehydration to DME -------------------------------------------------- 50
2.7 One step hydrogenation of CO2 to Methanol/DME -------------------------- 52
2.8 Conclusions -------------------------------------------------------------------------- 57
2.9 References ---------------------------------------------------------------------------- 58
CHAPTER 3
EXPERIMENTAL PART
3.1 Textural properties of materials (B.E.T and B.J.H methods) ------------- 59
3.1.1 Determination of specific surface area by the B.E.T. method --------- 60
3.1.2 Characterization of porous materials ------------------------------------ 62
3.1.2.1 Adsorption isotherms --------------------------------------------- 62
3.1.2.2 Capillary condensation and hysteresis loops ----------------- 63
3.1.2.3 Porosity ------------------------------------------------------------ 64
3.1.2.4 Pore size distribution (PSD) -------------------------------------- 66
3.1.3 Apparatus and experimental procedures --------------------------------- 67
3.2 X-ray diffraction (XRD) ------------------------------------------------------------ 68
3.2.1 X-rays: Properties and Production ---------------------------------------- 69
3.2.2 X-ray diffraction and Bragg’s equation ---------------------------------- 70
3.2.3 Experimental ---------------------------------------------------------------- 72
3.3 Electron microscopy (EM) -------------------------------------------------------- 72
3.3.1 Electron-matter interaction ------------------------------------------------- 73
3.3.2 Transmission electron microscopy (TEM) --------------------------------- 74
3.4 Inductive coupled plasma-atomic emission spectroscopy (ICP-AES) ---- 75
3.4.1 Absorption of electromagnetic radiation --------------------------------- 75
3.4.2 ICP-AES: Operation and sources ----------------------------------------- 77
3.5 Infrared spectroscopy (FTIR) ----------------------------------------------------- 79
3.5.1 Infrared absorption --------------------------------------------------------- 80
3.5.2 Molecular vibration ---------------------------------------------------------- 81
3.5.3 Experimental ---------------------------------------------------------------- 84
3.5.3.1 In situ DRIFT Spectra --------------------------------------------- 84
3.5.3.2 FT-IR spectroscopy combined with in-situ pyridine
adsorption ---------------------------------------------------------------- 87
3.6 Temperature-programmed experiments (TPD and TPR) coupled with
mass spectrometry ---------------------------------------------------------------------- 87
xv
3.6.1 Experimental ---------------------------------------------------------------- 88
3.6.1.1 TPD-MS and TPSR-MS of methanol ---------------------------- 89
3.6.1.2 TPD-MS of ammonia ---------------------------------------------- 90
3.7 Experimental setup for methanol dehydration reaction ----------------- 90
3.8 Experimental setup for CO2 hydrogenation to methanol/DME ----------- 94
3.9 References --------------------------------------------------------------------------- 97 CHAPTER 4
METHANOL DEHYDRATION TO DIMETHYL ETHER OVER Al2O3 CATALYSTS
4.1 Preparation of Al2O3 catalysts --------------------------------------------------- 99
Results and discussion
4.2 Physicochemical characterization of catalysts ------------------------------- 100
4.3 Catalytic performance tests ------------------------------------------------------ 110
4.4 Kinetic measurements ------------------------------------------------------------ 113
4.5 Effects of the presence of water vapour in the feed ------------------------- 116
4.6 Mechanistic studies ----------------------------------------------------------------- 117
4.6.1 Adsorption/desorption characteristics of water ------------------------ 118
4.6.2 Temperature programmed desorption of methanol ---------------------- 120
4.6.3 TPSR of methanol in the absence and in the presence of water ------- 125
4.7 Conclusions --------------------------------------------------------------------------- 129
4.8 References ---------------------------------------------------------------------------- 130
CHAPTER 5
METHANOL DEHYDRATION TO DIMETHYL ETHER OVER ZEOLITES
5.1 Introduction ------------------------------------------------------------------------- 132
5.1.1 Zeolites Structure, Composition and General Properties ---------------- 133
5.1.2 Acidity: The role of Si/Al ratio --------------------------------------------- 135
5.2 Zeolitic materials used in this study
5.2.1 Zeolites ZSM-5 --------------------------------------------------------------- 138
5.2.2 Zeolites Y -------------------------------------------------------------------- 140
5.2.3 Zeolite Beta ------------------------------------------------------------------ 142
5.2.4. Zeolites Mordenite and Ferrierite ---------------------------------------- 144
Results and disscusion
5.3 Physicochemical characterization of catalysts ------------------------------- 146
5.4 Catalytic performance tests and kinetic studies ---------------------------- 157
5.4.1 Zeolites ZSM-5 and silicalite ----------------------------------------------- 157
5.4.1.1 Catalytic performance in the absence of H2O in the feed ---- 157
xvi
5.4.1.2 Effects of the presence of H2O in the feed --------------------- 161
5.4.1.3 Long-term stability tests ----------------------------------------- 166
5.4.2 Zeolites Y -------------------------------------------------------------------- 168
5.4.2.1 Catalytic performance in the absence of H2O in the feed ---- 168
5.4.2.2 Effects of the presence of water in the feed and
long-term stability tests -------------------------------------------------- 170
5.4.3 Zeolites Beta ----------------------------------------------------------------- 171
5.4.3.1 Catalytic performance in the absence of H2O in the feed ---- 171
5.4.3.2 Effects of the presence of water in the feed and
long-term stability tests -------------------------------------------------- 174
5.4.4 Zeolites Mordenite and Ferrierite ------------------------------------------ 176
5.4.5 Alumina and silica-alumina (ASA) catalysts ---------------------------- 177
5.5 Comparison of various zeolitic catalysts -------------------------------------- 179
5.5.1 Correlation of reaction rates with acidity --------------------------------- 181
5.6 Conclusions -------------------------------------------------------------------------- 184
5.7 References ---------------------------------------------------------------------------- 186
CHAPTER 6 CO2 HYDROGENATION TO METHANOL/DME
6.1 CO2 Hydrogenation to methanol over copper-based catalysts ------------ 189
6.1.1 Preparation of copper-based catalysts ----------------------------------- 189
Results and discussion
6.1.2 Physicochemical characterization of catalysts --------------------------- 190
6.1.3 Catalytic performance tests and kinetic measurements --------------- 194
6.1.4 Effects of feed composition and flow rate on catalytic performance -- 197
6.2 CO2 Hydrogenation to methanol/DME over hybrid catalysts ------------- 202
6.2.1 Preparation of copper-based catalyst admixed with alumina and W/alumina
catalysts ------------------------------------------------------------------------------------ 202
Results and discussion
6.2.2 Catalytic performance tests over CZA1/Al4 and CZA1/WAl4 catalysts
6.2.2.1 CZA1/Al4 admixed catalyst (1:1 and 1:2 ratios) --------------------- 203
6.2.2.2 Effect of flow rate --------------------------------------------------------- 207
6.2.2.3 CZA1/WAl4 admixed catalyst (1:1 ratio) ------------------------------ 209
6.2.3 Catalytic performance tests over copper-based catalyst admixed with
different types of zeolite catalysts ------------------------------------------------------- 210
6.2.3.1 CZA1/FER(10) admixed catalyst (1:1ratio) --------------------------- 212
xvii
6.2.3.2 CZA1/USY(6) admixed catalyst (1:1ratio) ----------------------------- 213
6.2.3.3 CZA1/HZSM-5 (11.5) and CZA1/HZSM-5 (25) admixed
catalysts (1:1ratio) ---------------------------------------------------------------- 214
6.2.3.4 CZA1/HZSM-5 (11.5) (2:1ratio) ---------------------------------------- 217
6.4 Comparison of various admixed catalysts ------------------------------------ 219
6.5 Conclusions --------------------------------------------------------------------------- 224
6.6 References --------------------------------------------------------------------------- 226
CHAPTER 7
GENERAL CONCLUSIONS SUGGESTIONS FOR FUTURE WORK
7.1 Methanol dehydration to DME over Al2O3 catalysts ------------------------ 229
7.2 Methanol dehydration to DME over zeolite catalysts ---------------------- 230
7.3 CO2 Hydrogenation to methanol ------------------------------------------------- 232
7.4 Direct CO2 hydrogenation to methanol/DME --------------------------------- 232
7.5 Suggestions for future work ------------------------------------------------------ 233
xviii
List of Figures
Figure 1.1: Structure of DME.
Figure 1.2: Future methanol demand.
Figure 1.3: Process of sintering.
Figure 1.4: Different procedures for the combination of CuZnOZrO2 and H-ZSM5
catalysts.
Figure 1.5: Schematic representation of the synthesis of methanol/dimethyl ether
from CO2 and renewable resource.
Figure 2.1
0
,TRG dependence on temperature in CO2 hydrogenation to methanol
reaction.
Figure 2.2: 0
,TRH dependence on temperature in CO2 hydrogenation to methanol
reaction.
Figure 2.3: 0
,TRS dependence on temperature in CO2 hydrogenation to methanol
reaction.
Figure 2.4: Effect of temperature on equilibrium constant of the CO2 hydrogenation
to methanol reaction.
Figure 2.5: Effect of pressure and temperature on CO2 conversion in CO2
hydrogenation to methanol reaction. CO2:H2=1:3.
Figure 2.6: Effect of CO2:H2 ratio on CO2 conversion in methanol synthesis reaction.
P=30bar, T=160-280 oC.
Figure 2.7: Effect of CO2:H2 ratio on CH3OH selectivity in CO2 hydrogenation to
methanol reaction. P=30bar, T=160-280 oC.
Figure 2.8: Effect of CO2:H2 ratio on CO selectivity in CO2 hydrogenation to methanol
reaction. P=30bar, T=160-280 oC.
Figure 2.9: 0
,TRG dependence on temperature in CO hydrogenation to methanol
reaction.
Figure 2.10: 0
,TRH dependence on temperature in CO hydrogenation to methanol
reaction.
Figure 2.11: 0
,TRS dependence on temperature in CO hydrogenation to methanol
reaction.
Figure 2.12: Effect of temperature on equilibrium constant of CO hydrogenation to
methanol reaction.
Figure 2.13: Effect of pressure and temperature on CO conversion in methanol
synthesis reaction. CO: H2 =1:2.
xix
Figure 2.14:
0
,TRG dependence on temperature in water gas shift reaction.
Figure 2.15: 0
,TRH dependence on temperature in water gas shift reaction.
Figure 2.16: 0
,TRS dependence on temperature in water gas shift reaction.
Figure 2.17: Effect of temperature on equilibrium constant of water gas shift reaction.
Figure 2.18: Effect of temperature on CO conversion in water gas shift reaction.
Figure 2.19: 0
,TRG dependence on temperature in methanol dehydration to DME
reaction.
Figure 2.20: 0
,TRH dependence on temperature in methanol dehydration to DME
reaction.
Figure 2.21: 0
,TRS dependence on temperature in methanol dehydration to DME
reaction.
Figure 2.22: Effect of temperature on equilibrium constant of methanol dehydration
to DME reaction.
Figure 2.23: Equilibrium conversion of methanol as a function of temperature in (a)
the absence and (b) in the presence of 10% H2O in the feed. P=1bar,
T=150-500 oC.
Figure 2.24: 0
,TRG dependence on temperature in CO2 hydrogenation to
methanol/DME reaction.
Figure 2.25: 0
,TRH dependence on temperature in CO2 hydrogenation to
methanol/DME reaction.
Figure 2.26: 0
,TRS dependence on temperature in CO2 hydrogenation to
methanol/DME reaction.
Figure 2.27: Effect of temperature on equilibrium constant of CO2 hydrogenation to
methanol/DME reaction.
Figure 2.28: Effect of pressure and temperature on CO2 conversion in CO2
hydrogenation to methanol/DME reaction. CO2:H2=1:3.
Figure 2.29: Effect of CO2:H2 ratio on CO2 conversion in one step methanol/DME
synthesis reaction. P=30 bar, T=160-280oC.
Figure 2.30: Effect of CO2:H2 ratio on methanol selectivity in one step methanol/DME
synthesis reaction. P=30bar, T=160-280oC.
Figure 2.31:
Effect of CO2:H2 ratio on DME selectivity in one step methanol/DME
synthesis reaction. P=30 bar, T=160-280oC.
Figure 2.32: Effect of CO2:H2 ratio on CO selectivity in one step methanol/DME
synthesis reaction. P=30 bar, T=160-280oC.
Figure 2.33: Equilibrium conversion of CO2 as a function of temperature in (a)
methanol synthesis and (b) methanol/DME synthesis. P=30bar,
xx
CO2:H2=1:3, T=160-280oC.
Figure 2.34: Selectivities to reaction products as functions of temperature in (a)
methanol synthesis and (b) methanol/DME synthesis. P=30bar,
CO2:H2=1:3, T=160-280oC.
Figure 3.1: Physical adsorption scheme.
Figure 3.2: Gas adsorption process, formation of monolayer.
Figure 3.3: BET plot.
Figure 3.4: (A) Gas adsorption process and (B) formation of multilayers.
Figure 3.5: IUPAC classification of adsorption isotherms.
Figure 3.6: IUPAC classification of hysteresis loops.
Figure 3.7: Schematic cross-section of a porous material.
Figure 3.8: Types of pores according to the pore shape: (a) cylindrical, (b) slit-shape,
(c) cone-shape and (d) ink bottle.
Figure 3.9: A unit cell from a three dimensional lattice.
Figure 3.10: X-ray region as part of electromagnetic spectrum.
Figure 3.11: Schematic diagram of an X-ray tube.
Figure 3.12: (A) Constructive and (B) Destructive interferences between two waves.
Figure 3.13: Schematic figure used to derive the Bragg equation.
Figure 3.14: Electron-specimen interaction.
Figure 3.15: Schematic illustration of basic components of TEM.
Figure 3.16: Bohr model of an atom. As energy is absorbed by an atom, an electron
jumps to an orbital with a higher energy level. The atom may decay to a
lower energy state by emitting a photon of energy hν.
Figure 3.17: Energy level diagram depicting energy transitions where (a) and (b)
represent excitation, (c) is ionization, (d) is ionization/excitation, (e) is
ion emission, and (f), (g) and (h) are atom emission.
Figure 3.18: General steps involved in the analysis of aqueous samples by ICP-AES.
Figure 3.19: The scheme of an ICP torch.
Figure 3.20: IR region as a part of electromagnetic radiation spectrum.
Figure 3.21: Change in dipole moment of a heteronuclear diatomic molecule.
Figure 3.22: Different types of vibrational modes.
Figure 3.23: Optical diagram of a Michelson interferometer.
Figure 3.24: Nicolet 6700 optical layout.
Figure 3.25: Optical layout of the Diffucse Reflection Accessory (DRIFT).
Figure 3.26: Diffuse Reflectance cell.
Figure 3.27: Schematic representation of the system used for the temperature
programmed experiments.
Figure 3.28: Schematic representation of the experimental setup used for the
catalytic performance tests for methanol dehydration reaction.
xxi
Figure 3.29: Schematic representation of the fixed bed reactor.
Figure 3.30 Schematic illustration of the experimental setup used for the catalytic
performance tests for CO2 hydrogenation to methanol/DME reaction.
Figure 4.1: The N2 adsorption/desorption isotherms of the studied Al2O3 samples.
The hollow and solid symbols denote N2 adsorption and desorption
isotherms, respectively.
Figure 4.2: Pore size distribution of the studied Al2O3 catalysts.
Figure 4.3: X-ray diffraction (XRD) patterns obtained over the indicated Al2O3
catalysts Symbols correspond to the following JPCS data: ▲ 10-0425 γ-
Al2O3, ● 04-0877 δ-Al2O3, + 04-0880 χ-Al2O3 ○ 21-1307 AlO(OH).
Figure 4.4: TEM images obtained over (a) Al4, (b) Al5, (c) Al6 and (d) SG1 samples.
Figure 4.5: HRTEM images of (a) Al6 and (b) SG1 samples.
Figure 4.6: NH3-TPD profiles obtained over the indicated Al2O3 catalysts.
Figure 4.7: Amount of ammonia desorbed in NH3-TPD experiments as a function of
the specific surface area of Al2O3 catalysts.
Figure 4.8: Conversion of methanol as a function of reaction temperature obtained
over (A) commericial Al1, Al2, Al3, Al4, Al5 and (B) Al6, SG1, SG2
catalysts.
Figure 4.9: Selectivities to reaction products as functions of reaction temperature
obtained over the Al4 sample.
Figure 4.10: Arrhenius plots of specific reaction rates obtained over the studied Al2O3
samples under differential reaction conditions, expressed (A) per gram of
catalyst and (B) per mol of surface acid sites.
Figure 4.11: (A) Conversion of methanol as a function of reaction temperature
obtained over Al2O3 catalyst (Al4 sample) (a) in the absence and (b) in the
presence of 10% H2O in the feed. (B) Effect of addition of 10% H2O in the
feed on the conversion of methanol at T=215oC.
Figure 4.12: DRIFT spectra obtained over the Al2O3 (Al4) catalyst following interaction
with 1.5%H2O at 25 oC for 30 minutes and subsequent stepwise heating
at the indicated temperatures under He flow.
Figure 4.13A: TPD pattern obtained over the Al2O3 (Al4) catalyst following interaction
with 0.5% CH3OH (in He) at 25 oC for 30 min and subsequent linear
heating (β= 15 oC min-1) under He flow.
Figure 4.13B: DRIFT spectra obtained over the Al2O3 (Al4) catalyst following interaction
with 0.5% CH3OH (in He) at 25 oC for 30 minutes and subsequent
stepwise heating at the indicated temperatures under He flow.
Figure 4.14A: TPSR pattern obtained over the Al2O3 (Al4) catalyst following interaction
with 1.5% CH3OH (in He) at 25 oC for 30 min and subsequent linear
xxii
heating (β= 15 oC min-1) under the same gas mixture flow.
Figure 4.14: DRIFT spectra obtained over the Al2O3 (Al4) catalyst following interaction
with (B) 0.5% CH3OH (in He) or (C) 0.5% CH3OH+1.5%H2O (in He) at 25
oC for 30 min and subsequent stepwise heating at the indicated
temperatures under the same reaction mixture flow.
Figure 5.1: The three components usually presented in zeolite composition.
Figure 5.2: The porous structure of zeolitic materials and the molecular diameter of
some hydrocarbons.
Figure 5.3: Classification of zeolite shape selectivity.
Figure 5.4: Formation of Lewis acid sites.
Figure 5.5: (A) Primitive unit cell of siliceous MFI; 12 T sites: yellow: Si or Al atoms,
red: O atoms. (B) Schematic representation of the ZSM-5 „„pipe system‟‟
viewed along the (010) direction. Straight channels composed of 10MR
parallel to the b axis and intersecting sinusoidal channels parallel to the
a axis.
Figure 5.6: (A) Primitive unit cell of FAU zeolite. Due to the high symmetry only one
T site (yellow, T = Si or Al) and four inequivalent oxygen atoms (red,
O).The ball and stick model highlights the hexagonal prism and (B)
Schematic representation of the Faujasite structure FAU zeolite The
corners denote the position of T sites (T = Si or Al) and the lines the
bridging oxygen atoms. Different cation positions are indicated by
Roman numerals whereas oxygen positions are indicated by Arabic
numerals. Four different positions of the protons covalently bound of the
oxygen around an Al atom.
Figure 5.7: Stereographic drawings and perspectives views of zeolite Beta viewed
along the [1 0 0] and [0 0 1] axes. The 12-membered ring free pore
apertures of straight and zig-zag channels are also shown for a good
visualization of its structure. In the stereographic drawings the spheres
represent the oxygen atoms and the tetrahedrally coordinated Si/Al
atoms. Perspective views show the pore network of zeolite Beta
containing straight and zigzag channels. The cylinders represent the
channels of the zeolite Beta.
Figure 5.8: (A) Primitive unit cell (dashed frame) and conventional orthorhombic cell
(solid frame) on the (0 0 1) projection of siliceous mordenite. Four
inequivalent T sites (yellow, T = Si or Al) and ten inequivalent oxygen
atoms (red, O). (B) Schematic representation of the mordenite “pipe
system”.
Figure 5.9: Structure of ferrierite in the [0 0 1] and [0 1 0] directions. The openings
of the 10-MR and 8-MR pores are colored.
xxiii
Figure 5.10: Representative XRD patterns of zeolite samples.
Figure 5.11: Representative N2 adsorption-desorption isotherms of catalysts.
Figure 5.12: Amount of Brönsted acid sites of (A) ZSM-5, Beta, Mordenite and
Ferrierite zeolites and (B) Zeolite-Y, γ-Al2O3 and silica-alumina catalysts
as determined by FT-IR measurements of in situ sorbed pyridine at
increasing temperature.
Figure 5.13: Amount of Lewis acid sites of (A) ZSM-5, Beta, Mordenite and Ferrierite
zeolites and (B) Zeolite-Y, γ-Al2O3 and silica-alumina catalysts as
determined by FT-IR measurements of in situ sorbed pyridine at
increasing temperature.
Figure 5.14: Conversion of methanol (XMeOH) and selectivities to reaction products (Si)
as functions of reaction temperature obtained over (A) ZSM-5(11.5), (B)
ZSM-5 (25), (C) ZSM-5(40) and (D) Silicalite zeolites. Experimental
conditions: feed composition: 30% CH3OH (in He); mass of catalyst: 100
mg; total flow rate: 30 cm3 min-1.
Figure 5.15: (A) Conversion of methanol, (B) selectivity to DME, (C) reaction rates
expressed per gram of catalyst and (D) reaction rate expressed per total
acid sites of catalysts obtained over the ZSM-5 and silicalite catalysts.
Experimental conditions: feed composition: 30% CH3OH (in He); mass of
catalyst: 100 mg; total flow rate: 30 cm3 min-1.
Figure 5.16: Arrhenius plots of reaction rates obtained over the ZSM-5 and silicalite
catalysts (A) expressed per total Brönsted acid sites and (B) expressed
per total Lewis acid sites. Experimental conditions: feed composition:
30% CH3OH (in He); mass of catalyst: 100 mg; total flow rate: 30 cm3
min-1.
Figure 5.17: Conversion of methanol (XMeOH) and selectivities to reaction products (Si)
as functions of reaction temperature obtained over (A) ZSM-5(11.5), (B)
ZSM-5 (25), (C) ZSM-5(40) and (D) Silicalite zeolites in the presence of
water vapor in the feed. Experimental conditions: feed composition: 30%
CH3OH + 10% H2O (in He); mass of catalyst: 100 mg; total flow rate: 30
cm3 min-1.
Figure 5.18: Conversion of methanol (XMeOH) and selectivity to DME as function of
reaction temperature obtained over (A) ZSM-5(11.5), (B) ZSM-5(25), (C)
ZSM-5(40) and (D) silicalite zeolites, in the absence (closed symbols,
solid lines) and in the presence (open symbols, dashed lines) of 10%H2O
in the feed. The equilibrium conversion curves for methanol dehydration
to DME are shown, for comparison. Experimental conditions: mass of
catalyst: 100mg; total flow rate: 30 cm3 min-1.
Figure 5.19: (A) Conversion of methanol, (B) selectivity to DME, and (C) reaction rates
xxiv
expressed per gram of catalyst and (D) reaction rate expressed per total
acid sites of catalysts obtained over the ZSM-5 and silicalite catalysts.
Experimental conditions: feed composition: 30% CH3OH + 10% H2O (in
He); mass of catalyst: 100 mg; total flow rate: 30 cm3 min-1.
Figure 5.20: Arrhenius plots of reaction rates obtained over the ZSM-5 and silicalite
catalysts (A) expressed per total Brönsted acid sites and (B) expressed
per total Lewis acid sites. Experimental conditions: feed composition:
30% CH3OH+10% (in He); mass of catalyst: 100 mg; flow rate: 30cm3
min-1.
Figure 5.21: Conversion of methanol (XMeOH) as a function of time-on-stream in the
absence and in the presence of water vapour in the feed over ZSM-5 and
silicalite zeolites. Experimental conditions: feed composition: 30%
CH3OH (+ 10% H2O) in He; mass of catalyst: 100 mg; total flow rate: 30
cm3 min-1. Dashed vertical lines indicate shutting down of the system
overnight, where the catalyst was kept at room temperature under He
flow.
Figure 5.22: (A) Conversion of methanol, (B) selectivity to DME, reaction rates
expressed (C) per gram of catalyst and (D) per total acid sites over the Y
and USY catalysts. Experimental conditions: feed composition: 30%
CH3OH (in He); mass of catalyst: 100mg; total flow rate: 30 cm3 min-1.
Figure 5.23: Results of catalytic performance tests, kinetic measurements and long-
term stability tests obtained over the USY(6) zeolite catalyst. (A) Effects of
the presence of H2O in the feed on the conversion of methanol and
selectivity to DME. (B) Arrhenius plot of reaction rates (expressed per
gram of catalyst) in the absence and in the presence of water vapour in
the feed. (C) Conversion of methanol as a function of time-on-stream in
the absence and in the presence of water vapor in the feed. Dashed
vertical lines in (C) indicate shutting down of the system overnight.
Experimental conditions: feed composition: 30% CH3OH (+ 10% H2O) in
He; mass of catalyst: 100 mg; total flow rate: 30 cm3 min-1.
Figure 5.24: Conversion of methanol (XMeOH) and selectivities to reaction products (Si)
as functions of reaction temperature obtained over Beta zeolite catalysts:
(A) Beta (12.5); (B) Beta(37.5) and (C) Beta (150). The equilibrium
conversion curve for methanol dehydration to DME is shown with
dashed line. Experimental conditions: feed composition: 30% CH3OH (in
He); mass of catalyst: 100 mg; total flow rate: 30 cm3 min-1.
Figure 5.25: (A) Conversion of methanol, (B) selectivity to DME, (C) reaction rates
expressed per gram of catalysts and (D) reaction rates expressed per
total acid site obtained over the Beta zeolites. Experimental conditions:
xxv
feed composition: 30% CH3OH (in He); mass of catalyst: 100 mg; total
flow rate: 30 cm3 min-1.
Figure 5.26: (A) Effects of the presence of H2O in the feed on the conversion of
methanol and selectivity to DME obtained over the Beta (37.5) zeolite. (B)
Arrhenius plot of reaction rates obtained in the absence and in the
presence of H2O. Experimental conditions: feed composition: 30%
CH3OH (+ 10% H2O) in He; mass of catalyst: 100 mg; total flow rate:
30cm3 min-1.
Figure 5.27: Conversion of methanol (XMeOH) as a function of time-on-stream in the
absence and in the presence of water vapor in the feed over Beta zeolite
catalysts at T=230 oC.Experimental conditions: feed composition: 30%
CH3OH (+ 10% H2O) in He; mass of catalyst: 100 mg; total flow rate: 30
cm3 min-1. Dashed vertical lines indicate shutting down of the system
overnight, where the catalyst was kept at room temperature under He
flow.
Figure 5.28: (A) Conversion of methanol, (B) selectivity to DME and (C) reaction rates
obtained over the Mordenite(10) and Ferrierite(10) zeolite catalysts.
Experimental conditions: Feed composition: 30% CH3OH (in He), mass of
catalyst: 100 mg; total flow rate: 30 cm3 min-1.
Figure 5.29: (A) Conversion of methanol, (B) selectivity to DME, (C) reaction rates
expressed per gram of catalysts and (D) reaction rate expressed per total
acid sites of catalysts obtained over γ-Al2O3, ASA(0.5) and ASA(35)
catalysts. Experimental conditions: feed composition: 30% CH3OH (+
10% H2O for C and D) in He; mass of catalyst: 100 mg; total flow rate: 30
cm3 min-1.
Figure 5.30: (A) Conversion of methanol, (B) selectivity to DME, (C) reaction rates
expressed per gram of catalysts and (D) reaction rates expressed per
total acid sites obtained over the zeolites ZSM-5(40), ZSM-5 (11.5),
Ferrierite(10), Mordenite(10), Beta(12.5), USY(6) and HY(2.55).
Experimental conditions: feed composition: 30% CH3OH (in He); mass of
catalyst: 100 mg; total flow rate: 30cm3 min-1.
Figure 5.31: Reaction rates expressed per gram of catalysts versus (A, B) total
number of acid sites and (C,D) Brönsted to Lewis acid sites mole ratio
(B/L) for all catalysts tests at 260oC. Experimental conditions: feed
composition: 30% CH3OH (in He); mass of catalyst: 100 mg; total flow
rate: 30 cm3 min-1.
Figure 6.1: The N2 adsorption/desorption isotherms of fresh, reduced and used
CZA1 and CZA2 catalysts.
Figure 6.2: Pore size distribution of fresh, reduced and used catalysts.
xxvi
Figure 6.3: X-ray diffraction (XRD) patterns obtained for CZA1 catalyst: a) fresh, b)
reduced, c) used and for CZA2 catalyst: d) fresh, e) reduced, e) used.
Figure 6.4: Conversion of carbon dioxide (XCO2), selectivities and yields of CO and
methanol as functions of reaction temperature obtained over CZA1
catalyst (A), (C) and CZA2 catalyst (B), (D). Experimental conditions:
feed composition CO2:H2=1:6; flow rate 60ml/min; P=30bar;
W/F=0.0083 g/ml min-1; T=170-240oC.
Figure 6.5 Arrhenius plots of specific reaction rates obtained over the studied CZA
samples under differential reaction conditions.
Figure 6.6: The effects of feed composition on (A) conversion of carbon dioxide (XCO2),
(B) selectivity to methanol (SMeOH) and (C) selectivity to CO (SCO) obtained
over CZA1 catalyst. Experimental conditions: flow rate 60ml/min;
W/F=0.0083 g min/ml; P=30bar; T=180-240oC.
Figure 6.7: The effects of reaction flow rate on (A) conversion of carbon dioxide
(XCO2), (B) selectivity to methanol (SMeOH), (C) yield of methanol (YMeOH), (D)
selectivity to CO (SCO) and (E) yield of CO (YCO) obtained over CZA1
catalyst. Experimental conditions: feed composition CO2:H2=1:6,
P=30bar, catalyst amount-0.5g, T=180-250oC.
Figure 6.8: (A) Conversion of carbon dioxide (XCO2), selectivities to CO, methanol
and (B) conversion of carbon dioxide (XCO2) and yields of CO and
methanol as fuctions of reaction temperature obtained over CZA1
catalyst. Experimental conditions: feed composition CO2:H2=1:6, flow
rate 30ml/min, P=30bar, W/F=0.016 g min/ml, T=180-240oC.
Figure 6.9: The conversion of carbon dioxide (XCO2) and yields of CO and methanol
(YCO, YMeOH) obtained after 1, 9, 25, 46 hours on stream and regeneration
(after dashed line) over the CZA1 catalyst. Experimental conditions:
flow rate 30ml/min, feed composition CO2:H2=1:6, W/F=0.016 g min/ml,
P=30bar, T=250oC. Regeneration conditions: 100ml/min H2 flow, at
200oC, for 1 hour, at atmospheric pressure.
Figure 6.10: (A) Conversion of carbon dioxide (XCO2) and selectivities to CO ( SCO),
methanol (SMeOH), DME (SDME) and oxygenates (SMeOH+DME); (B) yields of
CO (YCO), methanol (YMeOH), DME (YDME) and oxygenates (YMeOH+DME) as
functions of reaction temperature. Catalyst: CZA1/Al4 (ratio 1:1).
Experimental conditions: flow rate 60ml/min, W/F=0.0083 g min/ml
(based on the amount of CZA1 catalyst), CO2:H2=1:6, P=30bar, T=170-
240oC.
Figure 6.11: (A) Conversion of methanol as a function of reaction temperature under
1bar and 10bar pressure. Experimental conditions: flow rate
180ml/min, amount of catalyst: 2g, T=150-400oC.
xxvii
Figure 6.12: (A) Conversion of carbon dioxide (XCO2), selectivities to CO (Sco),
methanol ( SMeOH), DME (SDME) and oxygenates (SMeOH+DME); (B) yields of
CO (YCO), methanol (YMeOH), DME (YDME) and oxygenates (YMeOH+DME) as
functions of reaction temperature obtained over the CZA1/Al4 (ratio=1:2)
catalyst. Experimental conditions: flow rate 60ml/min, W/F=0.0083 g
min/ml (based on the amount of CZA1 catalyst), CO2:H2=1:6, P=30bar,
T=170-250oC.
Figure 6.13: The effects of reaction flow rate on (A) conversion of carbon dioxide
(XCO2), (B) yield of methanol (YMeOH), (C) yield of DME (YDME) and (D) yield
of CO (YCO) obtained over the CZA1/Al4 catalyst. Experimental
conditions: feed composition CO2:H2=1:6, P=30bar, T=180-250oC.
Figure 6.14: (A) Conversion of carbon dioxide (XCO2), selectivities to CO (SCO),
methanol (SMeOH), DME (SDME) and (B) yields of CO (YCO), methanol
(YMeOH), DME (YDME) as functions of reaction temperature obtained over
CZA1/Al4 (ratio=1:2) catalyst. Experimental conditions: flow rate
30ml/min, W/F=0.016 (based on the amount of CZA1 catalyst),
CO2:H2=1:6, P=30bar, T=220-250oC.
Figure 6.15: (A) Conversion of carbon dioxide (XCO2), selectivities to CO (SCO),
methanol (SMeOH), DME (SDME) and oxygenates (SMeOH+DME); (B) yields of
CO (YCO), methanol (YMeOH), DME (YDME) and oxygenates (YMeOH+DME) as
functions of reaction temperature obtained over CZA1/WAl4 (1:1)
catalyst. Experimental conditions: flow rate 30ml/min, W/F=0.016
(based on the amount of CZA1 catalyst), CO2:H2=1:6, P=30 bar, T=180-
250oC.
Figure 6.16: (A) Conversion of carbon dioxide (XCO2), selectivity to CO (Sco), methanol
(SMeOH), DME (SDME) and oxygenates (SMeOH+DME); (B) yield of CO (YCO),
methanol (YMeOH), DME (YDME) and oxygenates (YMeOH+DME) as functions of
reaction temperature obtained over CZA1/FER(10) (1:1) admixed
catalyst. Experimental conditions: flow rate 30ml/min, W/F=0.016
(based on the amount of CZA1catalyst) CO2:H2=1:6, P=30bar, T=180-
250oC.
Figure 6.17: (A) Conversion of carbon dioxide (XCO2), selectivity to CO (SCO), methanol
(SMeOH), DME (SDME), oxygenates (SMeOH+DME) and (B) yield of CO (YCO),
methanol (YMeOH), DME (YDME) and oxygenates (YMeOH+DME) as functions of
reaction temperature obtained over CZA1/USY(6) (1:1) admixed
catalyst. Reaction conditions: flow rate 30ml/min, W/F=0.016 (based on
the amount of CZA1 catalyst) CO2:H2=1:6, P=30bar, T=180-250oC.
Figure 6.18: Conversion of carbon dioxide (XCO2) and yields of products ( YCO, YMeOH,
YDME, Yoxygenates ) obtained after 1, 9 or 25 hours on stream and after
xxviii
regeneration (data presented after the dashed line) of the CZA1/USY(6)
(1:1) catalyst. Reaction conditions: flow rate 30ml/min, CO2:H2=1:6,
P=30bar, T=250oC. Regeneration conditions: 100ml/min H2 flow, at
200oC, for 1 hour, at atmospheric pressure.
Figure 6.19: (A) Conversion of carbon dioxide (XCO2) and selectivities to reaction
products (Si) as functions of reaction temperature obtained over (A)
CZA1/HZSM- 5(11.5) and (B) CZA1/HZSM-5 (25) catalysts; yields of
reaction products (Yi) as functions of reaction temperature obtained
over (C) CZA1/HZSM-5 (11.5) and (D) CZA1/HZSM-5 (25) catalysts.
Experimental conditions: flow rate 30ml/min, W/F=0.016 (based on the
amount of CZA1 catalyst, CO2:H2=1:6, P=30bar, T=180-250oC.
Figure 6.20: Conversion of carbon dioxide (XCO2) and yields of products (YCO, YMeOH,
YDME, Yoxygenates), obtained after 1, 9 or 25 hours on stream and after
regeneration (data presented after the dashed lines) over A)
CZA1/HZSM-5 (11.5) and B) CZA1/HZSM-5 (25) (1:1) catalysts.
Experimental conditions: flow rate 30ml/min, feed composition
CO2:H2=1:6, P=30bar, T=250oC. Regeneration conditions: 100ml/min H2
flow, at 200oC, for 1 hour, at atmospheric pressure.
Figure 6.21: (A) Conversion of carbon dioxide (XCO2), selectivity to CO (SCO), methanol
(SMeOH), DME (SDME), oxygenates (SMeOH+DME) and (B) yield of CO (YCO),
methanol (YMeOH), DME (YDME) and oxygenates (YMeOH+DME) as functions of
reaction temperature obtained over CZA1/HZSM-5(11.5) (2:1) hybrid
catalyst. Experimental conditions: flow rate 30ml/min, W/F=0.016
(based on the amount of CZA1 catalyst, CO2:H2=1:6, P=30bar, T=180-
250oC.
Figure 6.22: Conversion of carbon dioxide (XCO2) and yields of products ( YCO, YMeOH,
YDME, Yoxygenates) obtained after 1 or 9 hours on stream and after
regeneration (data presented after the dashed line) over the CZA1
/HZSM-5(11.5) (2:1) catalyst. Experimental conditions: flow rate
30ml/min, feed composition CO2:H2=1:6, P=30bar, T=250oC.
Regeneration conditions: 100ml/min H2 flow, at 200oC, for 1 hour, at
atmospheric pressure.
Figure 6.23: (A) Conversion of carbon dioxide (XCO2), (B) yield of methanol (YMeOH), (C)
DME (YDME), (D) oxygenates (YMeOH+DME) and (E) CO (YCO) as functions of
reaction temperature obtained over CZA1/HZSM-5 (11.5),
CZA1/HZSM-5 (25), CZA1/FER (10), CZA1/USY (6), CZA1 /WAl4 (ratio
1:1) and CZA1/Al4 (ratio1:2) admixed catalysts. Experimental
conditions: flow rate 30ml/min, W/F=0.016 (based on the amount of
CZA1 catalyst), CO2:H2=1:6, P=30bar, T=180-250oC.
xxix
List of Tables
Table 1.1: Properties of DME and other fuels.
Table 1.2: Global warming potentials of DME, CO2, CH4, N2O.
Table 1.3: Catalysts and reaction conditions used in CO2 hydrogenation to
methanol reaction.
Table 1.4: Catalysts and operating conditions employed in methanol dehydration
reaction.
Table 1.5: Catalysts and operating conditions for DME production by CO2
hydrogenation.
Table 2.1
Heat capacity constants, standard molar Gibbs energies and enthalpies
of formation for vatious substances of interest at 298K and 1 atm.
Table 4.1: Specific surface area (SSA), pore volume and pore size of the studied
catalysts.
Table 4.2: The average particle size of fresh and used catalysts.
Table 4.3: The ammonia uptake of the studied catalysts.
Table 4.4: Apparent activation energy for the methanol dehydration reaction.
Table 5.1: Chemical, textural, topological characteristics of Y-zeolites.
Table 5.2: Chemical, textural, topological characteristics of HZSM-5 zeolites.
Table 5.3: Chemical, textural, topological characteristics of Beta, Mordenite and
Ferrierite zeolites.
Table 5.4: Chemical, textural, topological characteristics of alumina and silica-
alumina catalysts.
Table 5.5: Acidity of investigated catalysts.
Table 6.1: Copper based catalysts studied for the methanol synthesis reaction.
Table 6.2: Specific surface area (SSA), pore volume, pore size and particle size of
fresh, reduced and used CZA1 and CZA2 catalysts.
Table 6.3: Copper based catalyst admixed with γ-alumina and WO3-γ-alumina
catalysts.
Table 6.4: List of copper-based catalyst admixed with zeolitic materials.
Table 6.5: Textural characteristics and acidity of the zeolite catalysts.
xxx
List of Schemes
Scheme 1.1: The proposed reaction path for methanol synthesis through CO
hydrogenation.
Scheme 1.2: The proposed reaction path for methanol synthesis through CO2
hydrogenation.
Scheme 1.3: The consecutive reactions occurring during methanol dehydration
process.
Scheme 1.4: Bimolecular mechanism of methanol dehydration on an acid-base pair.
Scheme 1.5: Mechanism proposed for DME formation (a) stepwise and (b) concerted.
Scheme 5.1: (A) Basic unit of neutral zeolite (only silicon/oxygen atoms) and (B) Basic
unit of strong acidic zeolite (alumina/silicon/oxygen atoms ion
exchanged with proton).
Scheme: 5.2 Basic units of Brønsted and Lewis acid sites.

xxxi
1
CHAPTER 1
1.1 Introduction
The energy generation, distribution, and consumption must be closely
balanced for an ideal energy infrastructure. However, the world energy consumption
is steadily increasing for a variety of reasons, which include enhancement in quality
of life, population increase, industrialization, rapid economic growth of developing
countries, increased transportation of people and goods, etc. There are many types
of fuel available worldwide, the demand for which strongly depends on application
and use, location and regional resources, cost, purity and environmental impact
factors, global and regional policies, etc. [1]
The use of fossil fuels such as coal, oil or natural gas (i.e., hydrocarbons) is
essential for modern life. However, when fossil fuels are burnt they produce carbon
dioxide (CO2) and water (H2O) as combustion products. It is a great challenge to
reverse this process and produce hydrocarbon fuels from CO2. Nature, in its process
of photosynthesis, recycles CO2 and water into new plant life using the Sun‟s
energy. Fermentation and other processes can convert plant life into biofuels and
other products. However, natural formation of new fossil fuels takes a very long
time, making them non-renewable on the human timescale [2].
As we continue to burn hydrocarbon reserves (oil, natural gas, coal) and
generate energy at an alarming rate, diminishing resources and sharp increase of
prices will inevitably lead to supplement or replacement of fossil fuels by feasible
alternatives [1, 2]. Thus, it is crucial for mankind of our time to elaborate new
efficient approaches to liberate itself from its dependency on fossil fuel resources, to
develop alternative fuel sources and, concomitantly, to mitigate global warming
caused by the emissions of carbon dioxide.
Alternative eco-friendly fuels (synthetic natural gas, alcohols, esters, ethers,
hydrogen, Fischer-Tropsch fuels, biofuels) have attracted significant attention in
2
recent years due to their good properties such as being renewable, sustainable and
environmentally friendly. However, each selected fuel candidate must be evaluated
according to their different economic, technological, environmental and versatility
aspects. Among these, dimethyl ether (DME) is considered as a promising eco-
friendly fuel and is projected to become one of the fundamental chemical feedstock
in the 21st century.
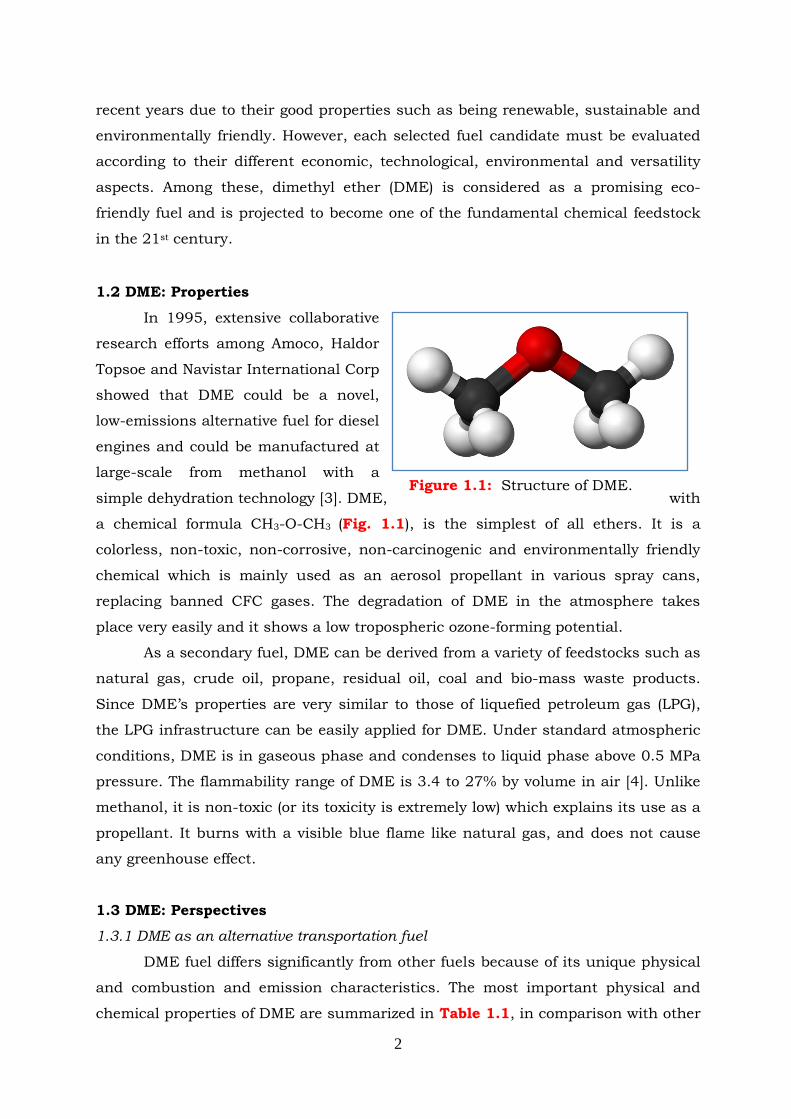
1.2 DME: Properties
In 1995, extensive collaborative
research efforts among Amoco, Haldor
Topsoe and Navistar International Corp
showed that DME could be a novel,
low-emissions alternative fuel for diesel
engines and could be manufactured at
large-scale from methanol with a
simple dehydration technology [3]. DME, with
a chemical formula CH3-O-CH3 (Fig. 1.1), is the simplest of all ethers. It is a
colorless, non-toxic, non-corrosive, non-carcinogenic and environmentally friendly
chemical which is mainly used as an aerosol propellant in various spray cans,
replacing banned CFC gases. The degradation of DME in the atmosphere takes
place very easily and it shows a low tropospheric ozone-forming potential.
As a secondary fuel, DME can be derived from a variety of feedstocks such as
natural gas, crude oil, propane, residual oil, coal and bio-mass waste products.
Since DME‟s properties are very similar to those of liquefied petroleum gas (LPG),
the LPG infrastructure can be easily applied for DME. Under standard atmospheric
conditions, DME is in gaseous phase and condenses to liquid phase above 0.5 MPa
pressure. The flammability range of DME is 3.4 to 27% by volume in air [4]. Unlike
methanol, it is non-toxic (or its toxicity is extremely low) which explains its use as a
propellant. It burns with a visible blue flame like natural gas, and does not cause
any greenhouse effect.
1.3 DME: Perspectives
1.3.1 DME as an alternative transportation fuel
DME fuel differs significantly from other fuels because of its unique physical
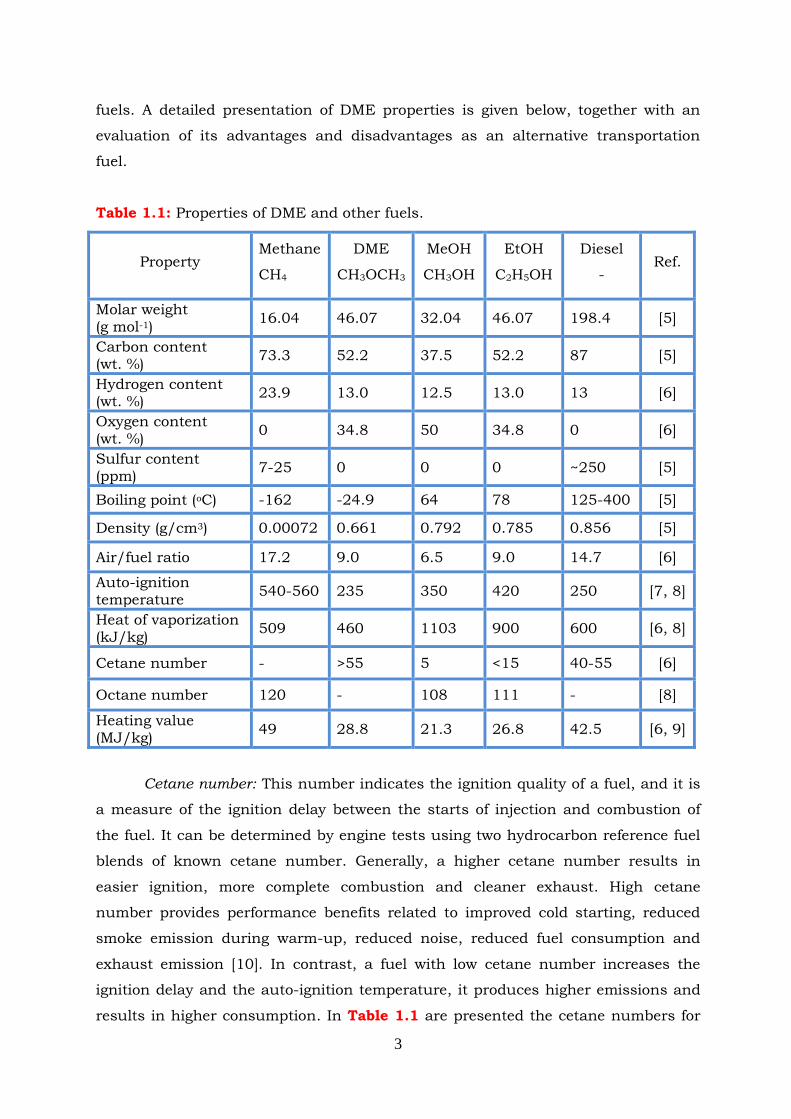
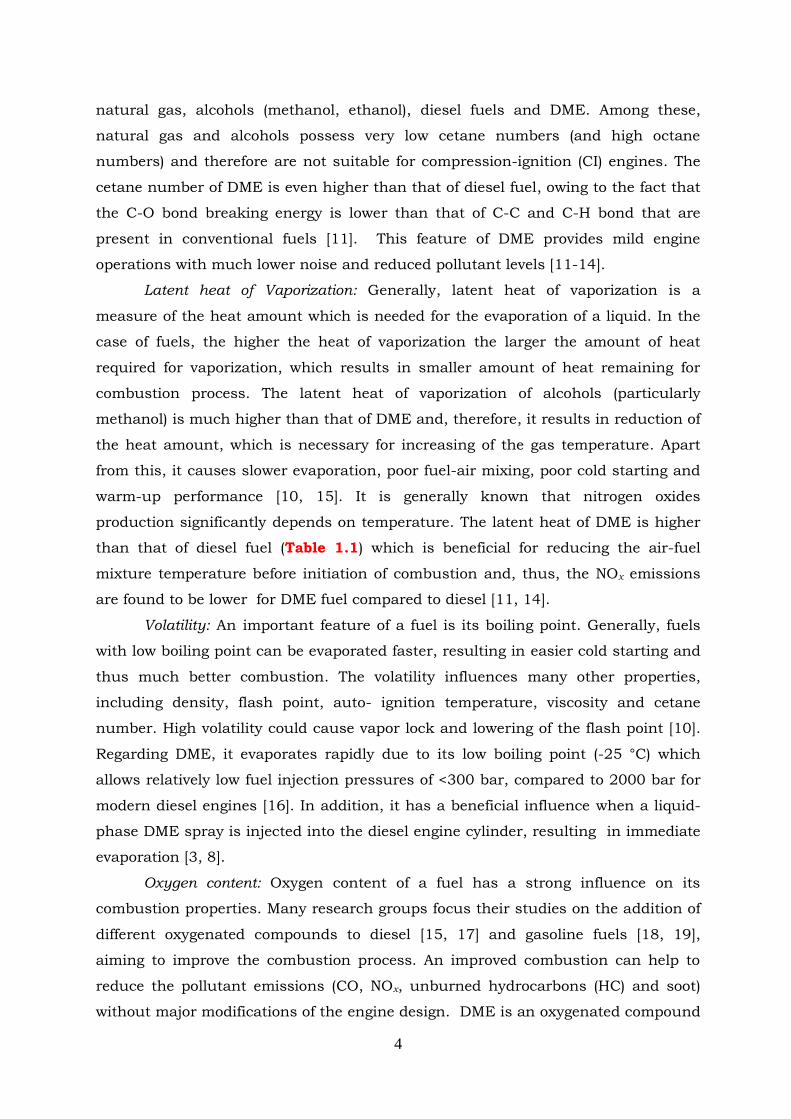
and combustion and emission characteristics. The most important physical and
chemical properties of DME are summarized in Table 1.1, in comparison with other
Figure 1.1: Structure of DME.
3
fuels. A detailed presentation of DME properties is given below, together with an
evaluation of its advantages and disadvantages as an alternative transportation
fuel.
Table 1.1: Properties of DME and other fuels.
Cetane number: This number indicates the ignition quality of a fuel, and it is
a measure of the ignition delay between the starts of injection and combustion of
the fuel. It can be determined by engine tests using two hydrocarbon reference fuel
blends of known cetane number. Generally, a higher cetane number results in
easier ignition, more complete combustion and cleaner exhaust. High cetane
number provides performance benefits related to improved cold starting, reduced
smoke emission during warm-up, reduced noise, reduced fuel consumption and
exhaust emission [10]. In contrast, a fuel with low cetane number increases the
ignition delay and the auto-ignition temperature, it produces higher emissions and
results in higher consumption. In Table 1.1 are presented the cetane numbers for
Property Methane
CH4
DME
CH3OCH3
MeOH
CH3OH
EtOH
C2H5OH
Diesel
- Ref.
Molar weight (g mol-1)
16.04 46.07 32.04 46.07 198.4 [5]
Carbon content (wt. %)
73.3 52.2 37.5 52.2 87 [5]
Hydrogen content (wt. %)
23.9 13.0 12.5 13.0 13 [6]
Oxygen content (wt. %)
0 34.8 50 34.8 0 [6]
Sulfur content (ppm)
7-25 0 0 0 ~250 [5]
Boiling point (oC) -162 -24.9 64 78 125-400 [5]
Density (g/cm3) 0.00072 0.661 0.792 0.785 0.856 [5]
Air/fuel ratio 17.2 9.0 6.5 9.0 14.7 [6]
Auto-ignition temperature
540-560 235 350 420 250 [7, 8]
Heat of vaporization (kJ/kg)
509 460 1103 900 600 [6, 8]
Cetane number - >55 5 <15 40-55 [6]
Octane number 120 - 108 111 - [8]
Heating value (MJ/kg)
49 28.8 21.3 26.8 42.5 [6, 9]
4
natural gas, alcohols (methanol, ethanol), diesel fuels and DME. Among these,
natural gas and alcohols possess very low cetane numbers (and high octane
numbers) and therefore are not suitable for compression-ignition (CI) engines. The
cetane number of DME is even higher than that of diesel fuel, owing to the fact that
the C-O bond breaking energy is lower than that of C-C and C-H bond that are
present in conventional fuels [11]. This feature of DME provides mild engine
operations with much lower noise and reduced pollutant levels [11-14].
Latent heat of Vaporization: Generally, latent heat of vaporization is a
measure of the heat amount which is needed for the evaporation of a liquid. In the
case of fuels, the higher the heat of vaporization the larger the amount of heat
required for vaporization, which results in smaller amount of heat remaining for
combustion process. The latent heat of vaporization of alcohols (particularly
methanol) is much higher than that of DME and, therefore, it results in reduction of
the heat amount, which is necessary for increasing of the gas temperature. Apart
from this, it causes slower evaporation, poor fuel-air mixing, poor cold starting and
warm-up performance [10, 15]. It is generally known that nitrogen oxides
production significantly depends on temperature. The latent heat of DME is higher
than that of diesel fuel (Table 1.1) which is beneficial for reducing the air-fuel
mixture temperature before initiation of combustion and, thus, the NOx emissions
are found to be lower for DME fuel compared to diesel [11, 14].
Volatility: An important feature of a fuel is its boiling point. Generally, fuels
with low boiling point can be evaporated faster, resulting in easier cold starting and
thus much better combustion. The volatility influences many other properties,
including density, flash point, auto- ignition temperature, viscosity and cetane
number. High volatility could cause vapor lock and lowering of the flash point [10].
Regarding DME, it evaporates rapidly due to its low boiling point (-25 °C) which
allows relatively low fuel injection pressures of <300 bar, compared to 2000 bar for
modern diesel engines [16]. In addition, it has a beneficial influence when a liquid-
phase DME spray is injected into the diesel engine cylinder, resulting in immediate
evaporation [3, 8].
Oxygen content: Oxygen content of a fuel has a strong influence on its
combustion properties. Many research groups focus their studies on the addition of
different oxygenated compounds to diesel [15, 17] and gasoline fuels [18, 19],
aiming to improve the combustion process. An improved combustion can help to
reduce the pollutant emissions (CO, NOx, unburned hydrocarbons (HC) and soot)
without major modifications of the engine design. DME is an oxygenated compound
5
(about 34.8% of oxygen) and does not have any carbon-carbon (C-C) bonds. These
two factors play an important role when DME is used in combustion processes. It is
well know that the C-O bond energy is lower than that of the C-H bond which
means that the C-O bond splits easier than the C-H bond. This characteristic lowers
DME auto-ignition compared to conventional fuels. In DME combustion process,
the presence of intra-molecular oxygen provides soot oxidation whereas the absence
of C-C bond leads in the reduction of particulate matter (PM) emission [7, 11].
Similar to alcohols, DME has a comparably lower heating value and lower
combustion enthalpy (energy content) owing to the oxygen content. As a result, a
higher amount of fuel is needed in order to produce the same amount of energy. For
DME, about 48% more mass of fuel should be injected in order to deliver the same
amount of energy that is provided by diesel fuel [20, 21]. In the engine injection
equipment, lubricity is an important quality characteristic in the boundary
lubrication regime. When it has a low value, it reduces the injection pump
durability due to extensive wear. Viscosity is a dominant property in the
hydrodynamic regime, which diminishes hydrodynamic or elastohydrodynamic film
formation capacity and, when it is low, it may cause leakage [22]. The currently
available fuel-injection systems have reduced lifetime and therefore must be
modified when the engine is fuelled with DME. This is because DME (like alcohols)
possesses poor viscosity (thus poor tension) and lubricity. Furthermore, DME has
the ability to dissolve organic compounds and, therefore, it is not compatible with
elastomers and plastic materials. In order to prevent the detrimental effect on the
engine life, additives for enhancing the lubricity must be implied and a careful
selection of sealing materials (based on high-tension components) is required [7, 11,
22]. Another disadvantage of DME is its low bulk modulus, which affects the
compressibility properties of DME possessing four or six times higher values than
that of diesel [7, 11].
1.3.2 DME as a fuel for gas turbines
The gas turbine is a continuous-flow engine which develops steady flame
during combustion and allows the use of various fuels [23, 24]. Although natural
gas is the main fuel that is used in gas turbines for power generation, a number of
studies have dealt with the use of DME for thermal power generation [9, 25]. The
results obtained show that DME can be a clean and efficient fuel for this purpose
provided that appropriate modifications of the combustor, fuel nozzle and burner
are made [23, 26].
6
1.3.3 DME as a fuel for indoor uses
Serious adverse consequences for health and environment can be caused by
the combustion of solid fuels (biomass and coal) in household cooking, especially
when energy conversion technologies are not clean and/or unproductive. Inefficient
biomass combustion creates high amounts of indoor health-damaging air pollutants
such as carbon monoxide, nitrogen oxides, volatile organic carbons, black carbon,
polycyclic aromatic hydrocarbons, and other health damaging gases. According to
the World Health Organization „„Fuel for Life‟‟ publication, this “kitchen killer” turn
out to be responsible for 1,6 million deaths and 2.7% of the global burden of
disease [27]. Generally, it is known that cooking with liquid or gas fuels is much
cleaner and more energy-efficient than with solid fuels. The liquefied petroleum gas
(LPG) consisting of propane and butanes, stored either separately or together, is a
widely used fuel for domestic purposes due to its superior combustion
characteristics. However, the production of LPG is strongly correlated to the
production of oil and gas, which means that the price of LPG follows the price of oil
and natural gas [28]. LPG is considered as an expensive energy source for poor
households and, due to market growth, a further increase of the LPG price is
expected in the future.
The physical characteristics (e.g., boiling point and vapour pressure) of DME
are very similar to those of LPG, so it can be stored and handled in a similar
manner [3, 29-31]. Thus, DME can be used as substitute/alternative of LPG for
domestic cooking and heating without modifying equipment.
It may be noted that, in China, DME started to be used as a substitute for
LPG in 2003. Most of the DME currently produced in China is indeed used as a
mixture with LPG (nearly 90% in 2007), mainly for heating and cooking purposes [2,
32]. Marchionna et al. [33] confirmed that the use of 15-20 vol. % of DME in
LPG/DME blends would not require any modification of existing distribution and
users' appliances.
1.3.4 DME as an alternative aerosol propellant
Chlorofluorocarbons (CFCs) are incombustible, chemically stable, and easily
liquefied substances invented in 1928. These compounds have been recognized as
ideal gases to be used as aerosols, refrigerants, cleaning, drying, blowing agents,
etc. In 1974 M. Molina and F. Rowland described in their publication the harmful
effects of CFCs to the stratospheric ozone layer. They found that these chemically
inert compounds may remain in the atmosphere for a very long time and by
7
reaching to upper stratosphere may produce a vast amount of free chlorine atoms.
These free chlorine atoms react with ozone molecules and lead to the destruction of
stratospheric ozone [34, 35]. The first global environmental treaty, known as the
Montral Protocol, was signed on September 1987 to set policies that would
eliminate the production and consumption of CFCs [36].
It has been reported that DME as well as other low-molecular-weight
hydrocarbons, such as butane and propane, can be used as a green aerosol
propellant in the cosmetics industry (aerosol-based products like hair spray,
shaving cream, personal care mousses, antiperspirants and air freshers) and can
effectively replace chloro-fluoro-carbons (CFC) because of its environmentally
benign properties [37].
1.3.5 DME as a hydrogen source and carrier
Hydrogen is a very clean and carbon-free energy carrier which has attracted
significant attention in recent years, mainly due to its potential use in fuel cell
applications. At present, most of the world's hydrogen is produced from natural gas
(~97 % CH4). The primary ways in which methane is converted to hydrogen involve
reaction with either steam (steam reforming), oxygen (partial oxidation), or both in
sequence (autothermal reforming) [38]. Steam reforming of fuels has attracted much
attention as an efficient technology for hydrogen production because it provides a
higher reformate quality (e.g. higher hydrogen production yield, lower rate of side
reactions and by-products) in comparison to partial oxidation or autothermal
reforming proceses [39, 40]. To achieve the benefits of the hydrogen economy, it is
necessary to produce hydrogen from non−fossil resources, such as water and
biomass-derived methanol or ethanol [38]. Recently, many researchers have
directed their attention to hydrogen production from methanol/ethanol [41].
Methanol is one of the promising candidate-sources of hydrogen due to its high
volumetric energy density, easy storage and transportation [42, 43]. However, the
infrastructure of methanol is not well developed and the toxicity of methanol is high
[44]. In this respect, an increasing interest has been observed towards DME as an
efficient, suitable hydrogen source in past several years [45-50]. The relatively low
reforming temperature of DME (200–350 °C), its large hydrogen content, and its
non-corrosive and non-toxic nature play a crucial role for this purpose [51, 52].
1.3.6 Direct DME Fuel cells (DDMEFCs)
Fuel cells are considered to be the most promising energy conversion devices,
8
which directly convert chemical energy into electricity, with very high efficiency
(>40%). Advantages of FCs include the fact that their efficiency is independent of the
Carnot cycle for thermal machines and that they can be designed for both mobile
and stationary applications. These devices produce only water as byproduct when
hydrogen is used as fuel, without undesired residual emissions and, consequently,
has no impact on the greenhouse effect [38]. During the past decades, hydrogen
was the most commonly applied fuel for fuel cells because of its high
electrochemical oxidation rate over fuel cell anode with zero emission. On the other
hand, many chemical fuels such as hydrocarbons and oxygenated-hydrocarbons
are believed to be more practical fuels for fuel cells than hydrogen for the near
future application [53]. Direct methanol fuel cells, direct ethanol fuel cells and
proton exchange membrane fuel cells are widely studied in this field [54, 55]. DME
is also considered as a promising fuel for the direct type fuel cell (DDFC) owing to its
advantages for this application. Contrary to methanol and ethanol, DME decreases
the crossover effect, owing to its low dipolar moment (1.3D) [56]. Since 1 mole of
DME can produce 12 electrons by complete oxidation while 1 mol methanol can
produce 6 electrons, the fuel cells that operate with DME can result in more
efficient fuel management [57]. Conversely to ethanol, DME does not have C-C
bonds, which allows the oxidation process to proceed completely. Unlike methanol,
DME has low toxicity and relatively low flammability and explosive limit [56, 58].
1.3.7 DME as a chemical intermediate
DME can serve as an important chemical intermediate for the production of
chemicals such as dimethoxymethane (DMM), methyl acetate (MA), formaldehyde,
dimethyl sulphate and ethanol. Below are summarized the most known processes
where DME is used as a chemical intermediate.
Production of dimethoxymethane: At present there are several DMM synthesis
routes, including direct oxidation of DME. Several research groups have been
working on this subject under different reaction conditions by applying various
catalysts. It has reported by Liu et al. [59] that there is 56.8% DMM selectivity in
oxidation reaction of DME when H5PV2Mo10O40 is used as a catalyst. Qingde et al.
[60] studied the reaction over MnCl2-, SnCl4-, CuCl2- modified H4SiW12O40/SiO2
catalysts in a continuous flow fixed-bed reactor. They concluded that modification
with MnCl2 promotes the activity of the catalyst and increases the DMM selectivity.
Production of methyl acetate: Today, more than 50% of industrially
manufactured acetic acid is produced from methanol carbonylation reaction over a
9
rhodium/iodide homogeneous system, which was discovered in 1966 by Monsanto
[61-63]. Considerable attempts have been made to develop a heterogeneous system
for the methanol or ether carbonylation process [64]. It has been shown that the
carbonylation of DME with carbon monoxide exhibits unpredictable activity and
selectivity over H-MOR zeolite [63, 65, 66].
Production of formaldehyde: DME can be used to synthesize formaldehyde
(HCHO), which is an important intermediate for the synthesis of other chemicals.
Iglesia and co-workers [67] investigated the synthesis of formaldehyde from DME
oxidation on MoOx and VOx domains supported on SnO2, CeO2 or Fe2O3. Results of
their exploratory studies showed that MoOx/Al2O3 is a highly selective catalyst and
that an increase of HCHO selectivity is achieved by increasing MoOx loading on
Al2O3.
Production of ethanol: Traditionally, ethanol is produced from fermentation of
corn or food based feedstock. Considering the growing concerns about worldwide
food shortage, it is strongly required to develop a novel and environmentally friendly
ethanol synthesis method. In this respect, a new route for the synthesis of ethanol
from DME and syngas has been proposed using an indirect route that does not
involve any agricultural feedstock [68]. In this process, DME and CO are first
converted to methyl acetate over a zeolite catalyst, which is then hydrogenated to
methanol and ethanol. The process has the additional advantage of recycling the
formed methanol to DME and water.
1.4 DME: Demand, manufacturing plants and production costs
The global DME demand is expected to rise to over 7 million metric tons/year
by 2015 while the global capacity ranges between 10 and 12 million metric
tons/year. China is the main country where nearly all of the commercial DME
plants have been built for fuel applications. During 2011, there were 60 DME
producers in 18 provinces, of which 17 have capacities of at least 200,000 metric
tons per year [3]. DME commercialization and projects‟ development activity are
taking place also in Iran, Egypt, Russian, South Korea, Sweden, Brazil, Taiwan,
Turkey and Trinidad. There are plans for significant DME capacity additions in
Uzbekistan 100,000 tons/year for 2013 and 800,000 tons /year in Indonesia. Other
projects are planned in Egypt (200,000 tons /year) and India (265,000 tons /year).
In China another 600,000 tons /year is under construction and a further 20m tons
/year is planned by 2020 [69].
DME cost estimation is difficult to determine, because it strongly depends on
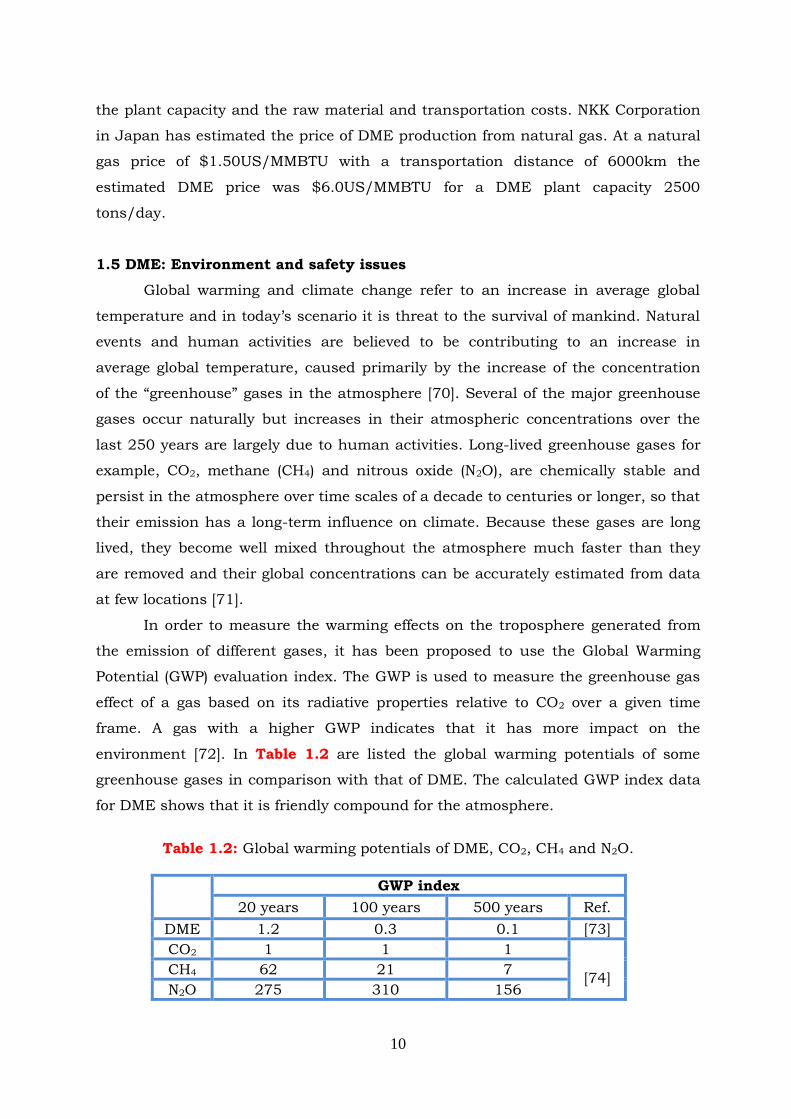
10
the plant capacity and the raw material and transportation costs. NKK Corporation
in Japan has estimated the price of DME production from natural gas. At a natural
gas price of $1.50US/MMBTU with a transportation distance of 6000km the
estimated DME price was $6.0US/MMBTU for a DME plant capacity 2500
tons/day.
1.5 DME: Environment and safety issues
Global warming and climate change refer to an increase in average global
temperature and in today‟s scenario it is threat to the survival of mankind. Natural
events and human activities are believed to be contributing to an increase in
average global temperature, caused primarily by the increase of the concentration
of the “greenhouse” gases in the atmosphere [70]. Several of the major greenhouse
gases occur naturally but increases in their atmospheric concentrations over the
last 250 years are largely due to human activities. Long-lived greenhouse gases for
example, CO2, methane (CH4) and nitrous oxide (N2O), are chemically stable and
persist in the atmosphere over time scales of a decade to centuries or longer, so that
their emission has a long-term influence on climate. Because these gases are long
lived, they become well mixed throughout the atmosphere much faster than they
are removed and their global concentrations can be accurately estimated from data
at few locations [71].
In order to measure the warming effects on the troposphere generated from
the emission of different gases, it has been proposed to use the Global Warming
Potential (GWP) evaluation index. The GWP is used to measure the greenhouse gas
effect of a gas based on its radiative properties relative to CO2 over a given time
frame. A gas with a higher GWP indicates that it has more impact on the
environment [72]. In Table 1.2 are listed the global warming potentials of some
greenhouse gases in comparison with that of DME. The calculated GWP index data
for DME shows that it is friendly compound for the atmosphere.
Table 1.2: Global warming potentials of DME, CO2, CH4 and N2O.
GWP index
20 years 100 years 500 years Ref.
DME 1.2 0.3 0.1 [73]
CO2 1 1 1
[74] CH4 62 21 7
N2O 275 310 156
11
Unlike conventional diesel fuel, DME is a gas at ambient temperature. Thus,
the widespread use of DME may require additional investment in infrastructure
associated with fuel distribution and delivery. In addition, DME is an ether and
therefore can react with molecular oxygen at ambient temperatures to form
hydroperoxides. Thus, it is possible that prolonged exposure in air may induce
autoxidation of DME to produce explosive organic peroxides during transportation
and storage [75]. Naito et al. [75] have studied the oxygen/DME reactivity and the
autoxidation rate and assess of DME safety by means of ARC and oven storage
tests. They concluded that under oxygen-rich conditions there is a capability for
DME autoxidation, but the rate is lower than that of diisopropyl ether (DIPE) and
diethyl ether (DEE).
1.6 DME production
Traditionally, dimethyl ether is produced in a two-step process from
synthesis gas (CO/H2/CO2) originating from natural gas, coal or biomass. The
process involves synthesis of methanol by hydrogenation of CO/CO2 over a copper
based catalyst [76-79] and subsequent dehydration of methanol to DME over an
acidic catalyst [80, 81].
The reactions of methanol formation via hydrogenation of CO (reaction 1.1)
or CO2 (reaction 1.2) are exothermic and they both result in a stoichiometric
decrease of the total number of molecules on their right side. Therefore, reactions
(1.1 and 1.2) are thermodynamically limited and are favoured at low temperatures
and high pressures.
CO + 2H2 CH3OH ΔH = -90.4 kJ mol-1 1.1
CO2 + 3H2 CH3OH +H2O ΔH = -49.2 kJ mol-1 1.2
CO + H2O CO2 + H2 ΔH = -41.2 kJ mol-1 1.3
2CH3OH CH3OCH3 + H2O ΔH = -24.0 kJ mol-1 1.4
For many years, methanol has been produced from synthesis gas, consisting
mainly of CO, H2 and small amount CO2, at high pressures (150-250 bar) and at
high temperatures (573-633 K). After 40 years of development, a new catalytic
system introduced by ICI (Imperial Chemical Industries) has considerably mitigated
the operation conditions of the reaction.
First activities for DME production were based on dehydration of methanol.
For this two-step technology there are several licensors including Haldor Tospoe,
12
Linde/Lurgi, Toyo Engineering, Uhde, MGC (Mitsubishi Gas Chemical Company),
China Southwestern Research Institute of Chemical Industry and China Energy
[3]. In 2012, the global methanol demand for use in DME production was estimated
to be approximately 3.7 million tonne. The methanol dehydration reaction is a gas-
phase exothermic reaction, which is not favored thermodynamically at high
temperatures (detailed thermodynamic study in Chapter 2). The reaction takes
place over solid acid catalysts and, therefore, several such materials have been
investigated including Al2O3 [82-84], zeolites [85-87] and mixed metal oxides [87-
89]. Among these, the most extensively studied materials are based on Al2O3. This is
because Al2O3 is characterized by high surface area, excellent thermal stability, high
mechanical resistance and suitable acidity for the reaction that yields good
performance in terms of methanol conversion and DME selectivity, the latter being
almost 100%.
Alternatively, DME can be produced from synthesis gas in a one-step (direct)
process [90-93] using a hybrid (bifunctional) catalytic system that permits both
methanol synthesis and dehydration in a single process unit. The catalyst used for
the one-step process, should efficiently catalyze both methanol and DME synthesis
reactions. Generally, it consists of two types of active sites: one that catalyzes
methanol synthesis from syngas (reactions 1.1, 1.2), which is typically composed of
CuO-ZnO based catalysts [94, 95], and another that promotes dehydration of
methanol to DME, which is based on an acidic material.
The direct method of DME production is more economical than the indirect
method because of two reasons. First, the thermodynamic limitation in indirect
method is higher than in the direct method. Thermodynamic limitations imply that
methanol synthesis from CO (reaction 1.1) or CO2 (reaction 1.2) is favoured at low
temperatures and high pressures. These constraints can be reduced by co-
production of DME because the equilibrium constant of the methanol dehydration
reaction is much higher than that of methanol synthesis [96]. Water formed by
methanol dehydration (reaction 1.4) can be removed from the system by the water
gas shift (WGS) reaction (reaction 1.3), which also results in a shift of the
equilibrium composition toward the desired direction [97, 98]. Second, in the two-
step process, the purification, transportation of methanol and subsequent methanol
dehydration to DME in a separate unit are costly. In the one-step process these
steps can be eliminated because production of methanol and DME take place
simultaneously in the same reactor.
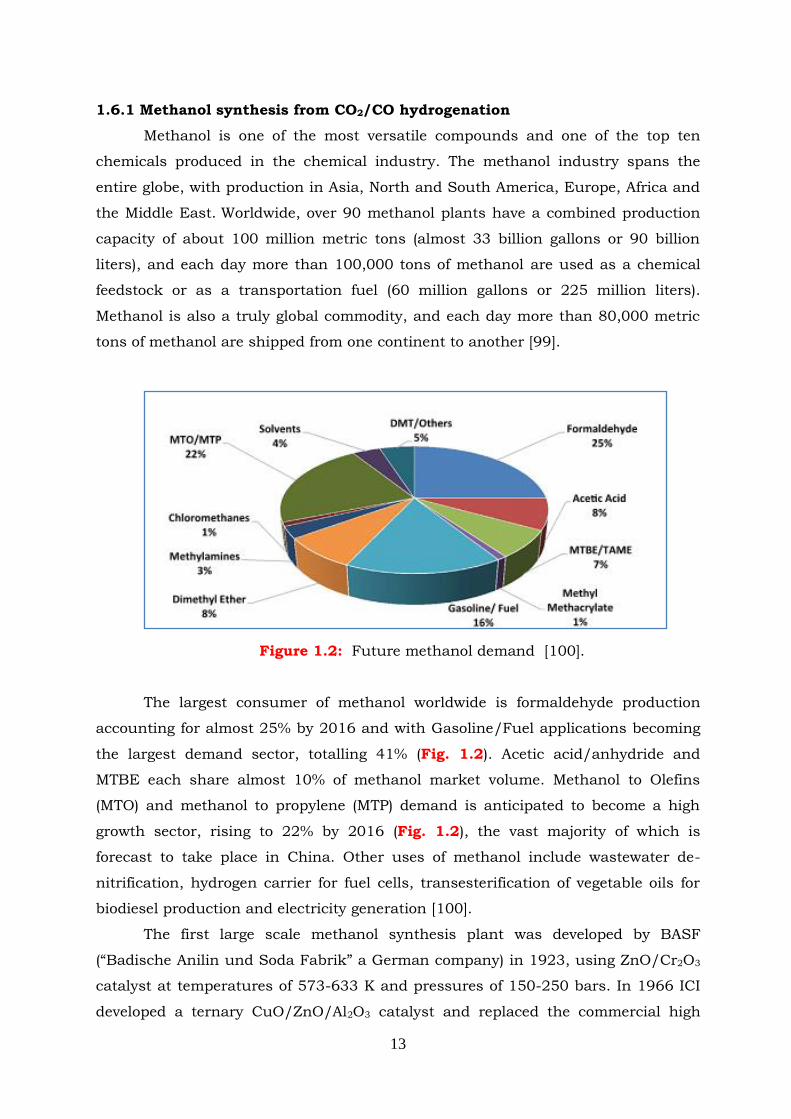
13
1.6.1 Methanol synthesis from CO2/CO hydrogenation
Methanol is one of the most versatile compounds and one of the top ten
chemicals produced in the chemical industry. The methanol industry spans the
entire globe, with production in Asia, North and South America, Europe, Africa and
the Middle East. Worldwide, over 90 methanol plants have a combined production
capacity of about 100 million metric tons (almost 33 billion gallons or 90 billion
liters), and each day more than 100,000 tons of methanol are used as a chemical
feedstock or as a transportation fuel (60 million gallons or 225 million liters).
Methanol is also a truly global commodity, and each day more than 80,000 metric
tons of methanol are shipped from one continent to another [99].
Figure 1.2: Future methanol demand [100].
The largest consumer of methanol worldwide is formaldehyde production
accounting for almost 25% by 2016 and with Gasoline/Fuel applications becoming
the largest demand sector, totalling 41% (Fig. 1.2). Acetic acid/anhydride and
MTBE each share almost 10% of methanol market volume. Methanol to Olefins
(MTO) and methanol to propylene (MTP) demand is anticipated to become a high
growth sector, rising to 22% by 2016 (Fig. 1.2), the vast majority of which is
forecast to take place in China. Other uses of methanol include wastewater de-
nitrification, hydrogen carrier for fuel cells, transesterification of vegetable oils for
biodiesel production and electricity generation [100].
The first large scale methanol synthesis plant was developed by BASF
(“Badische Anilin und Soda Fabrik” a German company) in 1923, using ZnO/Cr2O3
catalyst at temperatures of 573-633 K and pressures of 150-250 bars. In 1966 ICI
developed a ternary CuO/ZnO/Al2O3 catalyst and replaced the commercial high
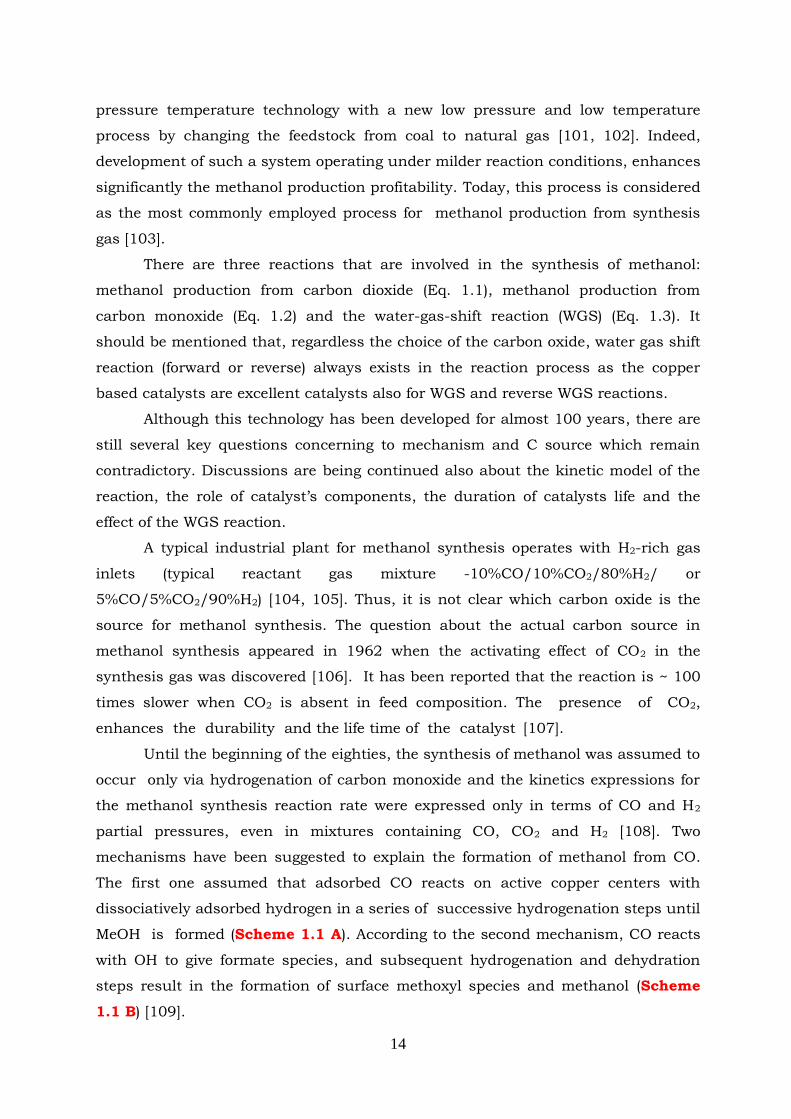
14
pressure temperature technology with a new low pressure and low temperature
process by changing the feedstock from coal to natural gas [101, 102]. Indeed,
development of such a system operating under milder reaction conditions, enhances
significantly the methanol production profitability. Today, this process is considered
as the most commonly employed process for methanol production from synthesis
gas [103].
There are three reactions that are involved in the synthesis of methanol:
methanol production from carbon dioxide (Eq. 1.1), methanol production from
carbon monoxide (Eq. 1.2) and the water-gas-shift reaction (WGS) (Eq. 1.3). It
should be mentioned that, regardless the choice of the carbon oxide, water gas shift
reaction (forward or reverse) always exists in the reaction process as the copper
based catalysts are excellent catalysts also for WGS and reverse WGS reactions.
Although this technology has been developed for almost 100 years, there are
still several key questions concerning to mechanism and C source which remain
contradictory. Discussions are being continued also about the kinetic model of the
reaction, the role of catalyst‟s components, the duration of catalysts life and the
effect of the WGS reaction.
A typical industrial plant for methanol synthesis operates with H2-rich gas
inlets (typical reactant gas mixture -10%CO/10%CO2/80%H2/ or
5%CO/5%CO2/90%H2) [104, 105]. Thus, it is not clear which carbon oxide is the
source for methanol synthesis. The question about the actual carbon source in
methanol synthesis appeared in 1962 when the activating effect of CO2 in the
synthesis gas was discovered [106]. It has been reported that the reaction is ~ 100
times slower when CO2 is absent in feed composition. The presence of CO2,
enhances the durability and the life time of the catalyst [107].
Until the beginning of the eighties, the synthesis of methanol was assumed to
occur only via hydrogenation of carbon monoxide and the kinetics expressions for
the methanol synthesis reaction rate were expressed only in terms of CO and H2
partial pressures, even in mixtures containing CO, CO2 and H2 [108]. Two
mechanisms have been suggested to explain the formation of methanol from CO.
The first one assumed that adsorbed CO reacts on active copper centers with
dissociatively adsorbed hydrogen in a series of successive hydrogenation steps until
MeOH is formed (Scheme 1.1 A). According to the second mechanism, CO reacts
with OH to give formate species, and subsequent hydrogenation and dehydration
steps result in the formation of surface methoxyl species and methanol (Scheme
1.1 B) [109].
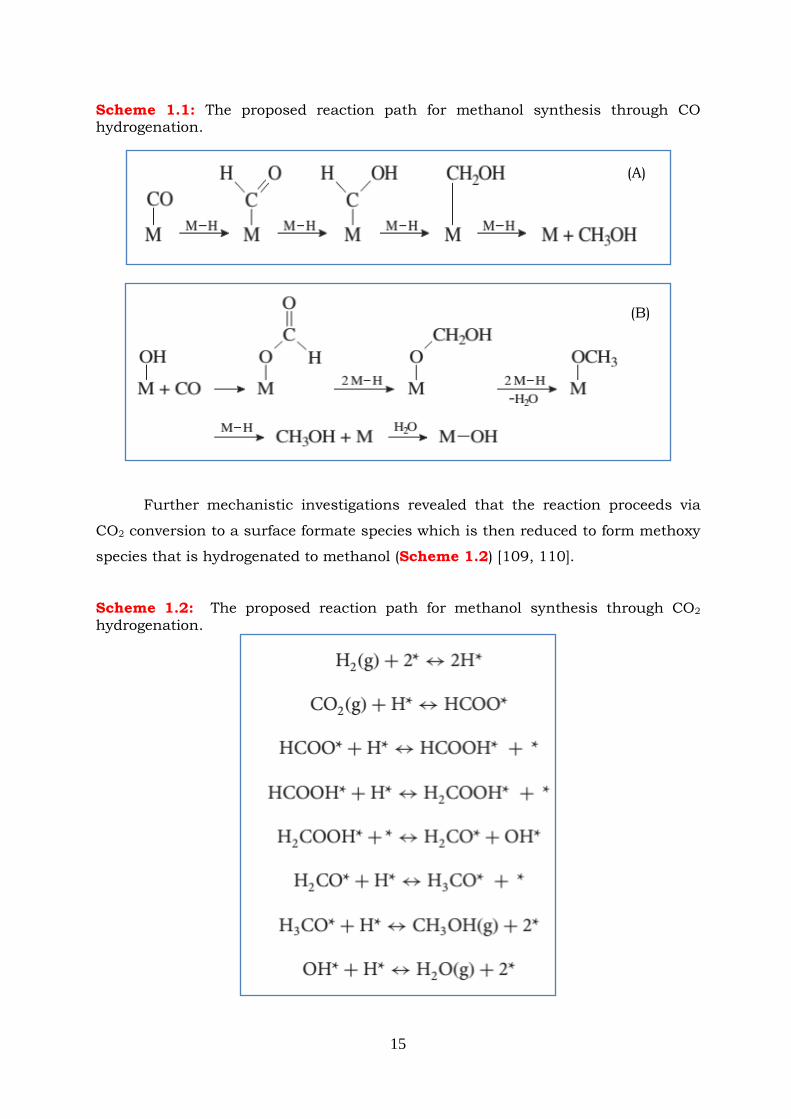
15
Scheme 1.1: The proposed reaction path for methanol synthesis through CO hydrogenation.
Further mechanistic investigations revealed that the reaction proceeds via
CO2 conversion to a surface formate species which is then reduced to form methoxy
species that is hydrogenated to methanol (Scheme 1.2) [109, 110].
Scheme 1.2: The proposed reaction path for methanol synthesis through CO2 hydrogenation.
(A)
(B)
16
The role of CO is to remove surface oxygen by keeping the metal surface in a
highly reduced state [107]. Later on, a Russian group conducted isotope-labelling
studies and proved that methanol is produced over copper-containing catalysts
mainly from CO2 and not CO [111]. In the last decade, attention has been
focused on the role of CO2 in the synthesis of methanol [112]. Today, a
mechanism starting from CO2 is mostly accepted although a recent work by Yang
and co-workers [113] revealed that the preferred carbon source for the reaction
changes from CO2 to CO as the temperature is lowered.
1.6.1.1 Cu/Zn/Al2O3 catalyst: The role of each component
Copper-zinc–alumina (Cu/Zn/Al2O3) remains the most commonly used
industrial methanol synthesis catalyst. Copper is the main component of this
catalyst, whereas zinc and alumina are used as promoters. The co-precipitation
method is commonly applied for the preparation of ternary copper based catalyst
[114]. Carbonates, hydroxycarbonates or hydroxides of alkali metals serve as
precipitating agents. The process is difficult to control; it is essential to keep the
solution homogeneous to allow the two components to precipitate simultaneously,
and variations of pH throughout the solution should be avoided.
The role of each component of a typical copper-zinc-alumina methanol
synthesis catalyst is still under debate. It has been reported by many researchers
that copper is the main active catalyst component [107, 115, 116] although when
used alone it is not an efficient catalyst [117]. The activity of Cu/Al2O3, Cu/ZnO and
Cu/ZnO/Al2O3 catalysts has been examined by Kurtz et al. [118]. They found that
the surface area of copper metal plays an important role on methanol synthesis
reaction and there is an almost linear relationship between catalytic activity and
metallic copper surface area. The authors concluded that catalytic activity increases
in the order of Cu/Al2O3 < Cu/ZnO < Cu/ZnO/Al2O3.
The higher activity of Cu/ZnO, compared to Cu/Al2O3, suggests that there is
a synergy between Cu-Zn oxides. A possible explanation for this synergy has been
proposed by Burch et al. [119] and involves the reverse H2 spillover effect. In
particular, it has been reported that hydrogen initially dissociated on metallic Cu,
spills over onto ZnO and copper and accelerates the hydrogenation of surface
intermediates. It has been also reported that Zn can efficiently prevent sintering of
copper crystallites into larger crystallites by keeping the copper surface highly
dispersed. Zinc oxide also protects the copper surface from poisons (sulfur and
chlorides) [104, 107]. However, it was found that zinc oxide is not so stable under
17
reaction conditions and, for this reason, another refractory oxide (typically Al2O3) is
commonly used as a stabilizer of zinc oxide. Al2O3 inhibits thermal sintering and
poisoning of the catalyst, and provides additional thermal and catalytic stability as
well as higher intrinsic activity [120, 121]. Other promoters like zirconia silica, gallia
and chromia are also able to beneficially affect Cu dispersion, stability, activity and
selectivity of the catalyst [115].
1.6.1.2 Reduction of Cu/Zn/Al2O3 catalyst
In order to activate the Cu/Zn/Al2O3 catalyst, the initially present copper (II)
oxide has to be reduced to metallic copper. In general, the reduction of copper oxide
is carried out with H2 (pure or diluted with N2) at elevated temperatures (>470 K)
and involves two steps. In the first step, metal nuclei are formed. In the second step,
nuclei accumulate to form metal crystallites. The rates of both processes depend on
temperature and on the nature of the substrate. Reduction at lower temperatures
(<570 K) provides a narrow distribution of small metal crystallites. Reduction at
higher temperatures (>670 K) gives a broader distribution and larger metal
crystallites [122]. The importance of valence state (Cu0 or Cu+1) of Cu has been a
subject of controversy for many researchers. It has been reported that CuO
undergoes complete reduction, and metallic copper (Cu0) is the real active phase
[123]. However Wang and et al. reported that both Cu metal and Cu2O are required
for an active catalyst and appropriate specific Cu+/Cu0 ratio is crucial for optimal
catalytic performance of methanol synthesis from synthesis gas [124].
1.6.1.3 Deactivation of copper-based catalyst
Many factors can cause deactivation of copper catalysts. Sintering of copper
crystallites is the most important reason for this, and can cause fast deactivation of
industrial methanol synthesis catalysts. When sintering occurs (Fig. 1.3), the
agglomeration of small metal crystallites results in reduction of copper surface area.
The rate of sintering increases with increasing temperature, thus the influence of
sintering can be suppressed by decreasing the reaction temperature. However, low
reaction temperature inhibits the catalytic performance and decreases the rate of
the methanol formation reaction. Another parameter that accelerates the sintering
process is the presence of steam. A fast catalytic deactivation is expected, when a
CO2-rich feed composition is used for methanol synthesis. This is because of the
presence a high amount of water, which is produced during the methanol synthesis
and reverse water gas shift reactions.
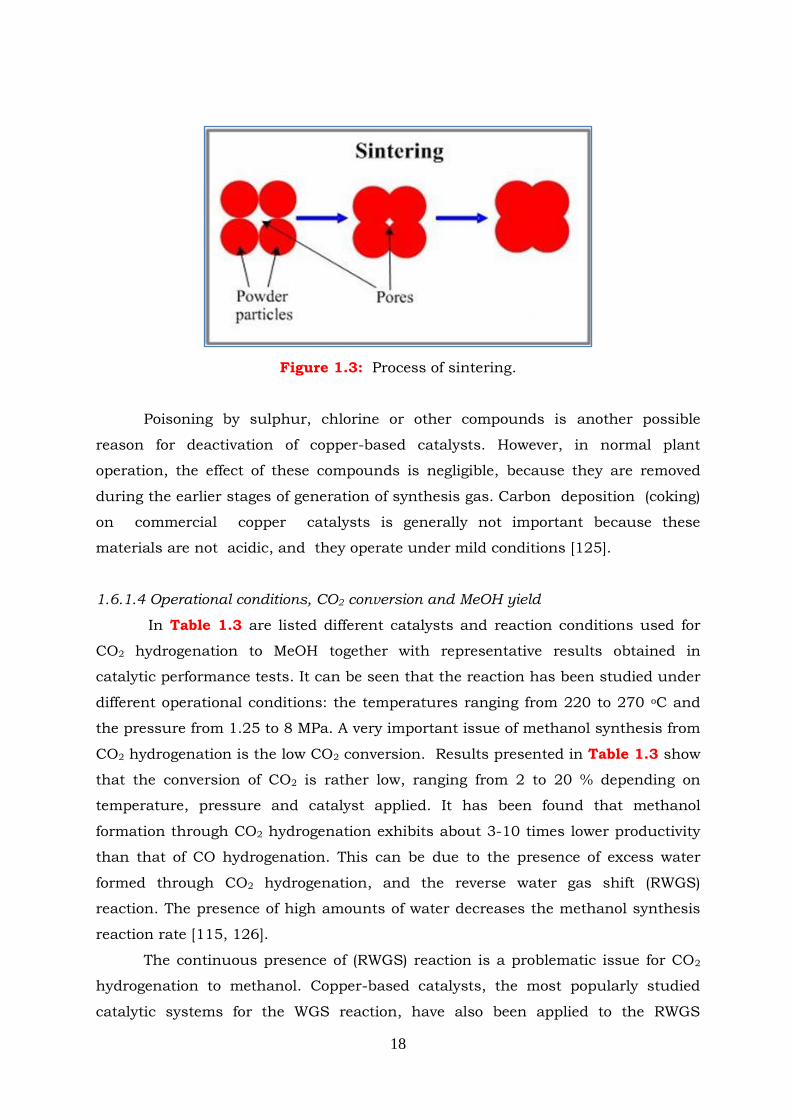
18
Figure 1.3: Process of sintering.
Poisoning by sulphur, chlorine or other compounds is another possible
reason for deactivation of copper-based catalysts. However, in normal plant
operation, the effect of these compounds is negligible, because they are removed
during the earlier stages of generation of synthesis gas. Carbon deposition (coking)
on commercial copper catalysts is generally not important because these
materials are not acidic, and they operate under mild conditions [125].
1.6.1.4 Operational conditions, CO2 conversion and MeOH yield
In Table 1.3 are listed different catalysts and reaction conditions used for
CO2 hydrogenation to MeOH together with representative results obtained in
catalytic performance tests. It can be seen that the reaction has been studied under
different operational conditions: the temperatures ranging from 220 to 270 oC and
the pressure from 1.25 to 8 MPa. A very important issue of methanol synthesis from
CO2 hydrogenation is the low CO2 conversion. Results presented in Table 1.3 show
that the conversion of CO2 is rather low, ranging from 2 to 20 % depending on
temperature, pressure and catalyst applied. It has been found that methanol
formation through CO2 hydrogenation exhibits about 3-10 times lower productivity
than that of CO hydrogenation. This can be due to the presence of excess water
formed through CO2 hydrogenation, and the reverse water gas shift (RWGS)
reaction. The presence of high amounts of water decreases the methanol synthesis
reaction rate [115, 126].
The continuous presence of (RWGS) reaction is a problematic issue for CO2
hydrogenation to methanol. Copper-based catalysts, the most popularly studied
catalytic systems for the WGS reaction, have also been applied to the RWGS
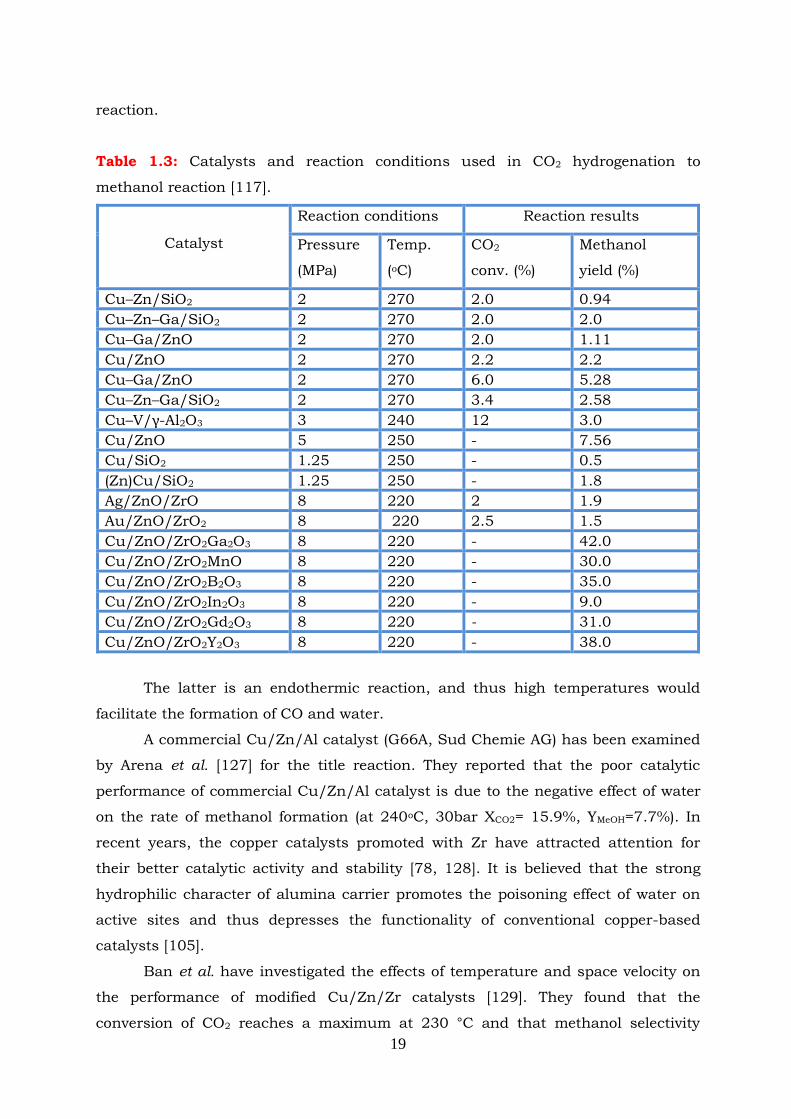
19
reaction.
Table 1.3: Catalysts and reaction conditions used in CO2 hydrogenation to
methanol reaction [117].
Catalyst
Reaction conditions Reaction results
Pressure
(MPa)
Temp.
(oC)
CO2
conv. (%)
Methanol
yield (%)
Cu–Zn/SiO2 2 270 2.0 0.94
Cu–Zn–Ga/SiO2 2 270 2.0 2.0
Cu–Ga/ZnO 2 270 2.0 1.11
Cu/ZnO 2 270 2.2 2.2
Cu–Ga/ZnO 2 270 6.0 5.28
Cu–Zn–Ga/SiO2 2 270 3.4 2.58
Cu–V/γ-Al2O3 3 240 12 3.0
Cu/ZnO 5 250 - 7.56
Cu/SiO2 1.25 250 - 0.5
(Zn)Cu/SiO2 1.25 250 - 1.8
Ag/ZnO/ZrO 8 220 2 1.9
Au/ZnO/ZrO2 8 220 2.5 1.5
Cu/ZnO/ZrO2Ga2O3 8 220 - 42.0
Cu/ZnO/ZrO2MnO 8 220 - 30.0
Cu/ZnO/ZrO2B2O3 8 220 - 35.0
Cu/ZnO/ZrO2In2O3 8 220 - 9.0
Cu/ZnO/ZrO2Gd2O3 8 220 - 31.0
Cu/ZnO/ZrO2Y2O3 8 220 - 38.0
The latter is an endothermic reaction, and thus high temperatures would
facilitate the formation of CO and water.
A commercial Cu/Zn/Al catalyst (G66A, Sud Chemie AG) has been examined
by Arena et al. [127] for the title reaction. They reported that the poor catalytic
performance of commercial Cu/Zn/Al catalyst is due to the negative effect of water
on the rate of methanol formation (at 240oC, 30bar XCO2= 15.9%, YMeOH=7.7%). In
recent years, the copper catalysts promoted with Zr have attracted attention for
their better catalytic activity and stability [78, 128]. It is believed that the strong
hydrophilic character of alumina carrier promotes the poisoning effect of water on
active sites and thus depresses the functionality of conventional copper-based
catalysts [105].
Ban et al. have investigated the effects of temperature and space velocity on
the performance of modified Cu/Zn/Zr catalysts [129]. They found that the
conversion of CO2 reaches a maximum at 230 °C and that methanol selectivity
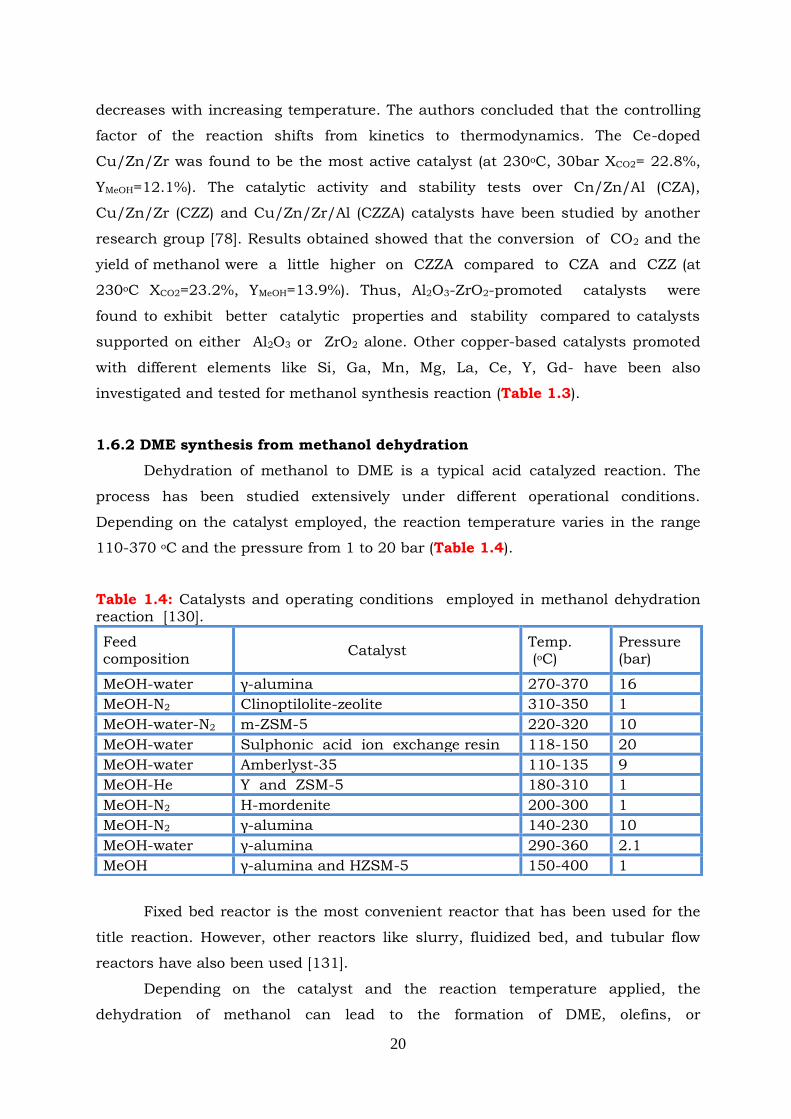
20
decreases with increasing temperature. The authors concluded that the controlling
factor of the reaction shifts from kinetics to thermodynamics. The Ce-doped
Cu/Zn/Zr was found to be the most active catalyst (at 230oC, 30bar XCO2= 22.8%,
YMeOH=12.1%). The catalytic activity and stability tests over Cn/Zn/Al (CZA),
Cu/Zn/Zr (CZZ) and Cu/Zn/Zr/Al (CZZA) catalysts have been studied by another
research group [78]. Results obtained showed that the conversion of CO2 and the
yield of methanol were a little higher on CZZA compared to CZA and CZZ (at
230oC XCO2=23.2%, YMeOH=13.9%). Thus, Al2O3-ZrO2-promoted catalysts were
found to exhibit better catalytic properties and stability compared to catalysts
supported on either Al2O3 or ZrO2 alone. Other copper-based catalysts promoted
with different elements like Si, Ga, Mn, Mg, La, Ce, Y, Gd- have been also
investigated and tested for methanol synthesis reaction (Table 1.3).
1.6.2 DME synthesis from methanol dehydration
Dehydration of methanol to DME is a typical acid catalyzed reaction. The
process has been studied extensively under different operational conditions.
Depending on the catalyst employed, the reaction temperature varies in the range
110-370 oC and the pressure from 1 to 20 bar (Table 1.4).
Table 1.4: Catalysts and operating conditions employed in methanol dehydration reaction [130].
Fixed bed reactor is the most convenient reactor that has been used for the
title reaction. However, other reactors like slurry, fluidized bed, and tubular flow
reactors have also been used [131].
Depending on the catalyst and the reaction temperature applied, the
dehydration of methanol can lead to the formation of DME, olefins, or
Feed composition
Catalyst Temp. (oC)
Pressure (bar)
MeOH-water γ-alumina 270-370 16
MeOH-N2 Clinoptilolite-zeolite 310-350 1
MeOH-water-N2 m-ZSM-5 220-320 10
MeOH-water Sulphonic acid ion exchange resin 118-150 20
MeOH-water Amberlyst-35 110-135 9
MeOH-He Y and ZSM-5 180-310 1
MeOH-N2 H-mordenite 200-300 1
MeOH-N2 γ-alumina 140-230 10
MeOH-water γ-alumina 290-360 2.1
MeOH γ-alumina and HZSM-5 150-400 1
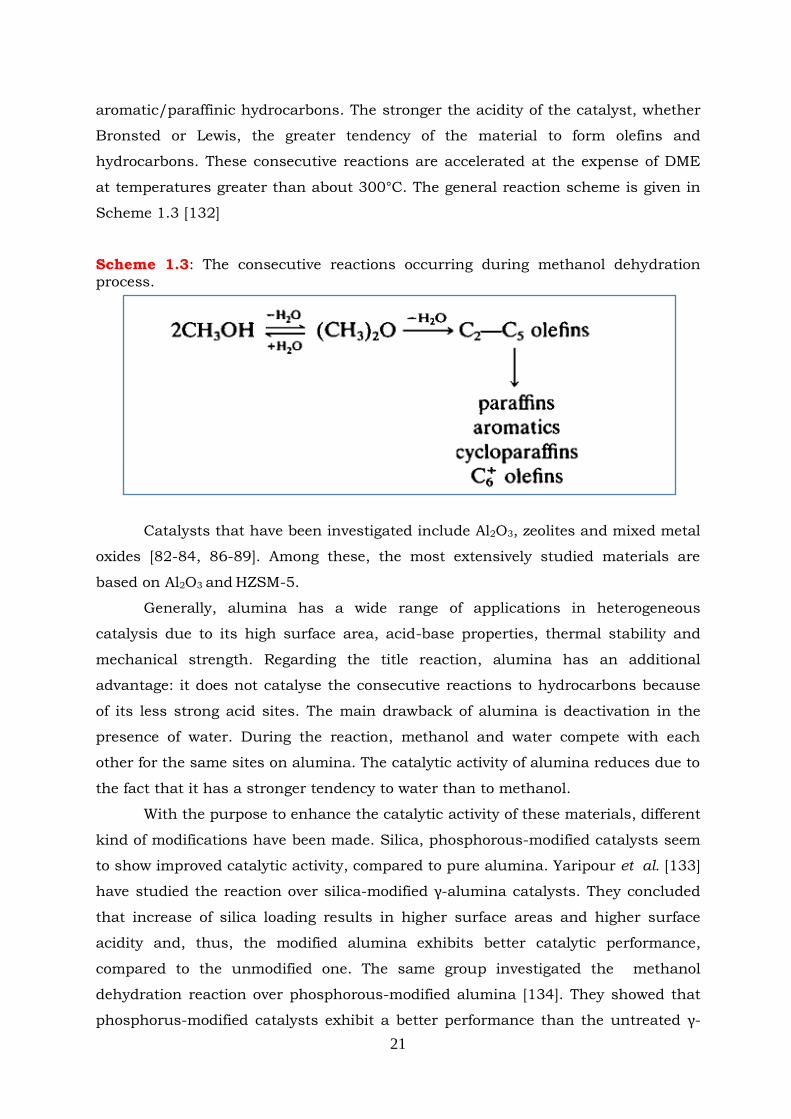
21
aromatic/paraffinic hydrocarbons. The stronger the acidity of the catalyst, whether
Bronsted or Lewis, the greater tendency of the material to form olefins and
hydrocarbons. These consecutive reactions are accelerated at the expense of DME
at temperatures greater than about 300°C. The general reaction scheme is given in
Scheme 1.3 [132]
Scheme 1.3: The consecutive reactions occurring during methanol dehydration process.
Catalysts that have been investigated include Al2O3, zeolites and mixed metal
oxides [82-84, 86-89]. Among these, the most extensively studied materials are
based on Al2O3 and HZSM-5.
Generally, alumina has a wide range of applications in heterogeneous
catalysis due to its high surface area, acid-base properties, thermal stability and
mechanical strength. Regarding the title reaction, alumina has an additional
advantage: it does not catalyse the consecutive reactions to hydrocarbons because
of its less strong acid sites. The main drawback of alumina is deactivation in the
presence of water. During the reaction, methanol and water compete with each
other for the same sites on alumina. The catalytic activity of alumina reduces due to
the fact that it has a stronger tendency to water than to methanol.
With the purpose to enhance the catalytic activity of these materials, different
kind of modifications have been made. Silica, phosphorous-modified catalysts seem
to show improved catalytic activity, compared to pure alumina. Yaripour et al. [133]
have studied the reaction over silica-modified γ-alumina catalysts. They concluded
that increase of silica loading results in higher surface areas and higher surface
acidity and, thus, the modified alumina exhibits better catalytic performance,
compared to the unmodified one. The same group investigated the methanol
dehydration reaction over phosphorous-modified alumina [134]. They showed that
phosphorus-modified catalysts exhibit a better performance than the untreated γ-
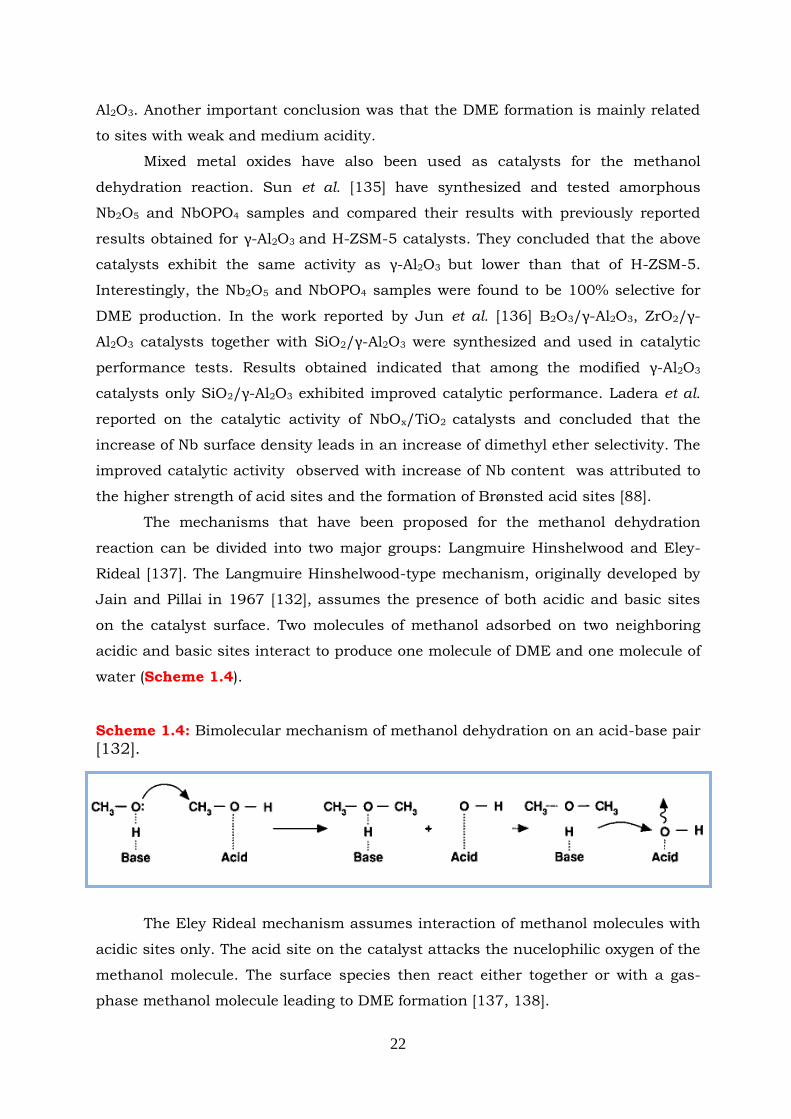
22
Al2O3. Another important conclusion was that the DME formation is mainly related
to sites with weak and medium acidity.
Mixed metal oxides have also been used as catalysts for the methanol
dehydration reaction. Sun et al. [135] have synthesized and tested amorphous
Nb2O5 and NbOPO4 samples and compared their results with previously reported
results obtained for γ-Al2O3 and H-ZSM-5 catalysts. They concluded that the above
catalysts exhibit the same activity as γ-Al2O3 but lower than that of H-ZSM-5.
Interestingly, the Nb2O5 and NbOPO4 samples were found to be 100% selective for
DME production. In the work reported by Jun et al. [136] B2O3/γ-Al2O3, ZrO2/γ-
Al2O3 catalysts together with SiO2/γ-Al2O3 were synthesized and used in catalytic
performance tests. Results obtained indicated that among the modified γ-Al2O3
catalysts only SiO2/γ-Al2O3 exhibited improved catalytic performance. Ladera et al.
reported on the catalytic activity of NbOx/TiO2 catalysts and concluded that the
increase of Nb surface density leads in an increase of dimethyl ether selectivity. The
improved catalytic activity observed with increase of Nb content was attributed to
the higher strength of acid sites and the formation of Brønsted acid sites [88].
The mechanisms that have been proposed for the methanol dehydration
reaction can be divided into two major groups: Langmuire Hinshelwood and Eley-
Rideal [137]. The Langmuire Hinshelwood-type mechanism, originally developed by
Jain and Pillai in 1967 [132], assumes the presence of both acidic and basic sites
on the catalyst surface. Two molecules of methanol adsorbed on two neighboring
acidic and basic sites interact to produce one molecule of DME and one molecule of
water (Scheme 1.4).
Scheme 1.4: Bimolecular mechanism of methanol dehydration on an acid-base pair [132].
The Eley Rideal mechanism assumes interaction of methanol molecules with
acidic sites only. The acid site on the catalyst attacks the nucelophilic oxygen of the
methanol molecule. The surface species then react either together or with a gas-
phase methanol molecule leading to DME formation [137, 138].
23
Zeolites are another widely studied type of solid-acid catalysts used for
methanol dehydration to DME. Among these, the medium-pore ZSM-5 zeolite is of
particular interest [80, 139-141]. Generally, the HZSM-5 catalyst possesses higher
activity than γ-Al2O3 catalyst. In addition, HZSM-5 is more active at low
temperatures [130, 142, 143]. However, unlike alumina, this zeolite accelerates the
consecutive reaction to hydrocarbons at high reaction temperatures (Scheme 1.3).
These differences between zeolite and alumina are explained mainly by the different
acidity of these two materials. The γ-alumina exhibits only Lewis acidity, whereas
HZSM-5 has both Lewis (due to the extra-framework aluminum) and Brønsted
acid sites (aluminum located in the framework of the zeolite). It is believed that
dehydration of methanol may take place over both Lewis acid–base pair and
Brønsted acid–Lewis base pair sites [130]. The nature and strength of the surface
acid sites and the interaction of methanol with these sites determine the reaction
path, yield and selectivity [137]. However, which acid sites catalyze the methanol
dehydration to sole DME is not clear. Some authors have proposed that Brønsted
acidity exhibits higher activity than Lewis acidity [87]. However, other investigators
did not find a direct relationship between the methanol dehydration rate and the
nature of acid sites on HZSM-5 zeolites [144]. Takeguchi et al. [97] studied silica-
alumina catalysts together with H-ZSM5 zeolite and found that water and NH3 are
competitively adsorbed on Lewis acid sites (silica-alumina catalysts), whereas
adsorption of NH3 on Brønsted acid sites (H-ZSM-5) was not much affected by the
presence of water. They concluded that Lewis acid–base pairs are the major active
sites for methanol dehydration at atmospheric pressure, where the partial pressure
of water formed is low and thus water adsorbed on acid sites is negligible. In this
case, the methanol dehydration rate on Brønsted acid sites seems to be much
slower than that on Lewis acid sites. However, under the synthesis gas to DME
(STD) reaction conditions, the partial pressure of the water formed by the
dehydration of methanol is quite high and, as a result, the activity of Lewis acid
sites was found to be suppressed by adsorbed water at lower temperatures. Under
these conditions the Brønsted acid–Lewis base pair sites are the major active sites
for the methanol dehydration reaction.
In addition to the strong acidity of HZSM-5 zeolite, another factor that might
effect the production of DME and may cause rapid catalyst deactivation is the
narrow and slender microporous structure of HZSM-5 zeolite. This may hinder the
fast DME diffusion from the narrow channels of catalyst [86, 145].
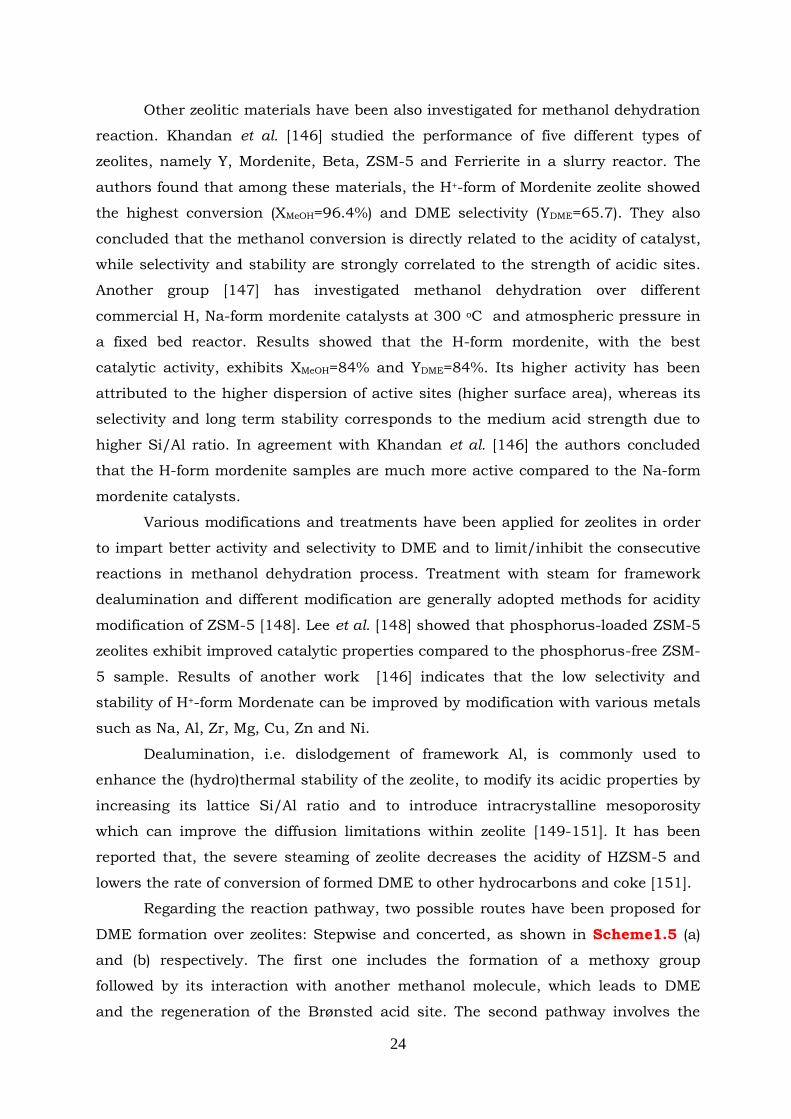
24
Other zeolitic materials have been also investigated for methanol dehydration
reaction. Khandan et al. [146] studied the performance of five different types of
zeolites, namely Y, Mordenite, Beta, ZSM-5 and Ferrierite in a slurry reactor. The
authors found that among these materials, the H+-form of Mordenite zeolite showed
the highest conversion (XMeOH=96.4%) and DME selectivity (YDME=65.7). They also
concluded that the methanol conversion is directly related to the acidity of catalyst,
while selectivity and stability are strongly correlated to the strength of acidic sites.
Another group [147] has investigated methanol dehydration over different
commercial H, Na-form mordenite catalysts at 300 oC and atmospheric pressure in
a fixed bed reactor. Results showed that the H-form mordenite, with the best
catalytic activity, exhibits XMeOH=84% and YDME=84%. Its higher activity has been
attributed to the higher dispersion of active sites (higher surface area), whereas its
selectivity and long term stability corresponds to the medium acid strength due to
higher Si/Al ratio. In agreement with Khandan et al. [146] the authors concluded
that the H-form mordenite samples are much more active compared to the Na-form
mordenite catalysts.
Various modifications and treatments have been applied for zeolites in order
to impart better activity and selectivity to DME and to limit/inhibit the consecutive
reactions in methanol dehydration process. Treatment with steam for framework
dealumination and different modification are generally adopted methods for acidity
modification of ZSM-5 [148]. Lee et al. [148] showed that phosphorus-loaded ZSM-5
zeolites exhibit improved catalytic properties compared to the phosphorus-free ZSM-
5 sample. Results of another work [146] indicates that the low selectivity and
stability of H+-form Mordenate can be improved by modification with various metals
such as Na, Al, Zr, Mg, Cu, Zn and Ni.
Dealumination, i.e. dislodgement of framework Al, is commonly used to
enhance the (hydro)thermal stability of the zeolite, to modify its acidic properties by
increasing its lattice Si/Al ratio and to introduce intracrystalline mesoporosity
which can improve the diffusion limitations within zeolite [149-151]. It has been
reported that, the severe steaming of zeolite decreases the acidity of HZSM-5 and
lowers the rate of conversion of formed DME to other hydrocarbons and coke [151].
Regarding the reaction pathway, two possible routes have been proposed for
DME formation over zeolites: Stepwise and concerted, as shown in Scheme1.5 (a)
and (b) respectively. The first one includes the formation of a methoxy group
followed by its interaction with another methanol molecule, which leads to DME
and the regeneration of the Brønsted acid site. The second pathway involves the
25
simultaneous adsorption and subsequent reaction of two methanol molecules to
give DME [152].
Scheme 1.5: Mechanism proposed for DME formation (a) stepwise and (b) concerted.
1.6.3 Direct Methanol/DME synthesis from CO2
The principle of direct DME production from CO/CO2 is the combination of
methanol synthesis and dehydration process in a single reactor unit. As mentioned
in Section 1.6, the direct process allows higher CO/CO2 conversions and a simple
reactor design that results in much lower DME production costs [153]. Considerable
attention has been given to this process in order to develop a catalytic system that
can be applicable for industry. However, in spite of these efforts, the low CO2
conversion and the low selectivities and yields of desired products achieved so far
are not acceptable for industrial applications.
In Table 1.5 are listed catalytic materials that have been used for direct DME
production by CO2 hydrogenation. It can be observed that in most cases Cu/Zn or
Cu/Zr are the main components of these materials. Modifications of the metal
based component by addition of promoters (Ga, Mn, La, Ce, Y, Si, Ti, V, Pd) have
also been implemented aiming to improve the catalytic activity. Zhang et al.
investigated V-modified CuO–ZnO–ZrO2/HZSM-5 catalysts and reported that V-
modification can efficiently enhance the catalytic performance [154]. In particular,
the CO2 conversion and DME selectivity over CZZV0.5H increase compared to the
unmodified CZZV0HZSM-5 catalyst. Interesting results have been obtained by
Wengui [155], who tried to modify the CuO-ZnO-Al2O3 catalyst by different La
loadings. The addition of La to the CuO-ZnO-Al2O3/HZSM-5 catalyst was found to
(a)
(b)
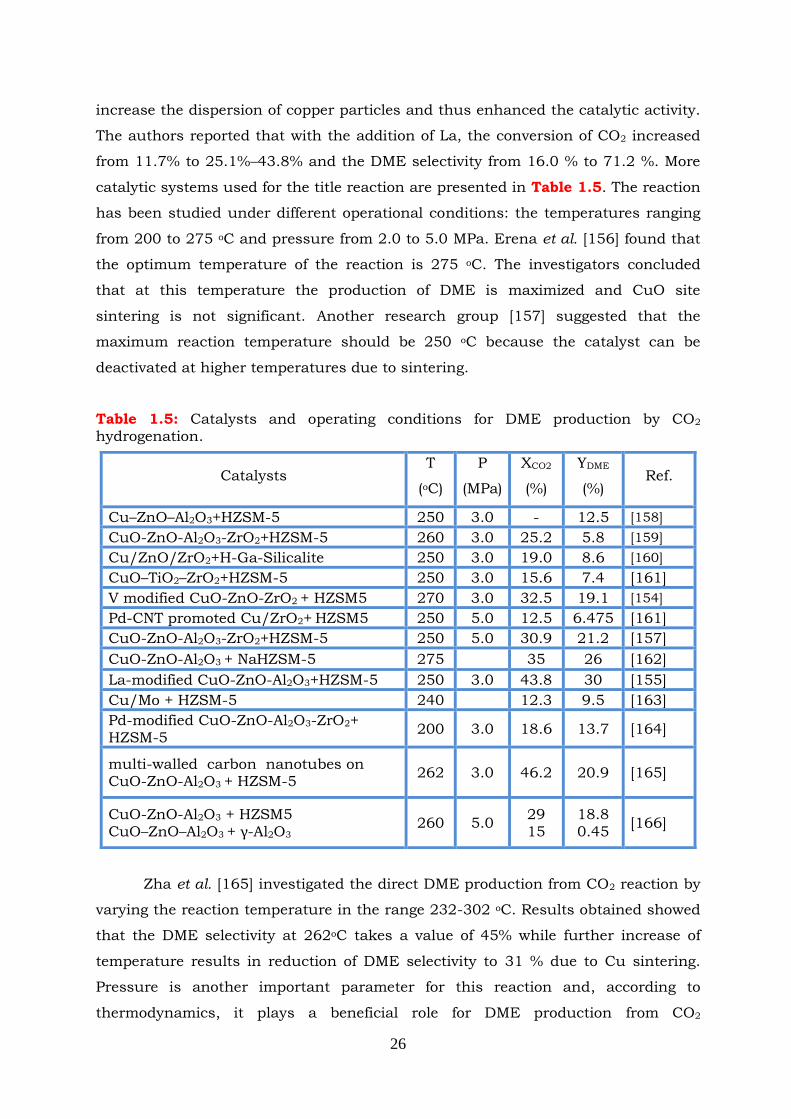
26
increase the dispersion of copper particles and thus enhanced the catalytic activity.
The authors reported that with the addition of La, the conversion of CO2 increased
from 11.7% to 25.1%–43.8% and the DME selectivity from 16.0 % to 71.2 %. More
catalytic systems used for the title reaction are presented in Table 1.5. The reaction
has been studied under different operational conditions: the temperatures ranging
from 200 to 275 oC and pressure from 2.0 to 5.0 MPa. Erena et al. [156] found that
the optimum temperature of the reaction is 275 oC. The investigators concluded
that at this temperature the production of DME is maximized and CuO site
sintering is not significant. Another research group [157] suggested that the
maximum reaction temperature should be 250 oC because the catalyst can be
deactivated at higher temperatures due to sintering.
Table 1.5: Catalysts and operating conditions for DME production by CO2 hydrogenation.
Zha et al. [165] investigated the direct DME production from CO2 reaction by
varying the reaction temperature in the range 232-302 oC. Results obtained showed
that the DME selectivity at 262oC takes a value of 45% while further increase of
temperature results in reduction of DME selectivity to 31 % due to Cu sintering.
Pressure is another important parameter for this reaction and, according to
thermodynamics, it plays a beneficial role for DME production from CO2
Catalysts T
(oC)
P
(MPa)
XCO2
(%)
YDME
(%) Ref.
Cu–ZnO–Al2O3+HZSM-5 250 3.0 - 12.5 [158]
CuO-ZnO-Al2O3-ZrO2+HZSM-5 260 3.0 25.2 5.8 [159]
Cu/ZnO/ZrO2+H-Ga-Silicalite 250 3.0 19.0 8.6 [160]
CuO–TiO2–ZrO2+HZSM-5 250 3.0 15.6 7.4 [161]
V modified CuO-ZnO-ZrO2 + HZSM5 270 3.0 32.5 19.1 [154]
Pd-CNT promoted Cu/ZrO2+ HZSM5 250 5.0 12.5 6.475 [161]
CuO-ZnO-Al2O3-ZrO2+HZSM-5 250 5.0 30.9 21.2 [157]
CuO-ZnO-Al2O3 + NaHZSM-5 275 35 26 [162]
La-modified CuO-ZnO-Al2O3+HZSM-5 250 3.0 43.8 30 [155]
Cu/Mo + HZSM-5 240 12.3 9.5 [163]
Pd-modified CuO-ZnO-Al2O3-ZrO2+ HZSM-5
200 3.0 18.6 13.7 [164]
multi-walled carbon nanotubes on CuO-ZnO-Al2O3 + HZSM-5
262 3.0 46.2 20.9 [165]
CuO-ZnO-Al2O3 + HZSM5 CuO–ZnO–Al2O3 + γ-Al2O3
260 5.0 29 15
18.8 0.45
[166]
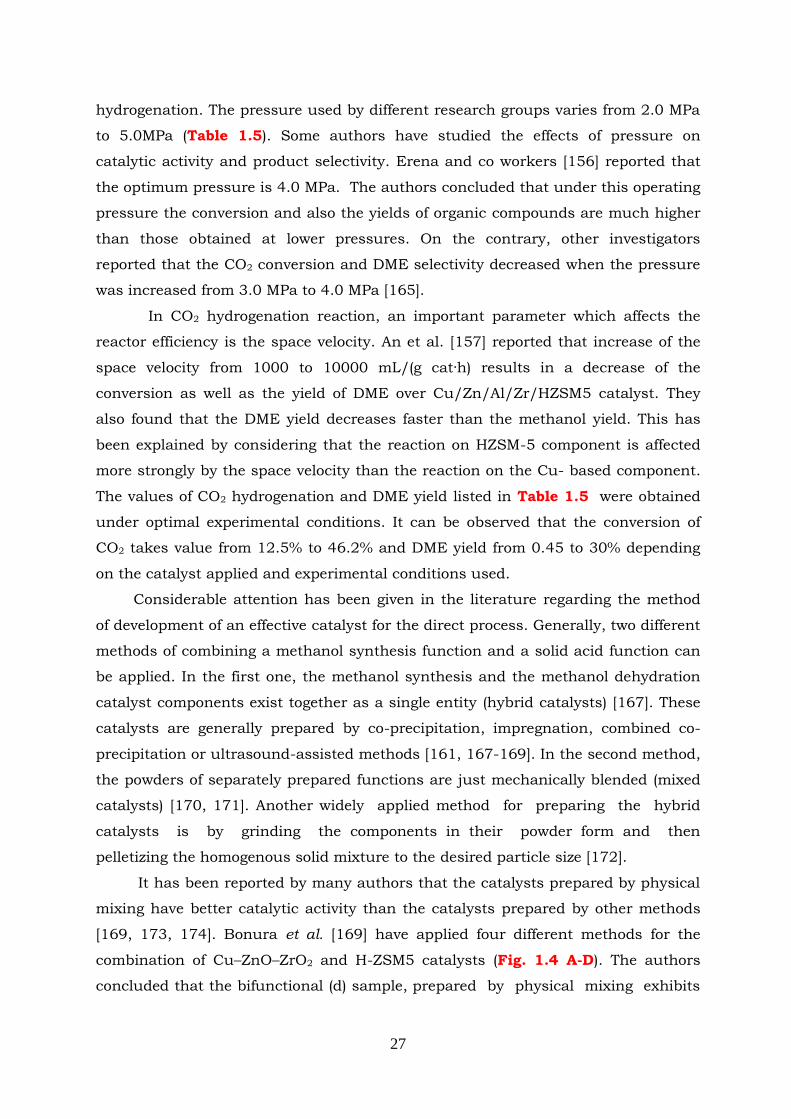
27
hydrogenation. The pressure used by different research groups varies from 2.0 MPa
to 5.0MPa (Table 1.5). Some authors have studied the effects of pressure on
catalytic activity and product selectivity. Erena and co workers [156] reported that
the optimum pressure is 4.0 MPa. The authors concluded that under this operating
pressure the conversion and also the yields of organic compounds are much higher
than those obtained at lower pressures. On the contrary, other investigators
reported that the CO2 conversion and DME selectivity decreased when the pressure
was increased from 3.0 MPa to 4.0 MPa [165].
In CO2 hydrogenation reaction, an important parameter which affects the
reactor efficiency is the space velocity. An et al. [157] reported that increase of the
space velocity from 1000 to 10000 mL/(g cat·h) results in a decrease of the
conversion as well as the yield of DME over Cu/Zn/Al/Zr/HZSM5 catalyst. They
also found that the DME yield decreases faster than the methanol yield. This has
been explained by considering that the reaction on HZSM-5 component is affected
more strongly by the space velocity than the reaction on the Cu- based component.
The values of CO2 hydrogenation and DME yield listed in Table 1.5 were obtained
under optimal experimental conditions. It can be observed that the conversion of
CO2 takes value from 12.5% to 46.2% and DME yield from 0.45 to 30% depending
on the catalyst applied and experimental conditions used.
Considerable attention has been given in the literature regarding the method
of development of an effective catalyst for the direct process. Generally, two different
methods of combining a methanol synthesis function and a solid acid function can
be applied. In the first one, the methanol synthesis and the methanol dehydration
catalyst components exist together as a single entity (hybrid catalysts) [167]. These
catalysts are generally prepared by co-precipitation, impregnation, combined co-
precipitation or ultrasound-assisted methods [161, 167-169]. In the second method,
the powders of separately prepared functions are just mechanically blended (mixed
catalysts) [170, 171]. Another widely applied method for preparing the hybrid
catalysts is by grinding the components in their powder form and then
pelletizing the homogenous solid mixture to the desired particle size [172].
It has been reported by many authors that the catalysts prepared by physical
mixing have better catalytic activity than the catalysts prepared by other methods
[169, 173, 174]. Bonura et al. [169] have applied four different methods for the
combination of Cu–ZnO–ZrO2 and H-ZSM5 catalysts (Fig. 1.4 A-D). The authors
concluded that the bifunctional (d) sample, prepared by physical mixing exhibits
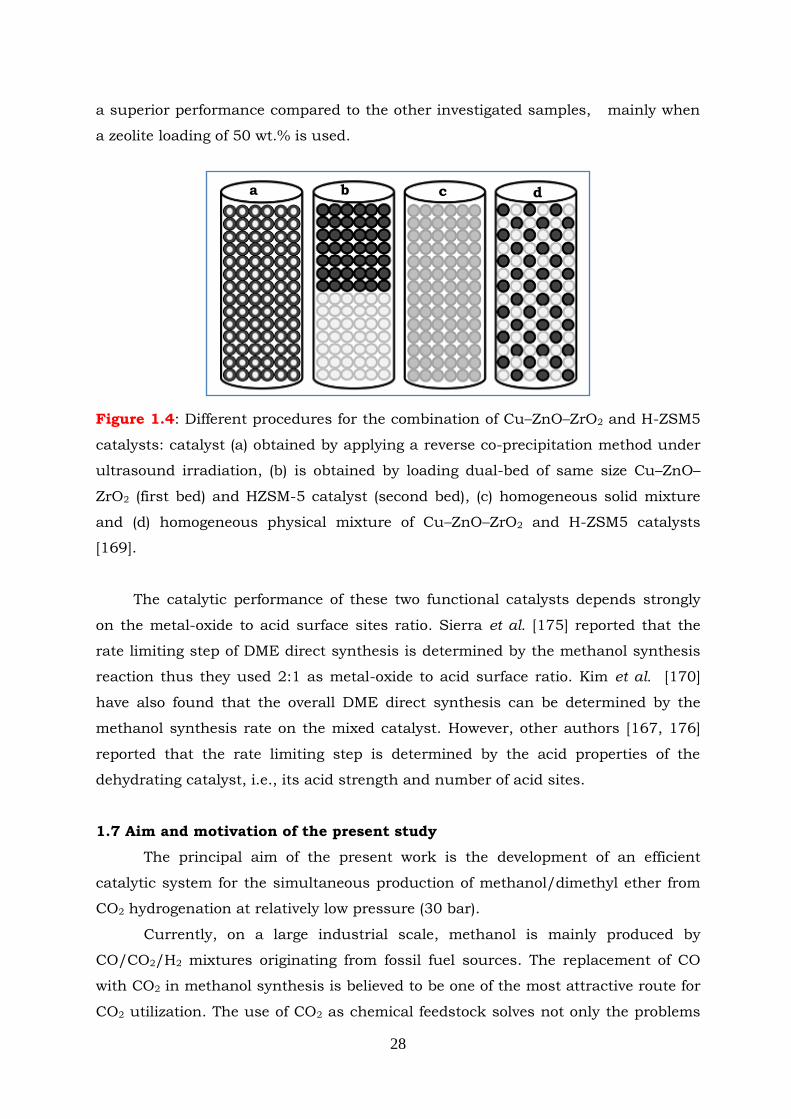
28
a superior performance compared to the other investigated samples, mainly when
a zeolite loading of 50 wt.% is used.
Figure 1.4: Different procedures for the combination of Cu–ZnO–ZrO2 and H-ZSM5
catalysts: catalyst (a) obtained by applying a reverse co-precipitation method under
ultrasound irradiation, (b) is obtained by loading dual-bed of same size Cu–ZnO–
ZrO2 (first bed) and HZSM-5 catalyst (second bed), (c) homogeneous solid mixture
and (d) homogeneous physical mixture of Cu–ZnO–ZrO2 and H-ZSM5 catalysts
[169].
The catalytic performance of these two functional catalysts depends strongly
on the metal-oxide to acid surface sites ratio. Sierra et al. [175] reported that the
rate limiting step of DME direct synthesis is determined by the methanol synthesis
reaction thus they used 2:1 as metal-oxide to acid surface ratio. Kim et al. [170]
have also found that the overall DME direct synthesis can be determined by the
methanol synthesis rate on the mixed catalyst. However, other authors [167, 176]
reported that the rate limiting step is determined by the acid properties of the
dehydrating catalyst, i.e., its acid strength and number of acid sites.
1.7 Aim and motivation of the present study
The principal aim of the present work is the development of an efficient
catalytic system for the simultaneous production of methanol/dimethyl ether from
CO2 hydrogenation at relatively low pressure (30 bar).
Currently, on a large industrial scale, methanol is mainly produced by
CO/CO2/H2 mixtures originating from fossil fuel sources. The replacement of CO
with CO2 in methanol synthesis is believed to be one of the most attractive route for
CO2 utilization. The use of CO2 as chemical feedstock solves not only the problems
a b d
A
c
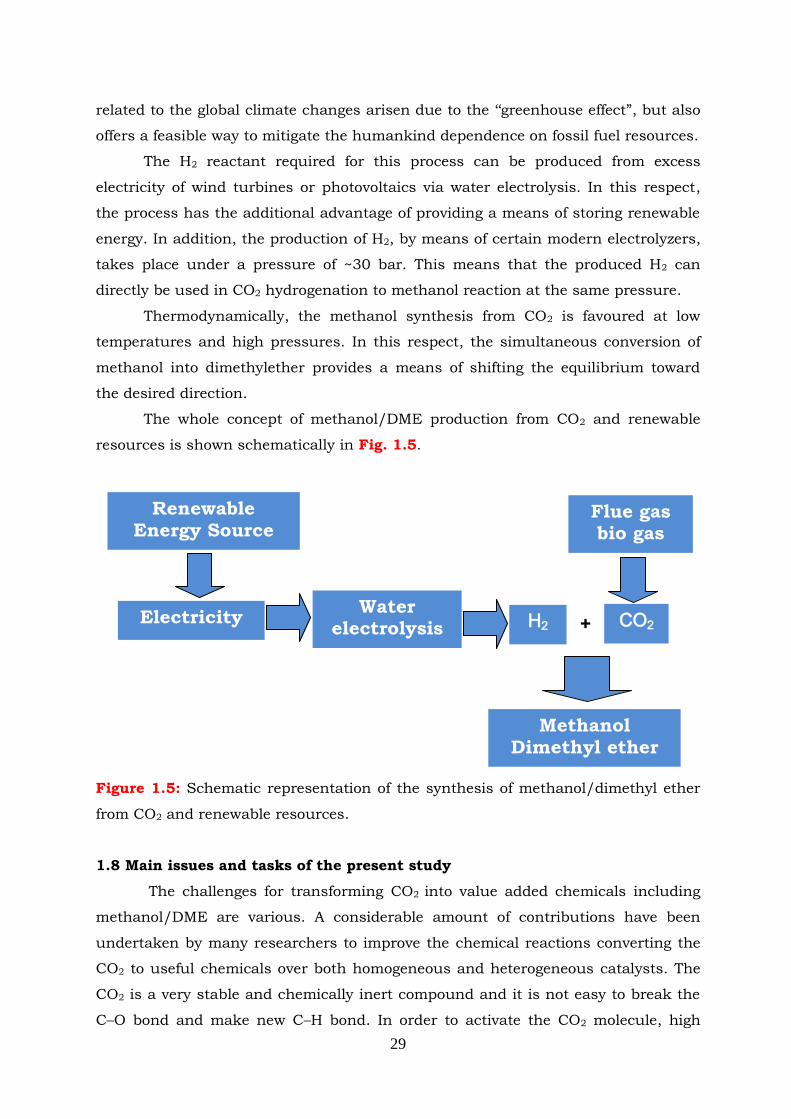
29
related to the global climate changes arisen due to the „„greenhouse effect”, but also
offers a feasible way to mitigate the humankind dependence on fossil fuel resources.
The H2 reactant required for this process can be produced from excess
electricity of wind turbines or photovoltaics via water electrolysis. In this respect,
the process has the additional advantage of providing a means of storing renewable
energy. In addition, the production of H2, by means of certain modern electrolyzers,
takes place under a pressure of ~30 bar. This means that the produced H2 can
directly be used in CO2 hydrogenation to methanol reaction at the same pressure.
Thermodynamically, the methanol synthesis from CO2 is favoured at low
temperatures and high pressures. In this respect, the simultaneous conversion of
methanol into dimethylether provides a means of shifting the equilibrium toward
the desired direction.
The whole concept of methanol/DME production from CO2 and renewable
resources is shown schematically in Fig. 1.5.
Figure 1.5: Schematic representation of the synthesis of methanol/dimethyl ether
from CO2 and renewable resources.
1.8 Main issues and tasks of the present study
The challenges for transforming CO2 into value added chemicals including
methanol/DME are various. A considerable amount of contributions have been
undertaken by many researchers to improve the chemical reactions converting the
CO2 to useful chemicals over both homogeneous and heterogeneous catalysts. The
CO2 is a very stable and chemically inert compound and it is not easy to break the
C–O bond and make new C–H bond. In order to activate the CO2 molecule, high
Renewable Energy Source
Electricity Water
electrolysis
Flue gas bio gas
H2 CO2
Methanol Dimethyl ether
+
30
reaction temperatures are required. However, thermodynamically, the methanol
synthesis is not favorable at high reaction temperatures. In addition, the catalyst
deactivation is highly possible at high temperatures. Hence, one of the key issues is
the development of an efficient catalyst with high stability and activity for CO2
hydrogenation at relatively low reaction temperatures.
The second important issue in this process is the low productivity of
methanol/DME. There is a strong competition between the methanol synthesis and
the reverse-water-gas shift (RWGS) reaction that take place during CO2
hydrogenation reaction. Thus, in bi-functional catalysts, the metallic part should
exhibit high selectivity to methanol and simultaneously low selectivity to CO formed
through the RWGS reaction.
The next problematic part of the process is the excess of water present under
conditions of simultaneous production of methanol/DME from CO2 hydrogenation.
The presence of water is not evitable in methanol production from CO2, methanol
dehydration to DME and RWGS reactions. Hence, both methanol synthesis and
methanol dehydration components in the bi-functional catalyst must be stable
under these reaction conditions.
By taking into account all issues mentioned above, the present research work
addresses the following major tasks.
A detailed thermodynamic analysis of the title reaction with a purpose to find
the optimum conditions for running the catalytic experiments (Chapter 2).
Investigation of the methanol dehydration to dimethyl ether reaction over
materials with different physicochemical characteristics (aluminas and zeolites) with
the purpose to develop a suitable acid catalyst that could be then combined with a
methanol synthesis catalyst and used for the direct conversion of CO2/H2 into
methanol/dimethyl ether (Chapter 4 and 5).
Investigation of CO2 hydrogenation to methanol reaction over copper based
catalysts. Optimization of experimental conditions (temperature, pressure, space
velocity, CO2:H2 ratio) (Chapter 6).
Development of bi-functional catalysts by combining a methanol synthesis
and a methanol dehydration catalyst for the direct conversion of CO2/H2 to
methanol/dimethyl ether (Chapter 6).
31
1.9 References
[1] S. Lee, J.G. Speight, S.K. Loyalka, "Handbook of Althernative Fuel Technologies",
CRC Press, Taylor & Francis Group LLC, 2007.
[2] G.A. Olah, A. Goeppert, G.K.S. Prakash, "Beyond Oil and Gas: The Methanol
Economy", WILEY-VCH, 2009.
[3] T.H. Fleisch, A. Basu, R.A. Sills, Journal of Natural Gas Science and Engineering 9
(2012) 94-107.
[4] W.A. Bizzo, B.d. Calan, R. Myers, Energy for Sustainable Development VIII (2004)
60-67.
[5] T.A. Semelsberger, R.L. Borup, H.L. Greene, Journal of Power Sources 156 (2006)
497-511.
[6] D. Cipolat, N. Bhana, Fuel Processing Technology 90 (2009) 1107-1113.
[7] C. Arcoumanis, C. Bae, R. Crookes, E. Kinoshita, Fuel 87 (2008) 1014-1030.
[8] C. Liang, C. Ji, X. Liu, Applied Energy 88 (2011) 3704-3711.
[9] M.C. Lee, S.B. Seo, J.H. Chung, Y.J. Joo, D.H. Ahn, Fuel 88 (2009) 657-662.
[10] E. Sher (Ed.), "Handbook of Air Pollution from Internal Combustion Engines.
Pollutant Formation and Control", Academic Press, United Kingdom Edition, 1998.
[11] S.H. Park, C.S. Lee, Progress in Energy and Combustion Science 39 (2013) 147-168.
[12] Z. Lei, Z. Zou, C. Dai, Q. Li, B. Chen, Chemical Engineering Science 66 (2011) 3195-
3203.
[13] S. Xu, Y. Wang, X. Zhang, X. Zhen, C. Tao, Applied Energy 94 (2012) 1-12.
[14] S.H. Yoon, J.P. Cha, C.S. Lee, Fuel Processing Technology 91 (2010) 1364-1372.
[15] E.G. Giakoumis, C.D. Rakopoulos, A.M. Dimaratos, D.C. Rakopoulos, Renewable
and Sustainable Energy Reviews 17 (2013) 170-190.
[16] C.A. Daly, J.M. Simmie, J. Wurmel, N. Djebaili, C. Paillard, Combustion and Flame
125 (2001) 1329-1340.
[17] A.C. Hansen, Q. Zhang, P.W.L. Lyne, Bioresource Technology 96 (2005) 277-285.
[18] I. Gravalos, D. Moshou, T. Gialamas, P. Xyradakis, D. Kateris, Z. Tsiropoulos,
Renewable Energy 50 (2013) 27-32.
[19] R.K. Niven, Renewable and Sustainable Energy Reviews 9 (2005) 535-555.
[20] W. Ying, L. Genbao, Z. Wei, Z. Longbao, Fuel Processing Technology 89 (2008)
1272-1280.
[21] M.Y. Kim, S.H. Yoon, B.W. Ryu, C.S. Lee, Fuel 87 (2008) 2779-2786.
[22] I.M. Sivebaek, J. Jakobsen, Tribology International 40 (2007) 652-658.
[23] K.K. Gupta, A. Rehman, R.M. Sarviya, Renewable and Sustainable Energy Reviews
14 (2010) 2946-2955.
[24] K. Tanaka, K. Nishida, W. Akizuki, Mitsubishi Heavy Industries Technical Review 46
(2009) 6-12.
[25] M.C. Lee, S.B. Seo, J.H. Chung, Y.J. Joo, D.H. Ahn, Fuel 87 (2008) 2162-2167.
[26] M.C. Lee, Y. Yoon, Fuel 102 (2012) 823-830.
[27] E. Rehfuess, Fuel for life: household energy and health, "World Health Organization",
2006.
[28] A. Baudin, H.-O. Nordvall, Biomass and Bioenergy 35 (2011) S167-S174.
[29] I. Sezer, International Journal of Thermal Sciences 50 (2011) 1594-1603.
[30] K.C. Tokay, T. Dogu, G. Dogu, Chemical Engineering Journal 184 (2012) 278-285.
[31] K.B. Kabir, K. Hein, S. Bhattacharya, Computers and Chemical Engineering 48
(2013) 96-104.
[32] G.A. Olah, A. Goeppert, G.K.S. Prakash, J. Org. Chem 74 (2009) 487-498.
32
[33] M. Marchionna, R. Patrini, D. Sanfilippo, G. Migliavacca, Fuel Processing
Technology 89 (2008) 1255-1261.
[34] M.J. Molina, F.S. Rowland, Nature 249 (1974) 810-812.
[35] F.S. Rowland, Environ Impact Assess Rev 10 (1990) 359-370.
[36] http://ozone.unep.org/new_site/en/montreal_protocol.php.
[37] L.S. Ruzer, N.H. Harley (Eds.), "Aerosols handbook: measurement, dosimetry, and
health effects", CRC Press, 2005.
[38] D. Minić (Ed.), "Hydrogen Energy: Challenges and Perspectives", InTech 2012.
[39] C. Ledesma, J. Llorca, Chemical Engineering Journal 154 (2009) 281-286.
[40] K. Faungnawakij, Y. Tanaka, N. Shimoda, T. Fukunaga, R. Kikuchi, K. Eguchi,
Applied Catalysis B:Environmental 74 (2007) 144-151.
[41] S.-J. Park, D.-W. Lee, C.-Y. Yu, K.-Y. Lee, K.-H. Lee, Journal of Membrane Science
318 (2008) 123-128.
[42] T. Shishido, Y. Yamamoto, H. Morioka, K. Takaki, K. Takehira, Applied Catalysis A:
General 263 (2004) 249-253
[43] J.-P. Shen, C. Song, Catalysis Today 77 (2002) 89-98.
[44] K. Takeishi, H. Suzuki, Applied Catalysis A: General 260 (2004) 111-117.
[45] T.A. Semelsberger, K.C. Ott, R.L. Borup, H.L. Greene, Applied Catalysis
B:Environmental 65 (2006) 291-300.
[46] T. Matsumoto, T. Nishiguchi, H. Kanai, K. Utani, Y. Matsumura, S. Imamura,
Applied Catalysis A: General 276 (2004) 267-273.
[47] Y. Tanaka, R. Kikuchi, T. Takeguchi, K. Eguchi, Applied Catalysis B: Environmental
57 (2005) 211-222.
[48] T. Fukunaga, N. Ryumon, S. Shimazu, Applied Catalysis A: General 348 (2008) 193-
200.
[49] A. Gazsi, I. Ugrai, F. Solymosi, Applied Catalysis A: General 391 (2011) 360-366.
[50] Q. Zhang, X. Li, K. Fujimoto, K. Asami, Applied Catalysis A: General 288 (2005)
169-174.
[51] S. Park, H. Kim, B. Choi, Journal of Industrial and Engineering Chemistry 16 (2010)
734-740.
[52] V.V. Galvita, G.L. Semin, V.D. Belyaev, T.M. Yurieva, V.A. Sobyanin, Applied
Catalysis A: General 216 (2001) 85-90.
[53] C. Su, W. Wang, R. Ran, T. Zheng, Z. Shao, International Journal of Hydrogen
Energy 37 (2012) 6844-6852.
[54] W. Yuan, B. Zhou, J. Deng, Y. Tang, Z. Zhang, Z. Li, International Journal of
Hydrogen Energy 39 (2014) 6689-6704.
[55] M.Z.F. Kamarudin, S.K. Kamarudin, M.S. Masdar, W.R.W. Daud, International
Journal of Hydrogen Energy 38 (2013) 9438-9453.
[56] G. Kerangueven, C. Coutanceau, E. Sibert, J.-M. L´eger, C. Lamy, Journal of Power
Sources 157 (2006) 318-324.
[57] J.-Y. Im, B.-S. Kim, H.-G. Choi, S.M. Cho, Journal of Power Sources 179 (2008) 301-
304.
[58] J.-H. Yoo, H.-G. Choi, C.-H. Chung, S.M. Cho, Journal of Power Sources 163 (2006)
103-106.
[59] H. Liu, E. Iglesia, J. Phys. Chem. B 107 (2003) 10840-10847.
[60] Z. Qingde, T. Yisheng, Y. Caihong, L. Yuqin, H. Yizhuo, Chinese Journal of Catalysis
27 (2006) 916-920.
[61] G.J. Sunley, D.J. Watson, Catalysis Today 58 (2000) 293-307.
[62] M.V. Luzgin, M.S. Kazantsev, G.G. Volkova, W. Wang, A.G. Stepanov, Journal of
Catalysis 277 (2011) 72-79.
33
[63] L. Junlong, X. Huifu, H. Xiumin, W. Pei-Hao, H. Shing-Jong, L. Shang-Bin, S.
Wenjie, Chinese Journal of Catalysis 31 (2010) 729-738.
[64] M.S. Kazantsev, M.V. Luzgin, G.G. Volkova, A.G. Stepanov, Journal of Catalysis 291
(2012) 9-16.
[65] P. Cheung, A. Bhan, G.J. Sunley, D.J. Law, E. Iglesia, Journal of Catalysis 245 (2007)
110-123.
[66] A. Bhan, A.D. Allian, G.J. Sunley, D.J. Law, E. Iglesia, J. Am. Chem. Soc. 129 (2007)
4919-4924.
[67] H. Liu, P. Cheung, E. Iglesia, Journal of Catalysis 217 (2003) 222-232.
[68] Y. Zhang, X. San, N. Tsubaki, Y. Tan, J. Chen, Ind. Eng. Chem. Res. 49 (2010) 5485–
5488.
[69] http://www.icis.com/Articles/2011/03/28/9446992/petrochemicals-global-
opportunities-for-methanol.html.
[70] S. Khan (Ed.), "Fossil Fuel and The Environment", InTech, 2012.
[71] S. Solomon, D. Qin, M. Manning, M. Marquis, K. Averyt, M.M.B. Tignor, H.L.
Miller, Z. Chen (Eds.), "Climate Change -The Physical Science Basis", Cambridge
University Press, 2007.
[72] X. Wu, S. Hu, S. Mo, Journal of Cleaner Production 54 (2013) 115-124.
[73] D.A. Good, J.S. Francisco, A.K. Jain, D.J. Wuebbles, Journal of Geophysical Research
103 (1998) 28.181- 128.186.
[74] J.S. Fuglestvedt, T.K. Berntsen, O. Godal, R. Sausen, K.P. Shine, T. Skodvin, Climatic
Change 58 (2003) 267-331.
[75] M. Naito, C. Radcliffe, Y. Wada, T. Hoshino, X. Liu, M. Arai, M. Tamura, Journal of
Loss Prevention in the Process Industries 18 (2005) 469-473.
[76] F. Meshkini, M. Taghizadeh, M. Bahmani, Fuel 89 (2010) 170-175.
[77] F. Arena, G. Mezzatesta, G. Zafarana, G. Trunfio, F. Frusteri, L. Spadaro, Journal of
Catalysis 300 (2013) 141-151.
[78] C. Li, X. Yuan, K. Fujimoto, Applied Catalysis A: General 469 (2014) 306-311.
[79] A. Karelovic, A. Bargibant, C. Fernández, P. Ruiz, Catalysis Today 197 (2012) 109-
118.
[80] S. Hosseini, M. Taghizadeh, A. Eliassi, Journal of Natural Gas Chemistry 21 (2012)
344-351.
[81] M. Mollavali, F. Yaripour, S. Mohammadi-Jam, H. Atashi, Fuel Processing
Technology 90 (2009) 1093-1098.
[82] Z. Hosseini, M. Taghizadeh, F. Yaripour, Journal of Natural Gas Chemistry 20 (2011)
128-134.
[83] F. Raoof, M. Taghizadeh, A. Eliassi, F. Yaripour, Fuel 87 (2008) 2967-2971.
[84] A.R. Keshavarz, M. Rezaei, F. Yaripour, J. Nat. Gas Chem. 20 (2011) 334-338.
[85] L. Travalloni, A.C.L. Gomes, A.B. Gaspar, M.A.P.d. Silva, Catalysis Today 133-135
(2008) 406-412.
[86] Q. Tang, H. Xu, Y. Zheng, J. Wang, H. Li, J. Zhang, Applied Catalysis A: General
413-414 (2012) 36-42.
[87] Y. Fu, T. Hong, J. Chen, A. Auroux, J. Shen, Thermochim. Acta 434 (2005) 22-26.
[88] R. Ladera, E. Finocchio, S. Rojas, J.L.G. Fierro, M. Ojeda, Catalysis Today 192
(2012) 136-143.
[89] K. Lertjiamratn, P. Praserthdam, M. Arai, J. Panpranot, Applied Catalysis A: General
378 (2010) 119-123.
[90] K. Omata, Y. Watanabe, T. Umegaki, G. Ishiguro, M. Yamada, Fuel 81 (2002) 1605-
1609.
34
[91] M.-H. Zhang, Z.-M. Liu, G.-D. Lin, H.-B. Zhang, Applied Catalysis A: General 451
(2013) 28-35.
[92] A. Hadipour, M. Sohrabi, Chemical Engineering Journal 137 (2008) 294-301.
[93] S. Lee, A. Sardesai, Top. Catal. 32 (2005) 197-207.
[94] K. Pinkaew, G. Yang, T. Vitidsant, Y. Jin, C. Zeng, Y. Yoneyama, N. Tsubaki, Fuel
111 (2013).
[95] D. Mao, W. Yang, J. Xia, B. Zhang, G. Lu, Journal of Molecular Catalysis A:
Chemical 250 (2006) 138-144.
[96] V.M. Mysov, K.G. Ione, Chem. Sustain. Develop. 11 (2003) 197-207.
[97] T. Takeguchi, K.-I. Yanagisawa, T. Inui, M. Inoue, Applied Catalysis A: General 192
(2000) 201-209.
[98] L. Wang, Y. Qi, Y. Wei, D. Fang, S. Meng, Z. Liu, Catal. Lett. 106 (2006) 61-66.
[99] http://www.methanol.org/Methanol-Basics.aspx, 2014.
[100] A. Riaz, G. Zahdi, J.J. Klemes, Journal of Cleaner Production 57 (2013) 19-37.
[101] K.C. Waugh, Catalysis Today 15 (1992) 51-75.
[102] J.C.J. Bart, R.P.A. Sneeden, Catalysis Today 2 (1987) 1-124.
[103] J.A. Anderson, M.F. Garcia (Eds.), "Supported Metals in Catalysis" Catalytic Science
Series, Vol 5, Imperial College Press, London, 2005.
[104] M.S. Spencer, Topics in Catalysis 8 (1999) 259-266.
[105] F. Arena, G. Italiano, K. Barbera, S. Bordiga, G. Bonura, L. Spadaro, F. Frusteri,
Applied Catalysis A: General 350 (2008) 16-23.
[106] J. Hagen, "Industrial Catalysis", WILEY-VCH, Germany, 2006.
[107] I. Wender, Fuel Processing Technology 48 (1996) 189-297.
[108] G.C. Chinchen, P.J. Denny, J.R. Jennings, M.S. Spencer, K.C. Waugh, Applied
Catalysis 36 (1988) 1-65.
[109] M.V. Twigg (Ed.), "Catalyst Handbook" Second edition, Wolfe Publishing Ltd,
Frome, England, 1989.
[110] F. Studt, I. Sharafutdinov, F. Abild-Pedersen, C.F. Elkjær, J.S. Hummelshøj, S. Dahl,
I. Chorkendorff, J.K. Nørskov, Nature Chemistry 6 (2014) 320-324.
[111] A.Y. Rozovskii, Kinet. Catal. 21 (1980) 78-87.
[112] A. Coteron, A.N. Hayhurst, Chemical Engineering Science 49 (1994) 209-221.
[113] Y. Yang, C.A. Mims, D.H. Mei, C.H.F. Peden, C.T. Campbell, Journal of Catalysis
298 (2013) 10-17.
[114] I. Chorkendorff, J.W. Niemantsverdriet, "Concepts of Modern Catalysis and Kinetics",
WILEY-VCH Verlag GmbH & Co. KGaA, Weinheim, 2003.
[115] W. Wang, S. Wang, X. Ma, J. Gong, Chem. Soc. Rev. 40 (2011) 3703-3727.
[116] P.L. Spath, D.C. Dayton, Preliminary Screening-Technical and Economic Assessment
of Synthesis Gas to Fuels and Chemicals with Emphasis on the Potential for Biomass-
Derived Syngas, Technical Report, National Renewable Energy Laboratory, 2003.
[117] N.A.M. Razali, K.T. Lee, S. Bhatia, A.R. Modamed, Renewable and Sustainable
Energy Reviews 16 (2012) 4951-4964.
[118] M. Kurtz, N. Bauer, C. Buscher, H. Wilmer, O. Hinrichsen, R. Becker, S. Rabe, K.
Merz, M. Driess, R.A. Fischer, M. Muhler, Catal. Lett. 92 (2004) 49-52.
[119] R. Burch, S.E. Golunski, M.S. Spencer, J. Chem. Soc. Faraday Trans. 86 (1990) 2683-
2691.
[120] M. Kurtz, H. Wilmer, T. Genger, O. Hinrichsen, M. Muhler, Catalysis Letters 86
(2003) 77-80.
[121] M.V. Twigg, M.S. Spencer, Applied Catalysis A: General 212 (2001) 161-174.
[122] O. Deutschmann, H. Knozinger, K. Kochloefl, T. Turek, "Heterogeneous Catalysis
and Solid Catalysts", Wiley-VCH Verlag GmbH & Co. KGaA, Weinheim, 2009.
35
[123] J.A. Rodriguez, J.Y. Kim, J.C. Hanson, M. Pe´rez, A.I. Frenkel, Catal. Lett. 85 (2003)
247-254.
[124] F. Wang, Y. Liu, Y. Gan, W. Ding, W. Fang, Y. Yang, Fuel Processing Technology
110 (2013) 190-196.
[125] M. Rep, R.L. Cornelissen, S. Clevers, "Methanol catalyst poisons", Report IND07002,
CHRISGAS, 2007.
[126] I. Ganesh, Renewable and Sustainable Energy Reviews 31 (2014) 221-257.
[127] F. Arena, K. Barbera, G. Italiano, G. Bonura, L. Spadaro, F. Frusteri, Journal of
Catalysis 249 (2007) 185-194.
[128] P. Gao, F. Li, F. Xiao, N. Zhao, N. Sun, W. Wei, L. Zhong, Y. Sun, Catal. Sci.
Technol. 2 (2012) 1447-1454.
[129] H. Ban, C. Li, K. Asami, K. Fujimoto, Catalysis Communications 54 (2014) 50-54.
[130] Y. Tavan, S.H. Hosseini, M. Ghavipour, M.R.K. Nikou, A. Shariati, Chemical
Engineering and Processing 73 (2013) 144-150.
[131] S. Alamolhoda, M. Kazemeini, A. Zaherian, M.R. Zakerinasab, Journal of Industrial
and Engineering Chemistry 18 (2012) 2059-2068.
[132] J.J. Spivey, Chem. Eng. Comm. 110 (1991) 123-142.
[133] F. Yaripour, F. Baghaei, I. Schmidt, J. Perregaard, Catalysis Communications 6 (2005)
147-152.
[134] F. Yaripour, F. Baghaei, I. Schmidt, J. Perregaard, Catalysis Communications 6 (2005)
542-549.
[135] Q. Sun, Y. Fu, H. Yang, A. Auroux, J. Shen, Journal of Molecular Catalysis A:
Chemical 275 (2007) 183-193.
[136] K.-W. Jun, H.-S. Lee, H.-S. Roh, S.-E. Park, Bull. Korean Chem. Soc. 23 (2002) 803-
806.
[137] S. Bhattacharya, K.B. Kabir, K. Hein, Progress in Energy and Combustion Science 39
(2013) 577-605.
[138] A.R. McInroy, D.T. Lundie, J.M. Winfield, C.C. Dudman, P. Jones, D. Lennon,
Langmuir 21 (2005) 11092-11098.
[139] V. Vishwanathan, K.-W. Jun, J.-W. Kim, H.-S. Roh, Applied Catalysis A: General 276
(2004) 251-255.
[140] S.D. Kim, S.C. Baek, Y.-J. Lee, K.-W. Jun, M.J. Kim, I.S. Yoo, Applied Catalysis A:
General 309 (2006) 139-143.
[141] S. Hassanpour, F. Yaripour, M. Taghizadeh, Fuel Processing Technology 91 (2010)
1212-1221.
[142] M. Ghavipour, R.M. Behbahani, Journal of Industrial and Engineering Chemistry 20
(2014) 1942-1951.
[143] L. Vanoye, A. Favre-Réguillon, P. Munno, J.F. Rodríguez, S. Dupuy, S. Pallier, I.
Pitault, C.D. Bellefon, Catalysis Today 215 (2013) 239-242.
[144] D. Mao, W. Yang, J. Xia, B. Zhang, Q. Song, Q. Chen, Journal of Catalysis 230
(2005) 140-149.
[145] A.A. Rownaghi, F. Rezaei, M. Stante, J. Hedlund, Applied Catalysis B: Environmental
119-120 (2012) 56-61.
[146] N. Khandan, M. Kazemeini, M. Aghaziarati, Applied Catalysis A: General 349 (2008)
6-12.
[147] G.R. Moradi, F. Yaripour, P. Vale-Sheyda, Fuel Processing Technology 91 (2010)
461-468.
[148] Y.-J. Lee, J.M. Kim, J.W. Bae, C.-H. Shin, K.-W. Jun, Fuel 88 (2009) 1915-1921.
[149] J.C. Groen, J.A. Moulijn, J. Perez-Ramırez, Microporous and Mesoporous Materials
87 (2005) 153-161.
36
[150] M.-C. Silaghi, C. Chizallet, P. Raybaud, Microporous and Mesoporous Materials 191
(2014) 82-96.
[151] S.M.T. Almutairi, B. Mezari, E.A. Pidko, P.C.M.M. Magusin, E.J.M. Hensen, Journal
of Catalysis 307 (2013) 194-203.
[152] I.I. Ivanova, Y.G. Kolyagin, Chem. Soc. Rev. 39 (2010) 5018-5050.
[153] Z. Azizi, M. Rezaeimanesh, T. Tohidian, M.R. Rahimpour, Chemical Engineering and
Processing 82 (2014) 150-172.
[154] Y. Zhang, D. Li, Y. Zhang, Y. Cao, S. Zhang, K. Wang, F. Ding, J. Wu, Catalysis
Communications 55 (2014) 49-52.
[155] G. Wengui, W. Hua, W. Yuhao, G. Wei, J. Miaoyao, Journal of Rare Earths 31 (2013)
470-476.
[156] J. Erena, I. Sierra, A.T. Aguayo, A. Ateka, M. Olazar, J. Bilbao, Chemical
Engineering Journal 174 (2011) 660-667.
[157] X. An, Y.-Z. Zuo, Q. Zhang, D.-z. Wang, J.-F. Wang, Ind. Eng. Chem. Res. 47 (2008)
6547-6554.
[158] J.-L. Tao, K.-W. Jun, K.-W. Lee, Applied Organometallic Chemistry 15 (2001) 105-
108.
[159] Y. Zhao, J. Chen, J. Zhang, Journal of Natural Gas Chemistry 16 (2007) 389-392.
[160] Y.-K. Park, S.-W. Baek, S.-K. Ihm, Fuel Chemistry Division Preprints 47 (2002) 293-
294.
[161] S. Wang, D. Mao, X. Guo, G. Wu, G. Lu, Catalysis Communications 10 (2009) 1367-
1370.
[162] J. Erena, R. Garona, J.M. Arandes, A.T. Aguayo, J. Bilbao, Catalysis Today 107-108
(2005) 467-473.
[163] G.X. Qi, J.H. Fei, X.M. Zheng, Z.Y. Hou, Catal. Lett. 72 (2001) 121-124.
[164] K. Sun, W. Lu, M. Wang, X. Xu, Catalysis Communications 5 (2004) 367-370.
[165] F. Zha, H. Tian, J. Yan, Y. Chang, Applied Surface Science 285P (2013) 945-951.
[166] S.P. Naik, T. Ryu, V. Bui, J.D. Miller, N.B. Drinnan, W. Zmierczak, Chemical
Engineering Journal 167 (2011) 362-368.
[167] J. Abu-Dahrieh, D. Rooney, A. Goguet, Y. Saih, Chemical Engineering Journal 203
(2012) 201-211.
[168] R. Khoshbin, M. Haghighi, Chemical Engineering Research and Design 91 (2013)
1111-1122.
[169] G. Bonura, M. Cordaro, C. Cannilla, A. Mezzapica, L. Spadaro, F. Arena, F. Frusteri,
Catalysis Today 228 (2014) 51-57.
[170] J.-H. Kim, M.J. Park, S.J. Kim, O.-S. Joo, K.-D. Jung, Applied Catalysis A: General
264 (2004) 37-41.
[171] K.S. Yoo, J.-H. Kim, M.J. Park, S.J. Kim, O.-S. Joo, K.-D. Jung, Applied Catalysis A:
General 330 (2007) 57-62.
[172] A. García-Trenco, A. Martínez, Catalysis Today 227 (2014) 144-153.
[173] G.R. Moradi, R. Ghanei, F. Yaripour, React. Kinet. Catal. Lett 92 (2007) 137-145.
[174] Y. Wang, W.-l. Wang, Y.-x. Chen, J.-j. Zheng, R.-f. Ll, Journal of Fuel Chemistry and
Technology 41 (2013) 873-882.
[175] I. Sierra, J. Erena, A.T. Aguayo, J.M. Arandes, J. Bilbao, Applied Catalysis B:
Environmental 94 (2010) 108-116.
[176] R.S. Ramos, A.M.D.d. Farias, L.E.P. Borges, J.L. Monteiro, M.A. Fraga, E.F. Sousa-
Aguiar, L.G. Appel, Catalysis Today 101 (2005) 39-44.
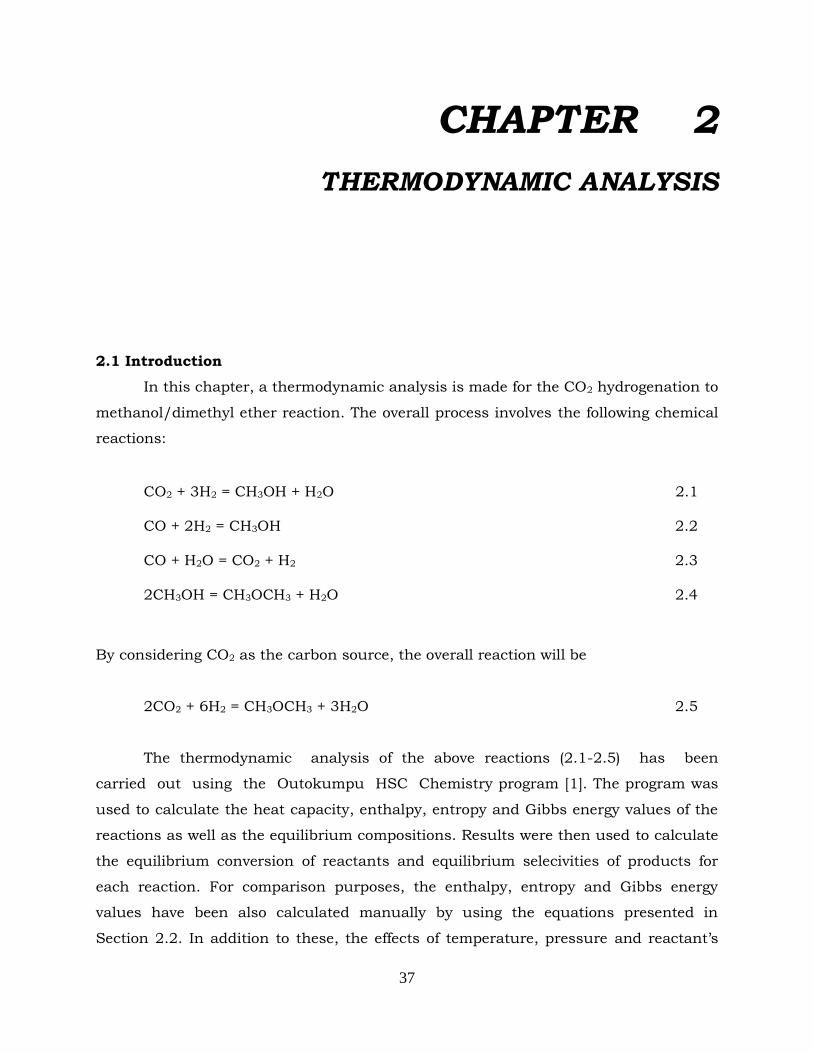
37
CHAPTER 2
THERMODYNAMIC ANALYSIS
2.1 Introduction
In this chapter, a thermodynamic analysis is made for the CO2 hydrogenation to
methanol/dimethyl ether reaction. The overall process involves the following chemical
reactions:
CO2 + 3H2 = CH3OH + H2O 2.1
CO + 2H2 = CH3OH 2.2
CO + H2O = CO2 + H2 2.3
2CH3OH = CH3OCH3 + H2O 2.4
By considering CO2 as the carbon source, the overall reaction will be
2CO2 + 6H2 = CH3OCH3 + 3H2O 2.5
The thermodynamic analysis of the above reactions (2.1-2.5) has been
carried out using the Outokumpu HSC Chemistry program [1]. The program was
used to calculate the heat capacity, enthalpy, entropy and Gibbs energy values of the
reactions as well as the equilibrium compositions. Results were then used to calculate
the equilibrium conversion of reactants and equilibrium selecivities of products for
each reaction. For comparison purposes, the enthalpy, entropy and Gibbs energy
values have been also calculated manually by using the equations presented in
Section 2.2. In addition to these, the effects of temperature, pressure and reactant‟s
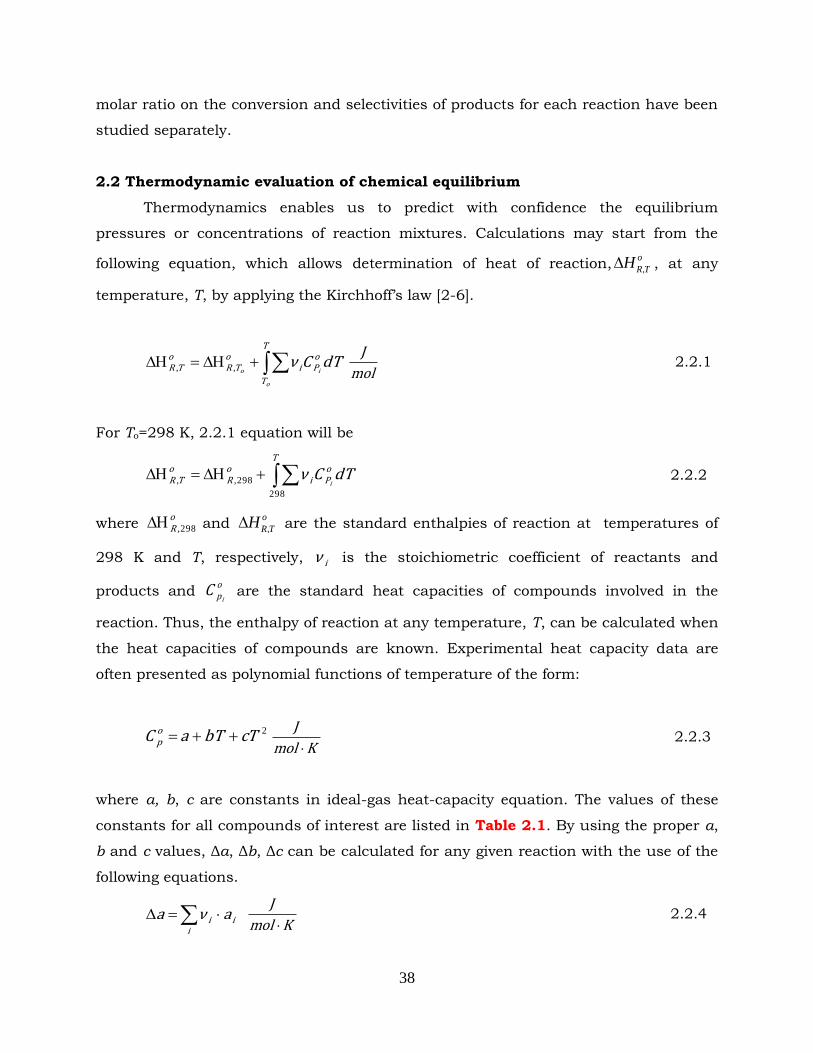
38
molar ratio on the conversion and selectivities of products for each reaction have been
studied separately.
2.2 Thermodynamic evaluation of chemical equilibrium
Thermodynamics enables us to predict with confidence the equilibrium
pressures or concentrations of reaction mixtures. Calculations may start from the
following equation, which allows determination of heat of reaction, ,
o
R TH , at any
temperature, T, by applying the Kirchhoff‟s law [2-6].
T
T
oPi
oTR
oTR
o
iodTCν,, mol
J 2.2.1
For To=298 K, 2.2.1 equation will be
ToPi
oR
oTR dTCν
i
298
298,, 2.2.2
where oR 298, and ,
o
R TH are the standard enthalpies of reaction at temperatures of
298 K and T, respectively, iν is the stoichiometric coefficient of reactants and
products and op i
C are the standard heat capacities of compounds involved in the
reaction. Thus, the enthalpy of reaction at any temperature, T, can be calculated when
the heat capacities of compounds are known. Experimental heat capacity data are
often presented as polynomial functions of temperature of the form:
2cTbTaC op
Kmol
J
2.2.3
where a, b, c are constants in ideal-gas heat-capacity equation. The values of these
constants for all compounds of interest are listed in Table 2.1. By using the proper a,
b and c values, Δa, Δb, Δc can be calculated for any given reaction with the use of the
following equations.
i
ii aνa Kmol
J
2.2.4
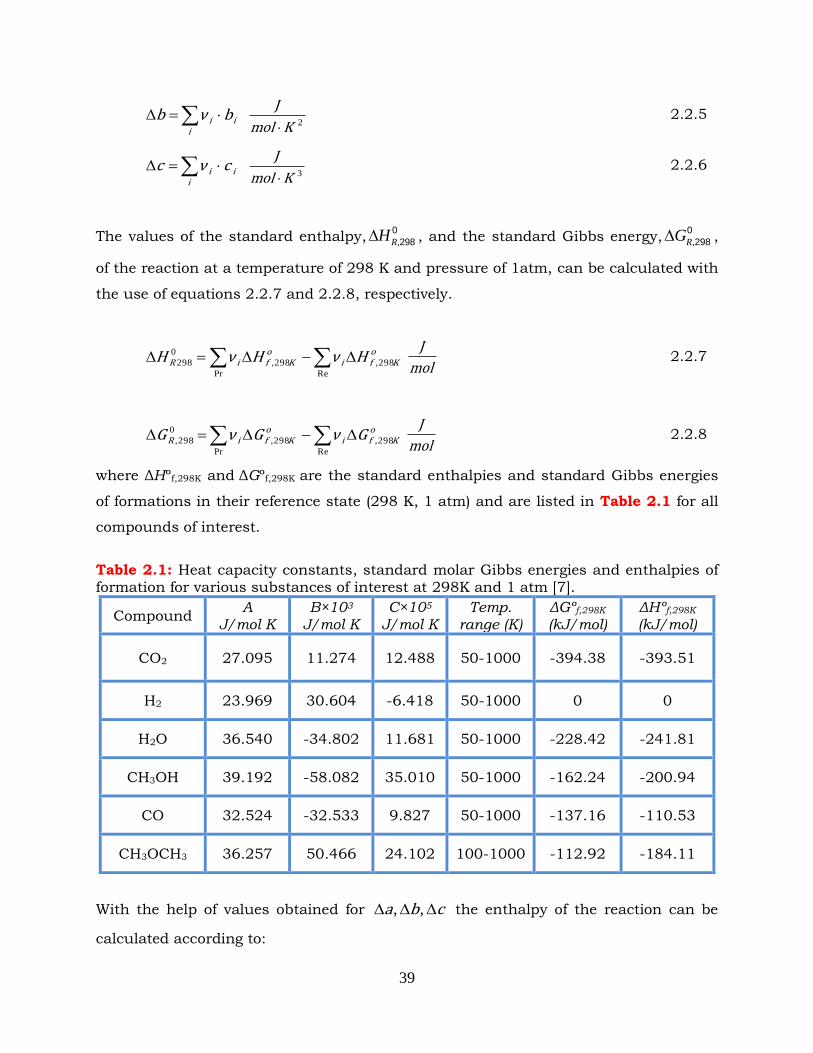
39
i
ii bνb 2Kmol
J
2.2.5
i
ii cνc 3Kmol
J
2.2.6
The values of the standard enthalpy,0
,298RH , and the standard Gibbs energy,
0
,298RG ,
of the reaction at a temperature of 298 K and pressure of 1atm, can be calculated with
the use of equations 2.2.7 and 2.2.8, respectively.
Pr Re
298,298,
0
298
oKfi
oKfiR HνHνH
mol
J 2.2.7
Pr Re
298,298,
0
298,
oKfi
oKfiR GνGνG
mol
J 2.2.8
where ΔHºf,298K and ΔGºf,298K are the standard enthalpies and standard Gibbs energies
of formations in their reference state (298 K, 1 atm) and are listed in Table 2.1 for all
compounds of interest.
Table 2.1: Heat capacity constants, standard molar Gibbs energies and enthalpies of formation for various substances of interest at 298K and 1 atm [7].
Compound A
J/mol K B×103
J/mol K C×105
J/mol K Temp.
range (K) ΔGºf,298K (kJ/mol)
ΔHºf,298K
(kJ/mol)
CO2 27.095 11.274 12.488 50-1000 -394.38 -393.51
H2 23.969 30.604 -6.418 50-1000 0 0
H2O 36.540 -34.802 11.681 50-1000 -228.42 -241.81
CH3OH 39.192 -58.082 35.010 50-1000 -162.24 -200.94
CO 32.524 -32.533 9.827 50-1000 -137.16 -110.53
CH3OCH3 36.257 50.466 24.102 100-1000 -112.92 -184.11
With the help of values obtained for cba ,, the enthalpy of the reaction can be
calculated according to:
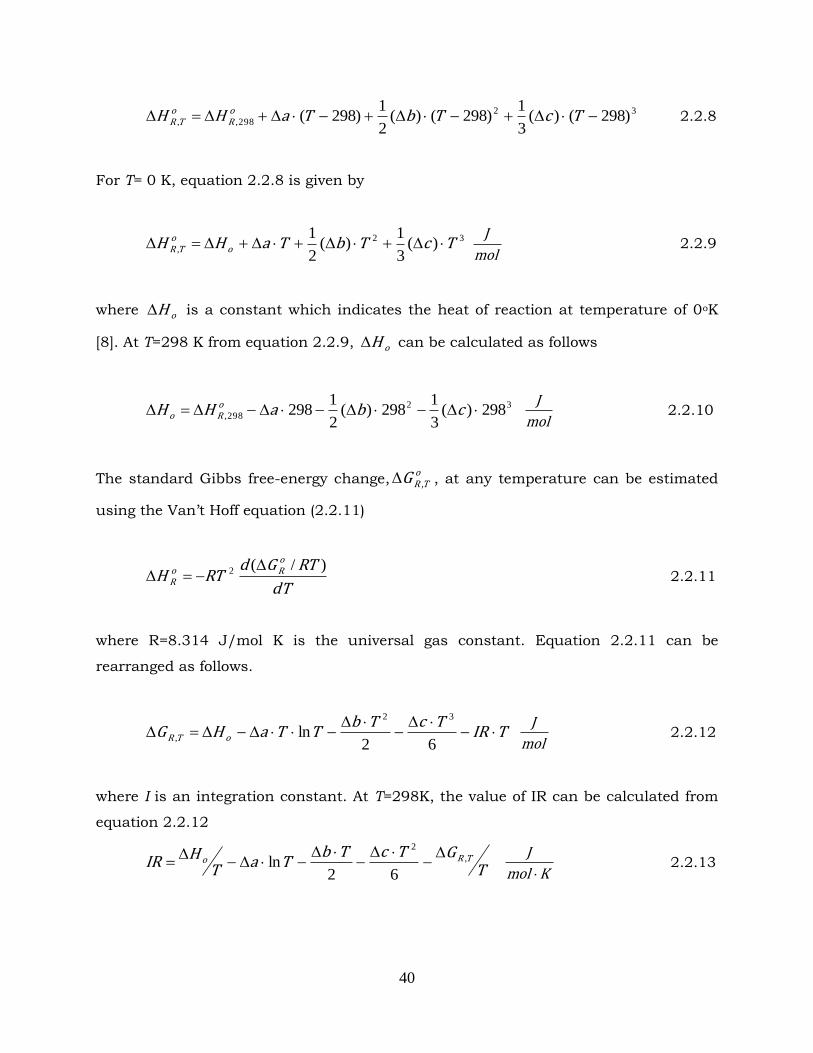
40
32
298,, )298()(3
1)298()(
2
1)298( TcTbTaHH o
Ro
TR 2.2.8
For T= 0 K, equation 2.2.8 is given by
32
, )(3
1)(
2
1TcTbTaHH o
oTR
mol
J 2.2.9
where oH is a constant which indicates the heat of reaction at temperature of 0oK
[8]. At T=298 K from equation 2.2.9, oH can be calculated as follows
32
298, 298)(3
1298)(
2
1298 cbaHH o
Ro mol
J 2.2.10
The standard Gibbs free-energy change,o
TRG , , at any temperature can be estimated
using the Van‟t Hoff equation (2.2.11)
dT
RTGdRTH
oRo
R
)/(2 2.2.11
where R=8.314 J/mol K is the universal gas constant. Equation 2.2.11 can be
rearranged as follows.
TIRTcTb
TTaHG oTR
62
ln32
, mol
J 2.2.12
where I is an integration constant. At T=298K, the value of IR can be calculated from
equation 2.2.12
TGTcTb
TaTHIR TRo ,
2
62ln
Kmol
J
2.2.13
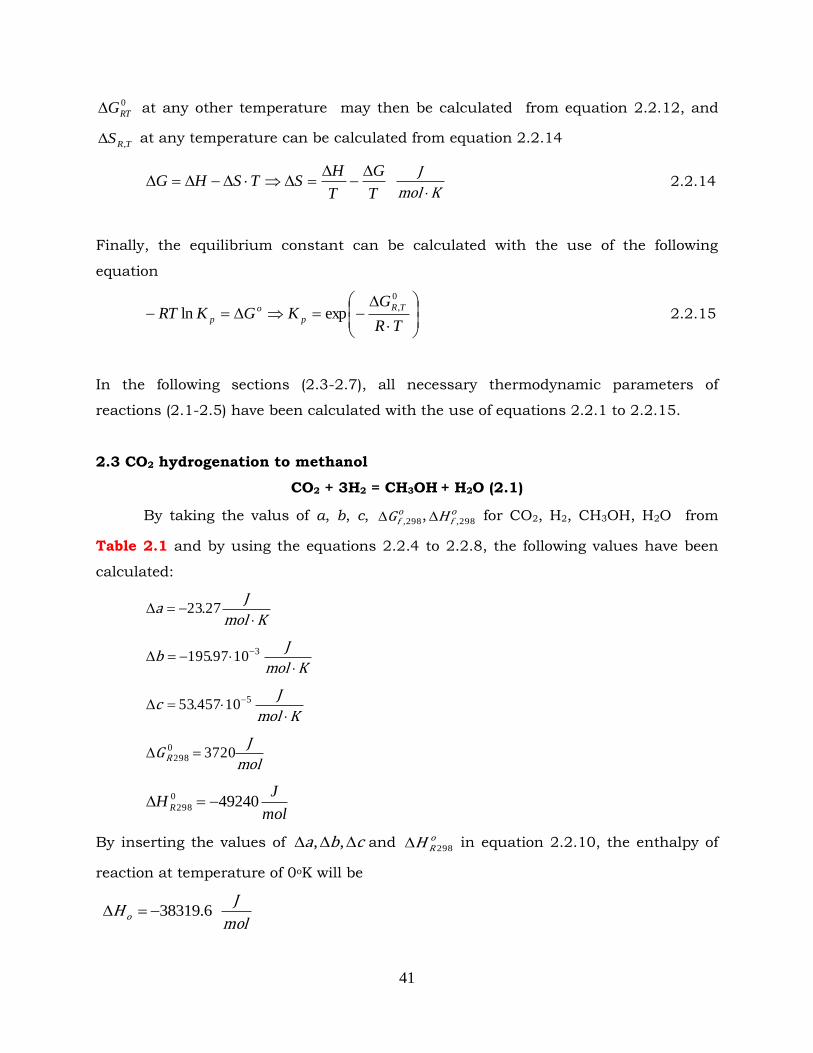
41
0
RTG at any other temperature may then be calculated from equation 2.2.12, and
TRS , at any temperature can be calculated from equation 2.2.14
T
G
T
HSTSHG
Kmol
J
2.2.14
Finally, the equilibrium constant can be calculated with the use of the following
equation
TR
GKGKRT
TR
p
o
p
0
,expln 2.2.15
In the following sections (2.3-2.7), all necessary thermodynamic parameters of
reactions (2.1-2.5) have been calculated with the use of equations 2.2.1 to 2.2.15.
2.3 CO2 hydrogenation to methanol
CO2 + 3H2 = CH3OH + H2O (2.1)
By taking the valus of a, b, c, ofG 298, , o
fH 298, for CO2, H2, CH3OH, H2O from
Table 2.1 and by using the equations 2.2.4 to 2.2.8, the following values have been
calculated:
Kmol
Ja
27.23
Kmol
Jb
31097.195
Kmol
Jc
510457.53
mol
JG R 37200
298
mol
JH R 492400
298
By inserting the values of cba ,, and oRH 298 in equation 2.2.10, the enthalpy of
reaction at temperature of 0oK will be
6.38319 oH mol
J
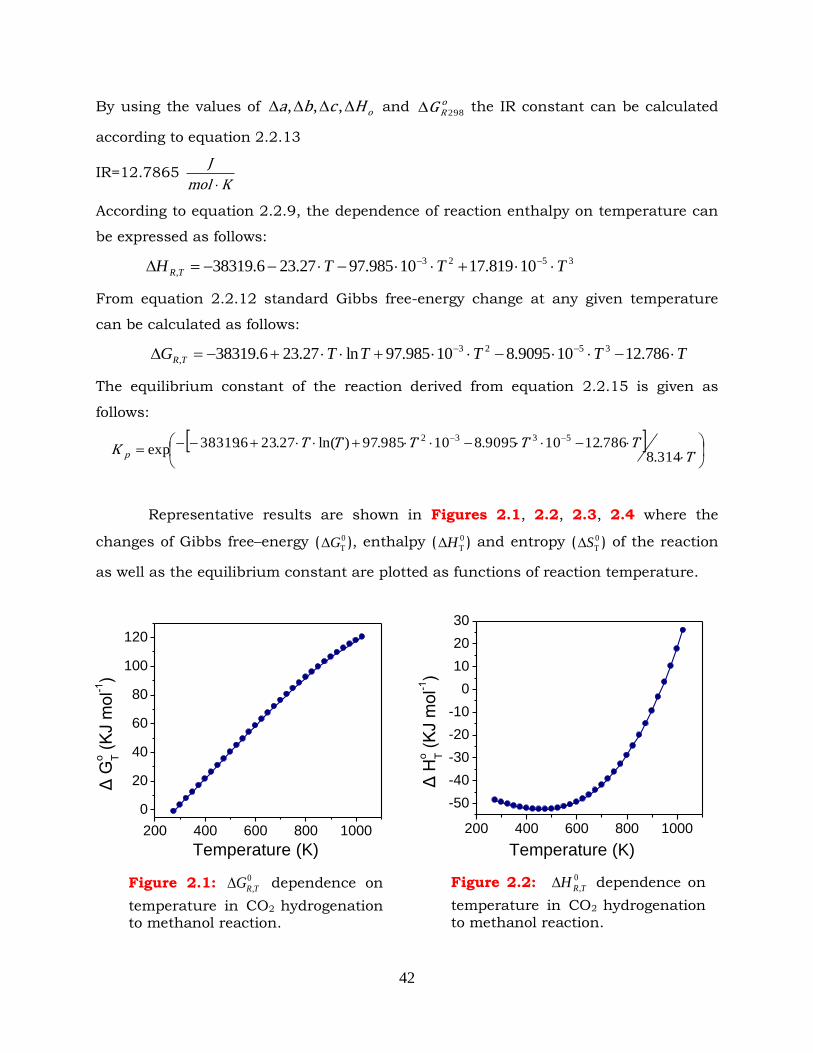
42
By using the values of oHcba ,,, and oRG 298 the IR constant can be calculated
according to equation 2.2.13
IR=12.7865 Kmol
J
According to equation 2.2.9, the dependence of reaction enthalpy on temperature can
be expressed as follows:
3523
, 10819.1710985.9727.236.38319 TTTH TR
From equation 2.2.12 standard Gibbs free-energy change at any given temperature
can be calculated as follows:
TTTTTG TR 786.12109095.810985.97ln27.236.38319 3523
,
The equilibrium constant of the reaction derived from equation 2.2.15 is given as
follows:
TTTTTTK p 314.8
786.12109095.810985.97)ln(27.236.38319exp
5332
Representative results are shown in Figures 2.1, 2.2, 2.3, 2.4 where the
changes of Gibbs free–energy ( 0
TG ), enthalpy ( 0
TH ) and entropy ( 0
TS ) of the reaction
as well as the equilibrium constant are plotted as functions of reaction temperature.
Figure 2.1: 0
,TRG dependence on
temperature in CO2 hydrogenation to methanol reaction.
Figure 2.2: 0
,TRH dependence on
temperature in CO2 hydrogenation to methanol reaction.
200 400 600 800 1000
0
20
40
60
80
100
120
Δ G
o T (
KJ m
ol-1
)
Temperature (K)
200 400 600 800 1000
-50
-40
-30
-20
-10
0
10
20
30
Δ H
o T (
KJ m
ol-1
)
Temperature (K)
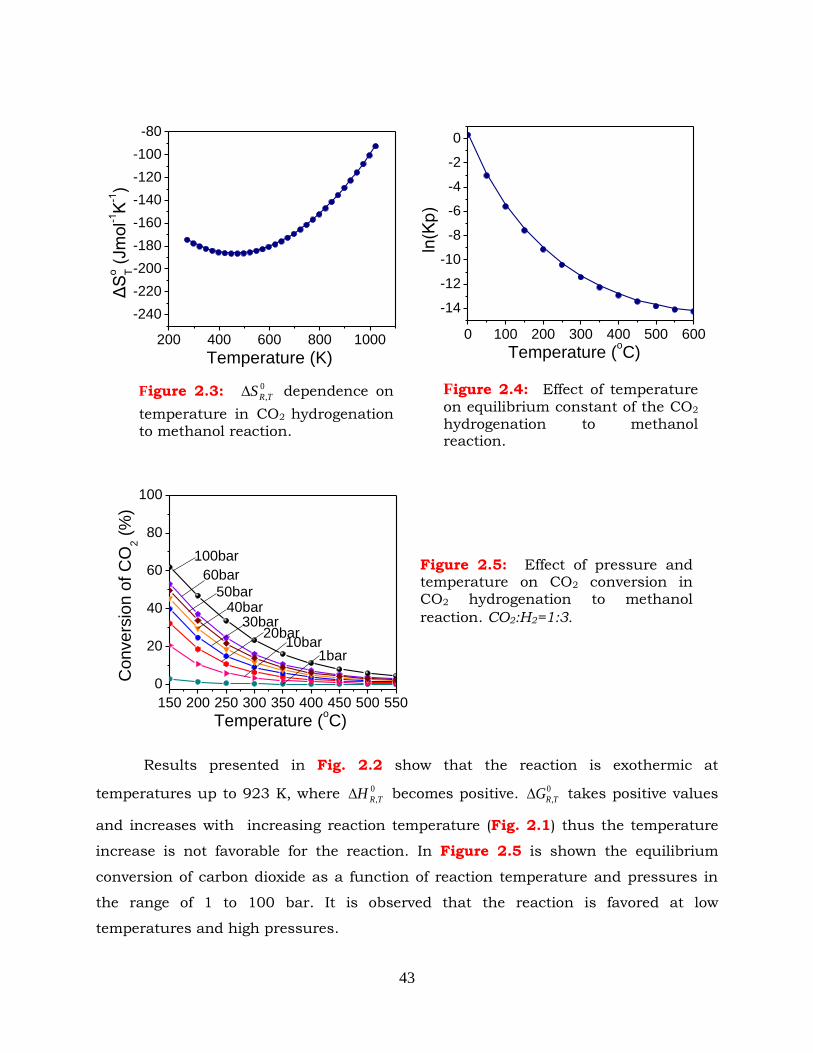
43
Results presented in Fig. 2.2 show that the reaction is exothermic at
temperatures up to 923 K, where 0
,TRH becomes positive. 0
,TRG takes positive values
and increases with increasing reaction temperature (Fig. 2.1) thus the temperature
increase is not favorable for the reaction. In Figure 2.5 is shown the equilibrium
conversion of carbon dioxide as a function of reaction temperature and pressures in
the range of 1 to 100 bar. It is observed that the reaction is favored at low
temperatures and high pressures.
Figure 2.5: Effect of pressure and temperature on CO2 conversion in CO2 hydrogenation to methanol
reaction. CO2:H2=1:3.
150 200 250 300 350 400 450 500 550
0
20
40
60
80
100
1bar10bar
20bar30bar
40bar50bar
60bar
100bar
Convers
ion o
f C
O2 (
%)
Temperature (oC)
200 400 600 800 1000
-240
-220
-200
-180
-160
-140
-120
-100
-80
Δ
So T (
Jm
ol-1
K-1)
Temperature (K)
0 100 200 300 400 500 600
-14
-12
-10
-8
-6
-4
-2
0
ln(K
p)
Temperature (oC)
Figure 2.3: 0
,TRS dependence on
temperature in CO2 hydrogenation to methanol reaction.
Figure 2.4: Effect of temperature
on equilibrium constant of the CO2
hydrogenation to methanol reaction.
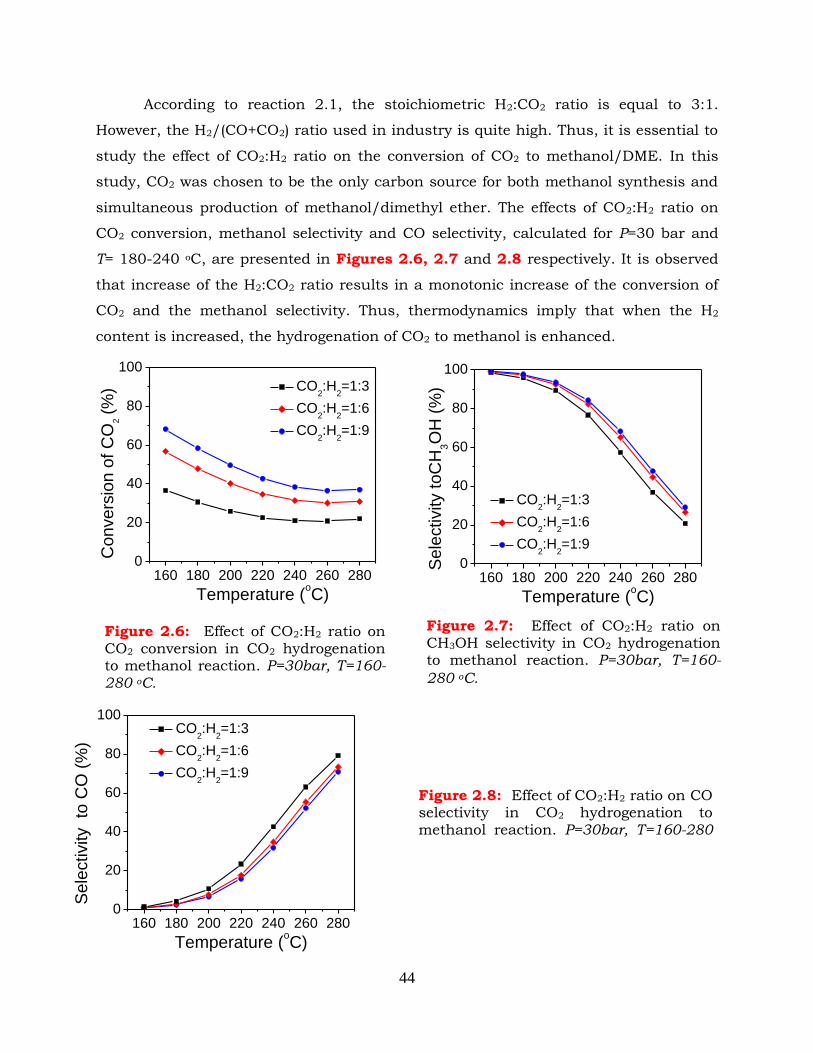
44
According to reaction 2.1, the stoichiometric H2:CO2 ratio is equal to 3:1.
However, the H2/(CO+CO2) ratio used in industry is quite high. Thus, it is essential to
study the effect of CO2:H2 ratio on the conversion of CO2 to methanol/DME. In this
study, CO2 was chosen to be the only carbon source for both methanol synthesis and
simultaneous production of methanol/dimethyl ether. The effects of CO2:H2 ratio on
CO2 conversion, methanol selectivity and CO selectivity, calculated for P=30 bar and
T= 180-240 oC, are presented in Figures 2.6, 2.7 and 2.8 respectively. It is observed
that increase of the H2:CO2 ratio results in a monotonic increase of the conversion of
CO2 and the methanol selectivity. Thus, thermodynamics imply that when the H2
content is increased, the hydrogenation of CO2 to methanol is enhanced.
160 180 200 220 240 260 2800
20
40
60
80
100
CO2:H
2=1:3
CO2:H
2=1:6
CO2:H
2=1:9
Convers
ion o
f C
O2 (
%)
Temperature (oC)
Figure 2.6: Effect of CO2:H2 ratio on CO2 conversion in CO2 hydrogenation to methanol reaction. P=30bar, T=160-280 oC.
160 180 200 220 240 260 2800
20
40
60
80
100
CO2:H
2=1:3
CO2:H
2=1:6
CO2:H
2=1:9
Sele
ctivity t
oC
H3O
H (
%)
Temperature (oC)
160 180 200 220 240 260 2800
20
40
60
80
100 CO
2:H
2=1:3
CO2:H
2=1:6
CO2:H
2=1:9
Sele
ctivity
to C
O (
%)
Temperature (oC)
Figure 2.7: Effect of CO2:H2 ratio on CH3OH selectivity in CO2 hydrogenation to methanol reaction. P=30bar, T=160-
280 oC.
Figure 2.8: Effect of CO2:H2 ratio on CO selectivity in CO2 hydrogenation to methanol reaction. P=30bar, T=160-280 oC.
45
2.4 CO hydrogenation to methanol
CO + 2H2 = CH3OH (2.2)
The calculated values of ,,, cba 0
298,RG and 0
298,RH obtained with the use of
the data listed in Table 2.1 and equations 2.2.4 to 2.2.8 (section 2.2) are listed below:
Kmol
Ja
270.41
Kmol
Jb
310757.86
Kmol
Jc
510019.38
mol
JGR 250800
298
mol
JH R 904100
298
From equation 2.2.10 the enthalpy of reaction at temperature of 0oK is
087.776130 H mol
J
By using the values of oHcba ,,, and oRG 298 the IR constant can be calculated
according to equation 2.2.13
IR=66.133 Kmol
J
According to equation 2.2.9, the enthalpy of the title reaction as a function of
temperature is given by the following equation:
3523
, 10673.1210379.43270.41087.77613 TTTH TR
From equations 2.2.12 and 2.2.15 the standard Gibbs free-energy change and the
equilibrium constant can be calculated as follows:
TTTTTG TR 133.6610336.610379.43ln270.41087.77613 3523
,
TTTTTTK p 314.8
133.6610336.610379.43ln270.41087.77613exp3523
Representative results are shown in Figures 2.9, 2.10, 2.11, 2.12 where the
changes of Gibbs free–energy ( 0
TG ), enthalpy ( 0
TH ) and entropy ( 0
TS ) of the title
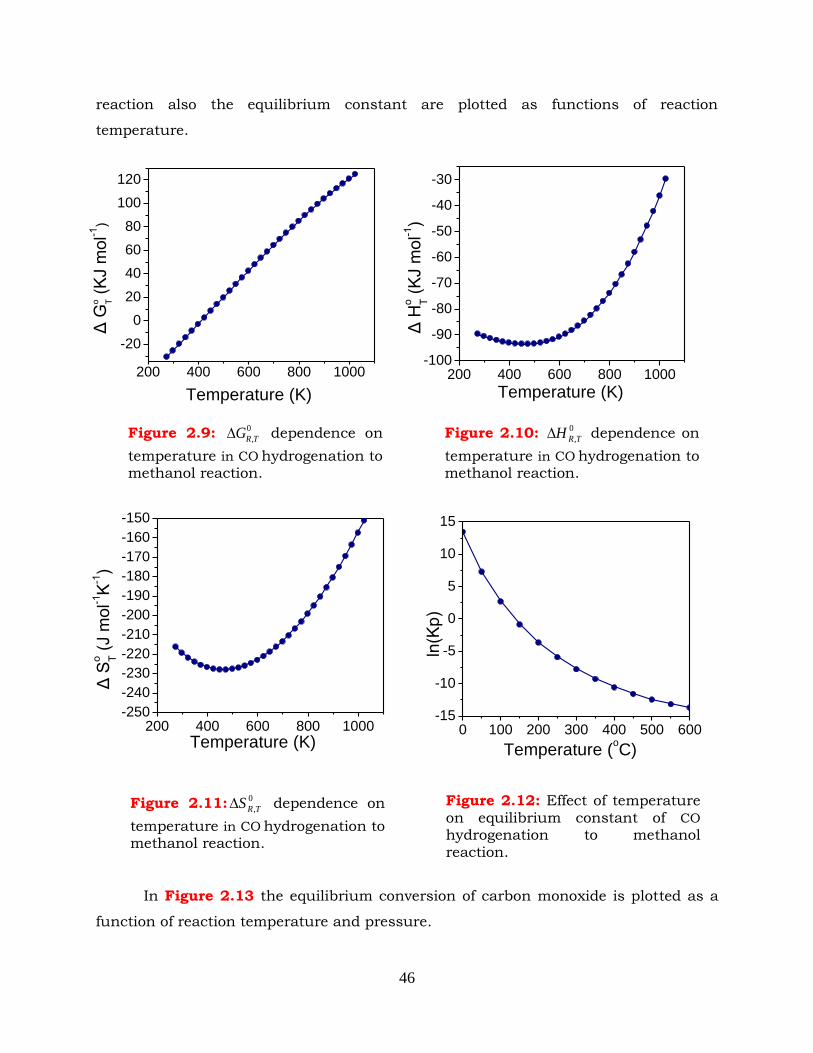
46
reaction also the equilibrium constant are plotted as functions of reaction
temperature.
In Figure 2.13 the equilibrium conversion of carbon monoxide is plotted as a
function of reaction temperature and pressure.
Figure 2.11: 0
,TRS dependence on
temperature in CO hydrogenation to methanol reaction.
200 400 600 800 1000
-20
0
20
40
60
80
100
120
Δ G
o T (
KJ m
ol-1
)
Temperature (K)
200 400 600 800 1000-100
-90
-80
-70
-60
-50
-40
-30
Δ H
o T (
KJ m
ol-1
)
Temperature (K)
200 400 600 800 1000-250
-240
-230
-220
-210
-200
-190
-180
-170
-160
-150
Δ S
o T (
J m
ol-1
K-1)
Temperature (K)0 100 200 300 400 500 600
-15
-10
-5
0
5
10
15
ln(K
p)
Temperature (oC)
Figure 2.9: 0
,TRG dependence on
temperature in CO hydrogenation to methanol reaction.
Figure 2.10: 0
,TRH dependence on
temperature in CO hydrogenation to methanol reaction.
Figure 2.12: Effect of temperature
on equilibrium constant of CO
hydrogenation to methanol reaction.
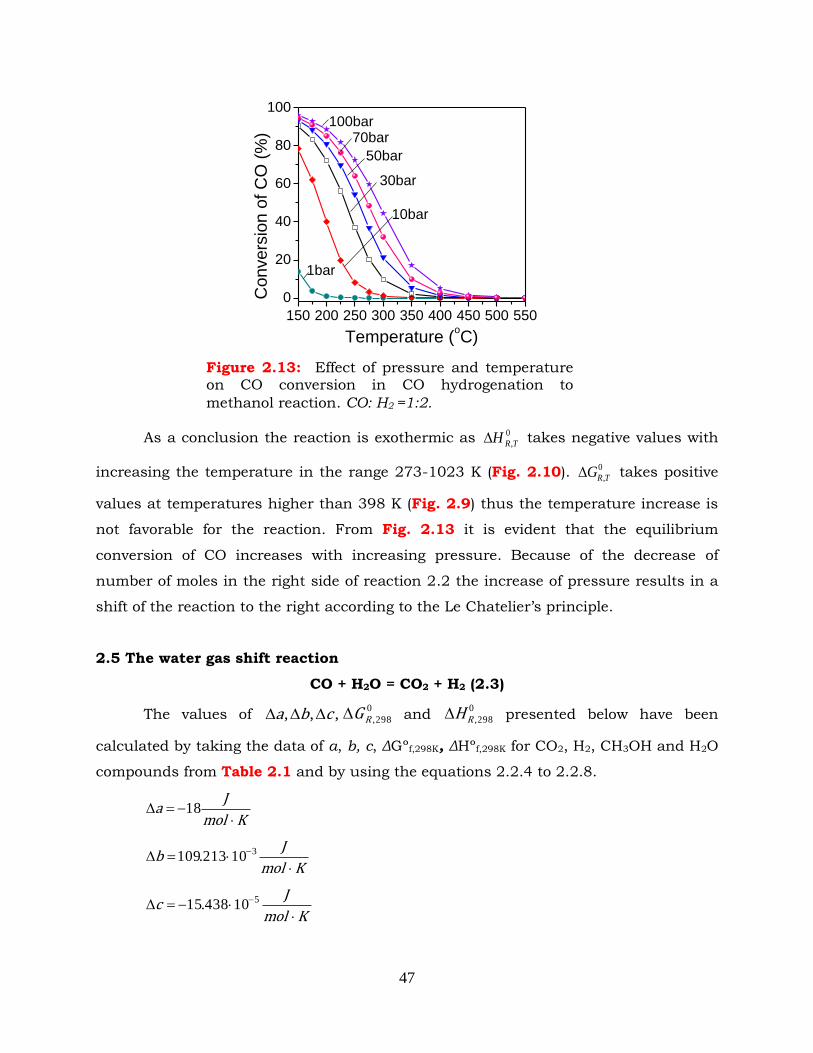
47
As a conclusion the reaction is exothermic as 0
,TRH takes negative values with
increasing the temperature in the range 273-1023 K (Fig. 2.10). 0
,TRG takes positive
values at temperatures higher than 398 K (Fig. 2.9) thus the temperature increase is
not favorable for the reaction. From Fig. 2.13 it is evident that the equilibrium
conversion of CO increases with increasing pressure. Because of the decrease of
number of moles in the right side of reaction 2.2 the increase of pressure results in a
shift of the reaction to the right according to the Le Chatelier‟s principle.
2.5 The water gas shift reaction
CO + H2O = CO2 + H2 (2.3)
The values of ,,, cba 0
298,RG and 0
298,RH presented below have been
calculated by taking the data of a, b, c, ΔGºf,298K, ΔHºf,298K for CO2, H2, CH3OH and H2O
compounds from Table 2.1 and by using the equations 2.2.4 to 2.2.8.
Kmol
Ja
18
Kmol
Jb
310213.109
Kmol
Jc
510438.15
Figure 2.13: Effect of pressure and temperature on CO conversion in CO hydrogenation to
methanol reaction. CO: H2 =1:2.
150 200 250 300 350 400 450 500 550
0
20
40
60
80
100
70bar
10bar
30bar
50bar
100bar
1bar
Convers
ion o
f C
O (
%)
Temperature (oC)
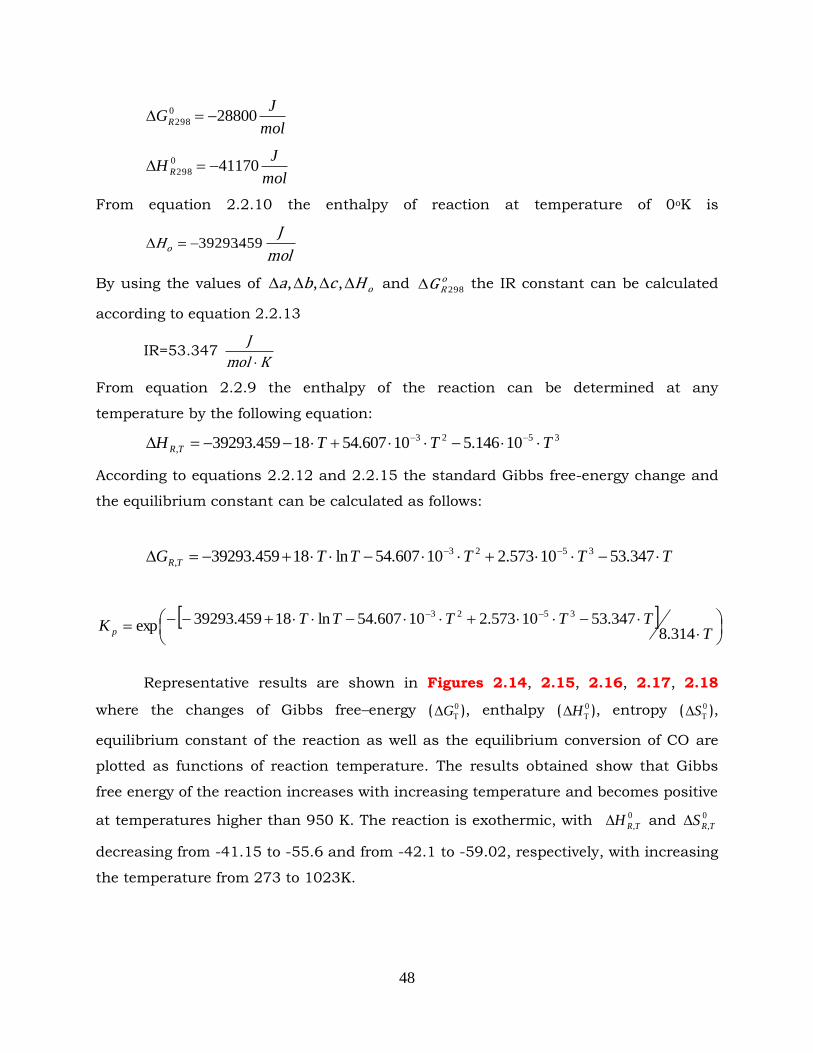
48
mol
JGR 288000
298
mol
JH R 411700
298
From equation 2.2.10 the enthalpy of reaction at temperature of 0oK is
459.39293 oHmol
J
By using the values of oHcba ,,, and oRG 298 the IR constant can be calculated
according to equation 2.2.13
IR=53.347 Kmol
J
From equation 2.2.9 the enthalpy of the reaction can be determined at any
temperature by the following equation:
3523
, 10146.510607.5418459.39293 TTTH TR
According to equations 2.2.12 and 2.2.15 the standard Gibbs free-energy change and
the equilibrium constant can be calculated as follows:
TTTTTG TR 347.5310573.210607.54ln18459.39293 3523
,
TTTTTTK p 314.8
347.5310573.210607.54ln18459.39293exp3523
Representative results are shown in Figures 2.14, 2.15, 2.16, 2.17, 2.18
where the changes of Gibbs free–energy ( 0
TG ), enthalpy ( 0
TH ), entropy ( 0
TS ),
equilibrium constant of the reaction as well as the equilibrium conversion of CO are
plotted as functions of reaction temperature. The results obtained show that Gibbs
free energy of the reaction increases with increasing temperature and becomes positive
at temperatures higher than 950 K. The reaction is exothermic, with 0
,TRH and 0
,TRS
decreasing from -41.15 to -55.6 and from -42.1 to -59.02, respectively, with increasing
the temperature from 273 to 1023K.
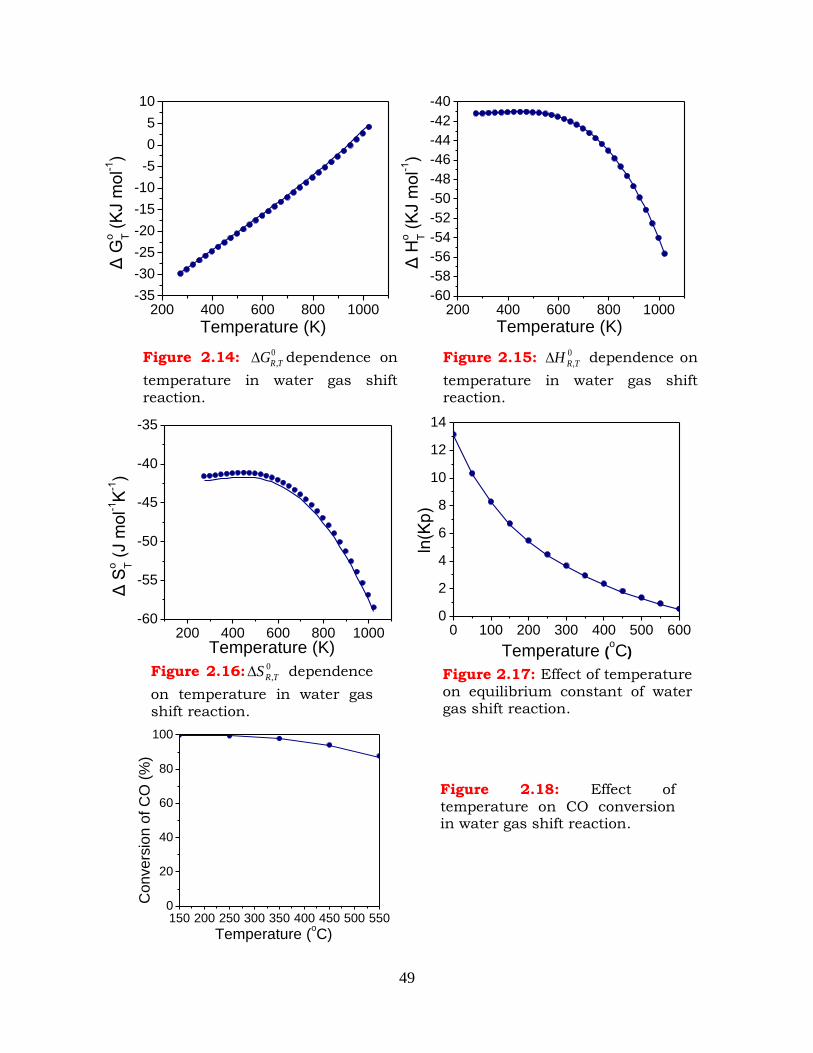
49
150 200 250 300 350 400 450 500 5500
20
40
60
80
100
Convers
ion o
f C
O (
%)
Temperature (oC)
Figure 2.18: Effect of
temperature on CO conversion in water gas shift reaction.
200 400 600 800 1000-35
-30
-25
-20
-15
-10
-5
0
5
10
Δ G
o T (
KJ m
ol-1
)
Temperature (K)200 400 600 800 1000
-60
-58
-56
-54
-52
-50
-48
-46
-44
-42
-40
Δ H
o T (
KJ m
ol-1
)
Temperature (K)
200 400 600 800 1000-60
-55
-50
-45
-40
-35
Δ S
o T (
J m
ol-1
K-1)
Temperature (K)
Figure 2.17: Effect of temperature on equilibrium constant of water gas shift reaction.
0 100 200 300 400 500 6000
2
4
6
8
10
12
14
ln(K
p)
Temperature (oC)
Figure 2.14: 0
,TRG dependence on
temperature in water gas shift reaction.
Figure 2.15: 0
,TRH dependence on
temperature in water gas shift reaction.
Figure 2.16: 0
,TRS dependence
on temperature in water gas shift reaction.
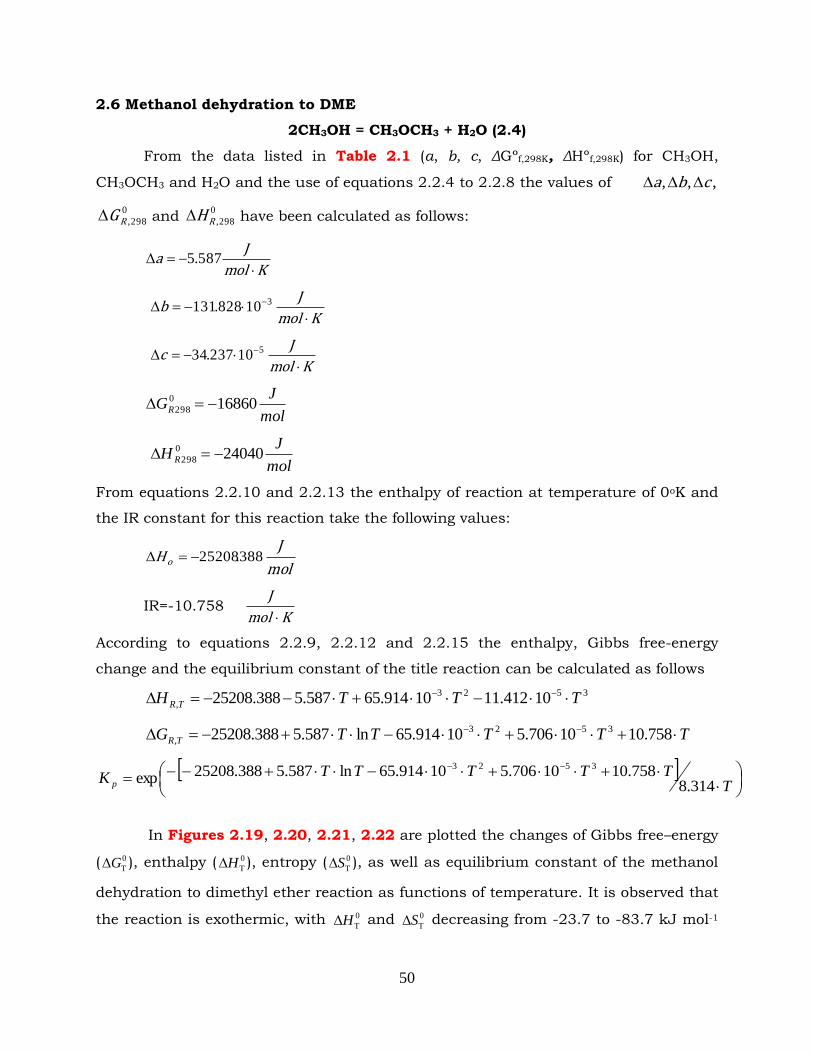
50
2.6 Methanol dehydration to DME
2CH3OH = CH3OCH3 + H2O (2.4)
From the data listed in Table 2.1 (a, b, c, ΔGºf,298K, ΔHºf,298K) for CH3OH,
CH3OCH3 and H2O and the use of equations 2.2.4 to 2.2.8 the values of ,,, cba
0
298,RG and 0
298,RH have been calculated as follows:
Kmol
Ja
587.5
Kmol
Jb
310828.131
Kmol
Jc
510237.34
mol
JGR 168600
298
mol
JH R 240400
298
From equations 2.2.10 and 2.2.13 the enthalpy of reaction at temperature of 0oK and
the IR constant for this reaction take the following values:
388.25208 oHmol
J
IR=-10.758 Kmol
J
According to equations 2.2.9, 2.2.12 and 2.2.15 the enthalpy, Gibbs free-energy
change and the equilibrium constant of the title reaction can be calculated as follows
3523
, 10412.1110914.65587.5388.25208 TTTH TR
TTTTTG TR 758.1010706.510914.65ln587.5388.25208 3523
,
TTTTTTK p 314.8
758.1010706.510914.65ln587.5388.25208exp3523
In Figures 2.19, 2.20, 2.21, 2.22 are plotted the changes of Gibbs free–energy
( 0
TG ), enthalpy ( 0
TH ), entropy ( 0
TS ), as well as equilibrium constant of the methanol
dehydration to dimethyl ether reaction as functions of temperature. It is observed that
the reaction is exothermic, with 0
TH and 0
TS decreasing from -23.7 to -83.7 kJ mol-1
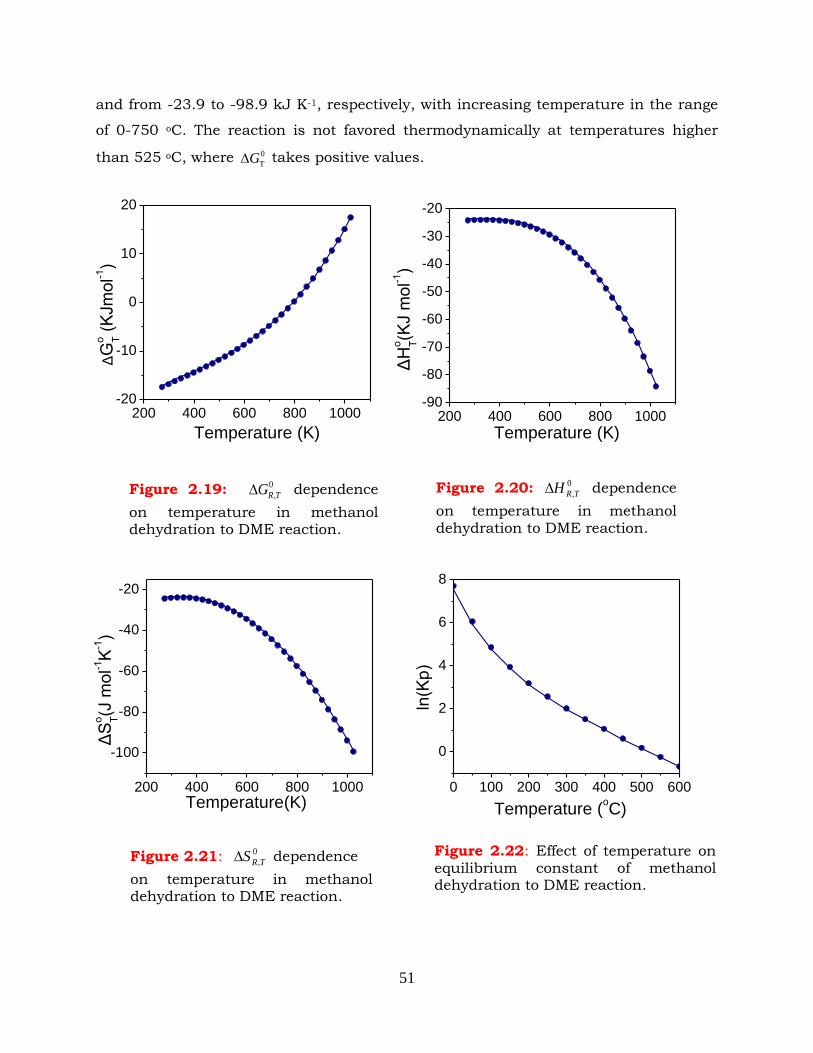
51
and from -23.9 to -98.9 kJ K-1, respectively, with increasing temperature in the range
of 0-750 oC. The reaction is not favored thermodynamically at temperatures higher
than 525 oC, where 0
TG takes positive values.
Figure 2.21: 0
,TRS dependence
on temperature in methanol dehydration to DME reaction.
Figure 2.22: Effect of temperature on equilibrium constant of methanol dehydration to DME reaction.
Figure 2.19: 0
,TRG dependence
on temperature in methanol dehydration to DME reaction.
Figure 2.20: 0
,TRH dependence
on temperature in methanol dehydration to DME reaction.
0 100 200 300 400 500 600
0
2
4
6
8
ln(K
p)
Temperature (oC)
200 400 600 800 1000
-100
-80
-60
-40
-20
ΔS
o T(J
mol-1
K-1)
Temperature(K)
200 400 600 800 1000-20
-10
0
10
20
ΔG
o T (
KJm
ol-1
)
Temperature (K)200 400 600 800 1000
-90
-80
-70
-60
-50
-40
-30
-20
ΔH
o T(K
J m
ol-1
)
Temperature (K)
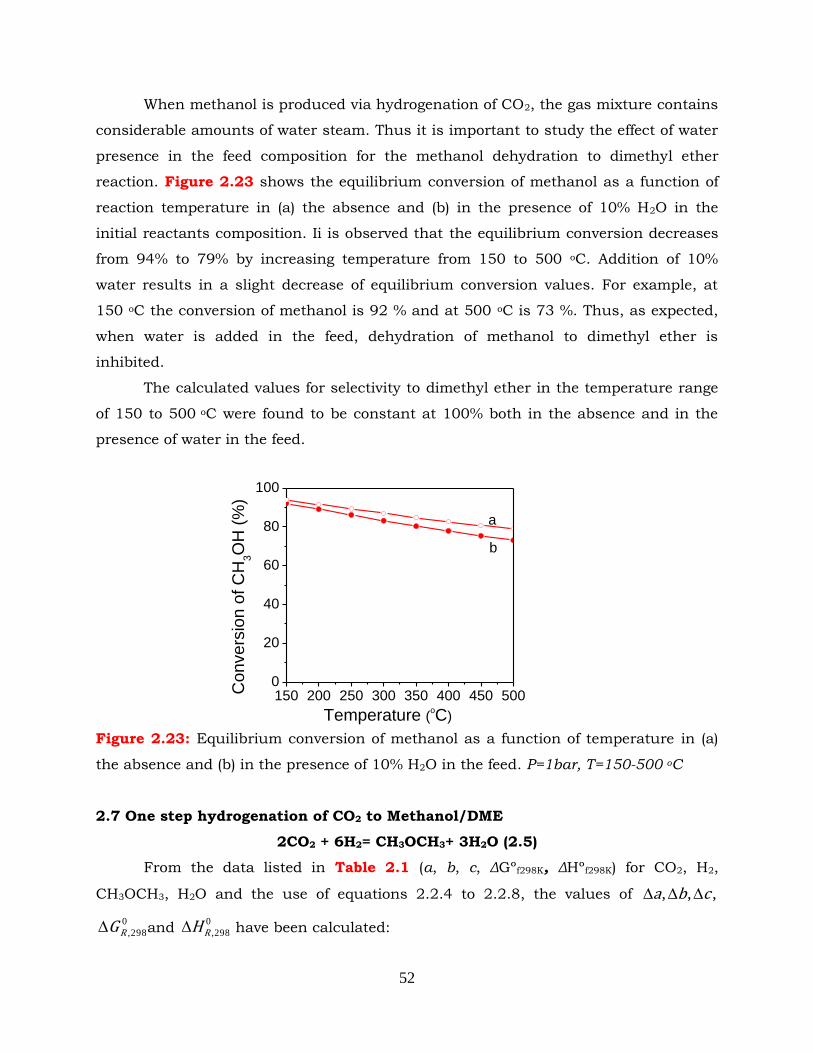
52
When methanol is produced via hydrogenation of CO2, the gas mixture contains
considerable amounts of water steam. Thus it is important to study the effect of water
presence in the feed composition for the methanol dehydration to dimethyl ether
reaction. Figure 2.23 shows the equilibrium conversion of methanol as a function of
reaction temperature in (a) the absence and (b) in the presence of 10% H2O in the
initial reactants composition. Ii is observed that the equilibrium conversion decreases
from 94% to 79% by increasing temperature from 150 to 500 oC. Addition of 10%
water results in a slight decrease of equilibrium conversion values. For example, at
150 oC the conversion of methanol is 92 % and at 500 oC is 73 %. Thus, as expected,
when water is added in the feed, dehydration of methanol to dimethyl ether is
inhibited.
The calculated values for selectivity to dimethyl ether in the temperature range
of 150 to 500 oC were found to be constant at 100% both in the absence and in the
presence of water in the feed.
Figure 2.23: Equilibrium conversion of methanol as a function of temperature in (a)
the absence and (b) in the presence of 10% H2O in the feed. P=1bar, T=150-500 oC
2.7 One step hydrogenation of CO2 to Methanol/DME
2CO2 + 6H2= CH3OCH3+ 3H2O (2.5)
From the data listed in Table 2.1 (a, b, c, ΔGºf298K, ΔHºf298K) for CO2, H2,
CH3OCH3, H2O and the use of equations 2.2.4 to 2.2.8, the values of ,,, cba
0
298,RG and 0
298,RH have been calculated:
150 200 250 300 350 400 450 5000
20
40
60
80
100
a
Convers
ion o
f C
H3O
H (
%)
Temperature (oC)
b
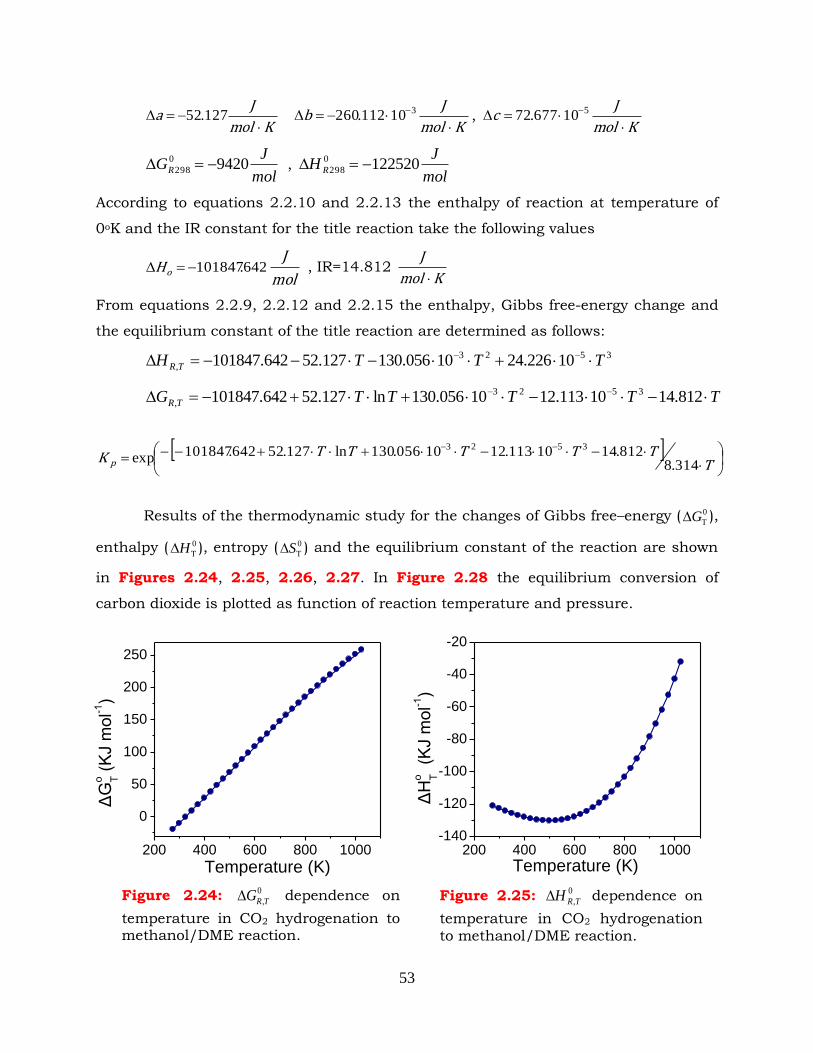
53
Kmol
Ja
127.52
Kmol
Jb
310112.260 ,
Kmol
Jc
510677.72
mol
JGR 94200
298 , mol
JH R 1225200
298
According to equations 2.2.10 and 2.2.13 the enthalpy of reaction at temperature of
0oK and the IR constant for the title reaction take the following values
642.101847 oHmol
J , IR=14.812
Kmol
J
From equations 2.2.9, 2.2.12 and 2.2.15 the enthalpy, Gibbs free-energy change and
the equilibrium constant of the title reaction are determined as follows:
3523
, 10226.2410056.130127.52642.101847 TTTH TR
TTTTTG TR 812.1410113.1210056.130ln127.52642.101847 3523
,
TTTTTTK p 314.8
812.1410113.1210056.130ln127.52642.101847exp3523
Results of the thermodynamic study for the changes of Gibbs free–energy ( 0
TG ),
enthalpy ( 0
TH ), entropy ( 0
TS ) and the equilibrium constant of the reaction are shown
in Figures 2.24, 2.25, 2.26, 2.27. In Figure 2.28 the equilibrium conversion of
carbon dioxide is plotted as function of reaction temperature and pressure.
200 400 600 800 1000
0
50
100
150
200
250
ΔG
o T (
KJ m
ol-1
)
Temperature (K)200 400 600 800 1000
-140
-120
-100
-80
-60
-40
-20
ΔH
o T
(KJ m
ol-1
)
Temperature (K)
Figure 2.24: 0
,TRG dependence on
temperature in CO2 hydrogenation to methanol/DME reaction.
Figure 2.25: 0
,TRH dependence on
temperature in CO2 hydrogenation to methanol/DME reaction.
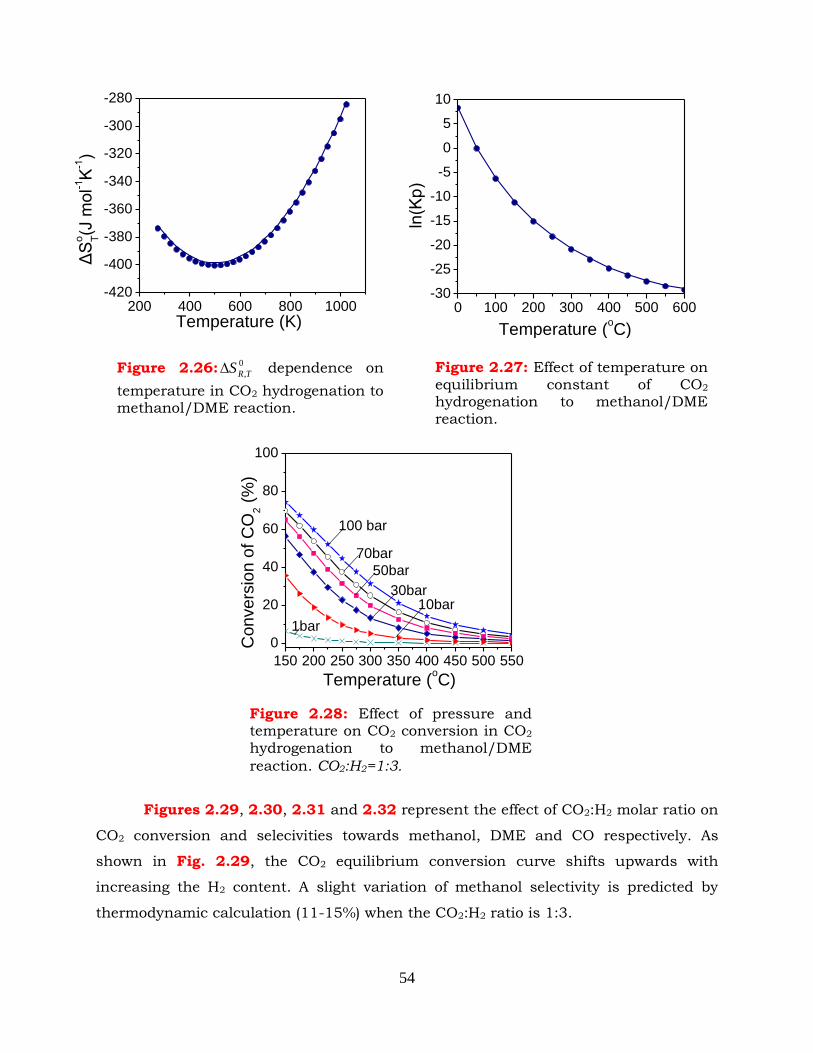
54
Figures 2.29, 2.30, 2.31 and 2.32 represent the effect of CO2:H2 molar ratio on
CO2 conversion and selecivities towards methanol, DME and CO respectively. As
shown in Fig. 2.29, the CO2 equilibrium conversion curve shifts upwards with
increasing the H2 content. A slight variation of methanol selectivity is predicted by
thermodynamic calculation (11-15%) when the CO2:H2 ratio is 1:3.
150 200 250 300 350 400 450 500 550
0
20
40
60
80
100
70bar
100 bar
50bar
30bar10bar
1bar
Convers
ion o
f C
O2 (
%)
Temperature (oC)
Figure 2.28: Effect of pressure and temperature on CO2 conversion in CO2 hydrogenation to methanol/DME
reaction. CO2:H2=1:3.
200 400 600 800 1000-420
-400
-380
-360
-340
-320
-300
-280
Δ
So T(J
mol-1
K-1)
Temperature (K)0 100 200 300 400 500 600
-30
-25
-20
-15
-10
-5
0
5
10
ln(K
p)
Temperature (oC)
Figure 2.26: 0
,TRS dependence on
temperature in CO2 hydrogenation to methanol/DME reaction.
Figure 2.27: Effect of temperature on equilibrium constant of CO2 hydrogenation to methanol/DME reaction. the reaction
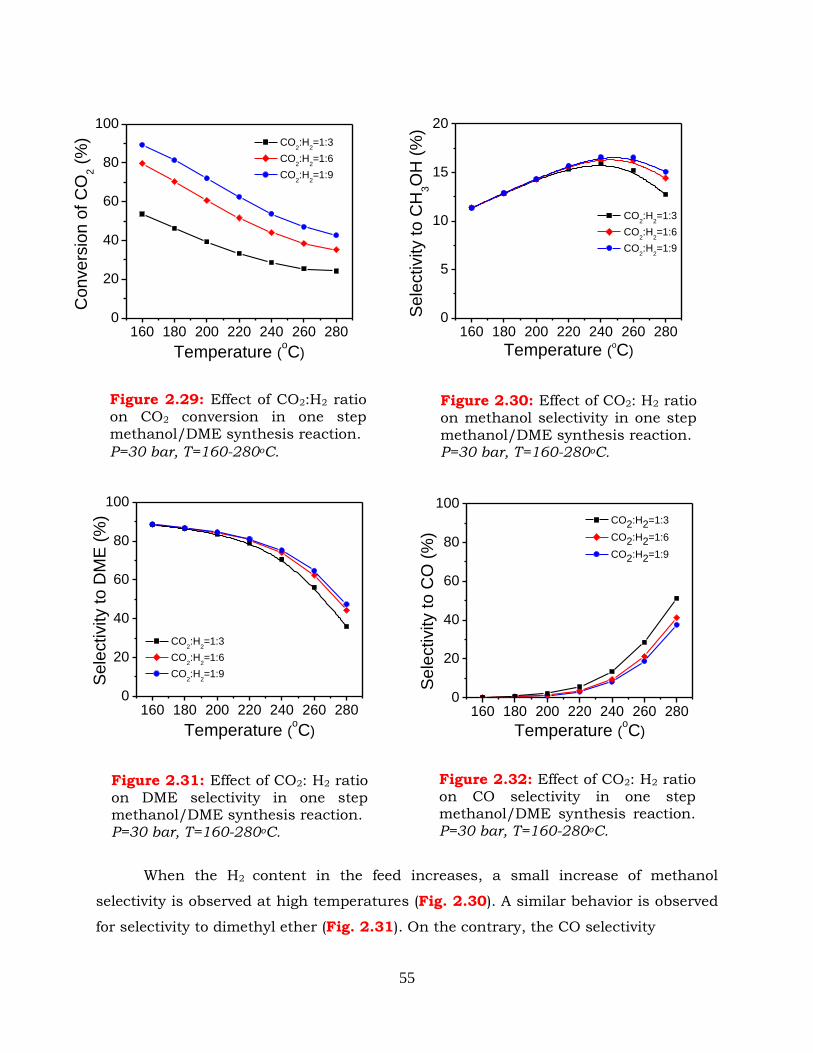
55
When the H2 content in the feed increases, a small increase of methanol
selectivity is observed at high temperatures (Fig. 2.30). A similar behavior is observed
for selectivity to dimethyl ether (Fig. 2.31). On the contrary, the CO selectivity
Figure 2.30: Effect of CO2: H2 ratio on methanol selectivity in one step methanol/DME synthesis reaction. P=30 bar, T=160-280oC.
Figure 2.29: Effect of CO2:H2 ratio on CO2 conversion in one step methanol/DME synthesis reaction.
P=30 bar, T=160-280oC.
160 180 200 220 240 260 2800
20
40
60
80
100
CO2:H
2=1:3
CO2:H
2=1:6
CO2:H
2=1:9
Convers
ion o
f C
O2 (
%)
Temperature (oC)
160 180 200 220 240 260 2800
5
10
15
20
CO2:H
2=1:3
CO2:H
2=1:6
CO2:H
2=1:9
Sele
ctivity t
o C
H3O
H (
%)
Temperature (oC)
160 180 200 220 240 260 2800
20
40
60
80
100
CO2:H
2=1:3
CO2:H
2=1:6
CO2:H
2=1:9
Sele
ctivity t
o D
ME
(%
)
Temperature (oC)
Figure 2.31: Effect of CO2: H2 ratio on DME selectivity in one step methanol/DME synthesis reaction. P=30 bar, T=160-280oC.
160 180 200 220 240 260 2800
20
40
60
80
100 CO2:H2=1:3
CO2:H2=1:6
CO2:H2=1:9
Sele
ctivity t
o C
O (
%)
Temperature (oC)
Figure 2.32: Effect of CO2: H2 ratio on CO selectivity in one step methanol/DME synthesis reaction. P=30 bar, T=160-280oC.
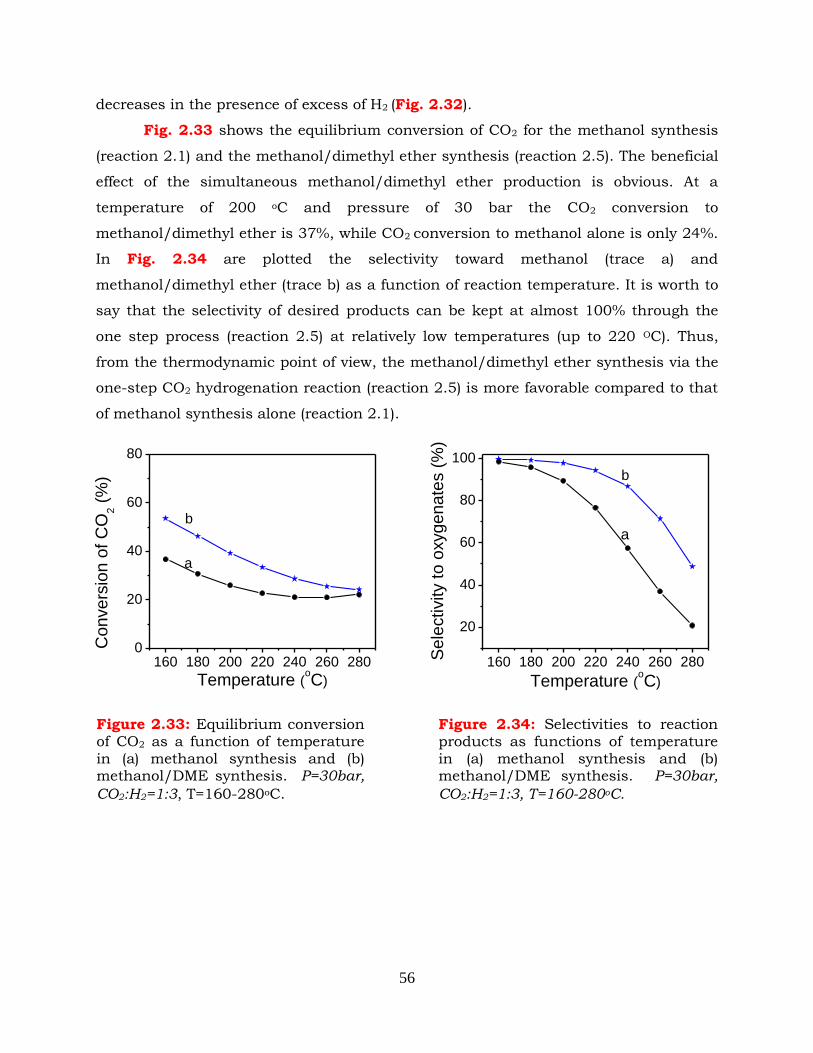
56
decreases in the presence of excess of H2 (Fig. 2.32).
Fig. 2.33 shows the equilibrium conversion of CO2 for the methanol synthesis
(reaction 2.1) and the methanol/dimethyl ether synthesis (reaction 2.5). The beneficial
effect of the simultaneous methanol/dimethyl ether production is obvious. At a
temperature of 200 oC and pressure of 30 bar the CO2 conversion to
methanol/dimethyl ether is 37%, while CO2 conversion to methanol alone is only 24%.
In Fig. 2.34 are plotted the selectivity toward methanol (trace a) and
methanol/dimethyl ether (trace b) as a function of reaction temperature. It is worth to
say that the selectivity of desired products can be kept at almost 100% through the
one step process (reaction 2.5) at relatively low temperatures (up to 220 OC). Thus,
from the thermodynamic point of view, the methanol/dimethyl ether synthesis via the
one-step CO2 hydrogenation reaction (reaction 2.5) is more favorable compared to that
of methanol synthesis alone (reaction 2.1).
160 180 200 220 240 260 2800
20
40
60
80
b
Convers
ion o
f C
O2 (
%)
Temperature (oC)
a
160 180 200 220 240 260 280
20
40
60
80
100
a
b
S
ele
ctivity t
o o
xygenate
s (
%)
Temperature (oC)
Figure 2.33: Equilibrium conversion of CO2 as a function of temperature in (a) methanol synthesis and (b) methanol/DME synthesis. P=30bar,
CO2:H2=1:3, T=160-280oC.
Figure 2.34: Selectivities to reaction products as functions of temperature in (a) methanol synthesis and (b) methanol/DME synthesis. P=30bar,
CO2:H2=1:3, T=160-280oC.
57
2.8 Conclusions
A detailed thermodynamic analysis has been performed for the CO2
hydrogenation to methanol/dimethyl ether reaction. The effects of temperature,
pressure and feed composition on the equilibrium conversion of reactants and
selectivities to the main products have been investigated. The general conclusions of
this study are summarized below:
The methanol synthesis both from CO and CO2 is thermodynamically restricted
being favorable at low temperatures and high pressures. This thermodynamic
restriction represents a major challenge in commercial methanol synthesis. An
efficient way to by-pass it, is the continuous removal of methanol from the reaction
system, either physically or by transforming to another product.
The results of thermodynamic calculations elucidate, that the co-production of
DME during CO2 hydrogenation permits higher CO2 conversion and higher selectivity
toward oxygenates (methanol/DME mixture) compared to those obtained over
methanol synthesis alone. In other words, when methanol synthesis and methanol
dehydration reactions are employed in tandem, the thermodynamics is forced to shift
toward the desired direction. The mitigation of thermodynamic restriction in this way
enables also to apply lower reaction pressures than those required for methanol
synthesis alone. Thus, from the thermodynamic point of view, the simultaneous
production of methanol/DME via hydrogenation of CO2 is an interesting and efficient
way to overcome the limitations of methanol synthesis and represents a promising
process for industrial applications.
Results of thermodynamic analysis for direct CO2 hydrogenation to
methanol/DME reaction indicate also that the reaction is very exothermic thus the
reaction temperature must be controlled. In addition, the excess of H2 content results
in increase of CO2 conversion, selectivities to oxygenates and decrease of selectivity to
CO.
58
2.9 References
[1] Outokumpu HSC Chemistry for Windows, Chemical Reaction and Equilibrium Sofware
with Extensive Thermochemical Database, Version 5.1, Finland, 2002.
[2] J. Gmehling, B. Kolbe, M. Kleiber, J. Rarey, "Chemical Thermodynamics For Process
Simulation", Wiley-VCH, Weinheim, Germany, 2012.
[3] N. Chopey (Ed.), "Handbook of Chemical Engineering Calculations", McGraw-Hill,
2003.
[4] Π. Παναγιωηοπούλος, "Ανάπηςξη και σαπακηηπιζμόρ καινοηόμων καηαλςηών για ηην
ανηίδπαζη μεηαηόπιζηρ ηος CO με αημό (WGS) ζε σαμηλέρ θεπμοκπαζίερ και κινηηική
μελέηη" (PhD thesis), Τμήμα Χημικών Μησανικών, Πανεπιζηήμιο Παηπών, 2006.
[5] H.D.B. Jenkins, "Chemical Thermodynamics at a Glance", Blackwell Publishing Ltd,
2008.
[6] Ξ.Ε. Βεπύκιορ, "Κινηηική Χημικών Ανηιδπάζεων και Σσεδιαζμόρ Χημικών
Ανηιδπαζηήπων", Πανεπιζηήμιο Παηπών, 2000.
[7] B.E. Poling, J.M. Prausnitz, J.P. O'Connell, "Properties of Gases and Liquids" Fifth
Edition, McGRAW-HILL, 2000.
[8] Κ. Βαγενάρ, "Ανάλςζη και Σσεδιαζμόρ Χημηκών Ανηιδπαζηήπων ", Πανεπιζηήμιο
Παηπών, 1999.
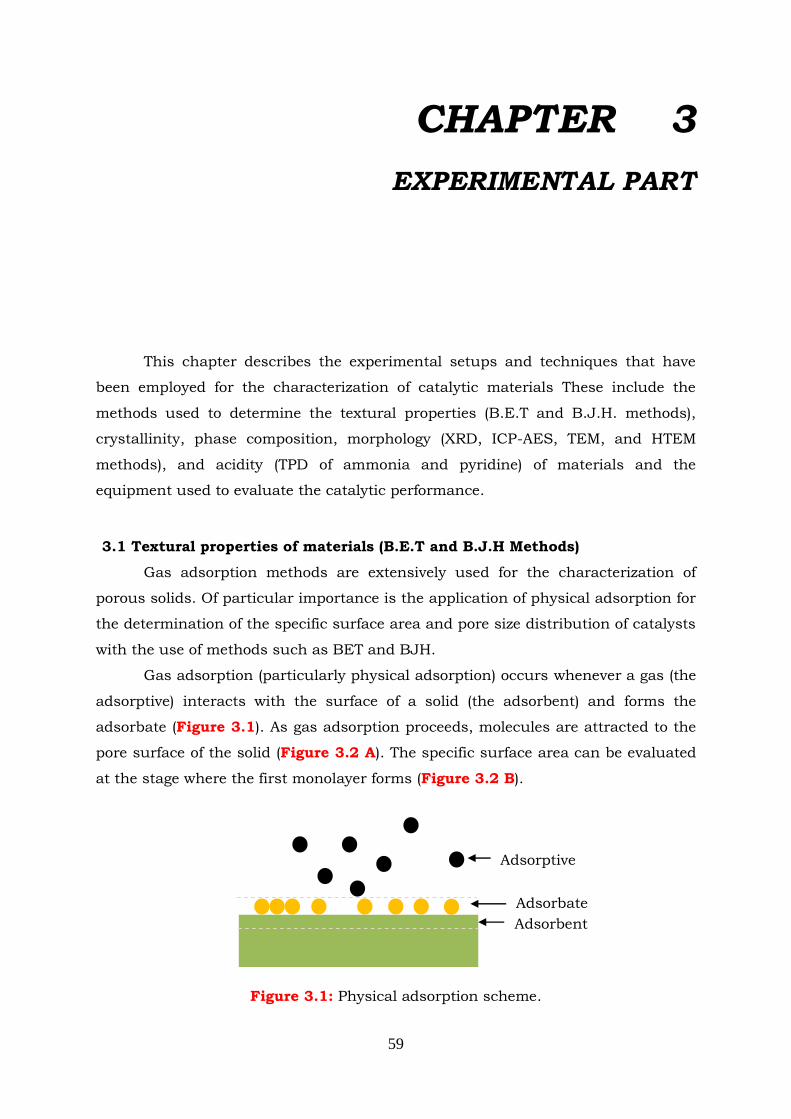
59
CHAPTER 3
EXPERIMENTAL PART
This chapter describes the experimental setups and techniques that have
been employed for the characterization of catalytic materials These include the
methods used to determine the textural properties (B.E.T and B.J.H. methods),
crystallinity, phase composition, morphology (XRD, ICP-AES, TEM, and HTEM
methods), and acidity (TPD of ammonia and pyridine) of materials and the
equipment used to evaluate the catalytic performance.
3.1 Textural properties of materials (B.E.T and B.J.H Methods)
Gas adsorption methods are extensively used for the characterization of
porous solids. Of particular importance is the application of physical adsorption for
the determination of the specific surface area and pore size distribution of catalysts
with the use of methods such as BET and BJH.
Gas adsorption (particularly physical adsorption) occurs whenever a gas (the
adsorptive) interacts with the surface of a solid (the adsorbent) and forms the
adsorbate (Figure 3.1). As gas adsorption proceeds, molecules are attracted to the
pore surface of the solid (Figure 3.2 A). The specific surface area can be evaluated
at the stage where the first monolayer forms (Figure 3.2 B).
Figure 3.1: Physical adsorption scheme.
Adsorptive
Adsorbent
Adsorbate
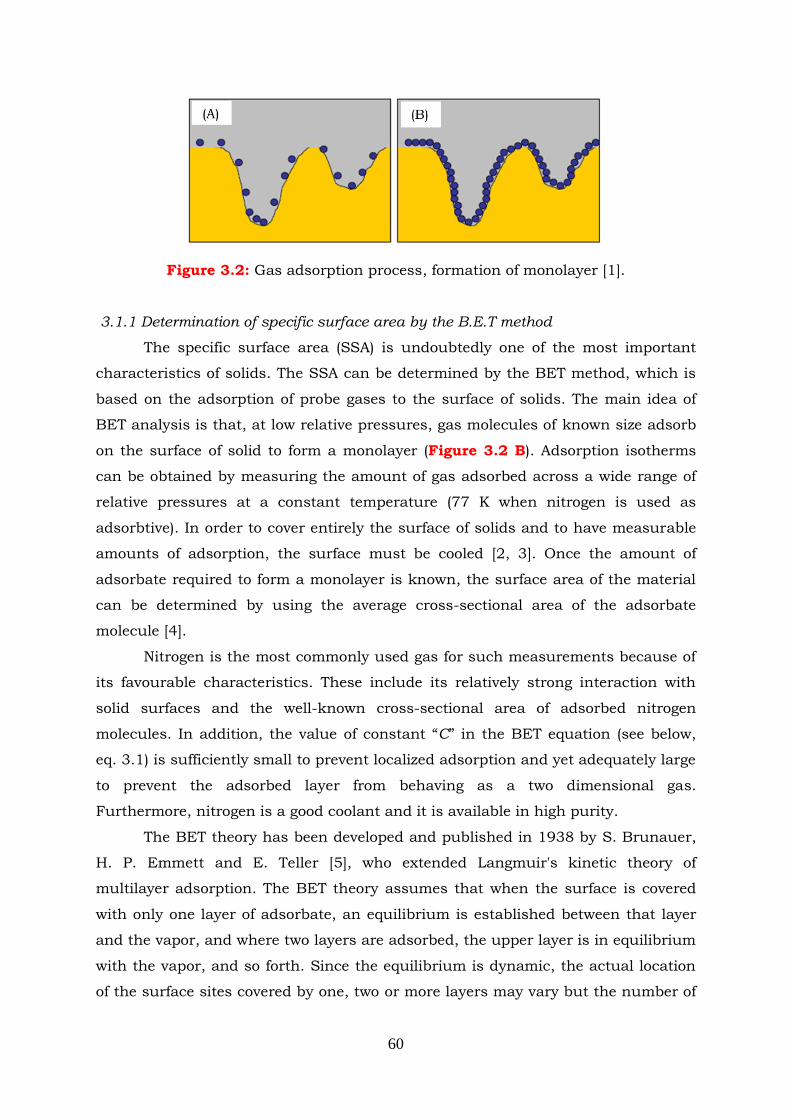
60
Figure 3.2: Gas adsorption process, formation of monolayer [1].
3.1.1 Determination of specific surface area by the B.E.T method
The specific surface area (SSA) is undoubtedly one of the most important
characteristics of solids. The SSA can be determined by the BET method, which is
based on the adsorption of probe gases to the surface of solids. The main idea of
BET analysis is that, at low relative pressures, gas molecules of known size adsorb
on the surface of solid to form a monolayer (Figure 3.2 B). Αdsorption isotherms
can be obtained by measuring the amount of gas adsorbed across a wide range of
relative pressures at a constant temperature (77 K when nitrogen is used as
adsorbtive). In order to cover entirely the surface of solids and to have measurable
amounts of adsorption, the surface must be cooled [2, 3]. Once the amount of
adsorbate required to form a monolayer is known, the surface area of the material
can be determined by using the average cross-sectional area of the adsorbate
molecule [4].
Nitrogen is the most commonly used gas for such measurements because of
its favourable characteristics. These include its relatively strong interaction with
solid surfaces and the well-known cross-sectional area of adsorbed nitrogen
molecules. In addition, the value of constant “C” in the BET equation (see below,
eq. 3.1) is sufficiently small to prevent localized adsorption and yet adequately large
to prevent the adsorbed layer from behaving as a two dimensional gas.
Furthermore, nitrogen is a good coolant and it is available in high purity.
The BET theory has been developed and published in 1938 by S. Brunauer,
H. P. Emmett and E. Teller [5], who extended Langmuir's kinetic theory of
multilayer adsorption. The BET theory assumes that when the surface is covered
with only one layer of adsorbate, an equilibrium is established between that layer
and the vapor, and where two layers are adsorbed, the upper layer is in equilibrium
with the vapor, and so forth. Since the equilibrium is dynamic, the actual location
of the surface sites covered by one, two or more layers may vary but the number of
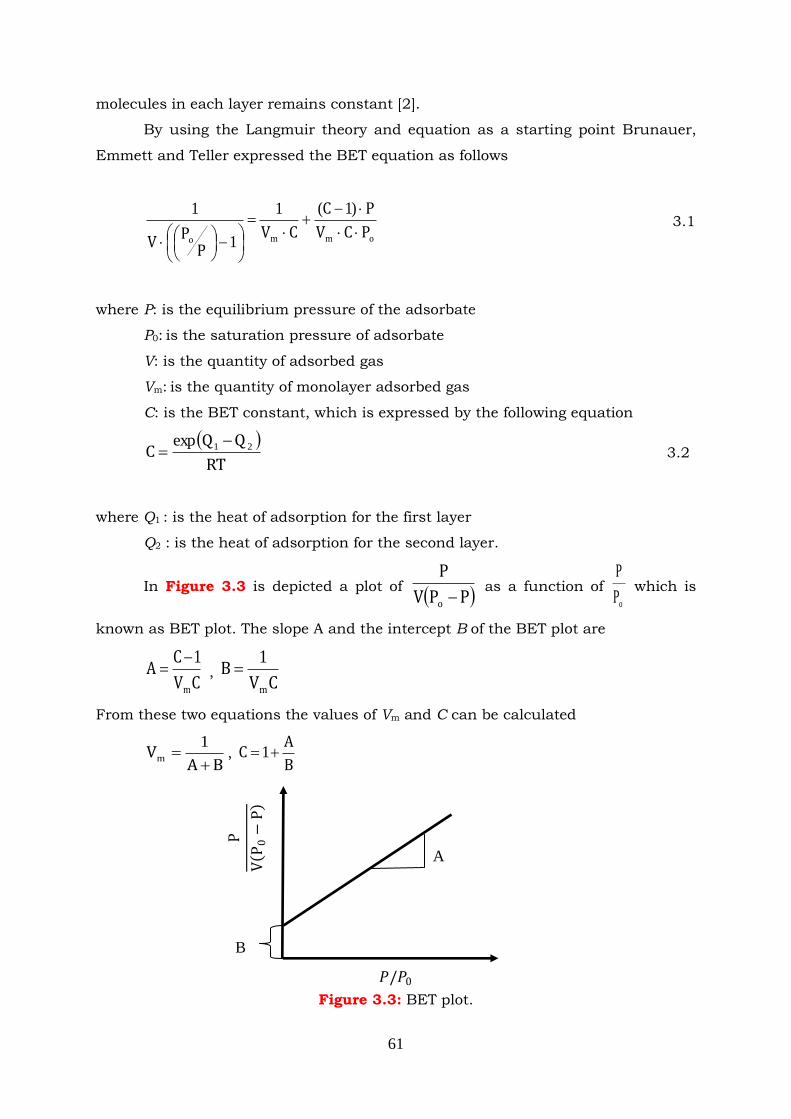
61
molecules in each layer remains constant [2].
By using the Langmuir theory and equation as a starting point Brunauer,
Emmett and Teller expressed the BET equation as follows
ommoPCV
PC
CVP
PV
)1(1
1
1 3.1
where P: is the equilibrium pressure of the adsorbate
P0: is the saturation pressure of adsorbate
V: is the quantity of adsorbed gas
Vm: is the quantity of monolayer adsorbed gas
C: is the BET constant, which is expressed by the following equation
RT
QQC 21exp
3.2
where Q1 : is the heat of adsorption for the first layer
Q2 : is the heat of adsorption for the second layer.
In Figure 3.3 is depicted a plot of PPV
P
o as a function of
oP
P which is
known as BET plot. The slope A and the intercept B of the BET plot are
CV
CA
m
1 ,
CVB
m
1
From these two equations the values of Vm and C can be calculated
BAVm
1,
B
AC 1
Figure 3.3: BET plot.
A
𝑃/𝑃0
P
V P
0−
P
B
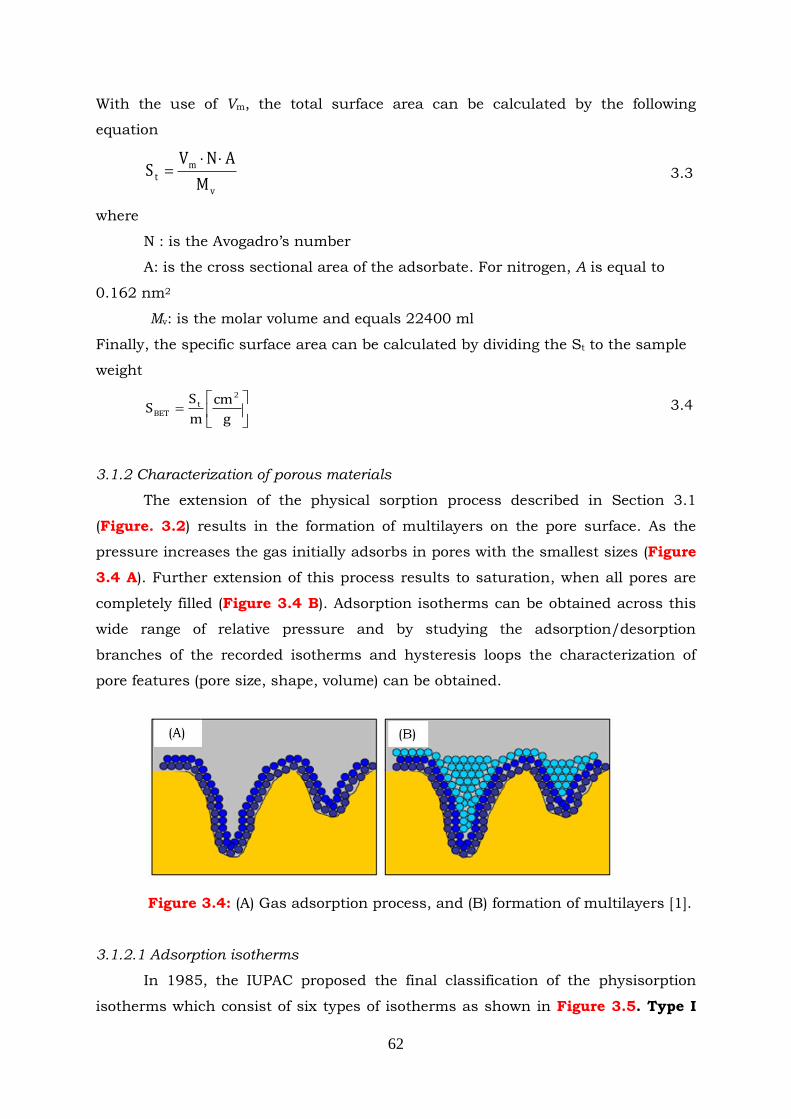
62
With the use of Vm, the total surface area can be calculated by the following
equation
v
mt
M
ANVS
3.3
where
N : is the Avogadro‟s number
A: is the cross sectional area of the adsorbate. For nitrogen, A is equal to
0.162 nm2
Mv: is the molar volume and equals 22400 ml
Finally, the specific surface area can be calculated by dividing the St to the sample
weight
g
cm
m
SS t
BET
2
3.4
3.1.2 Characterization of porous materials
The extension of the physical sorption process described in Section 3.1
(Figure. 3.2) results in the formation of multilayers on the pore surface. As the
pressure increases the gas initially adsorbs in pores with the smallest sizes (Figure
3.4 A). Further extension of this process results to saturation, when all pores are
completely filled (Figure 3.4 B). Adsorption isotherms can be obtained across this
wide range of relative pressure and by studying the adsorption/desorption
branches of the recorded isotherms and hysteresis loops the characterization of
pore features (pore size, shape, volume) can be obtained.
Figure 3.4: (A) Gas adsorption process, and (B) formation of multilayers [1].
3.1.2.1 Adsorption isotherms
In 1985, the IUPAC proposed the final classification of the physisorption
isotherms which consist of six types of isotherms as shown in Figure 3.5. Type I
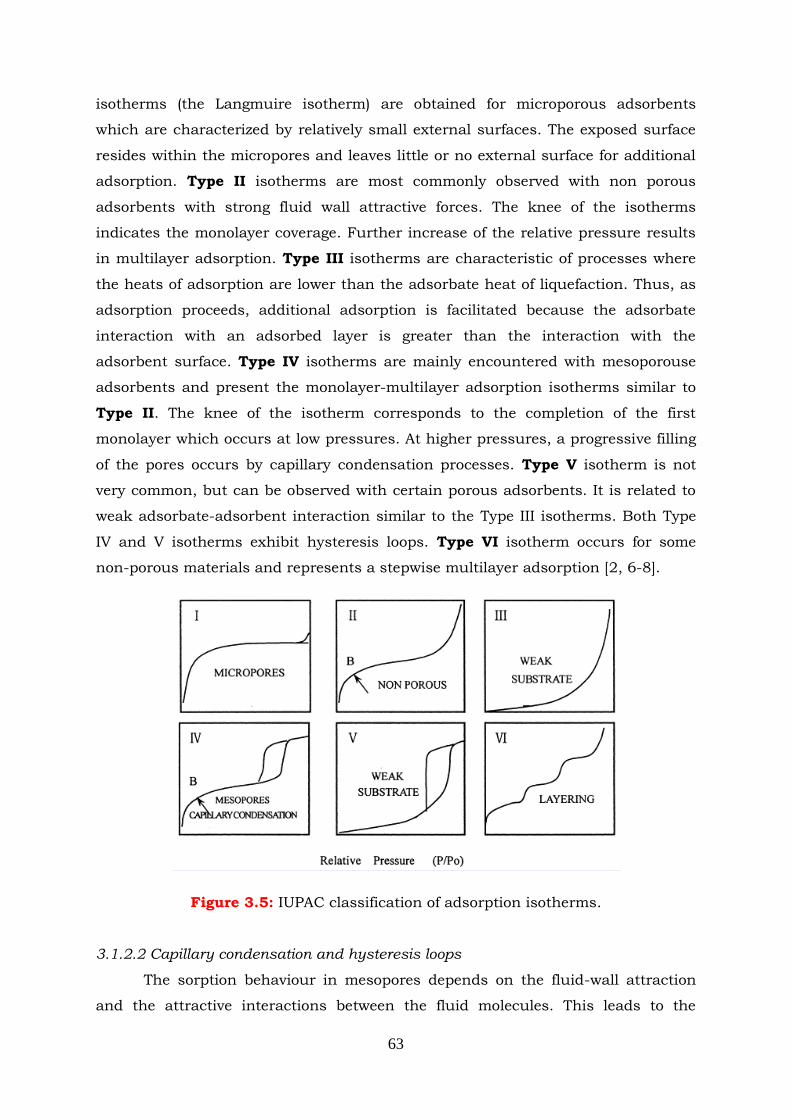
63
isotherms (the Langmuire isotherm) are obtained for microporous adsorbents
which are characterized by relatively small external surfaces. The exposed surface
resides within the micropores and leaves little or no external surface for additional
adsorption. Type II isotherms are most commonly observed with non porous
adsorbents with strong fluid wall attractive forces. The knee of the isotherms
indicates the monolayer coverage. Further increase of the relative pressure results
in multilayer adsorption. Type III isotherms are characteristic of processes where
the heats of adsorption are lower than the adsorbate heat of liquefaction. Thus, as
adsorption proceeds, additional adsorption is facilitated because the adsorbate
interaction with an adsorbed layer is greater than the interaction with the
adsorbent surface. Type IV isotherms are mainly encountered with mesoporouse
adsorbents and present the monolayer-multilayer adsorption isotherms similar to
Type II. The knee of the isotherm corresponds to the completion of the first
monolayer which occurs at low pressures. At higher pressures, a progressive filling
of the pores occurs by capillary condensation processes. Type V isotherm is not
very common, but can be observed with certain porous adsorbents. It is related to
weak adsorbate-adsorbent interaction similar to the Type III isotherms. Both Type
IV and V isotherms exhibit hysteresis loops. Type VI isotherm occurs for some
non-porous materials and represents a stepwise multilayer adsorption [2, 6-8].
Figure 3.5: IUPAC classification of adsorption isotherms.
3.1.2.2 Capillary condensation and hysteresis loops
The sorption behaviour in mesopores depends on the fluid-wall attraction
and the attractive interactions between the fluid molecules. This leads to the
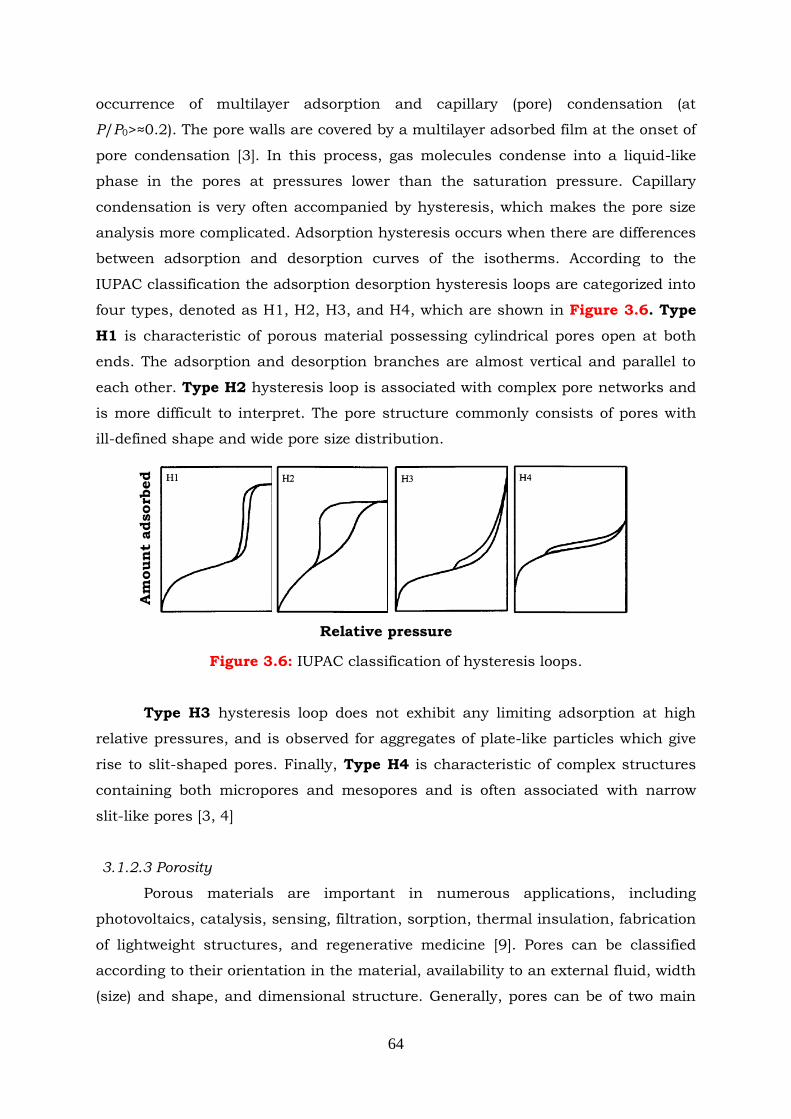
64
occurrence of multilayer adsorption and capillary (pore) condensation (at
P/P0>≈0.2). The pore walls are covered by a multilayer adsorbed film at the onset of
pore condensation [3]. In this process, gas molecules condense into a liquid-like
phase in the pores at pressures lower than the saturation pressure. Capillary
condensation is very often accompanied by hysteresis, which makes the pore size
analysis more complicated. Adsorption hysteresis occurs when there are differences
between adsorption and desorption curves of the isotherms. According to the
IUPAC classification the adsorption desorption hysteresis loops are categorized into
four types, denoted as H1, H2, H3, and H4, which are shown in Figure 3.6. Type
H1 is characteristic of porous material possessing cylindrical pores open at both
ends. The adsorption and desorption branches are almost vertical and parallel to
each other. Type H2 hysteresis loop is associated with complex pore networks and
is more difficult to interpret. The pore structure commonly consists of pores with
ill-defined shape and wide pore size distribution.
Figure 3.6: IUPAC classification of hysteresis loops.
Type H3 hysteresis loop does not exhibit any limiting adsorption at high
relative pressures, and is observed for aggregates of plate-like particles which give
rise to slit-shaped pores. Finally, Type H4 is characteristic of complex structures
containing both micropores and mesopores and is often associated with narrow
slit-like pores [3, 4]
3.1.2.3 Porosity
Porous materials are important in numerous applications, including
photovoltaics, catalysis, sensing, filtration, sorption, thermal insulation, fabrication
of lightweight structures, and regenerative medicine [9]. Pores can be classified
according to their orientation in the material, availability to an external fluid, width
(size) and shape, and dimensional structure. Generally, pores can be of two main
Am
oun
t adsorb
ed
Relative pressure
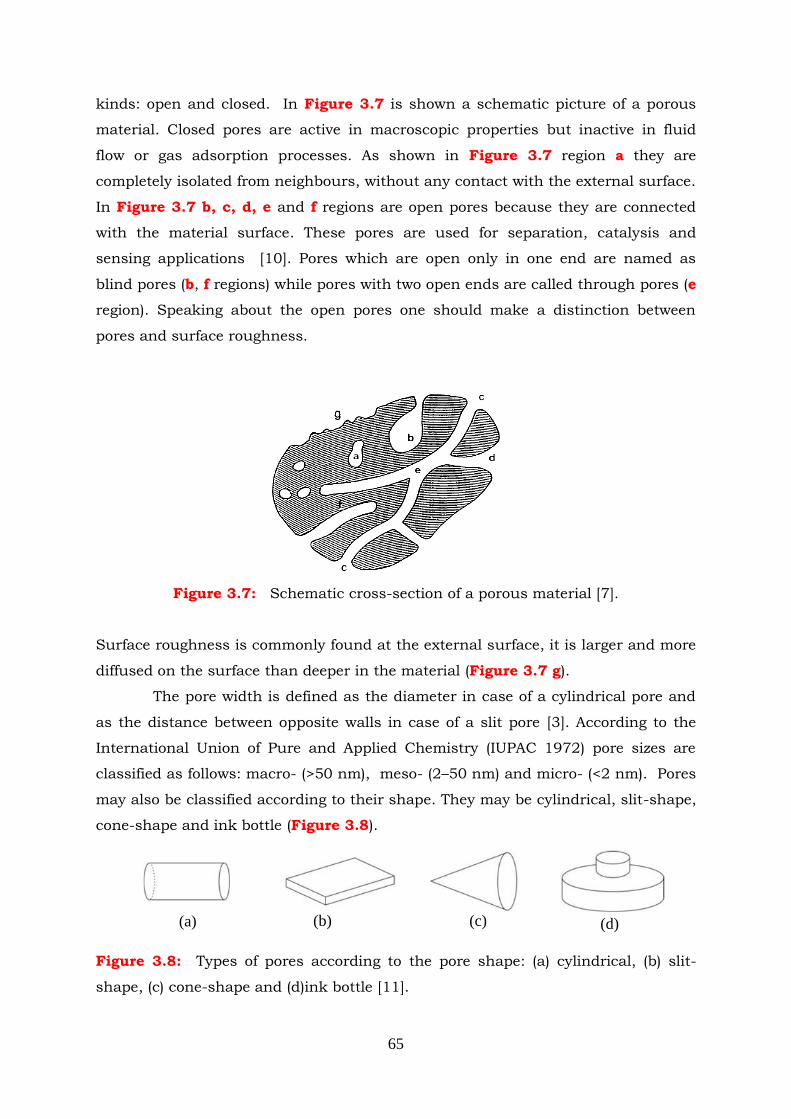
65
kinds: open and closed. In Figure 3.7 is shown a schematic picture of a porous
material. Closed pores are active in macroscopic properties but inactive in fluid
flow or gas adsorption processes. As shown in Figure 3.7 region a they are
completely isolated from neighbours, without any contact with the external surface.
In Figure 3.7 b, c, d, e and f regions are open pores because they are connected
with the material surface. These pores are used for separation, catalysis and
sensing applications [10]. Pores which are open only in one end are named as
blind pores (b, f regions) while pores with two open ends are called through pores (e
region). Speaking about the open pores one should make a distinction between
pores and surface roughness.
Figure 3.7: Schematic cross-section of a porous material [7].
Surface roughness is commonly found at the external surface, it is larger and more
diffused on the surface than deeper in the material (Figure 3.7 g).
The pore width is defined as the diameter in case of a cylindrical pore and
as the distance between opposite walls in case of a slit pore [3]. According to the
International Union of Pure and Applied Chemistry (IUPAC 1972) pore sizes are
classified as follows: macro- (>50 nm), meso- (2–50 nm) and micro- (<2 nm). Pores
may also be classified according to their shape. They may be cylindrical, slit-shape,
cone-shape and ink bottle (Figure 3.8).
Figure 3.8: Types of pores according to the pore shape: (a) cylindrical, (b) slit-
shape, (c) cone-shape and (d)ink bottle [11].
(a) (b) (c) (d)
66
To make a quick distinction between different porous systems, it is
convenient to use the parameter “porosity” (donated Ø) which is a measure of the
void spaces in a material and is defined as the ratio of pore volume to total volume
(bulk volume):
Øvolumetotal
volumepore 3.5
Porous materials can be separated also into three types according to their
porosity: low porosity (below 1-10%), medium porosity (10–70%) and high porosity
(more then 70%) [12].
3.1.2.4 Pore size distribution (PSD)
The pore size distribution (PSD) is one of the important attributes that is
used for characterization of porous materials, and is defined as the distribution of
pore volume with respect to pore size. It is an important factor which controls the
diffusion of reactants and products in the porous catalyst and thus an essential
property for catalyst characterization [13]. In catalytic systems a deactivation of
catalysts can occur through the pore blockage. The study of pore volume and size
distribution can be used to control such processes by comparing the used catalyst
with the fresh one.
Numerous methods and theories exist for the estimation of pores
characteristics. Dubinin-Radushkevich approach, Horvath and Kawazoe (HK)
methods are used for micropore size materials but are not suitable for mesopore
materials. For macroporous and some mesoporous materials the Kelvin equation
(e.g. BJH-method) is commonly applicable [14].
The Kelvin equation (3.6) is used to interpret type IV isotherms, which are
the general isotherms for adsorption on mesoporous materials
rRT
Vγ
P
P
o
2ln 3.6
where P0: is the saturated vapor pressure at absolute temperature T
γ: is the surface tension
V: is the molar volume of the liquid
r: is the radius of the cylindrical pore
R: is the gas constant
67
This equation applies to the range of the isotherm that corresponds to
capillary condensation, that is, the section of the isotherm above the first “knee”.
Using the Kelvin equation, one can calculate the value of the pore radius for any
point on the isotherm. According to the capillary condensation hypothesis, all the
pores with radii smaller than that size become filled at that pressure. Consequently
one can obtain the cumulative pore volume as a function of pressure. The pore size
distribution is then obtained by taking the derivative of the cumulative pore volume
as a function of pore radius [15].
3.1.3 Apparatus and experimental procedures
A Micromeritics TriStar 3000 apparatus has been used for the determination
of the specific surface area of the catalysts using N2 adsorption at the temperature
of liquid nitrogen (-196 oC) by applying the BET method. The TriStar 3000 is an
automated gas adsorption analyzer which contains three ports, allowing to analyze
up to three samples simultaneously. It consists of the TriStar analyzer, a FlowPrep
degasser for preparing samples, a vacuum pump, and a control module for analysis
and report options. The FlowPrep is a degassing unit which is used to remove
adsorbed contaminants from the surface and pores of a sample before analysis
[16].
It is important to know the true sample mass, because results are expressed
in units of surface area per gram of sample. For this reason, prior to the analysis,
the weight of the empty tube and then of the same tube containing the sample
(~100 mg) was measured. After the sample has been weighted the moisture and
other substances adsorbed on the surface of the sample, were removed in situ by
heating at 573 K for 1 h under a stream of nitrogen with a use of Flowprep 060
degasser. When the degassing procedure was completed, the sample weight was
measured once again to record the sample mass after degassing. Afterwards the
sample was transferred to an analysis port where the measurement was
accomplished.
SSAs were calculated following the standard B.E.T. method for nitrogen
relative pressures in the range 0.06 < P/P0 < 0.20. Together with SSA, the pore size
and volume have been also determined. Pore size distribution of the samples
was determined following the Barret–Joyner–Halenda (BJH) method at liquid
nitrogen temperature (-196 ˚C) using the apparatus software.
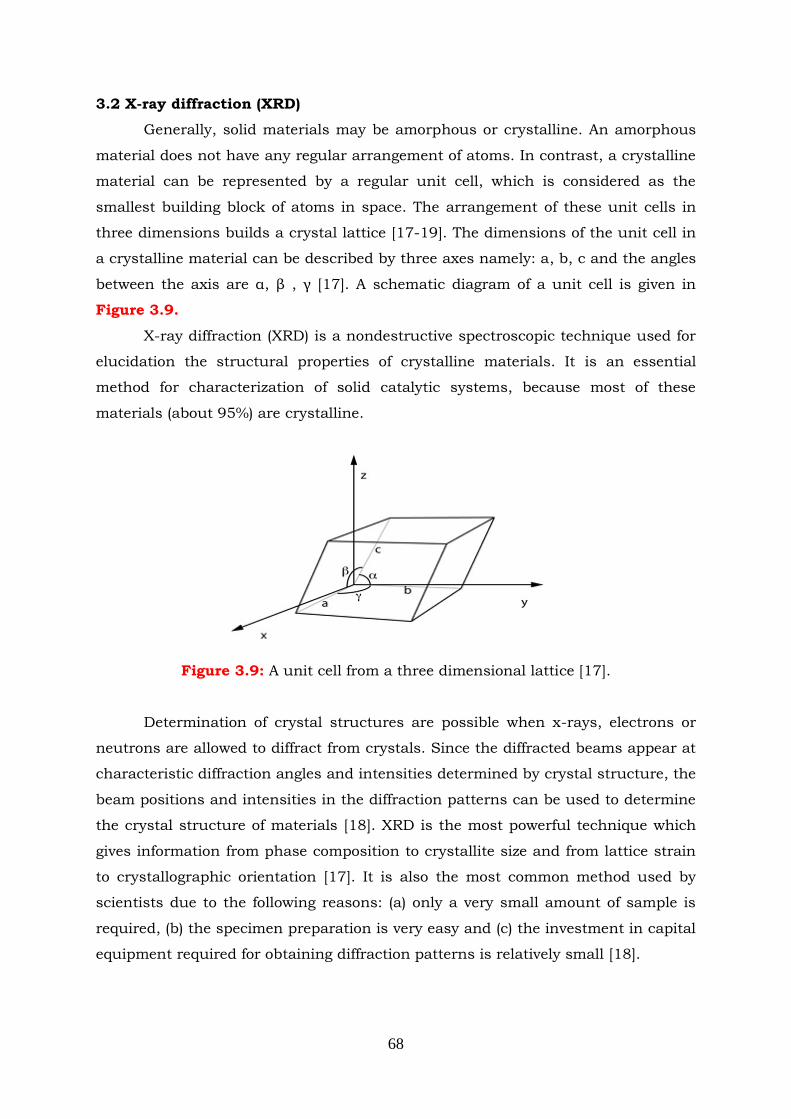
68
3.2 X-ray diffraction (XRD)
Generally, solid materials may be amorphous or crystalline. An amorphous
material does not have any regular arrangement of atoms. In contrast, a crystalline
material can be represented by a regular unit cell, which is considered as the
smallest building block of atoms in space. The arrangement of these unit cells in
three dimensions builds a crystal lattice [17-19]. The dimensions of the unit cell in
a crystalline material can be described by three axes namely: a, b, c and the angles
between the axis are α, β , γ [17]. A schematic diagram of a unit cell is given in
Figure 3.9.
X-ray diffraction (XRD) is a nondestructive spectroscopic technique used for
elucidation the structural properties of crystalline materials. It is an essential
method for characterization of solid catalytic systems, because most of these
materials (about 95%) are crystalline.
Figure 3.9: A unit cell from a three dimensional lattice [17].
Determination of crystal structures are possible when x-rays, electrons or
neutrons are allowed to diffract from crystals. Since the diffracted beams appear at
characteristic diffraction angles and intensities determined by crystal structure, the
beam positions and intensities in the diffraction patterns can be used to determine
the crystal structure of materials [18]. XRD is the most powerful technique which
gives information from phase composition to crystallite size and from lattice strain
to crystallographic orientation [17]. It is also the most common method used by
scientists due to the following reasons: (a) only a very small amount of sample is
required, (b) the specimen preparation is very easy and (c) the investment in capital
equipment required for obtaining diffraction patterns is relatively small [18].
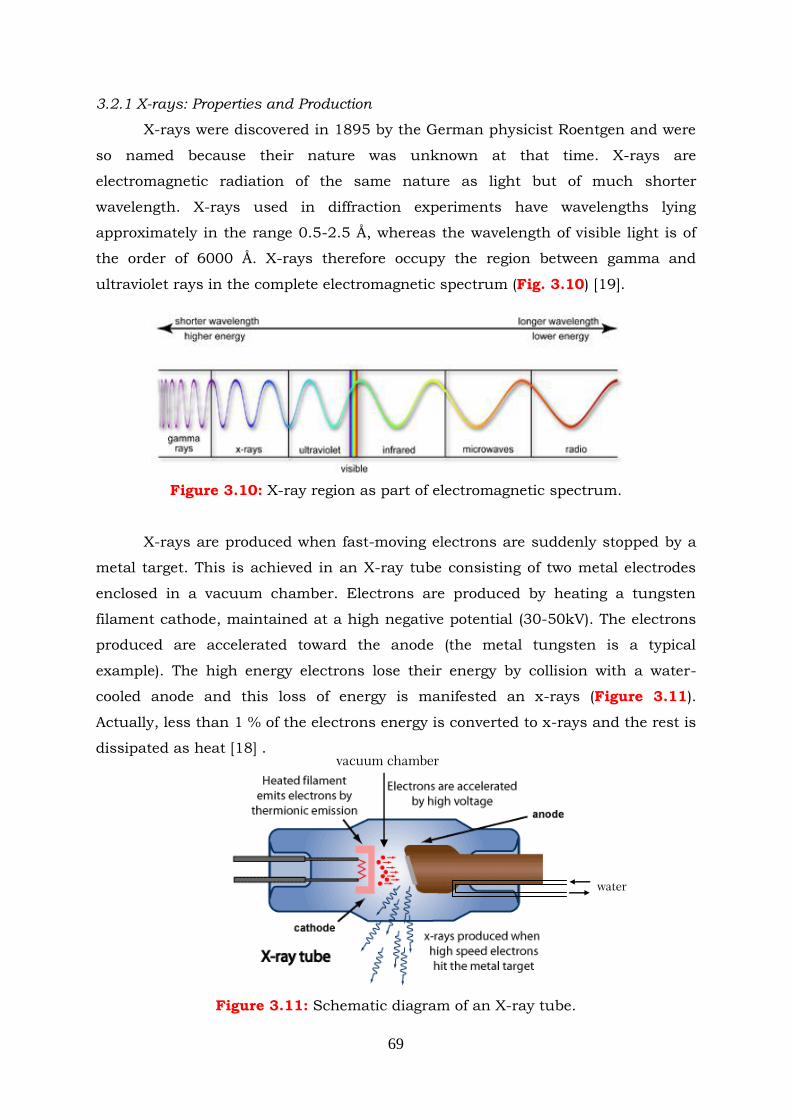
69
3.2.1 X-rays: Properties and Production
X-rays were discovered in 1895 by the German physicist Roentgen and were
so named because their nature was unknown at that time. X-rays are
electromagnetic radiation of the same nature as light but of much shorter
wavelength. X-rays used in diffraction experiments have wavelengths lying
approximately in the range 0.5-2.5 Å, whereas the wavelength of visible light is of
the order of 6000 Å. X-rays therefore occupy the region between gamma and
ultraviolet rays in the complete electromagnetic spectrum (Fig. 3.10) [19].
Figure 3.10: X-ray region as part of electromagnetic spectrum.
X-rays are produced when fast-moving electrons are suddenly stopped by a
metal target. This is achieved in an X-ray tube consisting of two metal electrodes
enclosed in a vacuum chamber. Electrons are produced by heating a tungsten
filament cathode, maintained at a high negative potential (30-50kV). The electrons
produced are accelerated toward the anode (the metal tungsten is a typical
example). The high energy electrons lose their energy by collision with a water-
cooled anode and this loss of energy is manifested an x-rays (Figure 3.11).
Actually, less than 1 % of the electrons energy is converted to x-rays and the rest is
dissipated as heat [18] .
Figure 3.11: Schematic diagram of an X-ray tube.
water
vacuum chamber
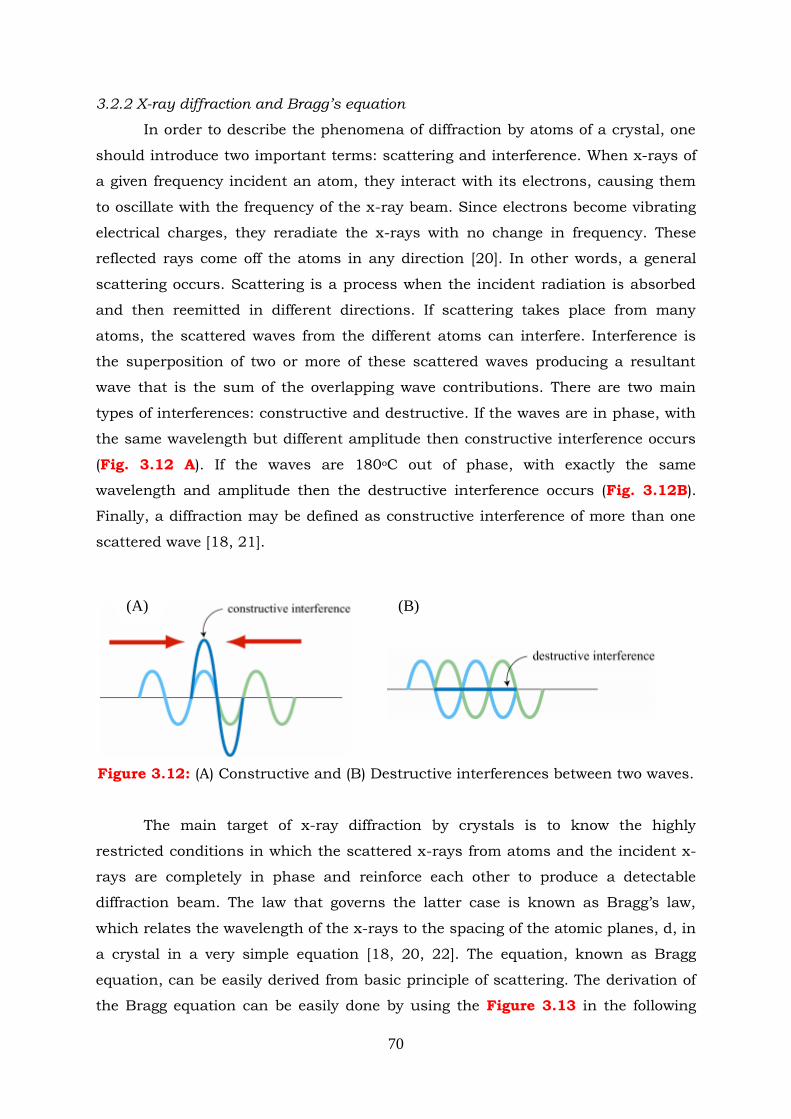
70
3.2.2 X-ray diffraction and Bragg’s equation
In order to describe the phenomena of diffraction by atoms of a crystal, one
should introduce two important terms: scattering and interference. When x-rays of
a given frequency incident an atom, they interact with its electrons, causing them
to oscillate with the frequency of the x-ray beam. Since electrons become vibrating
electrical charges, they reradiate the x-rays with no change in frequency. These
reflected rays come off the atoms in any direction [20]. In other words, a general
scattering occurs. Scattering is a process when the incident radiation is absorbed
and then reemitted in different directions. If scattering takes place from many
atoms, the scattered waves from the different atoms can interfere. Interference is
the superposition of two or more of these scattered waves producing a resultant
wave that is the sum of the overlapping wave contributions. There are two main
types of interferences: constructive and destructive. If the waves are in phase, with
the same wavelength but different amplitude then constructive interference occurs
(Fig. 3.12 A). If the waves are 180oC out of phase, with exactly the same
wavelength and amplitude then the destructive interference occurs (Fig. 3.12B).
Finally, a diffraction may be defined as constructive interference of more than one
scattered wave [18, 21].
Figure 3.12: (A) Constructive and (B) Destructive interferences between two waves.
The main target of x-ray diffraction by crystals is to know the highly
restricted conditions in which the scattered x-rays from atoms and the incident x-
rays are completely in phase and reinforce each other to produce a detectable
diffraction beam. The law that governs the latter case is known as Bragg‟s law,
which relates the wavelength of the x-rays to the spacing of the atomic planes, d, in
a crystal in a very simple equation [18, 20, 22]. The equation, known as Bragg
equation, can be easily derived from basic principle of scattering. The derivation of
the Bragg equation can be easily done by using the Figure 3.13 in the following
(B) (A)
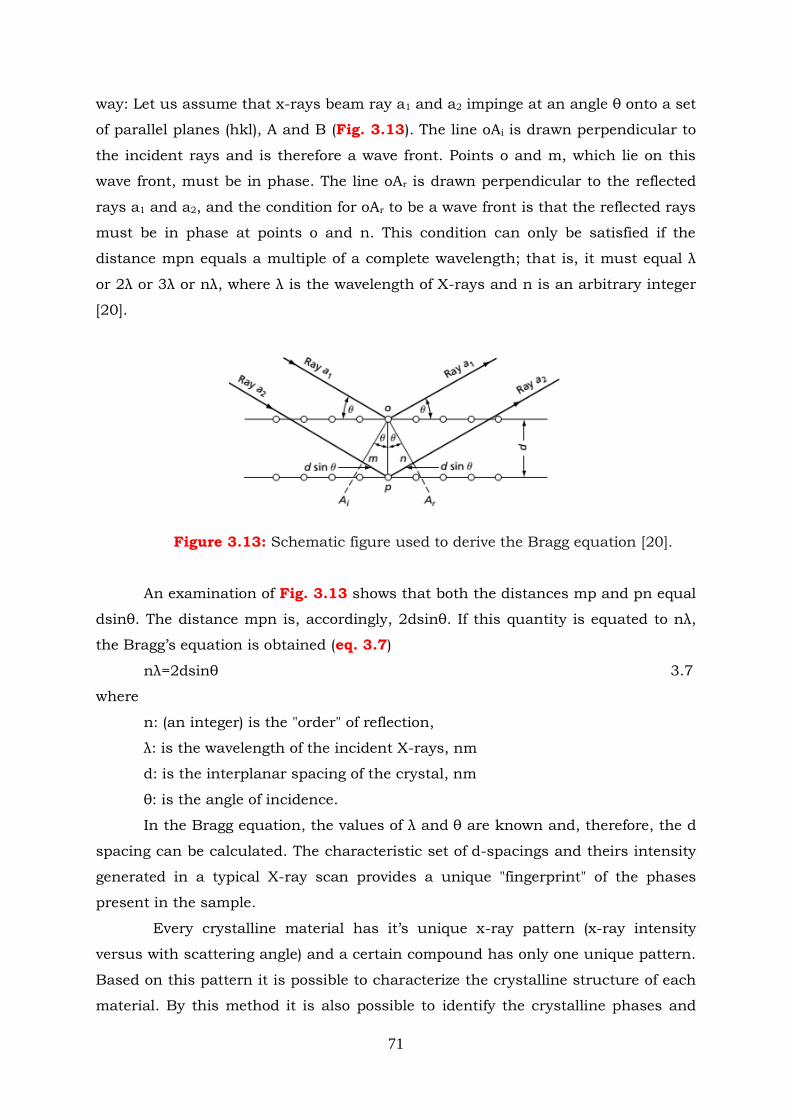
71
way: Let us assume that x-rays beam ray a1 and a2 impinge at an angle θ onto a set
of parallel planes (hkl), A and B (Fig. 3.13). The line oAi is drawn perpendicular to
the incident rays and is therefore a wave front. Points o and m, which lie on this
wave front, must be in phase. The line oAr is drawn perpendicular to the reflected
rays a1 and a2, and the condition for oAr to be a wave front is that the reflected rays
must be in phase at points o and n. This condition can only be satisfied if the
distance mpn equals a multiple of a complete wavelength; that is, it must equal λ
or 2λ or 3λ or nλ, where λ is the wavelength of X-rays and n is an arbitrary integer
[20].
Figure 3.13: Schematic figure used to derive the Bragg equation [20].
An examination of Fig. 3.13 shows that both the distances mp and pn equal
dsinθ. The distance mpn is, accordingly, 2dsinθ. If this quantity is equated to nλ,
the Bragg‟s equation is obtained (eq. 3.7)
nλ=2dsinθ
3.7
where
n: (an integer) is the "order" of reflection,
λ: is the wavelength of the incident X-rays, nm
d: is the interplanar spacing of the crystal, nm
θ: is the angle of incidence.
In the Bragg equation, the values of λ and θ are known and, therefore, the d
spacing can be calculated. The characteristic set of d-spacings and theirs intensity
generated in a typical X-ray scan provides a unique "fingerprint" of the phases
present in the sample.
Every crystalline material has it‟s unique x-ray pattern (x-ray intensity
versus with scattering angle) and a certain compound has only one unique pattern.
Based on this pattern it is possible to characterize the crystalline structure of each
material. By this method it is also possible to identify the crystalline phases and
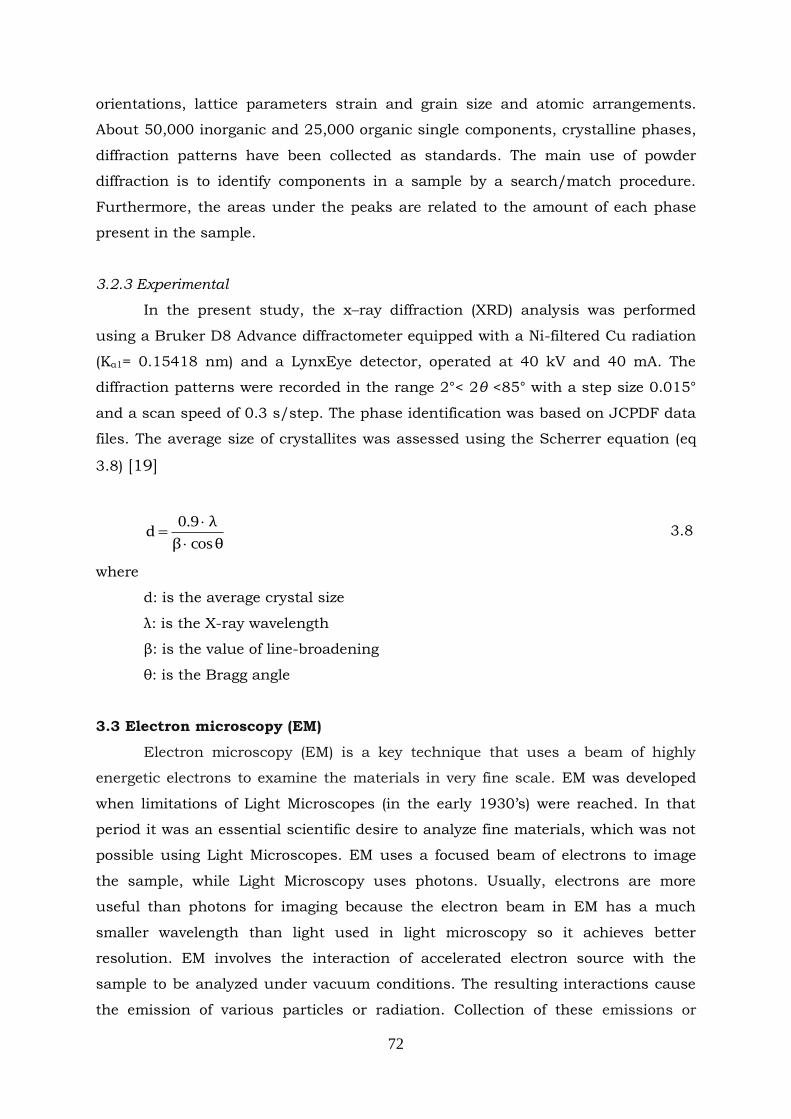
72
orientations, lattice parameters strain and grain size and atomic arrangements.
About 50,000 inorganic and 25,000 organic single components, crystalline phases,
diffraction patterns have been collected as standards. The main use of powder
diffraction is to identify components in a sample by a search/match procedure.
Furthermore, the areas under the peaks are related to the amount of each phase
present in the sample.
3.2.3 Experimental
In the present study, the x–ray diffraction (XRD) analysis was performed
using a Bruker D8 Advance diffractometer equipped with a Ni-filtered Cu radiation
(Kα1= 0.15418 nm) and a LynxEye detector, operated at 40 kV and 40 mA. The
diffraction patterns were recorded in the range 2°< 2θ <85° with a step size 0.015°
and a scan speed of 0.3 s/step. The phase identification was based on JCPDF data
files. The average size of crystallites was assessed using the Scherrer equation (eq
3.8) [19]
θβ
λd
cos
9.0
3.8
where
d: is the average crystal size
λ: is the X-ray wavelength
β: is the value of line-broadening
θ: is the Bragg angle
3.3 Electron microscopy (EM)
Electron microscopy (EM) is a key technique that uses a beam of highly
energetic electrons to examine the materials in very fine scale. EM was developed
when limitations of Light Microscopes (in the early 1930‟s) were reached. In that
period it was an essential scientific desire to analyze fine materials, which was not
possible using Light Microscopes. EM uses a focused beam of electrons to image
the sample, while Light Microscopy uses photons. Usually, electrons are more
useful than photons for imaging because the electron beam in EM has a much
smaller wavelength than light used in light microscopy so it achieves better
resolution. EM involves the interaction of accelerated electron source with the
sample to be analyzed under vacuum conditions. The resulting interactions cause
the emission of various particles or radiation. Collection of these emissions or
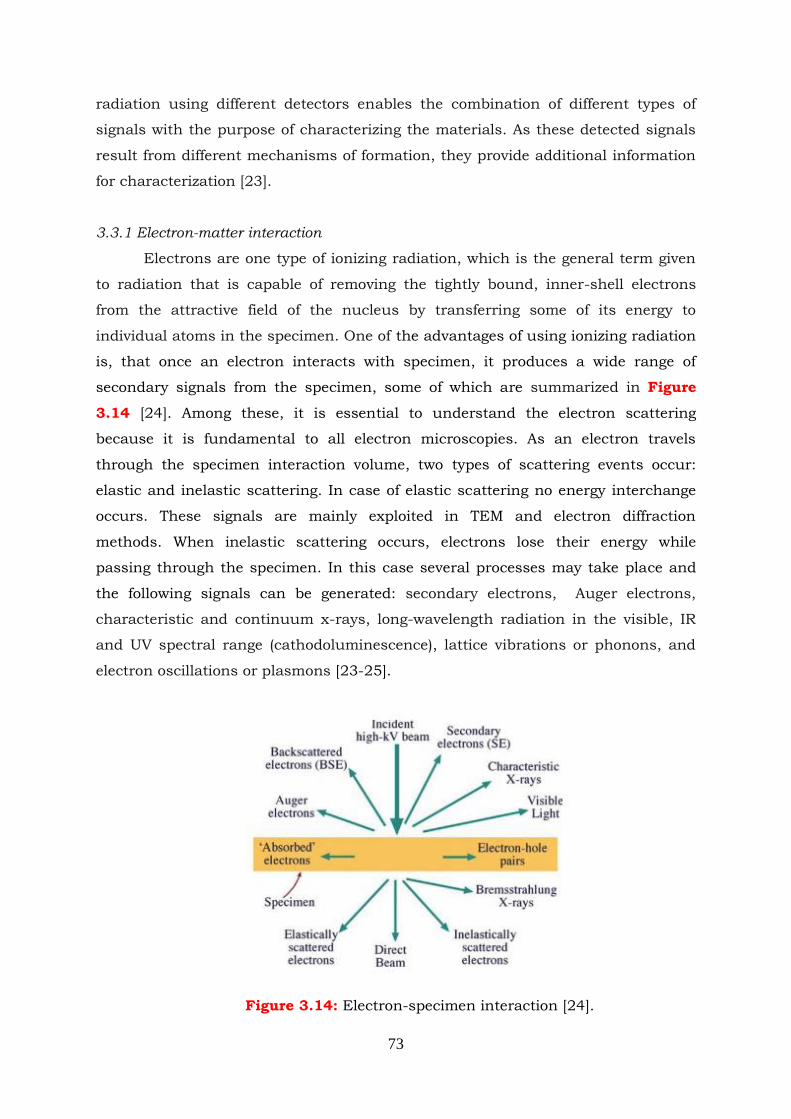
73
radiation using different detectors enables the combination of different types of
signals with the purpose of characterizing the materials. As these detected signals
result from different mechanisms of formation, they provide additional information
for characterization [23].
3.3.1 Electron-matter interaction
Electrons are one type of ionizing radiation, which is the general term given
to radiation that is capable of removing the tightly bound, inner-shell electrons
from the attractive field of the nucleus by transferring some of its energy to
individual atoms in the specimen. One of the advantages of using ionizing radiation
is, that once an electron interacts with specimen, it produces a wide range of
secondary signals from the specimen, some of which are summarized in Figure
3.14 [24]. Among these, it is essential to understand the electron scattering
because it is fundamental to all electron microscopies. As an electron travels
through the specimen interaction volume, two types of scattering events occur:
elastic and inelastic scattering. In case of elastic scattering no energy interchange
occurs. These signals are mainly exploited in TEM and electron diffraction
methods. When inelastic scattering occurs, electrons lose their energy while
passing through the specimen. In this case several processes may take place and
the following signals can be generated: secondary electrons, Auger electrons,
characteristic and continuum x-rays, long-wavelength radiation in the visible, IR
and UV spectral range (cathodoluminescence), lattice vibrations or phonons, and
electron oscillations or plasmons [23-25].
Figure 3.14: Electron-specimen interaction [24].
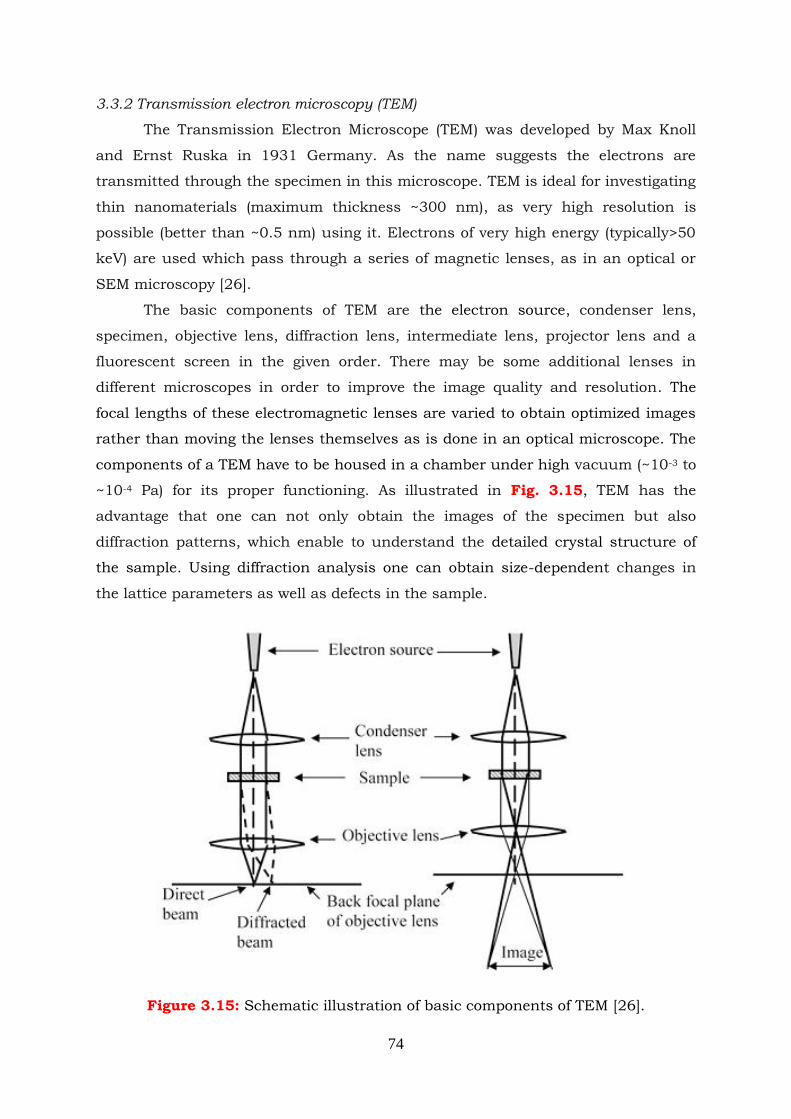
74
3.3.2 Transmission electron microscopy (TEM)
The Transmission Electron Microscope (TEM) was developed by Max Knoll
and Ernst Ruska in 1931 Germany. As the name suggests the electrons are
transmitted through the specimen in this microscope. TEM is ideal for investigating
thin nanomaterials (maximum thickness ~300 nm), as very high resolution is
possible (better than ~0.5 nm) using it. Electrons of very high energy (typically>50
keV) are used which pass through a series of magnetic lenses, as in an optical or
SEM microscopy [26].
The basic components of TEM are the electron source, condenser lens,
specimen, objective lens, diffraction lens, intermediate lens, projector lens and a
fluorescent screen in the given order. There may be some additional lenses in
different microscopes in order to improve the image quality and resolution. The
focal lengths of these electromagnetic lenses are varied to obtain optimized images
rather than moving the lenses themselves as is done in an optical microscope. The
components of a TEM have to be housed in a chamber under high vacuum (~10-3 to
~10-4 Pa) for its proper functioning. As illustrated in Fig. 3.15, TEM has the
advantage that one can not only obtain the images of the specimen but also
diffraction patterns, which enable to understand the detailed crystal structure of
the sample. Using diffraction analysis one can obtain size-dependent changes in
the lattice parameters as well as defects in the sample.
Figure 3.15: Schematic illustration of basic components of TEM [26].
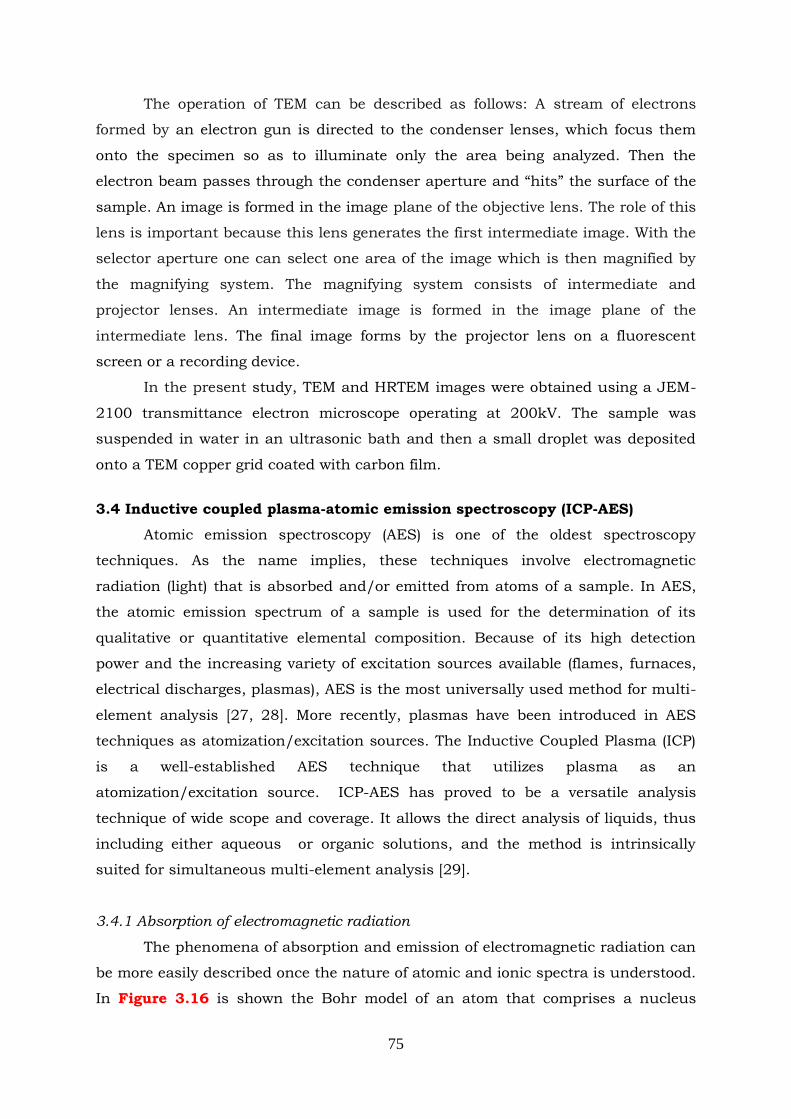
75
The operation of TEM can be described as follows: A stream of electrons
formed by an electron gun is directed to the condenser lenses, which focus them
onto the specimen so as to illuminate only the area being analyzed. Then the
electron beam passes through the condenser aperture and “hits” the surface of the
sample. An image is formed in the image plane of the objective lens. The role of this
lens is important because this lens generates the first intermediate image. With the
selector aperture one can select one area of the image which is then magnified by
the magnifying system. The magnifying system consists of intermediate and
projector lenses. An intermediate image is formed in the image plane of the
intermediate lens. The final image forms by the projector lens on a fluorescent
screen or a recording device.
In the present study, ΤΕΜ and HRTEM images were obtained using a JEM-
2100 transmittance electron microscope operating at 200kV. The sample was
suspended in water in an ultrasonic bath and then a small droplet was deposited
onto a TEM copper grid coated with carbon film.
3.4 Inductive coupled plasma-atomic emission spectroscopy (ICP-AES)
Atomic emission spectroscopy (AES) is one of the oldest spectroscopy
techniques. As the name implies, these techniques involve electromagnetic
radiation (light) that is absorbed and/or emitted from atoms of a sample. In AES,
the atomic emission spectrum of a sample is used for the determination of its
qualitative or quantitative elemental composition. Because of its high detection
power and the increasing variety of excitation sources available (flames, furnaces,
electrical discharges, plasmas), AES is the most universally used method for multi-
element analysis [27, 28]. More recently, plasmas have been introduced in AES
techniques as atomization/excitation sources. The Inductive Coupled Plasma (ICP)
is a well-established AES technique that utilizes plasma as an
atomization/excitation source. ICP-AES has proved to be a versatile analysis
technique of wide scope and coverage. It allows the direct analysis of liquids, thus
including either aqueous or organic solutions, and the method is intrinsically
suited for simultaneous multi-element analysis [29].
3.4.1 Absorption of electromagnetic radiation
The phenomena of absorption and emission of electromagnetic radiation can
be more easily described once the nature of atomic and ionic spectra is understood.
In Figure 3.16 is shown the Bohr model of an atom that comprises a nucleus
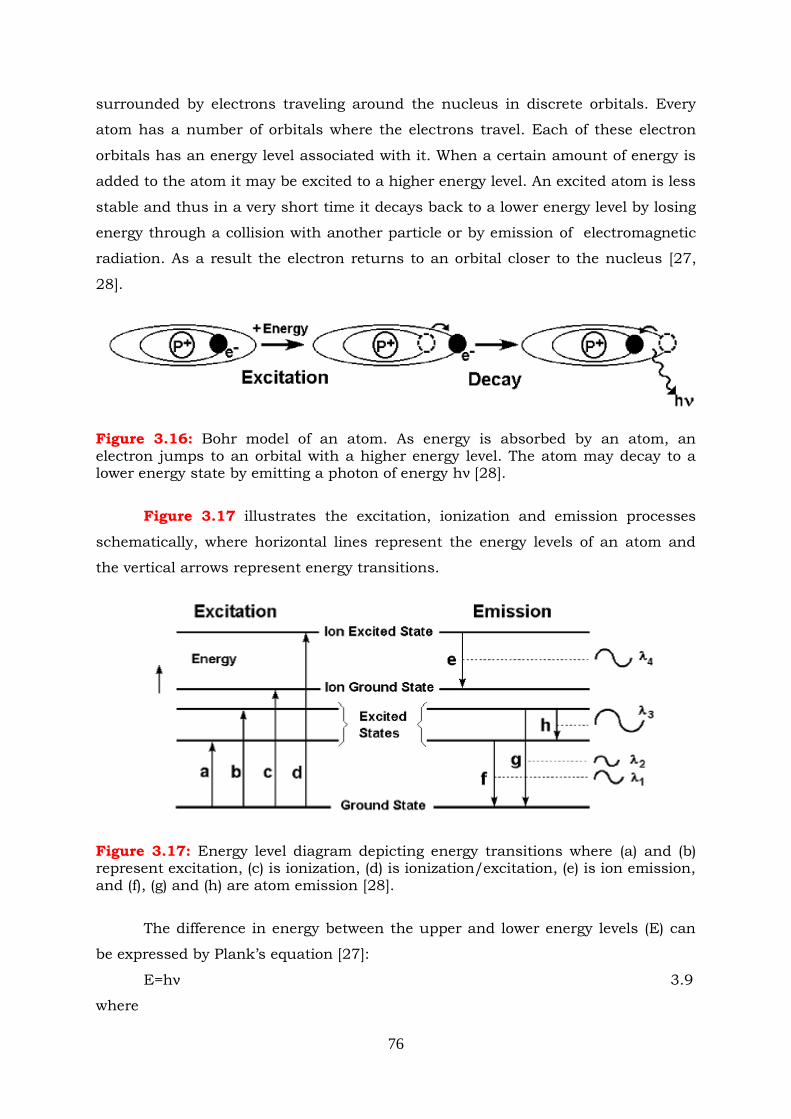
76
surrounded by electrons traveling around the nucleus in discrete orbitals. Every
atom has a number of orbitals where the electrons travel. Each of these electron
orbitals has an energy level associated with it. When a certain amount of energy is
added to the atom it may be excited to a higher energy level. An excited atom is less
stable and thus in a very short time it decays back to a lower energy level by losing
energy through a collision with another particle or by emission of electromagnetic
radiation. As a result the electron returns to an orbital closer to the nucleus [27,
28].
Figure 3.16: Bohr model of an atom. As energy is absorbed by an atom, an electron jumps to an orbital with a higher energy level. The atom may decay to a lower energy state by emitting a photon of energy hν [28].
Figure 3.17 illustrates the excitation, ionization and emission processes
schematically, where horizontal lines represent the energy levels of an atom and
the vertical arrows represent energy transitions.
Figure 3.17: Energy level diagram depicting energy transitions where (a) and (b) represent excitation, (c) is ionization, (d) is ionization/excitation, (e) is ion emission, and (f), (g) and (h) are atom emission [28].
The difference in energy between the upper and lower energy levels (E) can
be expressed by Plank‟s equation [27]:
E=hν 3.9
where
77
h: is the Planck‟s constant (h = 6.626 × 10⁻³⁴ J s)
ν: is the frequency of emitted radiation
Since frequency (ν) and wavelength (λ) are related by the equation
λ=c/ν 3.10
where c: is the light speed (c=2.997 × 10⁸ m s−1)
The combination of the 3.9 and 3.10 equations gives
E=hc/λ 3.11
The derived equation (3.11) shows the energy-wavelength relation. Every
element has its own characteristic set of energy levels and thus its own set of
absorption and emission wavelengths. This is the main property that makes atomic
spectrometry useful for element-specific analytical techniques.
3.4.2 ICP-AES: Operation and sources
The role of the excitation sources in AES technique is of fundamental
importance. An excitation source must be able to remove the water (or other
solvent) from a liquid sample (desolvation), break the sample particles into
molecules (dissociation), break the molecules into atoms (atomization) and add
energy to the atoms (excitation) [27]. In Figure 3.18 are presented the steps
involved in determining the elemental content of an aqueous phase sample by ICP-
AES.
Generally, there are many types of sources used in analytical atomic
spectroscopy to dissociate sample molecules into free atoms: flames, furnaces and
electrical discharges, high-power lasers. More recently, other types namely
plasmas, have been proposed as atomization/excitation sources for atomic
spectroscopy analysis [28, 30]. A plasma is an electrically neutral, highly ionized
gas with sufficiently high temperature to atomize, ionize and excite most of the
elements of the Periodic Table. Although there have been many attempts to
generate plasma with different gases such as oxygen, hydrogen and carbon dioxide,
most analytical plasmas operate with pure argon or helium [30, 31]. This is
because these gases can be obtained in a relatively pure form also they have good
characteristics for atomization, ionization and excitation of the analyte, and are
readily available. Plasmas are characterized by their temperature, as well as their
electron and ion densities [30, 32].
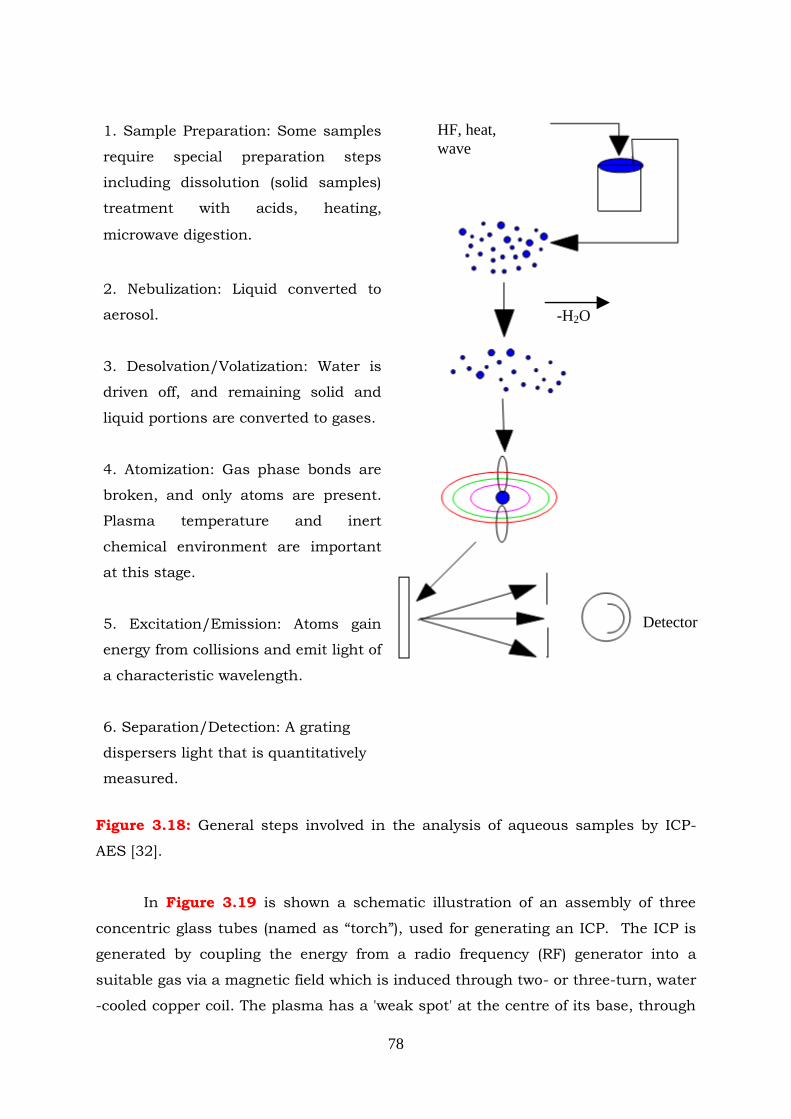
78
Figure 3.18: General steps involved in the analysis of aqueous samples by ICP-
AES [32].
In Figure 3.19 is shown a schematic illustration of an assembly of three
concentric glass tubes (named as “torch”), used for generating an ICP. The ICP is
generated by coupling the energy from a radio frequency (RF) generator into a
suitable gas via a magnetic field which is induced through two- or three-turn, water
-cooled copper coil. The plasma has a 'weak spot' at the centre of its base, through
1. Sample Preparation: Some samples
require special preparation steps
including dissolution (solid samples)
treatment with acids, heating,
microwave digestion.
2. Nebulization: Liquid converted to
aerosol.
3. Desolvation/Volatization: Water is
driven off, and remaining solid and
liquid portions are converted to gases.
4. Atomization: Gas phase bonds are
broken, and only atoms are present.
Plasma temperature and inert
chemical environment are important
at this stage.
5. Excitation/Emission: Atoms gain
energy from collisions and emit light of
a characteristic wavelength.
6. Separation/Detection: A grating
dispersers light that is quantitatively
measured.
HF, heat,
wave
Detector
-H2O
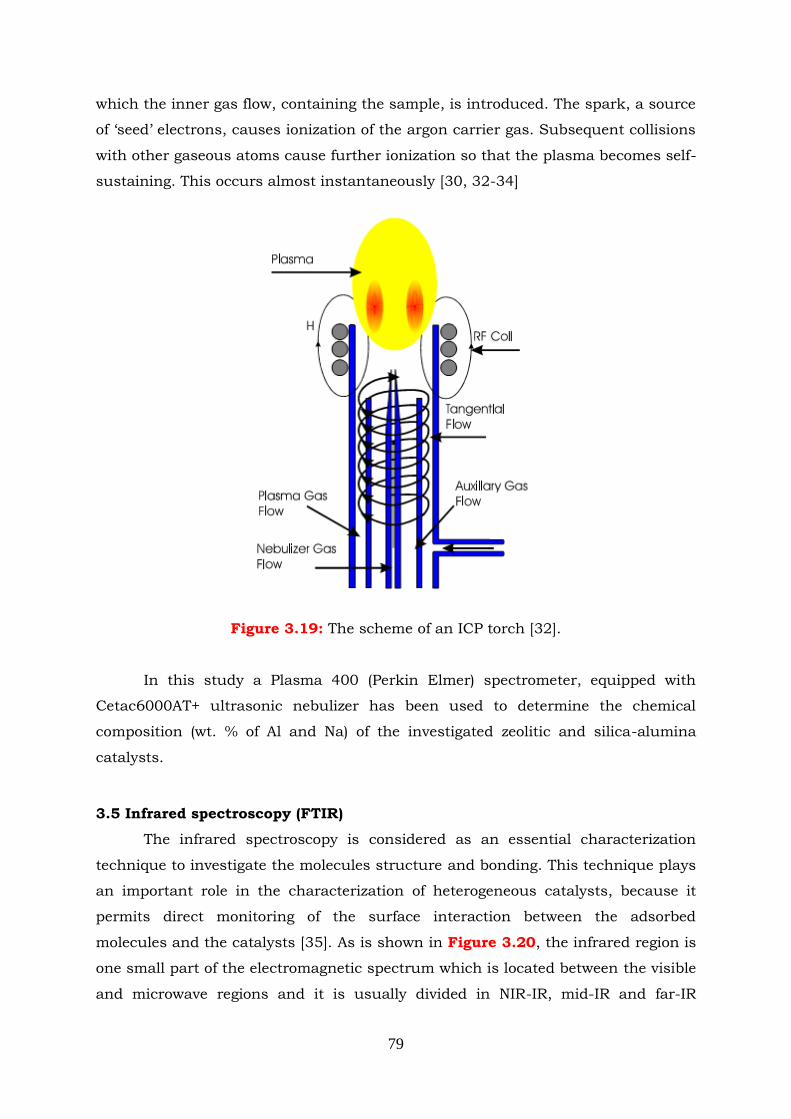
79
which the inner gas flow, containing the sample, is introduced. The spark, a source
of „seed‟ electrons, causes ionization of the argon carrier gas. Subsequent collisions
with other gaseous atoms cause further ionization so that the plasma becomes self-
sustaining. This occurs almost instantaneously [30, 32-34]
Figure 3.19: The scheme of an ICP torch [32].
In this study a Plasma 400 (Perkin Elmer) spectrometer, equipped with
Cetac6000AT+ ultrasonic nebulizer has been used to determine the chemical
composition (wt. % of Al and Na) of the investigated zeolitic and silica-alumina
catalysts.
3.5 Infrared spectroscopy (FTIR)
The infrared spectroscopy is considered as an essential characterization
technique to investigate the molecules structure and bonding. This technique plays
an important role in the characterization of heterogeneous catalysts, because it
permits direct monitoring of the surface interaction between the adsorbed
molecules and the catalysts [35]. As is shown in Figure 3.20, the infrared region is
one small part of the electromagnetic spectrum which is located between the visible
and microwave regions and it is usually divided in NIR-IR, mid-IR and far-IR
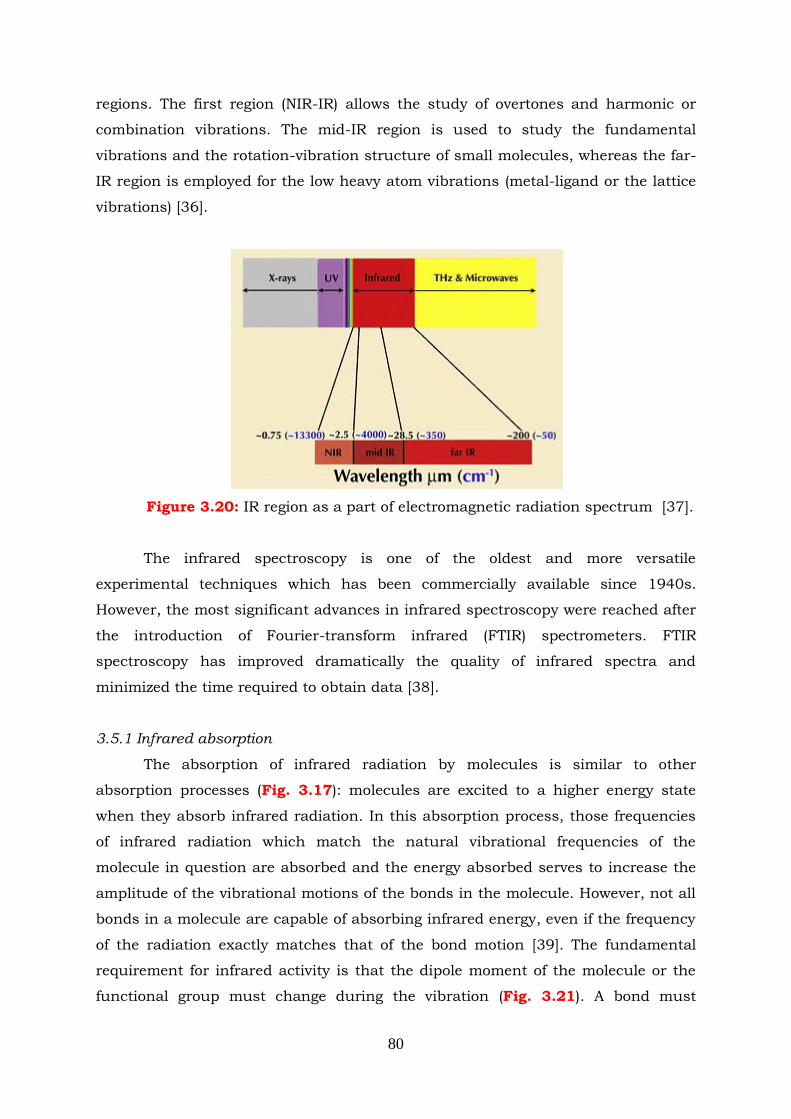
80
regions. The first region (NIR-IR) allows the study of overtones and harmonic or
combination vibrations. The mid-IR region is used to study the fundamental
vibrations and the rotation-vibration structure of small molecules, whereas the far-
IR region is employed for the low heavy atom vibrations (metal-ligand or the lattice
vibrations) [36].
Figure 3.20: IR region as a part of electromagnetic radiation spectrum [37].
The infrared spectroscopy is one of the oldest and more versatile
experimental techniques which has been commercially available since 1940s.
However, the most significant advances in infrared spectroscopy were reached after
the introduction of Fourier-transform infrared (FTIR) spectrometers. FTIR
spectroscopy has improved dramatically the quality of infrared spectra and
minimized the time required to obtain data [38].
3.5.1 Infrared absorption
The absorption of infrared radiation by molecules is similar to other
absorption processes (Fig. 3.17): molecules are excited to a higher energy state
when they absorb infrared radiation. In this absorption process, those frequencies
of infrared radiation which match the natural vibrational frequencies of the
molecule in question are absorbed and the energy absorbed serves to increase the
amplitude of the vibrational motions of the bonds in the molecule. However, not all
bonds in a molecule are capable of absorbing infrared energy, even if the frequency
of the radiation exactly matches that of the bond motion [39]. The fundamental
requirement for infrared activity is that the dipole moment of the molecule or the
functional group must change during the vibration (Fig. 3.21). A bond must
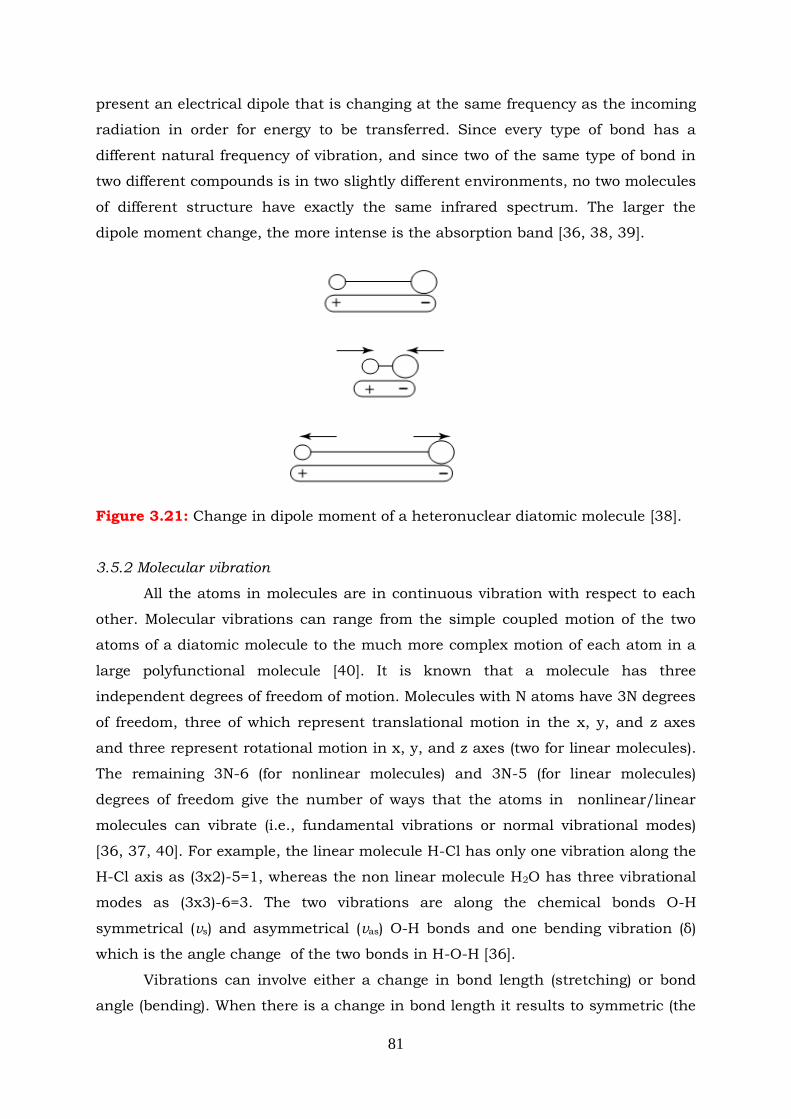
81
present an electrical dipole that is changing at the same frequency as the incoming
radiation in order for energy to be transferred. Since every type of bond has a
different natural frequency of vibration, and since two of the same type of bond in
two different compounds is in two slightly different environments, no two molecules
of different structure have exactly the same infrared spectrum. The larger the
dipole moment change, the more intense is the absorption band [36, 38, 39].
Figure 3.21: Change in dipole moment of a heteronuclear diatomic molecule [38].
3.5.2 Molecular vibration
All the atoms in molecules are in continuous vibration with respect to each
other. Molecular vibrations can range from the simple coupled motion of the two
atoms of a diatomic molecule to the much more complex motion of each atom in a
large polyfunctional molecule [40]. It is known that a molecule has three
independent degrees of freedom of motion. Molecules with N atoms have 3N degrees
of freedom, three of which represent translational motion in the x, y, and z axes
and three represent rotational motion in x, y, and z axes (two for linear molecules).
The remaining 3N-6 (for nonlinear molecules) and 3N-5 (for linear molecules)
degrees of freedom give the number of ways that the atoms in nonlinear/linear
molecules can vibrate (i.e., fundamental vibrations or normal vibrational modes)
[36, 37, 40]. For example, the linear molecule H-Cl has only one vibration along the
H-Cl axis as (3x2)-5=1, whereas the non linear molecule H2O has three vibrational
modes as (3x3)-6=3. The two vibrations are along the chemical bonds O-H
symmetrical (vs) and asymmetrical (vas) O-H bonds and one bending vibration (δ)
which is the angle change of the two bonds in H-O-H [36].
Vibrations can involve either a change in bond length (stretching) or bond
angle (bending). When there is a change in bond length it results to symmetric (the
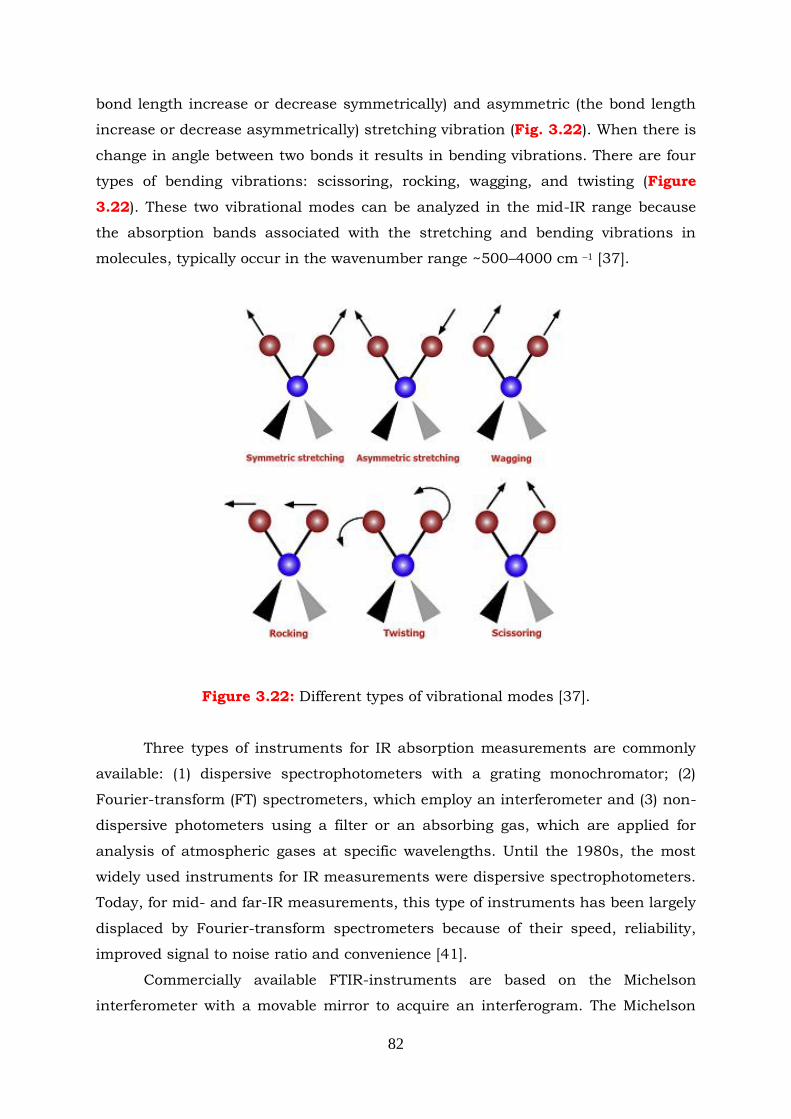
82
bond length increase or decrease symmetrically) and asymmetric (the bond length
increase or decrease asymmetrically) stretching vibration (Fig. 3.22). When there is
change in angle between two bonds it results in bending vibrations. There are four
types of bending vibrations: scissoring, rocking, wagging, and twisting (Figure
3.22). These two vibrational modes can be analyzed in the mid-IR range because
the absorption bands associated with the stretching and bending vibrations in
molecules, typically occur in the wavenumber range ~500–4000 cm –1 [37].
Figure 3.22: Different types of vibrational modes [37].
Three types of instruments for IR absorption measurements are commonly
available: (1) dispersive spectrophotometers with a grating monochromator; (2)
Fourier-transform (FT) spectrometers, which employ an interferometer and (3) non-
dispersive photometers using a filter or an absorbing gas, which are applied for
analysis of atmospheric gases at specific wavelengths. Until the 1980s, the most
widely used instruments for IR measurements were dispersive spectrophotometers.
Today, for mid- and far-IR measurements, this type of instruments has been largely
displaced by Fourier-transform spectrometers because of their speed, reliability,
improved signal to noise ratio and convenience [41].
Commercially available FTIR-instruments are based on the Michelson
interferometer with a movable mirror to acquire an interferogram. The Michelson
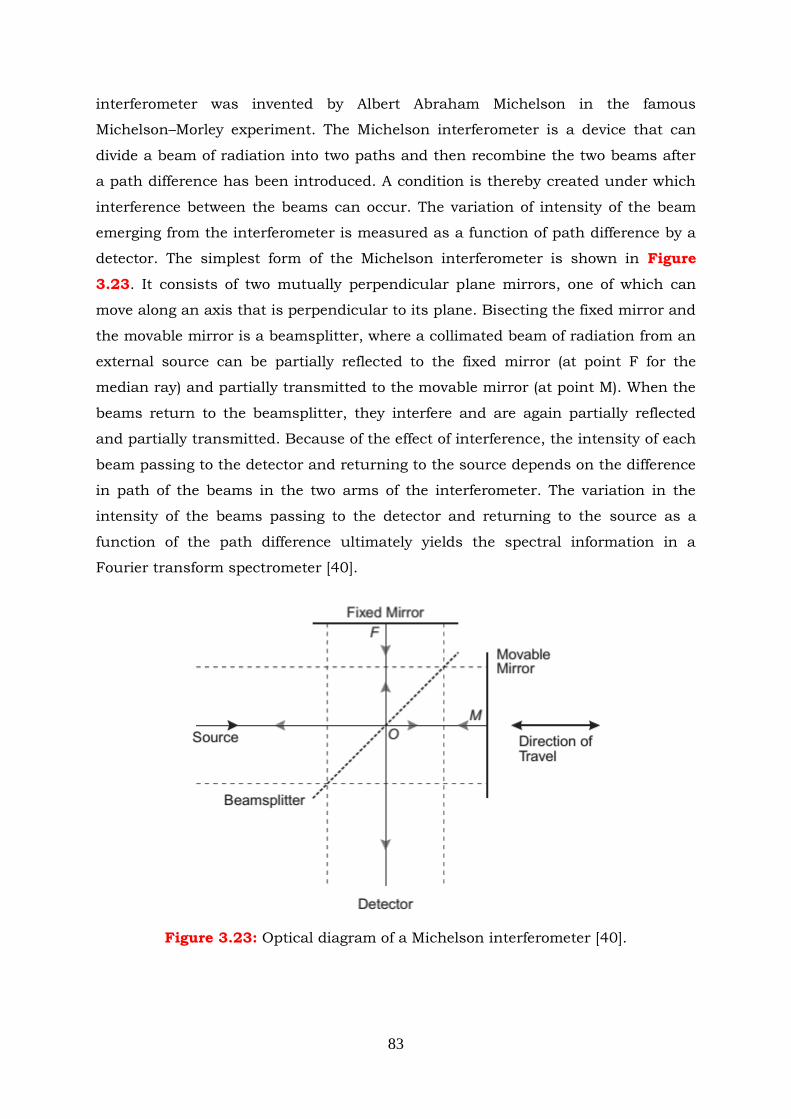
83
interferometer was invented by Albert Abraham Michelson in the famous
Michelson–Morley experiment. The Michelson interferometer is a device that can
divide a beam of radiation into two paths and then recombine the two beams after
a path difference has been introduced. A condition is thereby created under which
interference between the beams can occur. The variation of intensity of the beam
emerging from the interferometer is measured as a function of path difference by a
detector. The simplest form of the Michelson interferometer is shown in Figure
3.23. It consists of two mutually perpendicular plane mirrors, one of which can
move along an axis that is perpendicular to its plane. Bisecting the fixed mirror and
the movable mirror is a beamsplitter, where a collimated beam of radiation from an
external source can be partially reflected to the fixed mirror (at point F for the
median ray) and partially transmitted to the movable mirror (at point M). When the
beams return to the beamsplitter, they interfere and are again partially reflected
and partially transmitted. Because of the effect of interference, the intensity of each
beam passing to the detector and returning to the source depends on the difference
in path of the beams in the two arms of the interferometer. The variation in the
intensity of the beams passing to the detector and returning to the source as a
function of the path difference ultimately yields the spectral information in a
Fourier transform spectrometer [40].
Figure 3.23: Optical diagram of a Michelson interferometer [40].
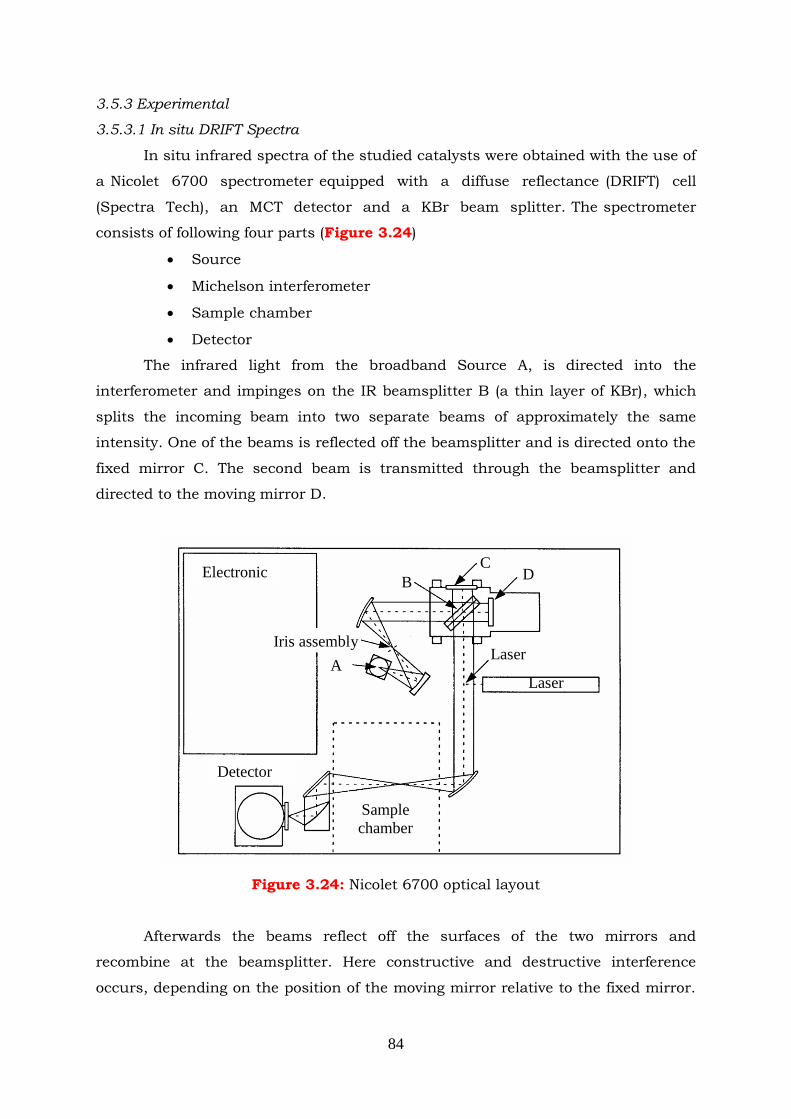
84
3.5.3 Experimental
3.5.3.1 In situ DRIFT Spectra
In situ infrared spectra of the studied catalysts were obtained with the use of
a Nicolet 6700 spectrometer equipped with a diffuse reflectance (DRIFT) cell
(Spectra Tech), an MCT detector and a KBr beam splitter. The spectrometer
consists of following four parts (Figure 3.24)
Source
Michelson interferometer
Sample chamber
Detector
The infrared light from the broadband Source A, is directed into the
interferometer and impinges on the IR beamsplitter B (a thin layer of KBr), which
splits the incoming beam into two separate beams of approximately the same
intensity. One of the beams is reflected off the beamsplitter and is directed onto the
fixed mirror C. The second beam is transmitted through the beamsplitter and
directed to the moving mirror D.
Figure 3.24: Nicolet 6700 optical layout
Afterwards the beams reflect off the surfaces of the two mirrors and
recombine at the beamsplitter. Here constructive and destructive interference
occurs, depending on the position of the moving mirror relative to the fixed mirror.
Detector
Laser
Electronic
s
Detector
Sample
chamber
Laser
Beamsplitter
Iris assembly
A
B
C D
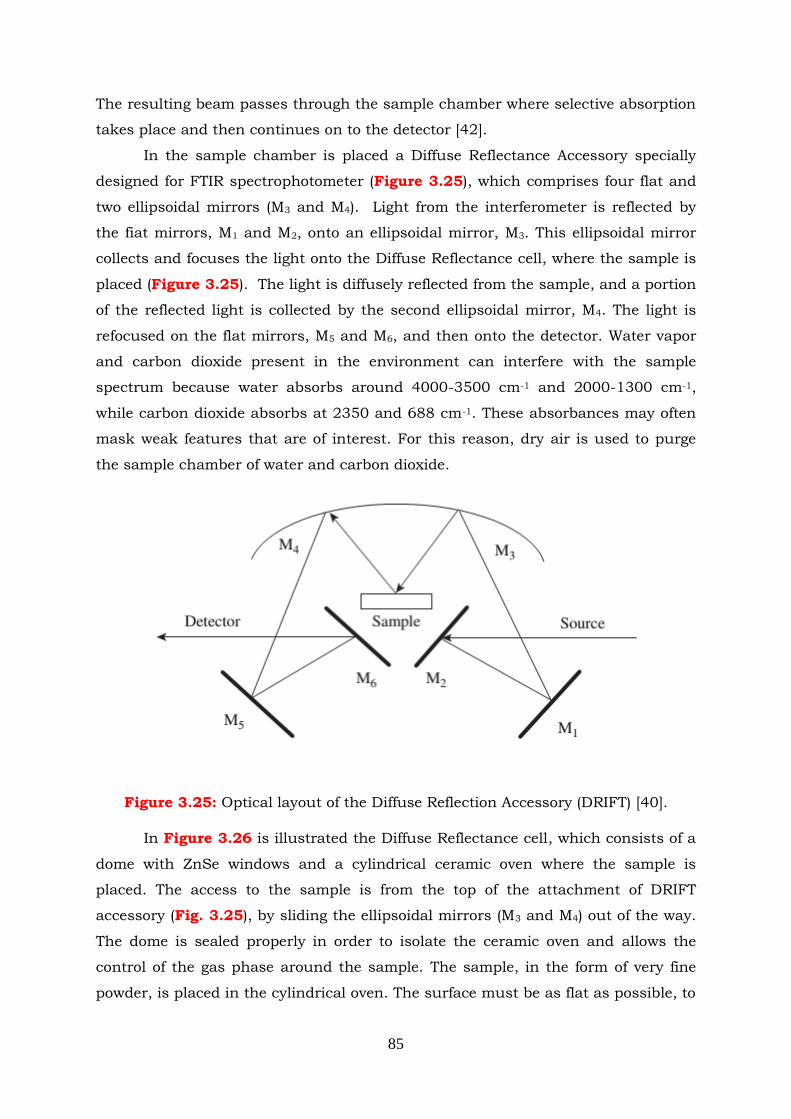
85
The resulting beam passes through the sample chamber where selective absorption
takes place and then continues on to the detector [42].
In the sample chamber is placed a Diffuse Reflectance Accessory specially
designed for FTIR spectrophotometer (Figure 3.25), which comprises four flat and
two ellipsoidal mirrors (M3 and M4). Light from the interferometer is reflected by
the fiat mirrors, M1 and M2, onto an ellipsoidal mirror, M3. This ellipsoidal mirror
collects and focuses the light onto the Diffuse Reflectance cell, where the sample is
placed (Figure 3.25). The light is diffusely reflected from the sample, and a portion
of the reflected light is collected by the second ellipsoidal mirror, M4. The light is
refocused on the flat mirrors, M5 and M6, and then onto the detector. Water vapor
and carbon dioxide present in the environment can interfere with the sample
spectrum because water absorbs around 4000-3500 cm-1 and 2000-1300 cm-1,
while carbon dioxide absorbs at 2350 and 688 cm-1. These absorbances may often
mask weak features that are of interest. For this reason, dry air is used to purge
the sample chamber of water and carbon dioxide.
Figure 3.25: Optical layout of the Diffuse Reflection Accessory (DRIFT) [40].
In Figure 3.26 is illustrated the Diffuse Reflectance cell, which consists of a
dome with ZnSe windows and a cylindrical ceramic oven where the sample is
placed. The access to the sample is from the top of the attachment of DRIFT
accessory (Fig. 3.25), by sliding the ellipsoidal mirrors (M3 and M4) out of the way.
The dome is sealed properly in order to isolate the ceramic oven and allows the
control of the gas phase around the sample. The sample, in the form of very fine
powder, is placed in the cylindrical oven. The surface must be as flat as possible, to
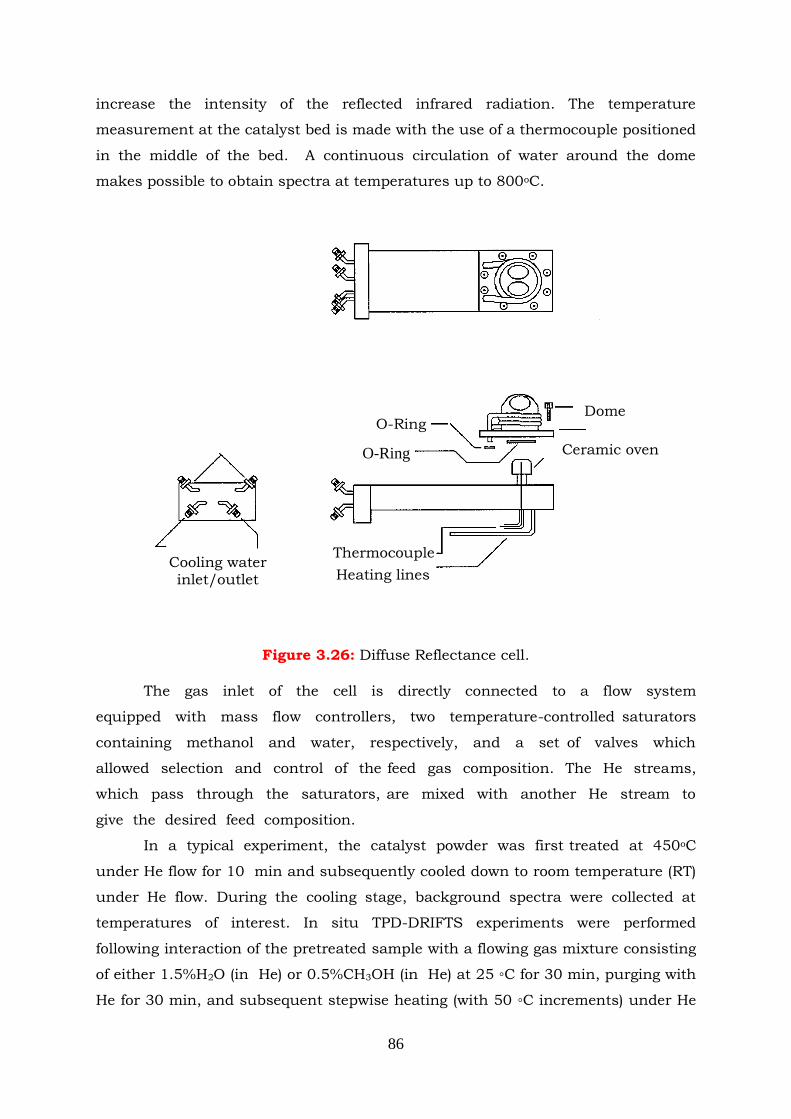
86
increase the intensity of the reflected infrared radiation. The temperature
measurement at the catalyst bed is made with the use of a thermocouple positioned
in the middle of the bed. A continuous circulation of water around the dome
makes possible to obtain spectra at temperatures up to 800oC.
Figure 3.26: Diffuse Reflectance cell.
The gas inlet of the cell is directly connected to a flow system
equipped with mass flow controllers, two temperature-controlled saturators
containing methanol and water, respectively, and a set of valves which
allowed selection and control of the feed gas composition. The He streams,
which pass through the saturators, are mixed with another He stream to
give the desired feed composition.
In a typical experiment, the catalyst powder was first treated at 450oC
under He flow for 10 min and subsequently cooled down to room temperature (RT)
under He flow. During the cooling stage, background spectra were collected at
temperatures of interest. In situ TPD-DRIFTS experiments were performed
following interaction of the pretreated sample with a flowing gas mixture consisting
of either 1.5%H2O (in He) or 0.5%CH3OH (in He) at 25 ◦C for 30 min, purging with
He for 30 min, and subsequent stepwise heating (with 50 ◦C increments) under He
Cooling water inlet/outlet
Dome
Ceramic oven
O-Ring
O-Ring
Thermocouple
Heating lines
87
flow up to 450 ◦C. The same procedure was followed to investigate the reactivity of
methanol in the presence and in the absence of water in the feed (TPSR-DRIFTS
experiments), with the exception that interaction of the catalyst with 0.5%CH3OH
(in He) or 1.5% H2O + 0.5% CH3OH (in He) at 25◦C for 30 min was followed by
heating under a flow of the same reaction mixture. Spectra were recorded after
reaching the desired temperature at a resolution of 4cm−1 . In all experiments, the
total flow rate through the DRIFT cell was 30 cm-3min-1.
3.5.3.2 FT-IR spectroscopy combined with in-situ pyridine adsorption
A range of experiments have been conducted in order to determine the
amount and strength of Brönsted and Lewis acid sites of catalysts (alumina, silica-
alumina and zeolites). These experiments were performed by means of Fourier
transform–infrared (FT-IR) spectroscopy combined with in situ adsorption of
pyridine. The FT-IR spectra were recorded on a Nicolet 5700 FTIR spectrometer
(resolution 4 cm-1) using the OMNIC software and a specially designed heated,
high-vacuum IR cell with CaF2 windows. Data processing was carried out by the
GRAMS software. All samples were finely ground in a mortar and pressed in self-
supported wafers (15 mg cm-2). The wafers were outgassed in situ at 450 oC for 1 h
under high vacuum (10-6 mbar) and a background spectrum was recorded at 150
oC. Adsorption/equilibration with pyridine vapours was then conducted at 150 oC,
by adding pulses of pyridine for 1 h at a total cell pressure of 1 mbar. Spectra were
recorded at 150 oC, after equilibration with pyridine at that temperature and after
outgassing for 30 min at higher temperatures, i.e. 250, 350 and 450 oC, in order to
evaluate the strength of the acid sites. The bands at 1545 cm-1 (pyridinium ions)
and 1450 cm-1 (coordinated pyridine) were used to identify and quantify the
Brönsted and Lewis acid sites, respectively, by adopting the molar extinction
coefficients provided by [43].
3.6 Temperature-programmed experiments (TPD and TPR) coupled with mass
spectrometry
Temperature-programmed desorption (TPD) of probe molecules is a widely
used method for analyzing the adsorption/desorption properties of solid catalysts.
TPD gives information about the energy required for each respective molecule to
desorb and for the relative coverage of the desorbing species.
The main idea of this technique is that the probe molecules interact with
the catalyst surface and adsorb onto it to a fixed coverage θ at a temperature T0 for
88
which desorption is impossible. Subsequently, the surface temperature is ramped
up linearly with time t according to
tβToT 3.12
where
β: is the heating rate
As the temperature increases, energy is provided to the adsorbed species
which results to their desorption. The desorption rate goes through a maximum at
a peak temperature of Tp. The desorption rate in general exhibits an Arrhenius type
behavior and is expressed by the Polanyi-Wigner equation [44, 45].
RT
ENν
βdt
dN desnn exp
1 3.13
where
N: is the concentration of the adsorbed gas
n: is the order of desorption
Εdes: is the activation energy
R: is the universal constant
Compared to other analytical techniques, TPD is an inexpensive and simple
experimental method to set up and run, and may provide information closely
related to the catalytic properties and the reactions in question. With the proper
choice of probe molecule, it is frequently possible to relate TPD curves to the
catalytic activity and selectivity of a particular catalyst and to determine the
probable state of the catalyst under working conditions [46].
3.6.1 Experimental
Temperature-programmed experiments were conducted by using an
experimental system depicted in Figure 3.27, which consists of a gas flow system,
a reactor and an analysis system. The gas flow system consists of a pressure
regulator, mass flow meters and valves which regulate, measure and control the
inlet gases. The reactor consists of a quartz tube of length 30 cm and outer
diameter of 6 mm. In the central part of the tube with a diameter of 8 mm, is
placed the catalytic bed. The reactor is placed in the oven the temperature of which
is controlled using a K-type thermocouple located between the reactor and the oven
walls. The temperature of the sample is measured in the middle of the catalyst bed
through a second K-type thermocouple which is placed in a quartz tube of 3 mm
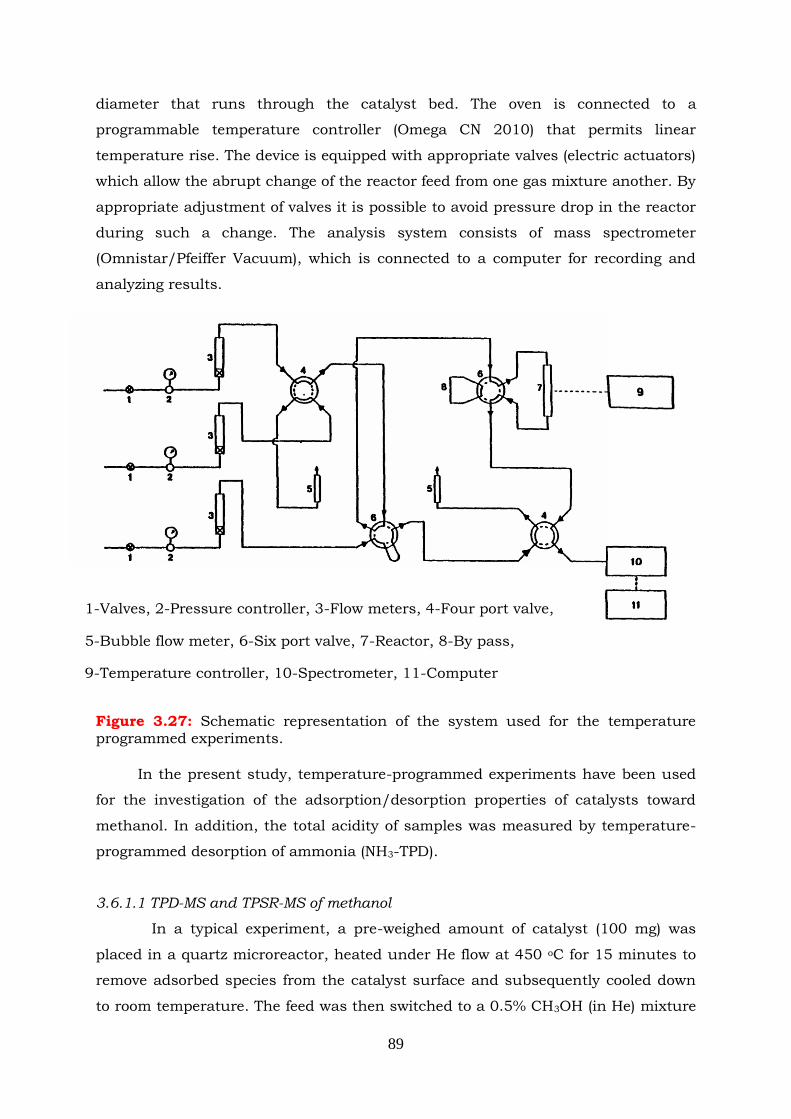
89
diameter that runs through the catalyst bed. The oven is connected to a
programmable temperature controller (Omega CN 2010) that permits linear
temperature rise. The device is equipped with appropriate valves (electric actuators)
which allow the abrupt change of the reactor feed from one gas mixture another. By
appropriate adjustment of valves it is possible to avoid pressure drop in the reactor
during such a change. The analysis system consists of mass spectrometer
(Omnistar/Pfeiffer Vacuum), which is connected to a computer for recording and
analyzing results.
Figure 3.27: Schematic representation of the system used for the temperature programmed experiments.
In the present study, temperature-programmed experiments have been used
for the investigation of the adsorption/desorption properties of catalysts toward
methanol. In addition, the total acidity of samples was measured by temperature-
programmed desorption of ammonia (NH3-TPD).
3.6.1.1 TPD-MS and TPSR-MS of methanol
In a typical experiment, a pre-weighed amount of catalyst (100 mg) was
placed in a quartz microreactor, heated under He flow at 450 oC for 15 minutes to
remove adsorbed species from the catalyst surface and subsequently cooled down
to room temperature. The feed was then switched to a 0.5% CH3OH (in He) mixture
1-Valves, 2-Pressure controller, 3-Flow meters, 4-Four port valve,
5-Bubble flow meter, 6-Six port valve, 7-Reactor, 8-By pass,
9-Temperature controller, 10-Spectrometer, 11-Computer
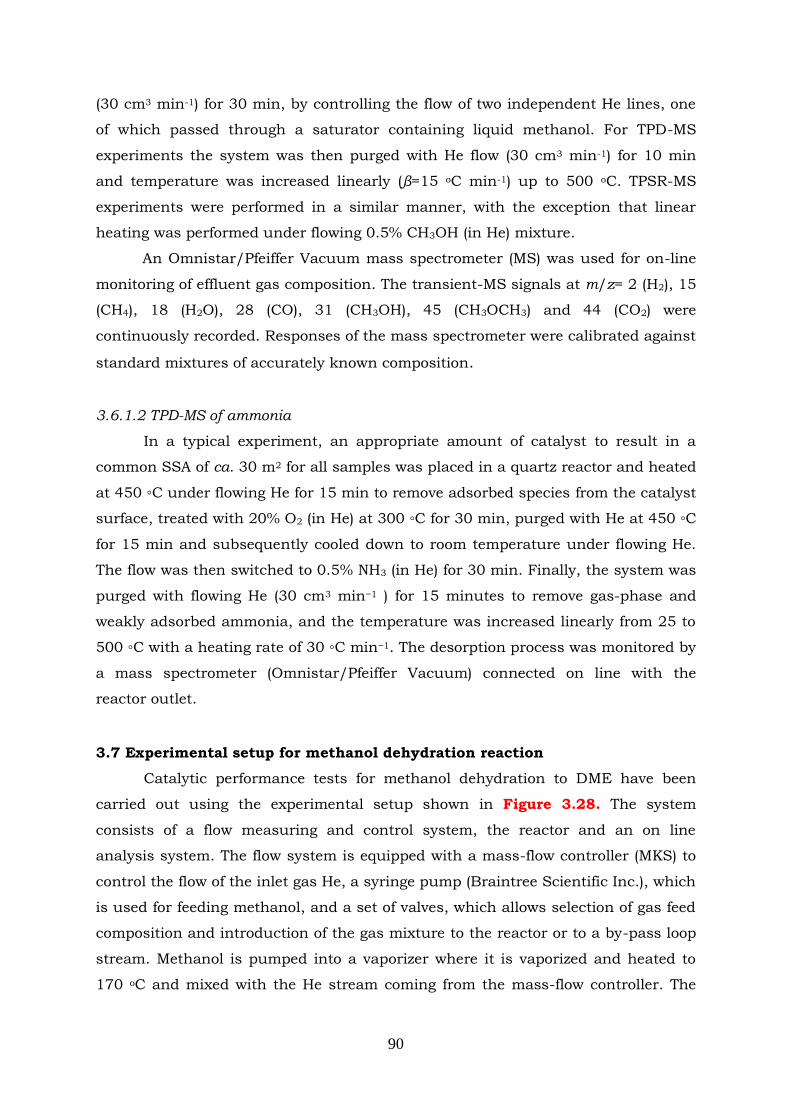
90
(30 cm3 min-1) for 30 min, by controlling the flow of two independent He lines, one
of which passed through a saturator containing liquid methanol. For TPD-MS
experiments the system was then purged with He flow (30 cm3 min-1) for 10 min
and temperature was increased linearly (β=15 oC min-1) up to 500 oC. TPSR-MS
experiments were performed in a similar manner, with the exception that linear
heating was performed under flowing 0.5% CH3OH (in He) mixture.
An Omnistar/Pfeiffer Vacuum mass spectrometer (MS) was used for on-line
monitoring of effluent gas composition. The transient-MS signals at m/z= 2 (H2), 15
(CH4), 18 (H2O), 28 (CO), 31 (CH3OH), 45 (CH3OCH3) and 44 (CO2) were
continuously recorded. Responses of the mass spectrometer were calibrated against
standard mixtures of accurately known composition.
3.6.1.2 TPD-MS of ammonia
In a typical experiment, an appropriate amount of catalyst to result in a
common SSA of ca. 30 m2 for all samples was placed in a quartz reactor and heated
at 450 ◦C under flowing He for 15 min to remove adsorbed species from the catalyst
surface, treated with 20% O2 (in He) at 300 ◦C for 30 min, purged with He at 450 ◦C
for 15 min and subsequently cooled down to room temperature under flowing He.
The flow was then switched to 0.5% NH3 (in He) for 30 min. Finally, the system was
purged with flowing He (30 cm3 min−1 ) for 15 minutes to remove gas-phase and
weakly adsorbed ammonia, and the temperature was increased linearly from 25 to
500 ◦C with a heating rate of 30 ◦C min−1. The desorption process was monitored by
a mass spectrometer (Omnistar/Pfeiffer Vacuum) connected on line with the
reactor outlet.
3.7 Experimental setup for methanol dehydration reaction
Catalytic performance tests for methanol dehydration to DME have been
carried out using the experimental setup shown in Figure 3.28. The system
consists of a flow measuring and control system, the reactor and an on line
analysis system. The flow system is equipped with a mass-flow controller (MKS) to
control the flow of the inlet gas He, a syringe pump (Braintree Scientific Inc.), which
is used for feeding methanol, and a set of valves, which allows selection of gas feed
composition and introduction of the gas mixture to the reactor or to a by-pass loop
stream. Methanol is pumped into a vaporizer where it is vaporized and heated to
170 oC and mixed with the He stream coming from the mass-flow controller. The
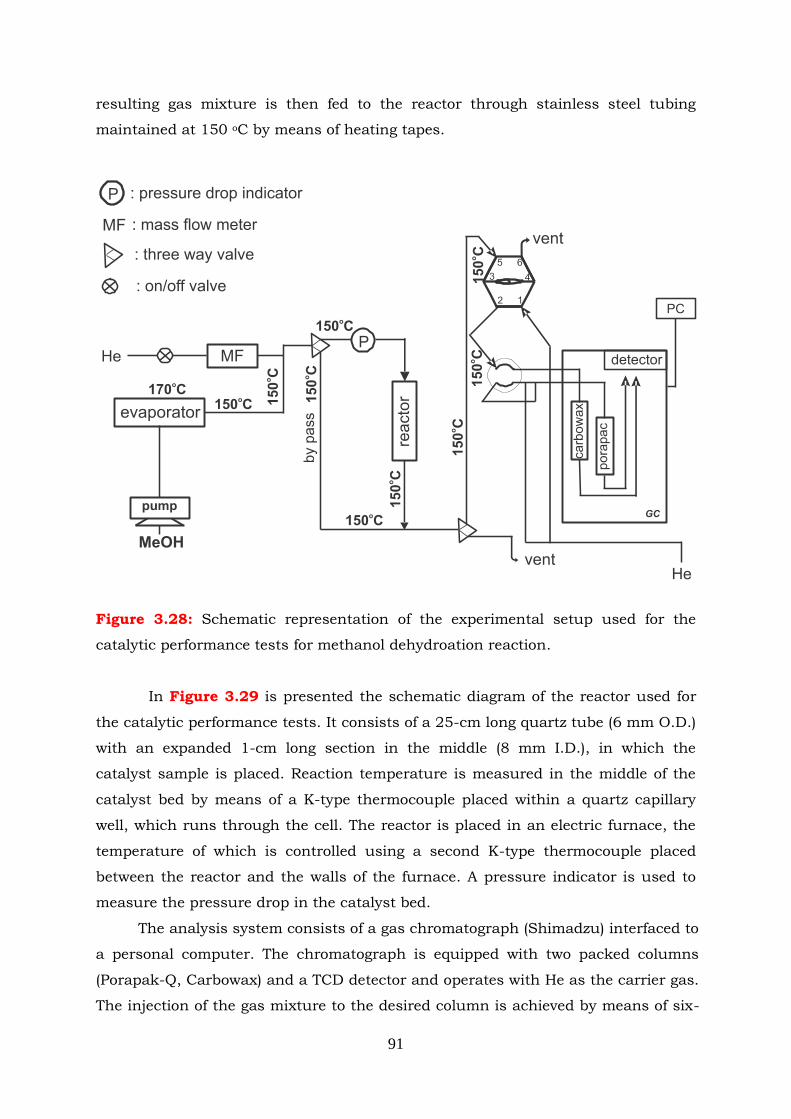
91
resulting gas mixture is then fed to the reactor through stainless steel tubing
maintained at 150 oC by means of heating tapes.
Figure 3.28: Schematic representation of the experimental setup used for the
catalytic performance tests for methanol dehydroation reaction.
In Figure 3.29 is presented the schematic diagram of the reactor used for
the catalytic performance tests. It consists of a 25-cm long quartz tube (6 mm O.D.)
with an expanded 1-cm long section in the middle (8 mm I.D.), in which the
catalyst sample is placed. Reaction temperature is measured in the middle of the
catalyst bed by means of a K-type thermocouple placed within a quartz capillary
well, which runs through the cell. The reactor is placed in an electric furnace, the
temperature of which is controlled using a second K-type thermocouple placed
between the reactor and the walls of the furnace. A pressure indicator is used to
measure the pressure drop in the catalyst bed.
The analysis system consists of a gas chromatograph (Shimadzu) interfaced to
a personal computer. The chromatograph is equipped with two packed columns
(Porapak-Q, Carbowax) and a TCD detector and operates with He as the carrier gas.
The injection of the gas mixture to the desired column is achieved by means of six-
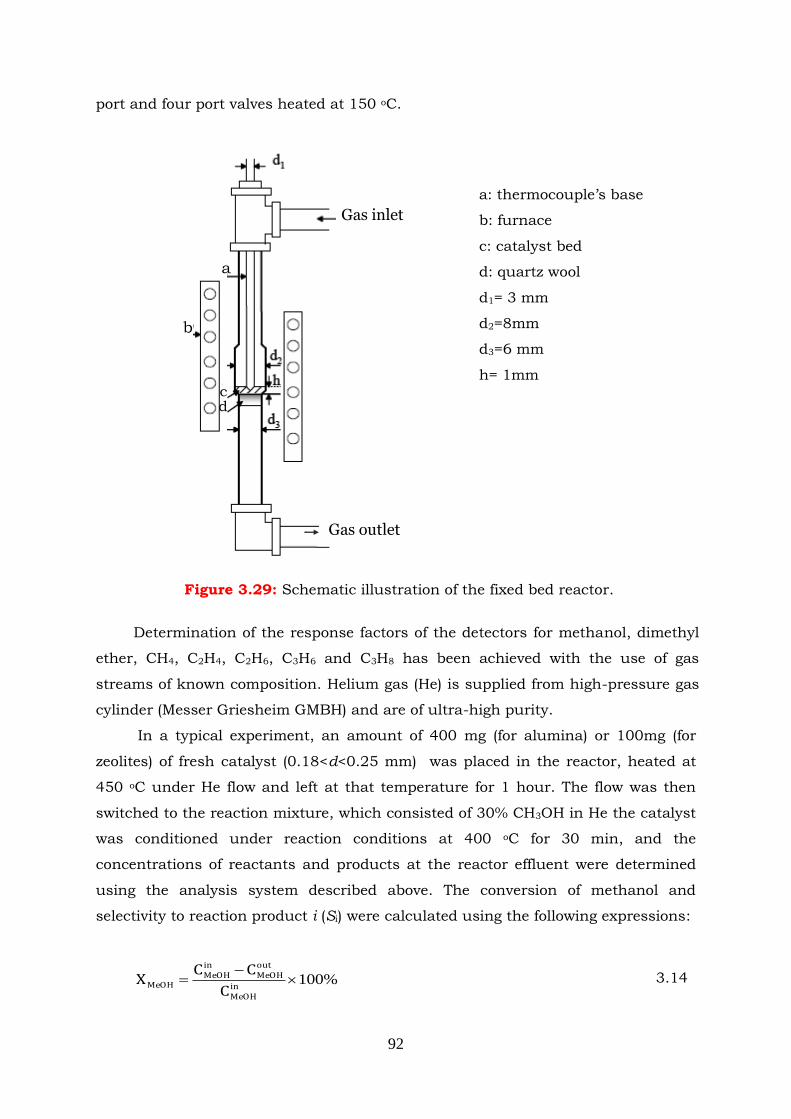
92
port and four port valves heated at 150 oC.
Figure 3.29: Schematic illustration of the fixed bed reactor.
Determination of the response factors of the detectors for methanol, dimethyl
ether, CH4, C2H4, C2H6, C3H6 and C3H8 has been achieved with the use of gas
streams of known composition. Helium gas (He) is supplied from high-pressure gas
cylinder (Messer Griesheim GMBH) and are of ultra-high purity.
In a typical experiment, an amount of 400 mg (for alumina) or 100mg (for
zeolites) of fresh catalyst (0.18<d<0.25 mm) was placed in the reactor, heated at
450 oC under He flow and left at that temperature for 1 hour. The flow was then
switched to the reaction mixture, which consisted of 30% CH3OH in He the catalyst
was conditioned under reaction conditions at 400 oC for 30 min, and the
concentrations of reactants and products at the reactor effluent were determined
using the analysis system described above. The conversion of methanol and
selectivity to reaction product i (Si) were calculated using the following expressions:
%100
inMeOH
outMeOH
inMeOH
MeOHC
CCX
3.14
a: thermocouple‟s base
b: furnace
c: catalyst bed
d: quartz wool
d1= 3 mm
d2=8mm
d3=6 mm
h= 1mm
Gas inlet
Gas outlet
a
b
c d
93
%100)(
)(
outMeOH
inMeOH
ii
CC
iproductofmolνS
3.15
where
iν : is the number of carbon atoms in molecule i (e.g., 1 for CH4, 2 for DME
and 3 for C3H6)
inMeOHC : is the inlet concentration of methanol
outMeOHC : is the outlet concentration of methanol
Under certain experimental conditions (e.g., reaction over ZSM-5 catalysts at
temperatures higher than ca. 300 oC) several reaction products with more than
three carbon atoms were formed, which were not quantified separately. Selectivity
toward these higher hydrocarbons (HC) has been estimated indirectly using the
following expression:
i
iHC SS 100(%))( 3.16
where
i -denotes DME, CH4, C2H4, C2H6, C3H6 and C3H8.
Similar measurements are obtained following a stepwise lowering of
temperature, until conversion of CH3OH drops close to zero. A few more
measurements are then obtained by stepwise increasing temperature to check for
possible catalyst deactivation. In all cases, data points are averages of at least three
measurements. All experiments were performed at near atmospheric pressure.
Kinetic measurements were performed in separate experiments where the
conversion of methanol was kept below 15% so that differential reaction conditions
could be assumed, with negligible heat and mass transfer effects. Reaction rates
were calculated using the following expression:
W
FCCr
outMeOH
inMeOH
MeOH
)(
3.17
where
MeOHr : is the conversion rate of methanol (mol s-1 gcat-1),
F: is the total flow rate (mol s-1)
W: is the mass of catalyst (g)
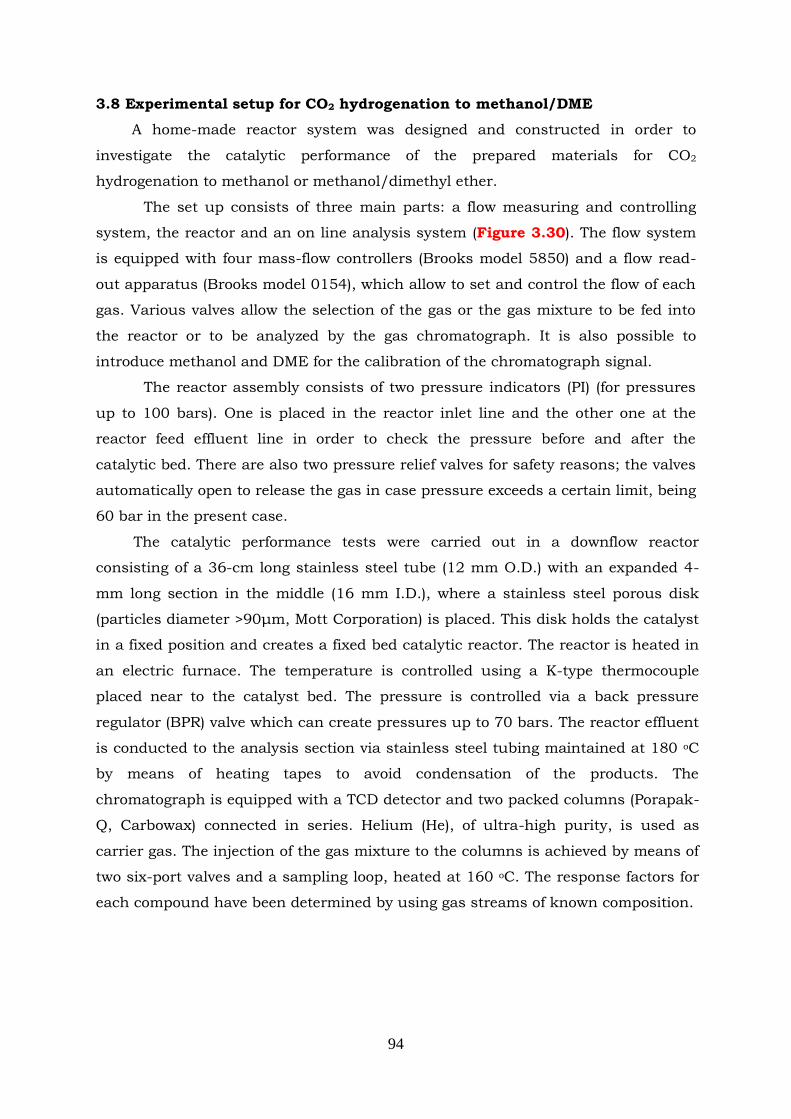
94
3.8 Experimental setup for CO2 hydrogenation to methanol/DME
A home-made reactor system was designed and constructed in order to
investigate the catalytic performance of the prepared materials for CO2
hydrogenation to methanol or methanol/dimethyl ether.
The set up consists of three main parts: a flow measuring and controlling
system, the reactor and an on line analysis system (Figure 3.30). The flow system
is equipped with four mass-flow controllers (Brooks model 5850) and a flow read-
out apparatus (Brooks model 0154), which allow to set and control the flow of each
gas. Various valves allow the selection of the gas or the gas mixture to be fed into
the reactor or to be analyzed by the gas chromatograph. It is also possible to
introduce methanol and DME for the calibration of the chromatograph signal.
The reactor assembly consists of two pressure indicators (PI) (for pressures
up to 100 bars). One is placed in the reactor inlet line and the other one at the
reactor feed effluent line in order to check the pressure before and after the
catalytic bed. There are also two pressure relief valves for safety reasons; the valves
automatically open to release the gas in case pressure exceeds a certain limit, being
60 bar in the present case.
The catalytic performance tests were carried out in a downflow reactor
consisting of a 36-cm long stainless steel tube (12 mm O.D.) with an expanded 4-
mm long section in the middle (16 mm I.D.), where a stainless steel porous disk
(particles diameter >90μm, Mott Corporation) is placed. This disk holds the catalyst
in a fixed position and creates a fixed bed catalytic reactor. The reactor is heated in
an electric furnace. The temperature is controlled using a K-type thermocouple
placed near to the catalyst bed. The pressure is controlled via a back pressure
regulator (BPR) valve which can create pressures up to 70 bars. The reactor effluent
is conducted to the analysis section via stainless steel tubing maintained at 180 oC
by means of heating tapes to avoid condensation of the products. The
chromatograph is equipped with a TCD detector and two packed columns (Porapak-
Q, Carbowax) connected in series. Helium (He), of ultra-high purity, is used as
carrier gas. The injection of the gas mixture to the columns is achieved by means of
two six-port valves and a sampling loop, heated at 160 oC. The response factors for
each compound have been determined by using gas streams of known composition.
95
: on-off
: one way valve
PI : pressure indicator
MFC : mass flow controller
Figure 3.30: Schematic representation of the experimental setup used for catalytic
performance tests for CO2 hydrogenation to methanol/dimethyl ether reaction.
In a typical experiment, 0.5 g of fresh catalyst for methanol synthesis reaction
or 1g for methanol/DME direct synthesis reaction (0.125<d<0.18 mm) was placed
in the reactor. Prior to the activity test, the catalyst was reduced in situ with pure
H2, (100ml/min) under atmospheric pressure at 300 °C (temperature increase rate
2 °C/min) for 1 hour. After reduction, the reactor was cooled down to 100 °C. At
this temperature the gas mixture was introduced and the pressure was increased.
The activity measurements were performed at 3.0 MPa, at temperatures 180-250 oC
where the CH3OH, CO, dimethyl ether and water were the only products formed.
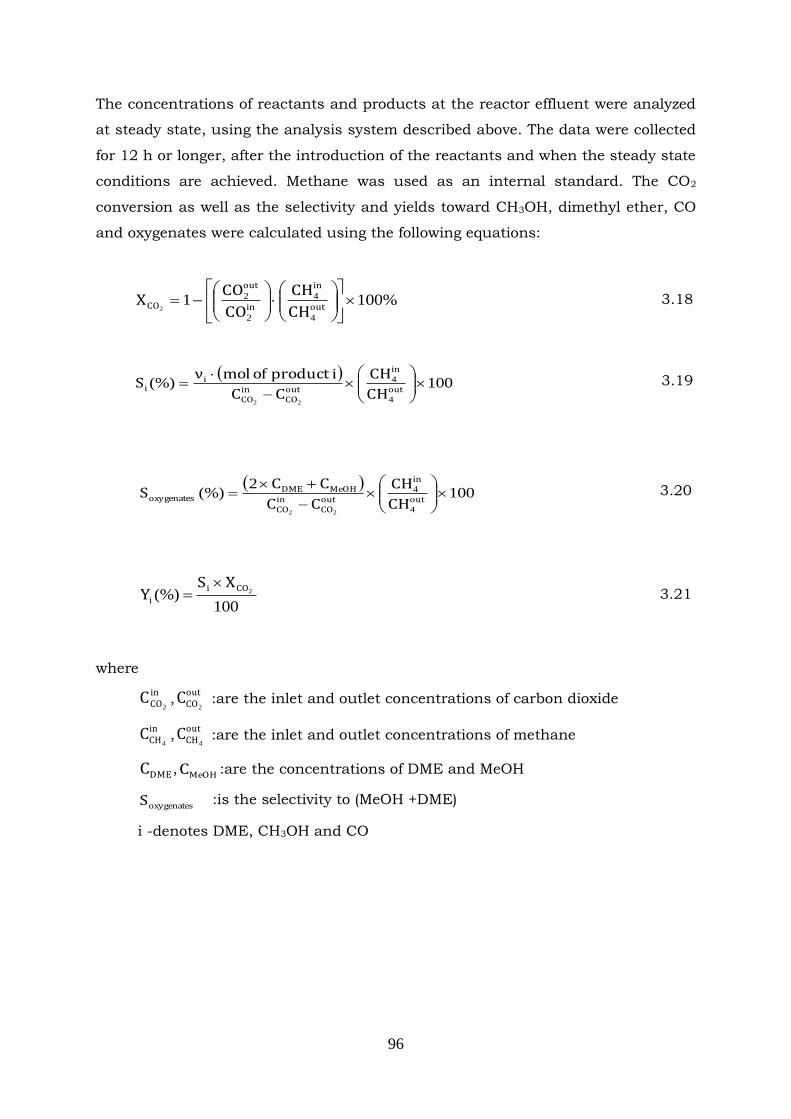
96
The concentrations of reactants and products at the reactor effluent were analyzed
at steady state, using the analysis system described above. The data were collected
for 12 h or longer, after the introduction of the reactants and when the steady state
conditions are achieved. Methane was used as an internal standard. The CO2
conversion as well as the selectivity and yields toward CH3OH, dimethyl ether, CO
and oxygenates were calculated using the following equations:
%10014
4
2
2
2
out
in
in
out
COCH
CH
CO
COX
3.18
100(%)
4
4
22
out
in
outCO
inCO
ii
CH
CH
CC
iproductofmolνS 3.19
100
2(%)
4
4
22
out
in
outCO
inCO
MeOHDMEoxygenates
CH
CH
CC
CCS
3.20
100(%) 2COi
i
XSY
3.21
where
inCOC
2,
outCOC
2
:are the inlet and outlet concentrations of carbon dioxide
inCHC
4,
outCHC
4 :are the inlet and outlet concentrations of methane
DMEC , MeOHC :are the concentrations of DME and MeOH
oxygenatesS
:is the selectivity to (MeOH +DME)
i -denotes DME, CH3OH and CO
97
3.9 References
[1] S.T. Ho, D.W. Hutmacher, Biomaterials 27 (2006) 1362-1376.
[2] S. Lowell, J.E. Shields, "Powder Surface Area and Porosity" (Sec. Ed.), Chapman and
Hall Ltd, 1984.
[3] M. Thommes, Chemie Ingenieur Technik 82 (2010) 1059-1073.
[4] J.B. Condon, "Surface Area and Porosity Determinations by Physisorption:
Measurments and Theory" (1st Ed.), Elsevier, 2006.
[5] S. Brunauer, P.H. Emmett, E. Teller, Journal of the American Chemical Society 60
(1938) 309-319.
[6] S.J. Gregg, K.S.W. Sing, "Adsorption, Surface Area and Porosity" (Sec. Ed.),
Academic Press INC., 1982.
[7] J. Rouquerol, D. Avnir, C.W. Fairbridge, D.H. Everett, J.H. Haynes, N. Pernicone,
J.D.F. Ramsay, K.S.W.Sing, K.K.Unger, Pure & Appl. Chem. 66 (1994) 1739-1758.
[8] P.B. Balbuena, K.E. Gubbins, Langmuir 9 (1993) 1801-1814.
[9] A.R. Studart, J. Studer, L. Xu, K. Yoon, H.C. Shum, D.A. Weitz, Langmuir 27 (2010)
955-964.
[10] G.Q. Lu, X.S. Zhao, "Nanoporous Materials: Science and Engineering", Imperial
College Press, London, 2004.
[11] P.D. Dubrovski, M. Brezočnik, "The Usage of Genetic Methods for Prediction of
Fabric Porosity" Intech 2012.
[12] E. Zhang, B. Wang, International Journal of Mechanical Sciences 47 (2005) 744-756.
[13] J. Haber, Pure & Appl. Chem. 63 (1991) 1227-1246.
[14] J. Tóth (Ed.), "Adsorption, Theory, Modeling and Analysis", Marcel Dekker, Inc.,
2002.
[15] R.T. Yang, "Adsorbents: Fundamentals and Applications", John Wiley & Sons, Inc.,
2003.
[16] Tristar3000, "Operator’s Manual", Micromeritics Instrument Corporation, 2007.
[17] R. Sharma, D.P. Bisen, U. Shukla, B.G. Sharma, Recent Research in Science and
Technology 4 (2012) 77-79.
[18] C. Suryanarayana, "Experimental Techniques in Materials and Mechanics", CRC
Press, Taylor & Francis Group, 2011.
[19] B.D.Cullity, "Elements of X-Ray Diffraction", Addison-Wesley Publishing Company,
Inc., 1956.
[20] R. Abbaschian, L. Abbaschian, R.E. Reed-Hill, "Physical Metallurgy Principles" (4th
Ed.), Cengage Learning, 2009.
[21] C. Suryanarayana, M.G. Norton, "X-Ray Diffraction: A Practical Approach", Plenum
Press New York, 1998.
[22] Y. Waseda, E. Matsubara, K. Shinoda, "X-Ray Diffraction Crystallography:
Introduction, Examples and Solved Problems", Springer-Verlag Berlin, 2011.
[23] J. Ayache, L. Beaunier, J. Boumendil, G. Ehret, D. Laub, "Sample Preparation
Handbook for Transmission Electron Microscopy: Methodology", Springer Science &
Business Media, LLC, 2010.
[24] D.B. Williams, C.B. Carter, "Transmission Electron Microscopy: A Textbook for
Materials Science", Springer Science & Business Media, LLC, 2009.
[25] I.M. Watt, "The Principles and Practice of Electron Microscopy", (Sec. Ed.),
Cambridge University Press, 1997.
[26] S.K. Kulkarni, "Nanotechnology: Principles and Practices", (Third Ed.), Capital
Publishing Company, 2007.
98
[27] G.L. Moore, "Introduction to Inductively Coupled Plasma Atomic Emission
Spectrometry", Elsevier Science Publishers, 1989.
[28] C.B. Boss, K.J. Fredeen, "Concepts, Instrumentation and Techniques in Inductively
Coupled Plasma Optical Emission Spectrometry", (Sec. Ed.), Perkin-Elmer
Corporation, 1997.
[29] P.W.J.M. Boumans, Fresenius Z. Anal. Chem. 299 (1979) 337-361.
[30] L. Ebdon, H. Evans, A.S. Fisher, S.J. Hill, "An Introduction to Analytical Atomic
Spectrometry", John Wiley & Sons Ltd, 1998.
[31] S.J. Hill (Ed.), "Inductively Coupled Plasma Spectrometry and its Applications", (Sec.
Ed.), Blackwell Publishing Ltd, 2007.
[32] T.J. Manning, W.R. Grow, " Inductively Coupled Plasma - Atomic Emission
Spectrometry", The Chemical Educator, Springer-Verlag New York, Inc., 1997, pp. 1-
19.
[33] J.R. Dean, "Practical Inductively Coupled Plasma Spectroscopy", John Wiley & Sons,
Ltd, 2005.
[34] "Guide to Atomic Spectroscopy Techniques and Applications", Perkin Elmer
Instruments, 2000.
[35] J. Ryczkowski, Catalysis Today 68 (2001) 263-381.
[36] T. Theophanides (Ed.), "Infrared Spectroscopy – Materials Science, Engineering and
Technology" InTech, 2012.
[37] A.Marcelli, A.Cricenti, W.M.Kwiatek, C.Petibois, Biotechnology Advances 30
(2012) 1390-1404.
[38] B.Stuart, "Infrared Spectroscopy: Fundamentals and Applications", John Wiley &
Sons, 2004.
[39] D.L. Pavia, G.M. Lampman, G.S.Kriz, "Introduction to Spectroscopy: A Guide for
Students of Organic Chemistry", (Third Ed.), Thomson Learning Inc., 2001.
[40] P.R.Griffiths, J.A.d. Haseth, "Fourier Transform Infrared Spectrometry", (Sec. Ed.),
John Wiley & Sons, Inc., 2007.
[41] D.A.Skoog, F.J. Holler, S.R. Crouch, "Principles of Instrumental Analysis", (6th
Ed.),
Thomson Brooks/Cole, 1998.
[42] "FT-IR Theory", Nicolet Instrument Corporation, 1986.
[43] C.A. Emeis, Journal of Catalysis 141 (1993) 347-354.
[44] N. Clark, "Design of a Temperature Programmed Desorption System for the
Measurement of the Desorption Kinetics of Molecules from Surfaces", master thesis,
2009.
[45] A.L. Cabrera, Journal of Chemical Physics 93 (1990) 2854-2858.
[46] R.J. Gorte, Catalysis Today 28 (1996) 405-414.
99
CHAPTER 4
METHANOL DEHYDRATION TO DIMETHYL
ETHER OVER Al2O3 CATALYSTS
In this chapter, dehydration of methanol to dimethyl ether (DME) is investigated
over a set of eight commercial and self-prepared Al2O3 catalysts with different
physicochemical characteristics. The effects of temperature and the presence of water
vapour in the feed on catalytic performance are studied. A detailed characterization of
catalysts has been carried out with respect to their textural properties (B.E.T. and
B.J.H. methods), acidity (TPD of ammonia), crystallinity, phase composition and
morphology (XRD, TEM). Catalytic activity and selectivity have been evaluated in the
temperature range of 150-400 oC, at atmospheric pressure, in the absence and in the
presence of water in the feed. The adsorption/desorption properties of catalysts toward
methanol and water as well as the reaction mechanism have been investigated with
the use of transient-MS and in situ DRIFTS techniques.
4.1 Preparation of Al2O3 catalysts
A variety of commercial and self-prepared Al2O3 catalysts in powder form were
used to study the effects of physicochemical characteristics on catalytic performance
for the title reaction. Commercial catalysts investigated (see Table 4.1 for suppliers
and notations) include an α-Al2O3 sample (denoted as Al1) and five different γ-Al2O3
samples (Al2 to Al6). All materials were used as received, with the exception of Al6
(AKZO), which was first treated with tri-distilled water for 24 hours at 50 °C under
continuous stirring, filtrated and dried at 120 oC overnight. It was then suspended in
a slightly acidic solution at pH 5-6 (adjusted with HNO3, 1M) for 1 hour and then in a
100
basic solution at pH 9 (adjusted with NH3, 1M) for 1 hour. Finally, the sample was
filtrated, dried at 90 ºC overnight and then calcined at 550 ºC for 4h.
Self-prepared Al2O3 samples were synthesized employing two different sol-gel
methods (SG1, SG2). The SG1 catalyst was synthesized following a preparation
procedure similar to that described by Keshavarz et al. [1]. Aluminium isopropoxide
Al(OC3H7)3 (Fluka, purum >97%) and hexadecyl-trimethyl-ammonium bromide
C19H42BrN (Merck, for synthesis), denoted as Al.iso and CTAB respectively, were
dissolved in an appropriate amount of isopropanol. The molar ratio CTAB/(Al.iso) was
0.8. The hydrolysis step was carried out at 70 ºC by a by dropwise addition of a water-
isopropanol solution (H2O/Al.iso molar ratio =90) under vigorous stirring. The mixture
was peptized under stirring by adjustment of the pH to 5.5, using HNO3 10 wt %.
Afterwards it was left to age at ambient temperature for 2 h. The sample was finally
dried at 110 ºC overnight and calcined at 450 ºC (temperature ramp 5 ºC /min from
ambient to 450 ºC) for 5 h and then at 600 ºC (20 ºC /min) for 30 min for the complete
removal of the organic precursor. For the synthesis of the SG2 catalyst, an aqueous
solution of ethanol was first prepared and its pH was adjusted at 2 with the use of
HNO3. The mixture was then added into an ethanol solution of Al(OC3H7)3 (Alfa
Products) under vigorous stirring and a gel was formed. The gel was left at 25 oC
under stirring for 24 hours until nearly all the liquid was evaporated. The solid residue
was dried at 120 oC for 12 hours, calcined in air at 600 oC for 3 h and stored in a
sealed vial. Sample powders were pelletized without binder in a hydraulic press and
then crashed and sieved to the required mesh size (0.18<d<0.25 mm).
Results and discussion
4.2 Physicochemical characterisation of catalysts
The analyses of the textural properties show that the textural characteristics of
the fresh catalysts vary significantly from one sample to another. In Table 4.1 is
shown the specific surface area (SSA) of the fresh and used catalysts and the pore
volume and pore size of the used catalysts. The textural analysis of the used catalysts
showed that exposure to the reaction conditions did not result in appreciable changes
of SSA of commercial catalysts (samples A1 to Al6), but was more important for self-
prepared materials, namely SG1 and SG2 (Table 4.1).
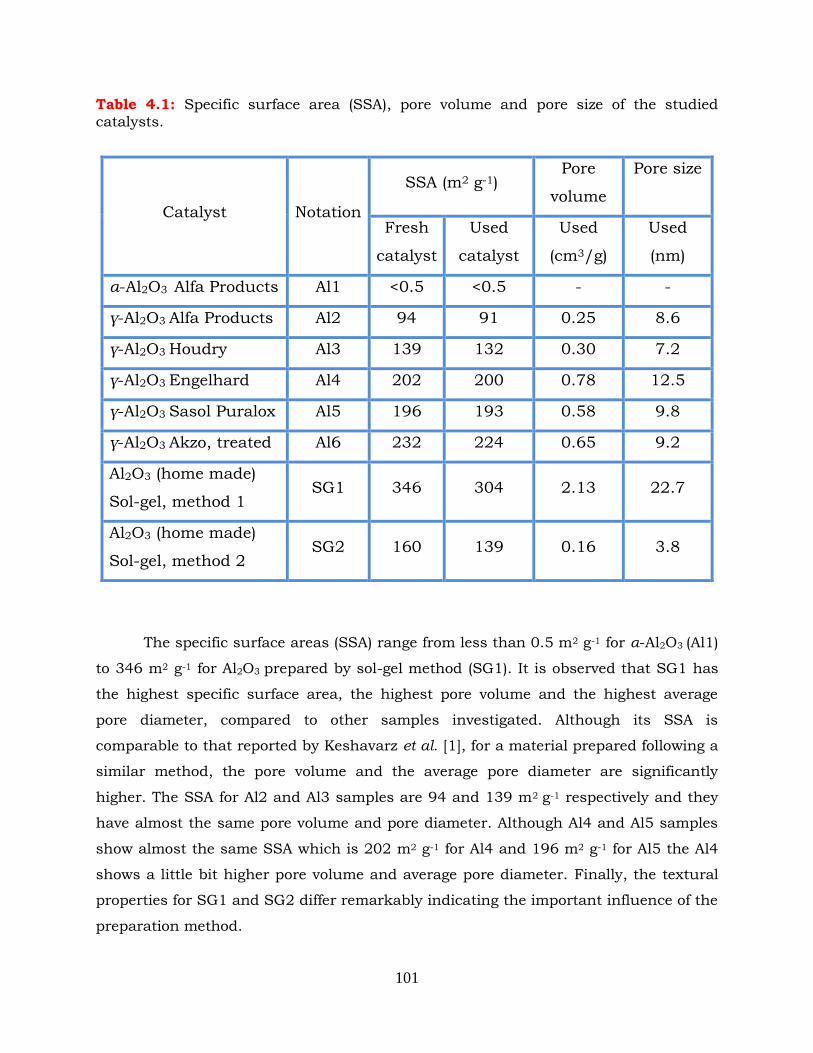
101
Table 4.1: Specific surface area (SSA), pore volume and pore size of the studied catalysts.
Catalyst Notation
SSA (m2 g-1) Pore
volume
Pore size
Fresh
catalyst
Used
catalyst
Used
(cm3/g)
Used
(nm)
α-Al2O3 Alfa Products Al1 <0.5 <0.5 - -
γ-Al2O3 Alfa Products Al2 94 91 0.25 8.6
γ-Al2O3 Houdry Al3 139 132 0.30 7.2
γ-Al2O3 Engelhard Al4 202 200 0.78 12.5
γ-Al2O3 Sasol Puralox Al5 196 193 0.58 9.8
γ-Al2O3 Akzo, treated Al6 232 224 0.65 9.2
Al2O3 (home made)
Sol-gel, method 1 SG1 346 304 2.13 22.7
Al2O3 (home made)
Sol-gel, method 2 SG2 160 139 0.16 3.8
The specific surface areas (SSA) range from less than 0.5 m2 g-1 for α-Al2O3 (Al1)
to 346 m2 g-1 for Al2O3 prepared by sol-gel method (SG1). It is observed that SG1 has
the highest specific surface area, the highest pore volume and the highest average
pore diameter, compared to other samples investigated. Although its SSA is
comparable to that reported by Keshavarz et al. [1], for a material prepared following a
similar method, the pore volume and the average pore diameter are significantly
higher. The SSA for Al2 and Al3 samples are 94 and 139 m2 g-1 respectively and they
have almost the same pore volume and pore diameter. Although Al4 and Al5 samples
show almost the same SSA which is 202 m2 g-1 for Al4 and 196 m2 g-1 for Al5 the Al4
shows a little bit higher pore volume and average pore diameter. Finally, the textural
properties for SG1 and SG2 differ remarkably indicating the important influence of the
preparation method.
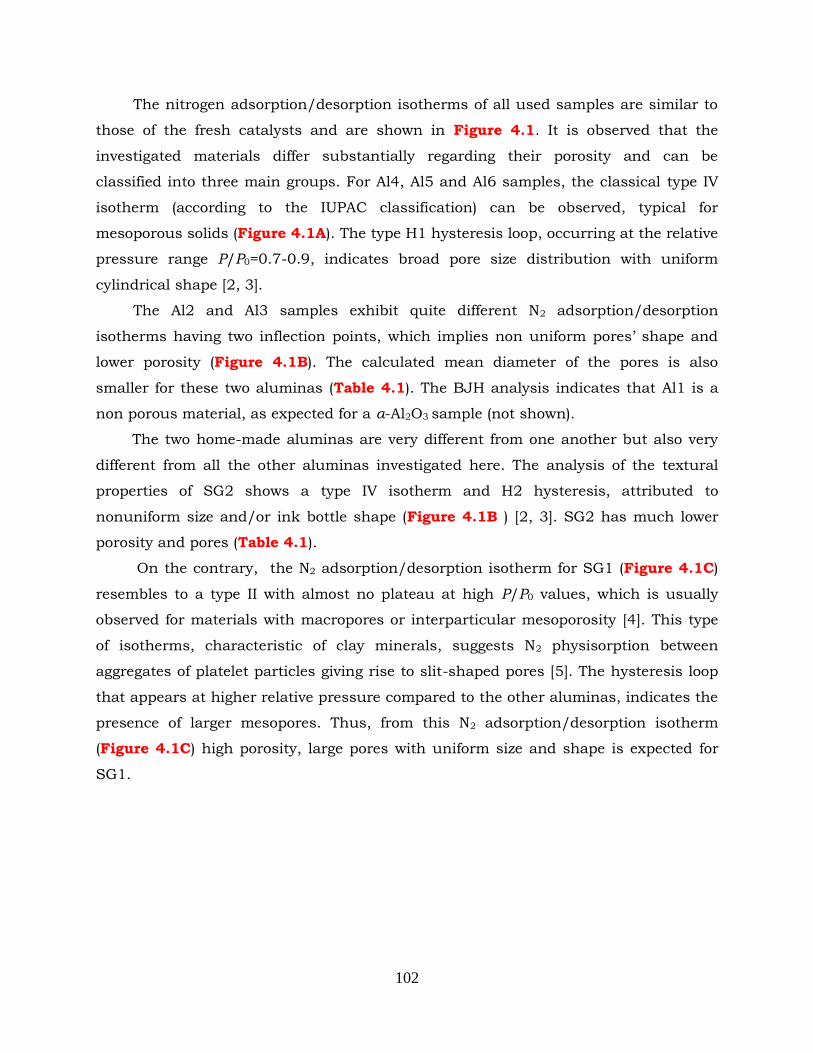
102
The nitrogen adsorption/desorption isotherms of all used samples are similar to
those of the fresh catalysts and are shown in Figure 4.1. It is observed that the
investigated materials differ substantially regarding their porosity and can be
classified into three main groups. For Al4, Al5 and Al6 samples, the classical type IV
isotherm (according to the IUPAC classification) can be observed, typical for
mesoporous solids (Figure 4.1A). The type H1 hysteresis loop, occurring at the relative
pressure range P/P0=0.7-0.9, indicates broad pore size distribution with uniform
cylindrical shape [2, 3].
The Al2 and Al3 samples exhibit quite different N2 adsorption/desorption
isotherms having two inflection points, which implies non uniform pores‟ shape and
lower porosity (Figure 4.1B). The calculated mean diameter of the pores is also
smaller for these two aluminas (Table 4.1). The BJH analysis indicates that Al1 is a
non porous material, as expected for a α-Al2O3 sample (not shown).
The two home-made aluminas are very different from one another but also very
different from all the other aluminas investigated here. The analysis of the textural
properties of SG2 shows a type IV isotherm and H2 hysteresis, attributed to
nonuniform size and/or ink bottle shape (Figure 4.1B ) [2, 3]. SG2 has much lower
porosity and pores (Table 4.1).
On the contrary, the N2 adsorption/desorption isotherm for SG1 (Figure 4.1C)
resembles to a type II with almost no plateau at high P/P0 values, which is usually
observed for materials with macropores or interparticular mesoporosity [4]. This type
of isotherms, characteristic of clay minerals, suggests N2 physisorption between
aggregates of platelet particles giving rise to slit-shaped pores [5]. The hysteresis loop
that appears at higher relative pressure compared to the other aluminas, indicates the
presence of larger mesopores. Thus, from this N2 adsorption/desorption isotherm
(Figure 4.1C) high porosity, large pores with uniform size and shape is expected for
SG1.
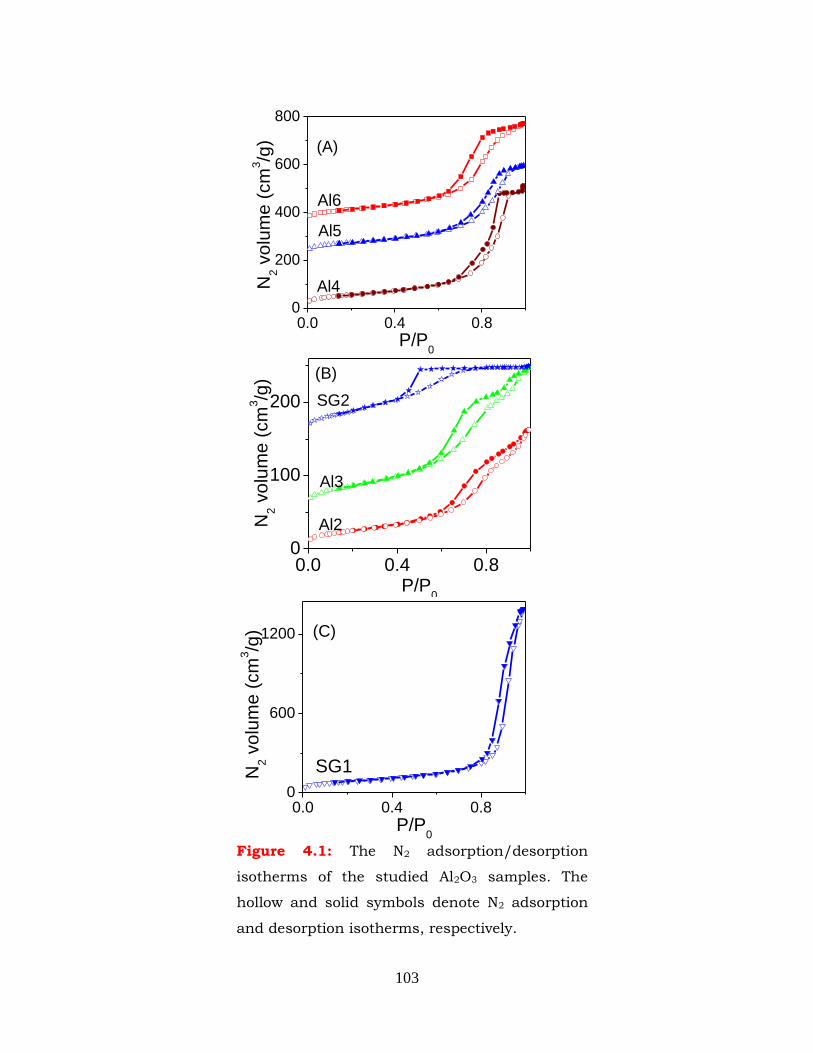
103
0.0 0.4 0.80
100
200
Al3
SG2
(B)
N2 v
olu
me
(cm
3/g
)
P/P0
Al2
0.0 0.4 0.80
200
400
600
800
N2 v
olu
me
(cm
3/g
)
Al6
Al5
Al4
(A)
P/P0
Figure 4.1: The N2 adsorption/desorption
isotherms of the studied Al2O3 samples. The
hollow and solid symbols denote N2 adsorption
and desorption isotherms, respectively.
0.0 0.4 0.80
600
1200 (C)
N2 v
olu
me
(cm
3/g
)
P/P0
SG1
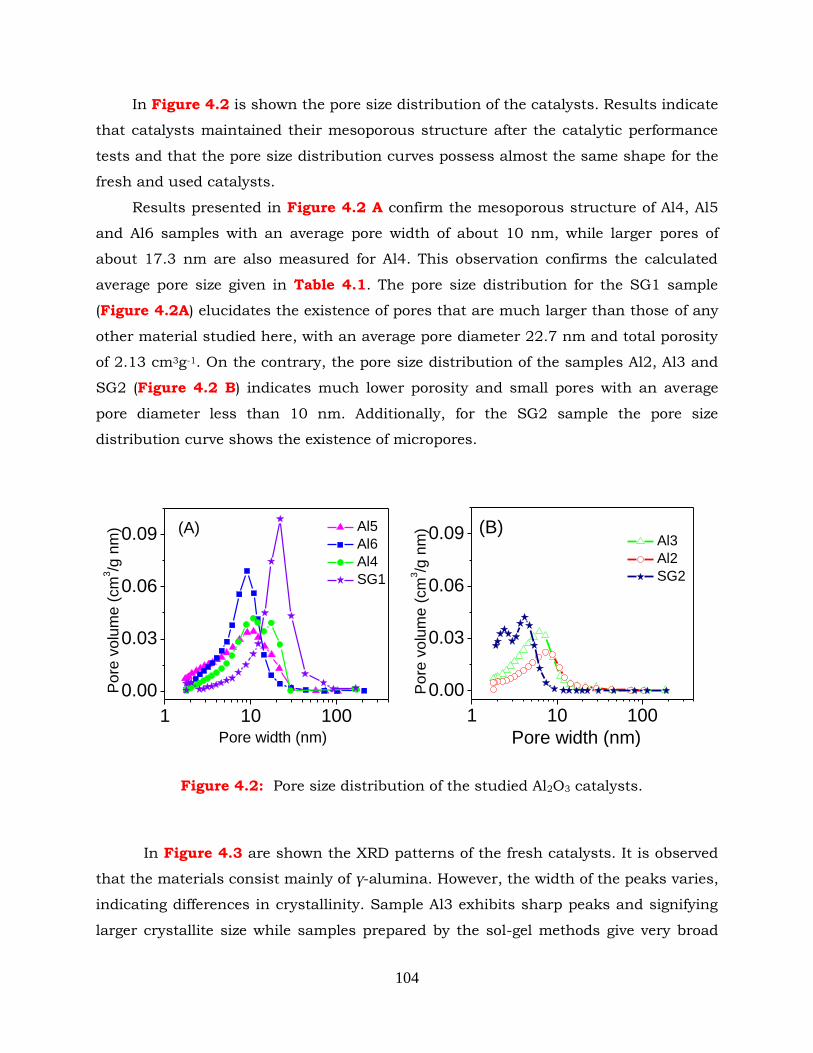
104
In Figure 4.2 is shown the pore size distribution of the catalysts. Results indicate
that catalysts maintained their mesoporous structure after the catalytic performance
tests and that the pore size distribution curves possess almost the same shape for the
fresh and used catalysts.
Results presented in Figure 4.2 A confirm the mesoporous structure of Al4, Al5
and Al6 samples with an average pore width of about 10 nm, while larger pores of
about 17.3 nm are also measured for Al4. This observation confirms the calculated
average pore size given in Table 4.1. The pore size distribution for the SG1 sample
(Figure 4.2A) elucidates the existence of pores that are much larger than those of any
other material studied here, with an average pore diameter 22.7 nm and total porosity
of 2.13 cm3g-1. On the contrary, the pore size distribution of the samples Al2, Al3 and
SG2 (Figure 4.2 B) indicates much lower porosity and small pores with an average
pore diameter less than 10 nm. Additionally, for the SG2 sample the pore size
distribution curve shows the existence of micropores.
In Figure 4.3 are shown the XRD patterns of the fresh catalysts. It is observed
that the materials consist mainly of γ-alumina. However, the width of the peaks varies,
indicating differences in crystallinity. Sample Al3 exhibits sharp peaks and signifying
larger crystallite size while samples prepared by the sol-gel methods give very broad
Figure 4.2: Pore size distribution of the studied Al2O3 catalysts.
1 10 100
0.00
0.03
0.06
0.09 Al3
Al2
SG2
Po
re v
olu
me
(cm
3/g
nm
)
Pore width (nm)
(B)
1 10 100
0.00
0.03
0.06
0.09 Al5
Al6
Al4
SG1
Po
re v
olu
me
(cm
3/g
nm
)
Pore width (nm)
(A)
105
diffraction bands due to the poor crystallization of the alumina. For sample Al2,
multiple peaks are clearly observed, e.g. besides of the peak at 2θ=45.91o,
corresponding to the (400) plane of γ-Al2O3, there is another peak located at 46.75o.
This implies that other crystallographic phases besides of γ-Al2O3 are also present,
probably δ-Al2O3 and χ-Al2O3. Synthesis conditions and thermal treatment define the
extent of hydroxyls incorporation and structural rearrangements resulting in the
formation of various transition aluminas [6]. The detection of χ-Al2O3 indicates that
gibbsite was present in the precursor oxyhydroxide, while the presence of δ-Al2O3 is
due to heating above 750 °C.
It is worth noting that slight shifts of the diffraction peaks are observed for the
other samples, which indicate differences in the lattice parameters and/or the
presence of other transition aluminas, especially in the case of SG1. In the XRD
20 30 40 50 60 70
2 theta
Inte
nsity (
cou
nts
)
Al3
Al5
Al4
Al6
Al2
SG2
SG1
Figure 4.3: X-ray diffraction (XRD) patterns obtained over the indicated
Al2O3 catalysts. Symbols correspond to the following JPCS data: ▲ 10-
0425 γ-Al2O3, ● 04-0877 δ-Al2O3, + 04-0880 χ-Al2O3 ○ 21-1307 AlO(OH).
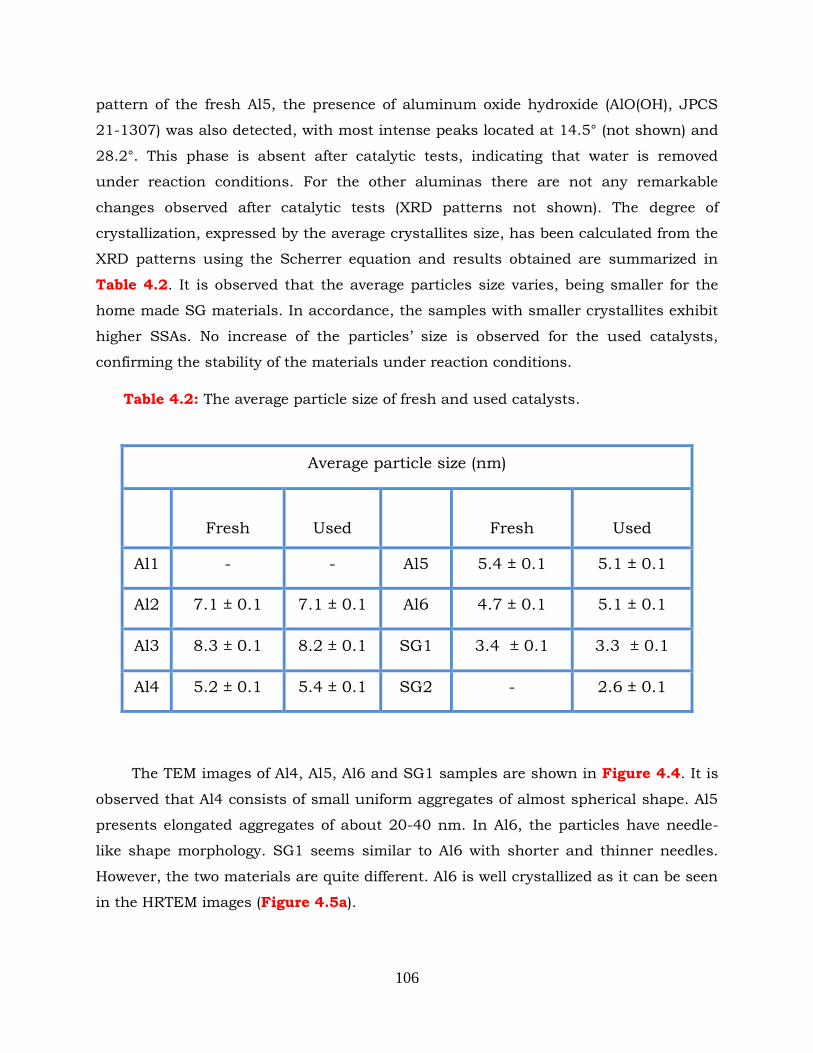
106
pattern of the fresh Al5, the presence of aluminum oxide hydroxide (AlO(OH), JPCS
21-1307) was also detected, with most intense peaks located at 14.5° (not shown) and
28.2°. This phase is absent after catalytic tests, indicating that water is removed
under reaction conditions. For the other aluminas there are not any remarkable
changes observed after catalytic tests (XRD patterns not shown). The degree of
crystallization, expressed by the average crystallites size, has been calculated from the
XRD patterns using the Scherrer equation and results obtained are summarized in
Table 4.2. It is observed that the average particles size varies, being smaller for the
home made SG materials. In accordance, the samples with smaller crystallites exhibit
higher SSAs. No increase of the particles‟ size is observed for the used catalysts,
confirming the stability of the materials under reaction conditions.
The TEM images of Al4, Al5, Al6 and SG1 samples are shown in Figure 4.4. It is
observed that Al4 consists of small uniform aggregates of almost spherical shape. Al5
presents elongated aggregates of about 20-40 nm. In Al6, the particles have needle-
like shape morphology. SG1 seems similar to Al6 with shorter and thinner needles.
However, the two materials are quite different. Al6 is well crystallized as it can be seen
in the HRTEM images (Figure 4.5a).
Average particle size (nm)
Fresh
Used
Fresh
Used
Al1 - - Al5 5.4 ± 0.1 5.1 ± 0.1
Al2 7.1 ± 0.1 7.1 ± 0.1 Al6 4.7 ± 0.1 5.1 ± 0.1
Al3 8.3 ± 0.1 8.2 ± 0.1 SG1 3.4 ± 0.1 3.3 ± 0.1
Al4 5.2 ± 0.1 5.4 ± 0.1 SG2 - 2.6 ± 0.1
Table 4.2: The average particle size of fresh and used catalysts.
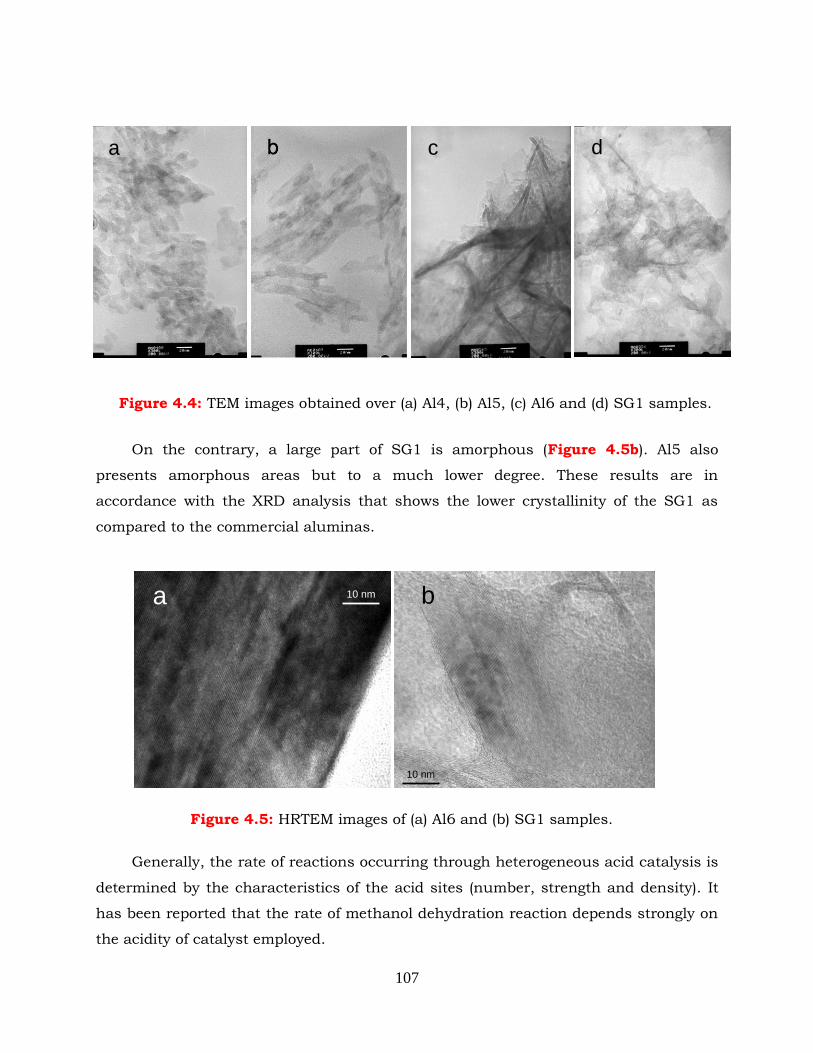
107
On the contrary, a large part of SG1 is amorphous (Figure 4.5b). Al5 also
presents amorphous areas but to a much lower degree. These results are in
accordance with the XRD analysis that shows the lower crystallinity of the SG1 as
compared to the commercial aluminas.
Generally, the rate of reactions occurring through heterogeneous acid catalysis is
determined by the characteristics of the acid sites (number, strength and density). It
has been reported that the rate of methanol dehydration reaction depends strongly on
the acidity of catalyst employed.
10 nma
a c dd
Figure 4.4: TEM images obtained over (a) Al4, (b) Al5, (c) Al6 and (d) SG1 samples.
10 nm
b
Figure 4.5: HRTEM images of (a) Al6 and (b) SG1 samples.
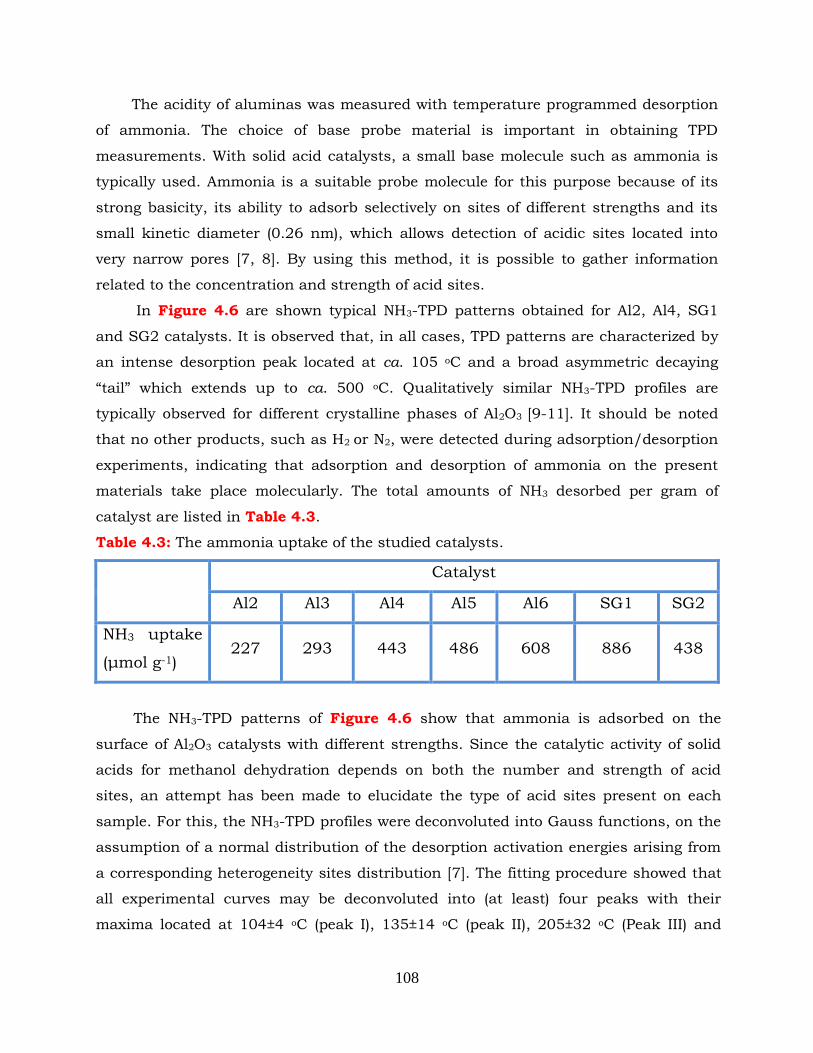
108
The acidity of aluminas was measured with temperature programmed desorption
of ammonia. The choice of base probe material is important in obtaining TPD
measurements. With solid acid catalysts, a small base molecule such as ammonia is
typically used. Ammonia is a suitable probe molecule for this purpose because of its
strong basicity, its ability to adsorb selectively on sites of different strengths and its
small kinetic diameter (0.26 nm), which allows detection of acidic sites located into
very narrow pores [7, 8]. By using this method, it is possible to gather information
related to the concentration and strength of acid sites.
In Figure 4.6 are shown typical NH3-TPD patterns obtained for Al2, Al4, SG1
and SG2 catalysts. It is observed that, in all cases, TPD patterns are characterized by
an intense desorption peak located at ca. 105 oC and a broad asymmetric decaying
“tail” which extends up to ca. 500 oC. Qualitatively similar NH3-TPD profiles are
typically observed for different crystalline phases of Al2O3 [9-11]. It should be noted
that no other products, such as H2 or N2, were detected during adsorption/desorption
experiments, indicating that adsorption and desorption of ammonia on the present
materials take place molecularly. The total amounts of NH3 desorbed per gram of
catalyst are listed in Table 4.3.
Table 4.3: The ammonia uptake of the studied catalysts.
Catalyst
Al2 Al3 Al4 Al5 Al6 SG1 SG2
NH3 uptake
(μmol g-1) 227 293 443 486 608 886 438
The NH3-TPD patterns of Figure 4.6 show that ammonia is adsorbed on the
surface of Al2O3 catalysts with different strengths. Since the catalytic activity of solid
acids for methanol dehydration depends on both the number and strength of acid
sites, an attempt has been made to elucidate the type of acid sites present on each
sample. For this, the NH3-TPD profiles were deconvoluted into Gauss functions, on the
assumption of a normal distribution of the desorption activation energies arising from
a corresponding heterogeneity sites distribution [7]. The fitting procedure showed that
all experimental curves may be deconvoluted into (at least) four peaks with their
maxima located at 104±4 oC (peak I), 135±14 oC (peak II), 205±32 oC (Peak III) and
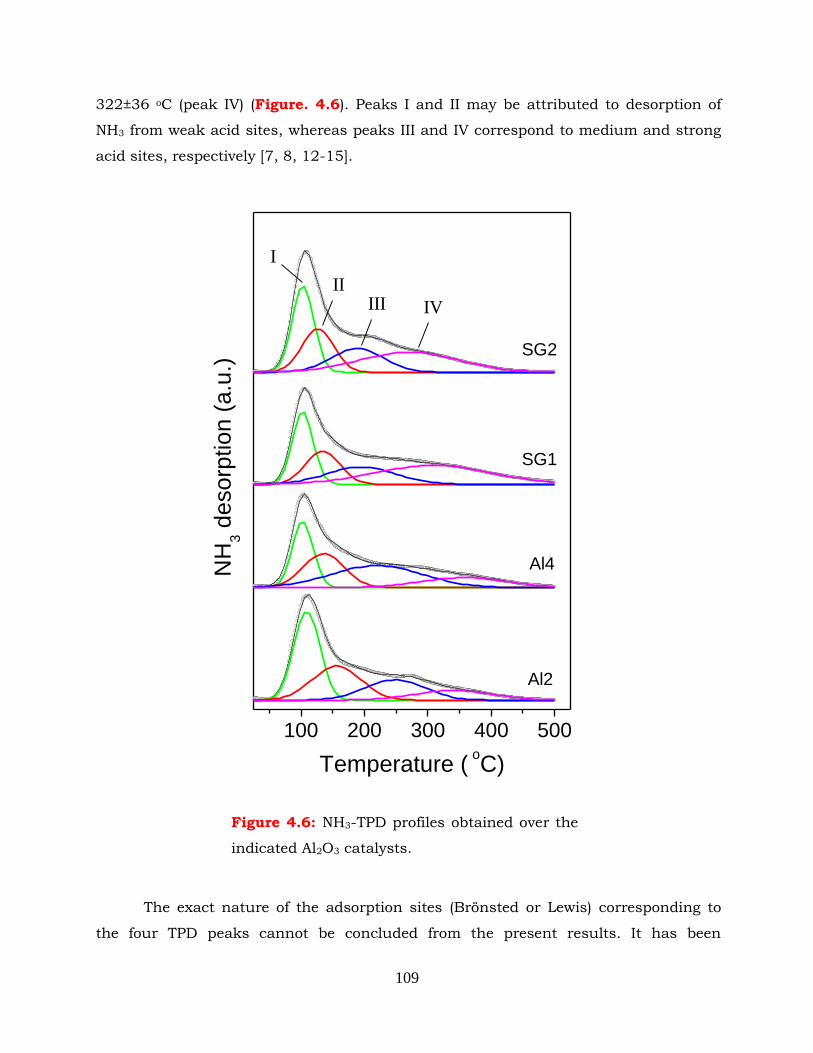
109
322±36 oC (peak IV) (Figure. 4.6). Peaks I and II may be attributed to desorption of
NH3 from weak acid sites, whereas peaks III and IV correspond to medium and strong
acid sites, respectively [7, 8, 12-15].
The exact nature of the adsorption sites (Brönsted or Lewis) corresponding to
the four TPD peaks cannot be concluded from the present results. It has been
Figure 4.6: NH3-TPD profiles obtained over the
indicated Al2O3 catalysts.
100 200 300 400 500
IVIIIII
I
SG2
SG1
Al4
Al2
NH
3 d
esorp
tion
(a.u
.)
Temperature ( oC)
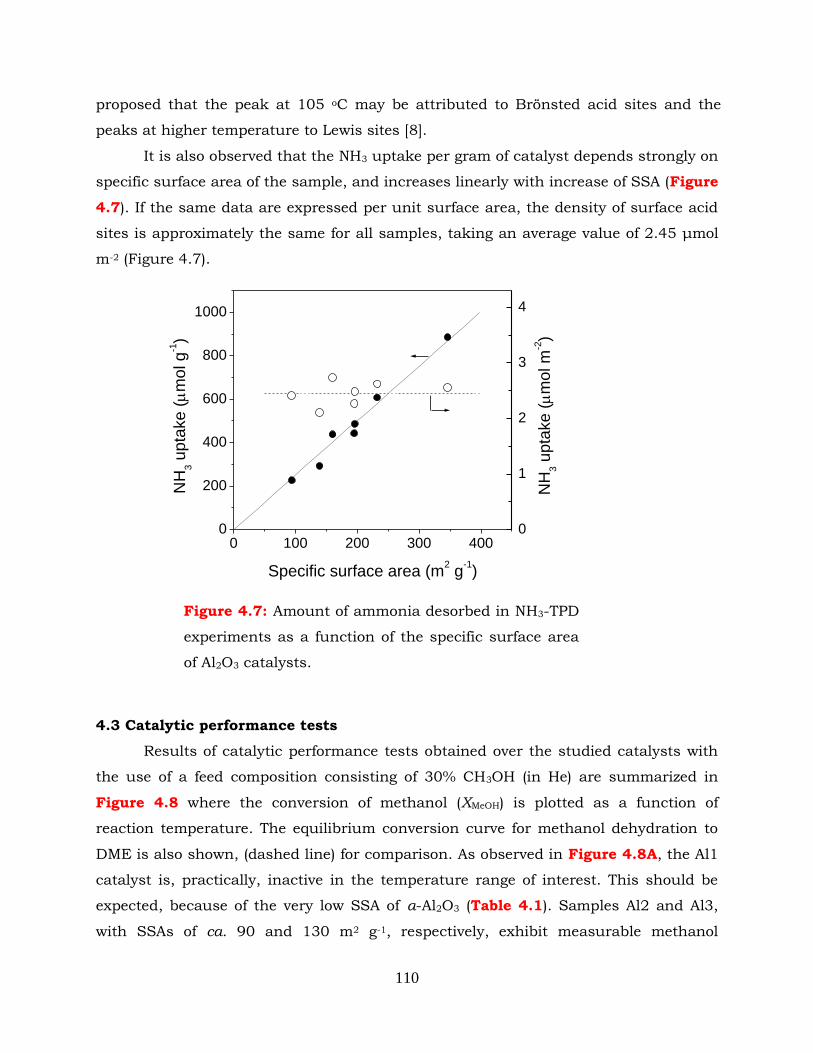
110
proposed that the peak at 105 oC may be attributed to Brönsted acid sites and the
peaks at higher temperature to Lewis sites [8].
It is also observed that the NH3 uptake per gram of catalyst depends strongly on
specific surface area of the sample, and increases linearly with increase of SSA (Figure
4.7). If the same data are expressed per unit surface area, the density of surface acid
sites is approximately the same for all samples, taking an average value of 2.45 μmol
m-2 (Figure 4.7).
4.3 Catalytic performance tests
Results of catalytic performance tests obtained over the studied catalysts with
the use of a feed composition consisting of 30% CH3OH (in He) are summarized in
Figure 4.8 where the conversion of methanol (XMeOH) is plotted as a function of
reaction temperature. The equilibrium conversion curve for methanol dehydration to
DME is also shown, (dashed line) for comparison. As observed in Figure 4.8A, the Al1
catalyst is, practically, inactive in the temperature range of interest. This should be
expected, because of the very low SSA of α-Al2O3 (Table 4.1). Samples Al2 and Al3,
with SSAs of ca. 90 and 130 m2 g-1, respectively, exhibit measurable methanol
0 100 200 300 4000
200
400
600
800
1000
NH
3 u
pta
ke
(
mo
l g
-1)
Specific surface area (m2 g
-1)
0
1
2
3
4
NH
3 u
pta
ke (m
ol m
-2)
Figure 4.7: Amount of ammonia desorbed in NH3-TPD
experiments as a function of the specific surface area
of Al2O3 catalysts.
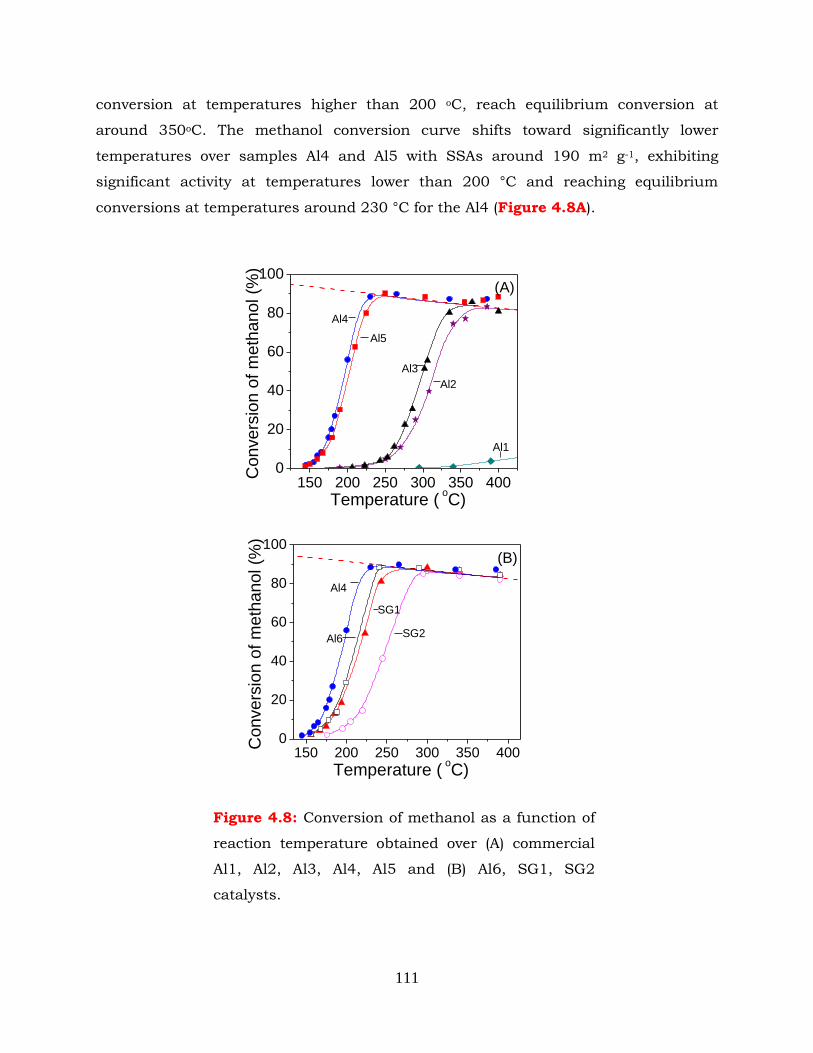
111
conversion at temperatures higher than 200 oC, reach equilibrium conversion at
around 350oC. The methanol conversion curve shifts toward significantly lower
temperatures over samples Al4 and Al5 with SSAs around 190 m2 g-1, exhibiting
significant activity at temperatures lower than 200 °C and reaching equilibrium
conversions at temperatures around 230 °C for the Al4 (Figure 4.8A).
Figure 4.8: Conversion of methanol as a function of
reaction temperature obtained over (A) commercial
Al1, Al2, Al3, Al4, Al5 and (B) Al6, SG1, SG2
catalysts.
150 200 250 300 350 4000
20
40
60
80
100
Al4
(B)
SG2
SG1
Al6
Convers
ion o
f m
eth
anol (%
)
Temperature ( oC)
150 200 250 300 350 4000
20
40
60
80
100
Al4
(A)
Al1
Al2
Al3
Al5
C
onvers
ion o
f m
eth
anol (%
)
Temperature ( oC)
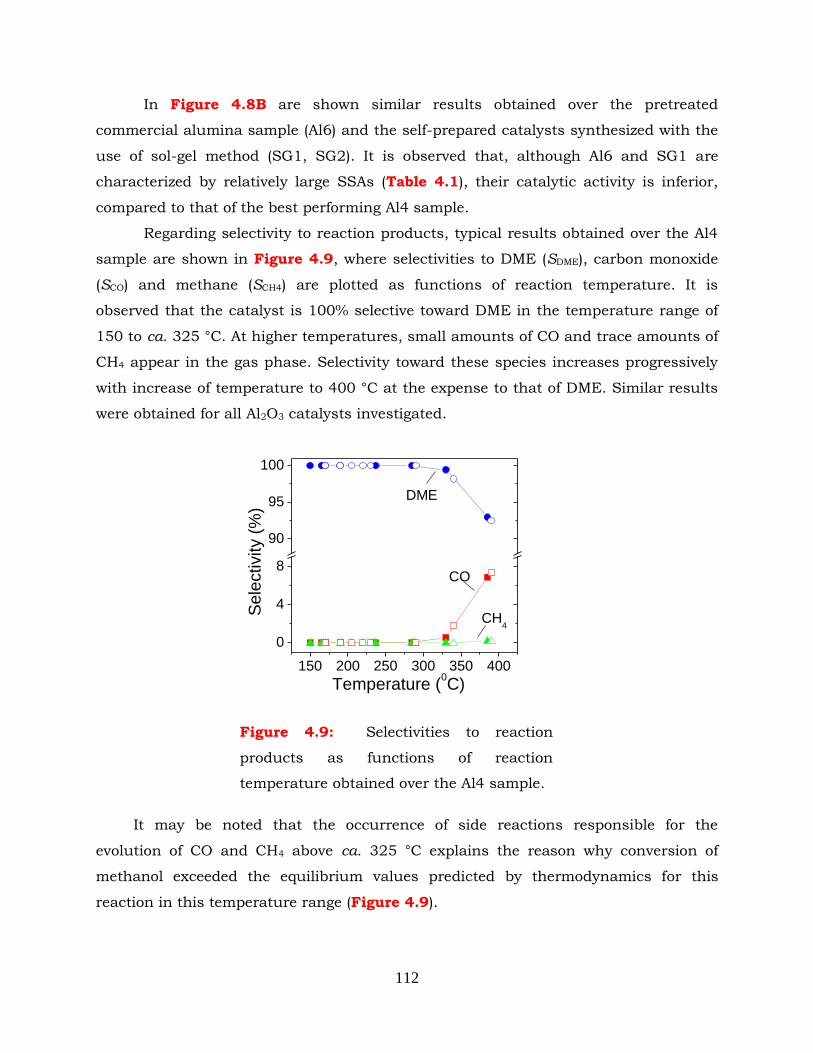
112
In Figure 4.8B are shown similar results obtained over the pretreated
commercial alumina sample (Al6) and the self-prepared catalysts synthesized with the
use of sol-gel method (SG1, SG2). It is observed that, although Al6 and SG1 are
characterized by relatively large SSAs (Table 4.1), their catalytic activity is inferior,
compared to that of the best performing Al4 sample.
Regarding selectivity to reaction products, typical results obtained over the Al4
sample are shown in Figure 4.9, where selectivities to DME (SDME), carbon monoxide
(SCO) and methane (SCH4) are plotted as functions of reaction temperature. It is
observed that the catalyst is 100% selective toward DME in the temperature range of
150 to ca. 325 °C. At higher temperatures, small amounts of CO and trace amounts of
CH4 appear in the gas phase. Selectivity toward these species increases progressively
with increase of temperature to 400 °C at the expense to that of DME. Similar results
were obtained for all Al2O3 catalysts investigated.
It may be noted that the occurrence of side reactions responsible for the
evolution of CO and CH4 above ca. 325 °C explains the reason why conversion of
methanol exceeded the equilibrium values predicted by thermodynamics for this
reaction in this temperature range (Figure 4.9).
Figure 4.9: Selectivities to reaction
products as functions of reaction
temperature obtained over the Al4 sample.
150 200 250 300 350 400
0
4
8
90
95
100
CH4
CO
DME
Sele
ctivity (
%)
Temperature (0C)
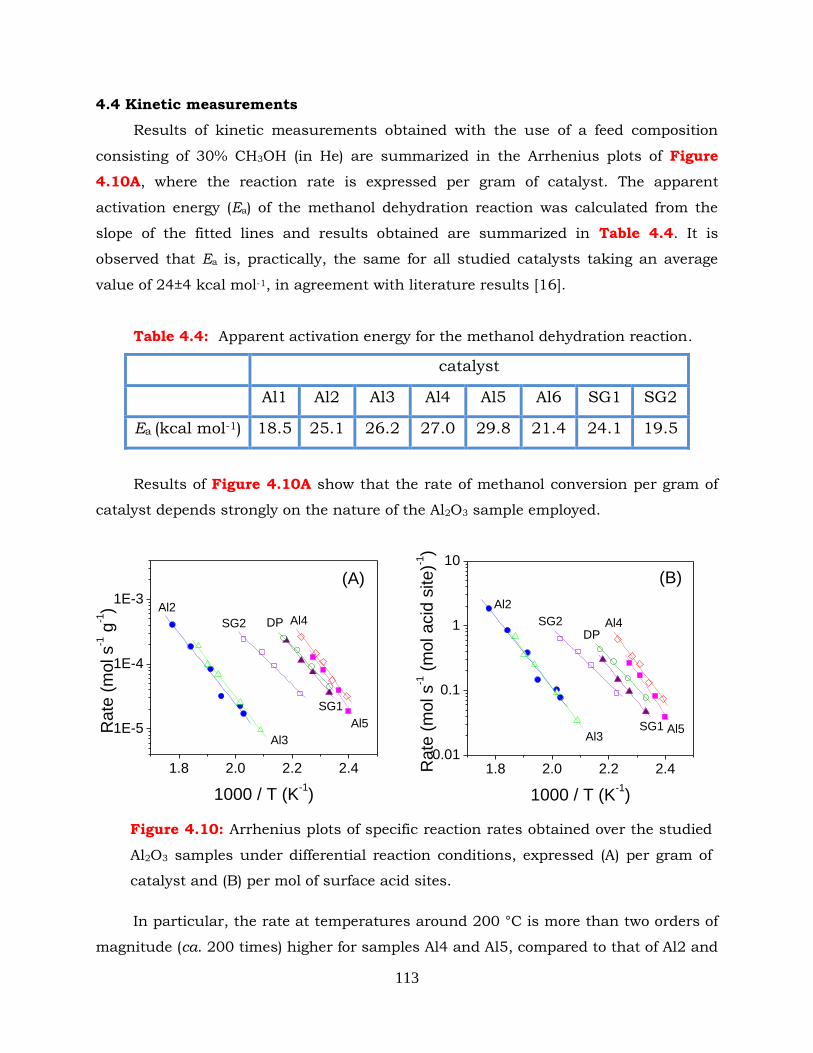
113
4.4 Kinetic measurements
Results of kinetic measurements obtained with the use of a feed composition
consisting of 30% CH3OH (in He) are summarized in the Arrhenius plots of Figure
4.10A, where the reaction rate is expressed per gram of catalyst. The apparent
activation energy (Ea) of the methanol dehydration reaction was calculated from the
slope of the fitted lines and results obtained are summarized in Table 4.4. It is
observed that Ea is, practically, the same for all studied catalysts taking an average
value of 24±4 kcal mol-1, in agreement with literature results [16].
Table 4.4: Apparent activation energy for the methanol dehydration reaction.
catalyst
Al1 Al2 Al3 Al4 Al5 Al6 SG1 SG2
Ea (kcal mol-1) 18.5 25.1 26.2 27.0 29.8 21.4 24.1 19.5
Results of Figure 4.10A show that the rate of methanol conversion per gram of
catalyst depends strongly on the nature of the Al2O3 sample employed.
In particular, the rate at temperatures around 200 °C is more than two orders of
magnitude (ca. 200 times) higher for samples Al4 and Al5, compared to that of Al2 and
Figure 4.10: Arrhenius plots of specific reaction rates obtained over the studied
Al2O3 samples under differential reaction conditions, expressed (A) per gram of
catalyst and (B) per mol of surface acid sites.
1.8 2.0 2.2 2.4
1E-5
1E-4
1E-3
(A)
Al3
Al2
SG2
SG1
DP Al4
Al5
Rate
(m
ol s
-1 g
-1)
1000 / T (K-1)
1.8 2.0 2.2 2.40.01
0.1
1
10
(B)
Al3
Al2
SG2
SG1
DPAl4
Al5
Rate
(m
ol s
-1 (
mol acid
site)-1
)
1000 / T (K-1)
114
Al3, with other catalysts exhibiting intermediate activity. These differences cannot be
explained solely by taking into account differences of the SSA or of the total number of
acid sites (determined by NH3-TPD) of the catalysts, which vary only by a factor of 3 for
the studied samples (Table 4.3). This is clearly evidenced in the Arrhenius plots of
Fig. 4.10B, where the reaction rates are divided with the moles of ammonia desorbed
per unit mass of catalyst. If the reaction rate was directly proportional to the total
number of acidic sites, all data points should fall on the same Arrhenius line, which,
obviously, is not the case. Thus, although some authors reported that catalytic activity
correlated well with the number of acidic sites of γ-Al2O3 [14], no such correlation
could be obtained in the present study, in agreement with results of other
investigators [9].
Results of Fig 4.10 imply that physicochemical characteristics other than SSA
or total number of surface acid sites (estimated by NH3-TPD) determine to a large
extent the activity of Al2O3 catalysts for the title reaction. It has been reported, for
example, that alumina samples with the highest proportion of weak/moderate acid
sites exhibit the best catalytic performance and stability for the synthesis of dimethyl
ether, and that the variation in activity of Al2O3 catalysts is a result of different
acidities and ratios of weak to strong acidic sites [1, 12, 16, 17]. This explains the
reason why catalytic activity can be varied by addition of promoters or by controlling
the acidic properties of alumina or zeolites [18, 19]. Based on these arguments, an
attempt has been made to correlate catalytic activity of the studied samples with the
number of weak, medium or strong acid sites estimated by deconvolution of the NH3-
TPD patterns (Fig. 4.6). Results of this analysis (not shown for brevity) did not show a
direct correlation between the amount of acid sites of different strengths with catalytic
activity. This may be, at least in part, due to the absence of clearly resolved peaks in
the NH3-TPD patterns (Fig. 4.6), which does not allow accurate determination of the
surface concentration of acid sites of various strength. It should be noted that the
NH3-TPD method does not provide information related to the types of acidic sites (e.g.,
Brønsted or Lewis sites) present on the catalyst surface [9], which have been reported
to have different activities [18].
The assessment of the textural properties showed that, in addition to SSA, the
aluminas differ also in their porosity and average pore diameter. The importance of the
pores‟ structure for dehydration reactions has been reported for materials
115
characterized by microporosity such as zeolites and pillared clays [20-23]. Methanol
dehydration, considered as a bimolecular reaction between two methoxy species or
between a methoxy species and an undissociated methanol adsorbed on adjacent
surface sites, would require the close proximity of two acid sites with adequate acidity
but also pores having size large enough to permit this type of reactions. Even larger
pores would be needed if one considers a single dehydration site for the formation of a
methoxy species that would react with a methanol molecule in the gas phase. On the
other hand, ammonia is an excellent probe molecule for testing the acidic properties of
solid catalysts due to its strong basicity and small molecular size that allow for
detection of acidic sites located also into very narrow pores [7]. Thus, acids sites in
narrow pores, although titrated by ammonia, may be ineffective for DME formation
due to steorochemical inhibition.
Raimondo et al. [22] have studied the acidity/porosity relationships on oxide-
pillared materials and concluded that dehydration is favoured in large pores. Even
though the above restrictions should not apply in the case of mesoporous materials
such as aluminas, results of the present study indicate that the aluminas having
cylindrical pores of an average width of about 9-10 nm and total porosity 0.60-0.80
cm3g-1 exhibit higher methanol conversion, compared to those with lower porosity.
Further increase of porosity (SG1) does not induce additional activity enhancement.
Comparable results have also been reported in other studies, with the use of similar
materials for the title reaction [24].
Another parameter that can affect catalytic behaviour is the degree of
crystallinity of the materials. The XRD patterns (Fig. 4.3) and the TEM images (Figs.
4.4 and 4.5) revealed differences in the crystallinity of the alumina samples. Having in
mind that smaller crystallites signify higher number of defects and therefore higher
number of methanol adsorption sites, the decrease of the crystallite size should be
accompanied by an analogous increase in methanol conversion. This is true when the
crystallites‟ size decrease from 7.0-8.0 nm (Al2 and Al3) to about 5.0-5.5 nm (Al4, Al5,
Al6). Further decrease of crystallites size, as in the case of SG1, does not result in
further increase of the activity. It should be noted, however, that this material is
highly amorphous.
Based on the above discussion, it may be concluded that the textural properties,
degree of crystallinity and total amount of acid sites determine to a large extent the
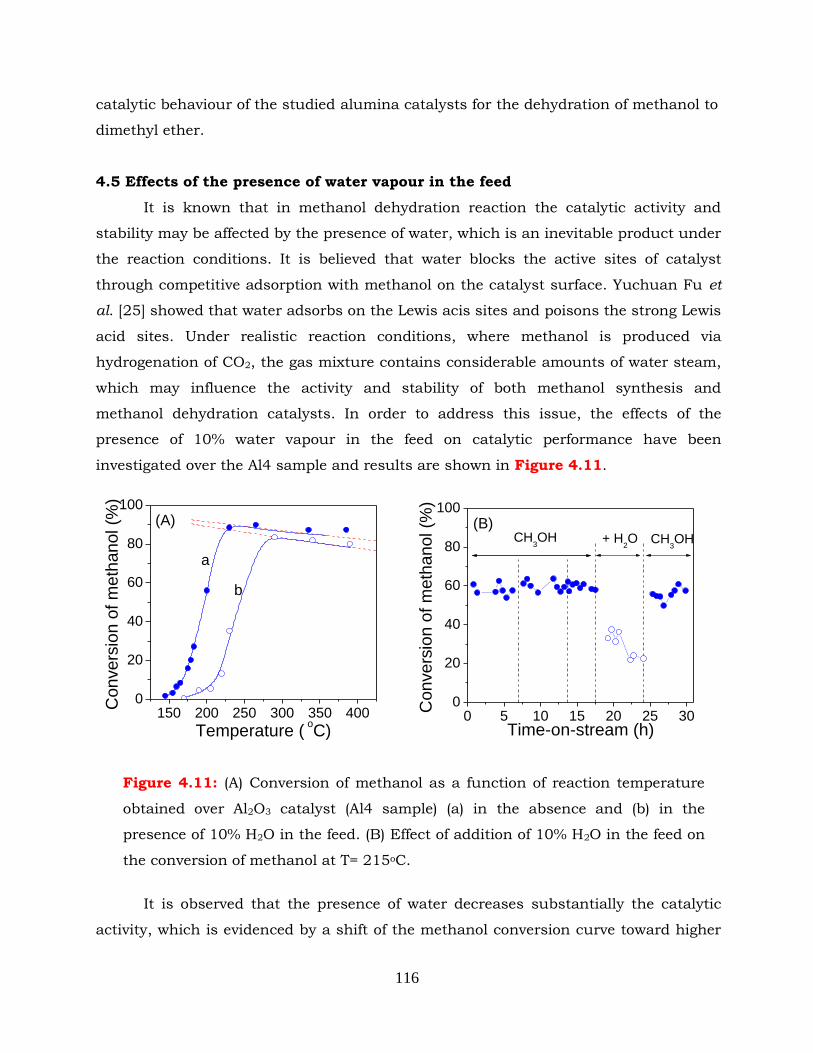
116
catalytic behaviour of the studied alumina catalysts for the dehydration of methanol to
dimethyl ether.
4.5 Effects of the presence of water vapour in the feed
It is known that in methanol dehydration reaction the catalytic activity and
stability may be affected by the presence of water, which is an inevitable product under
the reaction conditions. It is believed that water blocks the active sites of catalyst
through competitive adsorption with methanol on the catalyst surface. Yuchuan Fu et
al. [25] showed that water adsorbs on the Lewis acis sites and poisons the strong Lewis
acid sites. Under realistic reaction conditions, where methanol is produced via
hydrogenation of CO2, the gas mixture contains considerable amounts of water steam,
which may influence the activity and stability of both methanol synthesis and
methanol dehydration catalysts. In order to address this issue, the effects of the
presence of 10% water vapour in the feed on catalytic performance have been
investigated over the Al4 sample and results are shown in Figure 4.11.
It is observed that the presence of water decreases substantially the catalytic
activity, which is evidenced by a shift of the methanol conversion curve toward higher
Figure 4.11: (A) Conversion of methanol as a function of reaction temperature
obtained over Al2O3 catalyst (Al4 sample) (a) in the absence and (b) in the
presence of 10% H2O in the feed. (B) Effect of addition of 10% H2O in the feed on
the conversion of methanol at T= 215oC.
150 200 250 300 350 4000
20
40
60
80
100
b
a
(A)
Convers
ion o
f m
eth
anol (%
)
Temperature ( oC)
0 5 10 15 20 25 300
20
40
60
80
100(B)
CH3OHCH
3OH + H
2O
Convers
ion o
f m
eth
anol (%
)
Time-on-stream (h)
117
temperatures by ca. 50 oC (Fig. 4.11A). This is accompanied by an increase of the
apparent activation energy of the reaction from 27 to 37 kcal mol-1, in good agreement
with previous studies [16]. Interestingly, the presence of water in the feed does not
influence selectivity to reaction products (Fig. 4.9).
In Fig. 4.11B is shown the variation of the conversion of methanol (XMeOH) with
time-on-stream obtained over the Al4 sample at a constant temperature of 215 oC, in
the absence and in the presence of water in the feed. It is observed that, when a
30%CH3OH (in He) mixture is fed to the reactor, the catalyst exhibits a very stable
performance with the conversion of methanol acquiring values around 60%. Addition
of 10% H2O in the feed results in a substantial decrease of methanol conversion.
However, catalytic activity is restored when water is removed from the feed and XMeOH
returns to its initial value. This clearly shows that the effect of water on catalytic
performance is reversible.
Results of Fig. 4.11 show that Al4 deactivates in the presence of water. This
behaviour, which is typically observed for solid acid catalysts [12, 16], is believed to be
due to blocking of the active sites for methanol conversion via competitive adsorption
of water on the catalyst surface [12, 16, 26, 27]. These issues are discussed in more
detail in the following section.
It should be noted that the presence of water in the feed shifts equilibrium of
the methanol dehydration reaction to the left and, therefore, part of the observed
decrease of methanol conversion is due to thermodynamic reasons (see, for example,
dashed lines in Fig. 4.11A). Thus, when water is present in the reaction mixture, a
higher reaction temperature is always required to achieve the same level of conversion.
In practice, the negative effect of water can be suppressed if the one-step syngas-to-
DME hybrid catalyst contains a component, which is active to the water-gas shift
(WGS) reaction, in which case excess water may be removed efficiently [16].
4.6 Mechanistic studies
The nature, relative population, thermal stability and reactivity of species
formed on the catalyst surface under reaction conditions have been investigated with
the use of in situ DRIFTS and transient-MS techniques, following interaction of Al2O3
(Al4) with either (a) 1.5% H2O (in He) or (b) 0.5% CH3OH (in He) or (c) 1.5% H2O+0.5%
CH3OH (in He) mixtures.
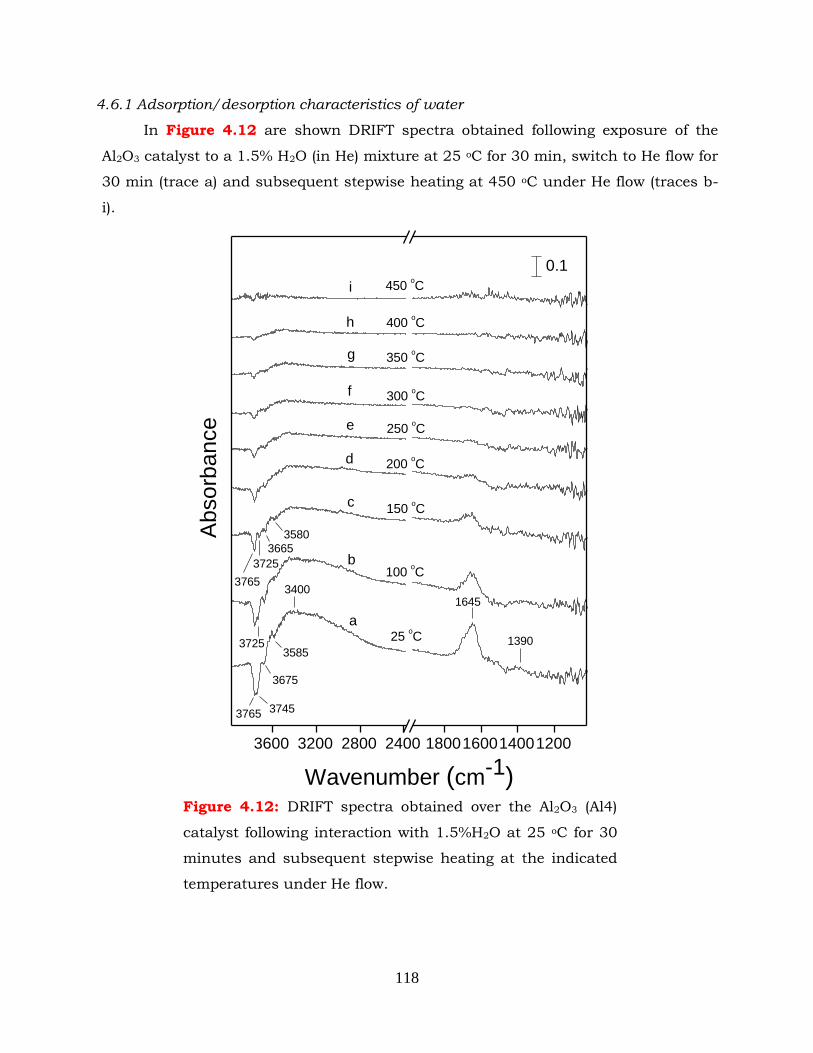
118
4.6.1 Adsorption/desorption characteristics of water
In Figure 4.12 are shown DRIFT spectra obtained following exposure of the
Al2O3 catalyst to a 1.5% H2O (in He) mixture at 25 oC for 30 min, switch to He flow for
30 min (trace a) and subsequent stepwise heating at 450 oC under He flow (traces b-
i).
3600 3200 2800 2400 1800160014001200
3725
3580
3665
3725
3765
3585
1645
3675
1390
450 oC
400 oC
350 oC
300 oC
250 oC
200 oC
150 oC
100 oC
25 oC
3400
3765 3745
i
h
g
f
e
d
c
b
a
0.1
A
bso
rba
nce
Wavenumber (cm-1)Figure 4.12: DRIFT spectra obtained over the Al2O3 (Al4)
catalyst following interaction with 1.5%H2O at 25 oC for 30
minutes and subsequent stepwise heating at the indicated
temperatures under He flow.
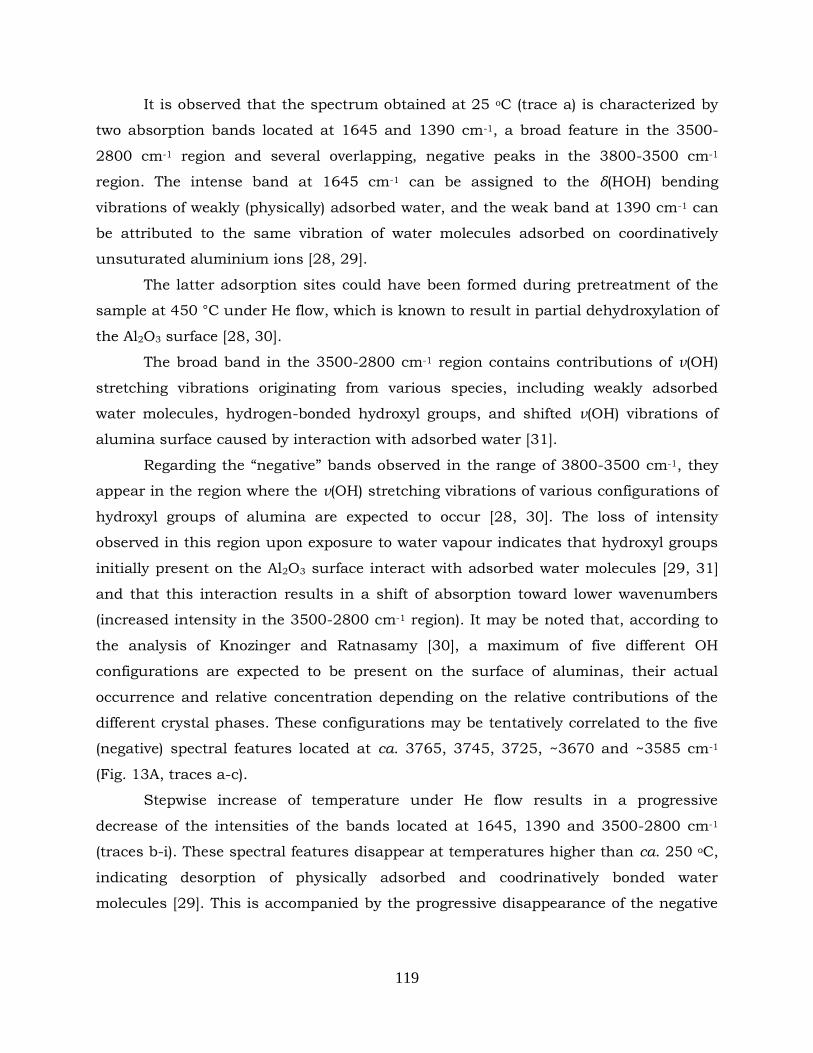
119
It is observed that the spectrum obtained at 25 oC (trace a) is characterized by
two absorption bands located at 1645 and 1390 cm-1, a broad feature in the 3500-
2800 cm-1 region and several overlapping, negative peaks in the 3800-3500 cm-1
region. The intense band at 1645 cm-1 can be assigned to the δ(ΗΟΗ) bending
vibrations of weakly (physically) adsorbed water, and the weak band at 1390 cm-1 can
be attributed to the same vibration of water molecules adsorbed on coordinatively
unsuturated aluminium ions [28, 29].
The latter adsorption sites could have been formed during pretreatment of the
sample at 450 °C under He flow, which is known to result in partial dehydroxylation of
the Al2O3 surface [28, 30].
The broad band in the 3500-2800 cm-1 region contains contributions of ν(OH)
stretching vibrations originating from various species, including weakly adsorbed
water molecules, hydrogen-bonded hydroxyl groups, and shifted ν(OH) vibrations of
alumina surface caused by interaction with adsorbed water [31].
Regarding the “negative” bands observed in the range of 3800-3500 cm-1, they
appear in the region where the ν(OH) stretching vibrations of various configurations of
hydroxyl groups of alumina are expected to occur [28, 30]. The loss of intensity
observed in this region upon exposure to water vapour indicates that hydroxyl groups
initially present on the Al2O3 surface interact with adsorbed water molecules [29, 31]
and that this interaction results in a shift of absorption toward lower wavenumbers
(increased intensity in the 3500-2800 cm-1 region). It may be noted that, according to
the analysis of Knozinger and Ratnasamy [30], a maximum of five different OH
configurations are expected to be present on the surface of aluminas, their actual
occurrence and relative concentration depending on the relative contributions of the
different crystal phases. These configurations may be tentatively correlated to the five
(negative) spectral features located at ca. 3765, 3745, 3725, ~3670 and ~3585 cm-1
(Fig. 13A, traces a-c).
Stepwise increase of temperature under He flow results in a progressive
decrease of the intensities of the bands located at 1645, 1390 and 3500-2800 cm-1
(traces b-i). These spectral features disappear at temperatures higher than ca. 250 oC,
indicating desorption of physically adsorbed and coodrinatively bonded water
molecules [29]. This is accompanied by the progressive disappearance of the negative
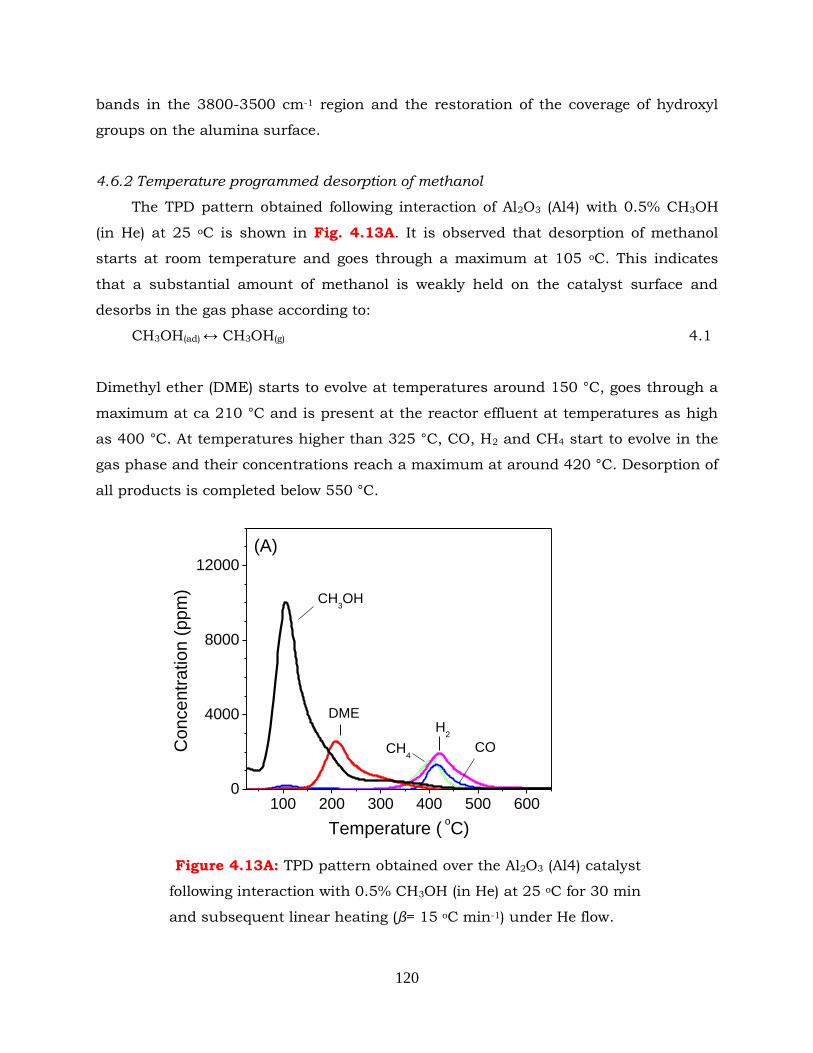
120
bands in the 3800-3500 cm-1 region and the restoration of the coverage of hydroxyl
groups on the alumina surface.
4.6.2 Temperature programmed desorption of methanol
The TPD pattern obtained following interaction of Al2O3 (Al4) with 0.5% CH3OH
(in He) at 25 oC is shown in Fig. 4.13A. It is observed that desorption of methanol
starts at room temperature and goes through a maximum at 105 oC. This indicates
that a substantial amount of methanol is weakly held on the catalyst surface and
desorbs in the gas phase according to:
CH3OH(ad) ↔ CH3OH(g) 4.1
Dimethyl ether (DME) starts to evolve at temperatures around 150 °C, goes through a
maximum at ca 210 °C and is present at the reactor effluent at temperatures as high
as 400 °C. At temperatures higher than 325 °C, CO, H2 and CH4 start to evolve in the
gas phase and their concentrations reach a maximum at around 420 °C. Desorption of
all products is completed below 550 °C.
Figure 4.13A: TPD pattern obtained over the Al2O3 (Al4) catalyst
following interaction with 0.5% CH3OH (in He) at 25 oC for 30 min
and subsequent linear heating (β= 15 oC min-1) under He flow.
100 200 300 400 500 6000
4000
8000
12000
(A)
CH4
H2
CO
CH3OH
DME
Concentr
ation (
ppm
)
Temperature ( oC)
121
Results of Fig. 13A show that Al2O3 (Al4) is able to selectively dehydrate
methanol toward DME at temperatures lower than ca. 350 oC, in agreement with
results presented in Fig. 4.9. At higher temperatures, adsorbed species are
decomposed toward almost equal amounts of CH4, H2 and CO (Fig. 4.13A). This
indicates that the overall reaction that takes place at temperatures above 350 oC may
be described as decomposition of DME:
CH3OCH3(ad) ↔ CH4 + CO +H2 4.2
A similar experiment was conducted with the use of DRIFTS in order to
investigate the nature and reactivity of species formed on the catalyst surface. Results
of this DRIFTS-TPD experiment are presented in Fig. 4.13B which shows spectra
obtained following interaction of Al2O3 with 0.5% CH3OH (in He) at 25 oC for 30 min,
purging with He for 30 min (trace a), and subsequent stepwise heating (with 50 oC
increments) at 450 oC under He flow (traces b-i).
It is observed that the (background-subtracted) spectrum recorded at 25 oC (trace
a) is characterized by negative bands in the ν(ΟΗ) region (3800-3500 cm-1) as well as
by several bands in the C-H stretching frequency region (3100-2700 cm-1) and in the
C-H deformation and C-O stretching regions (1600-1050 cm-1). Two weak, broad
bands can be also discerned at ca. 3200 and 2600 cm-1.
As discussed above, the negative bands located at ca. 3765, 3730 and 3675 cm-1
can be attributed to losses of ν(OH) intensity of (at least) three different types of free
hydroxyl groups initially present on the Al2O3 surface. These groups are known to
hydrogen-bond to adsorbed methanol and methoxy (CH3O-) species, thereby resulting
in the appearance of “negative” bands in the ν(OH) region [32-37] :
CH3OH(g) + OH(a)↔ CH3HO∙∙∙HO(a) 4.3
CH3OH(g) +OH(a)↔CH3O∙∙∙H2O(a) 4.4
Based on literature results [38], the “negative” spectral features observed in the ν(OH)
region can be assigned to medium-strong (3765 cm-1), medium-weak (3730 cm-1) and
weak (3675 cm-1) Lewis acid sites of Al2O3.
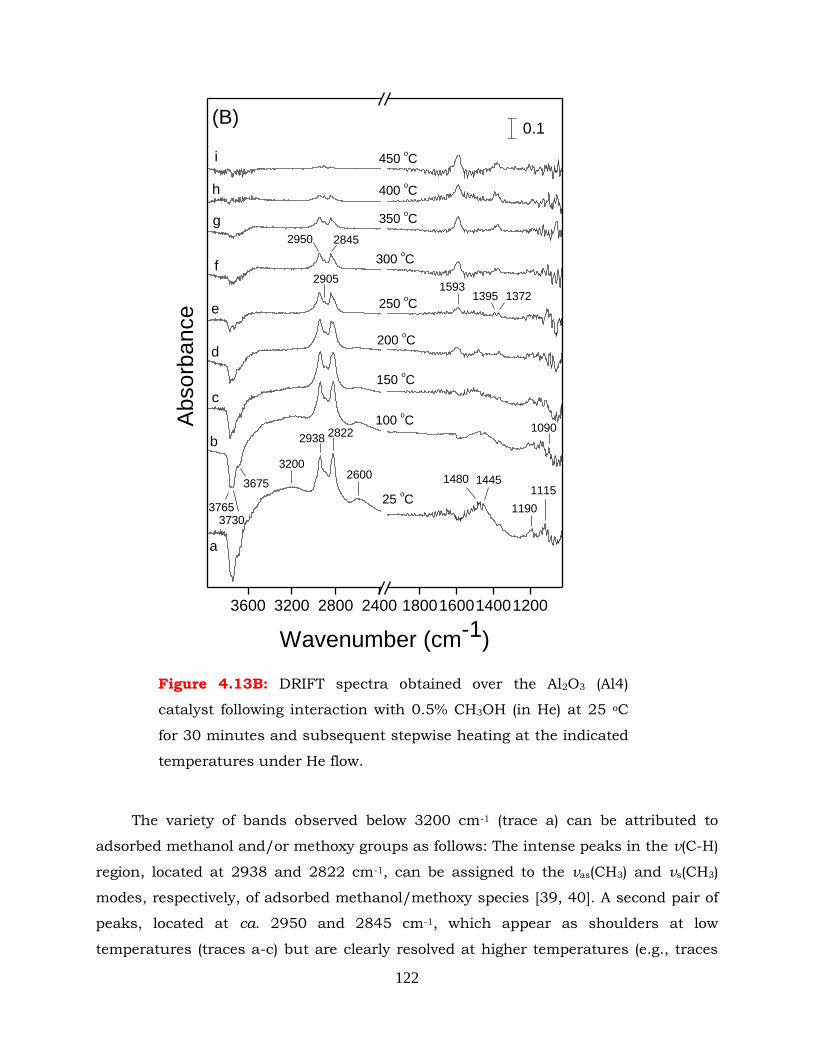
122
The variety of bands observed below 3200 cm-1 (trace a) can be attributed to
adsorbed methanol and/or methoxy groups as follows: The intense peaks in the ν(C-H)
region, located at 2938 and 2822 cm-1, can be assigned to the νas(CH3) and νs(CH3)
modes, respectively, of adsorbed methanol/methoxy species [39, 40]. A second pair of
peaks, located at ca. 2950 and 2845 cm-1, which appear as shoulders at low
temperatures (traces a-c) but are clearly resolved at higher temperatures (e.g., traces
Figure 4.13B: DRIFT spectra obtained over the Al2O3 (Al4)
catalyst following interaction with 0.5% CH3OH (in He) at 25 oC
for 30 minutes and subsequent stepwise heating at the indicated
temperatures under He flow.
3600 3200 2800 2400 1800160014001200
Ab
so
rba
nce
1090
450 oC
400 oC
350 oC
300 oC
250 oC
200 oC
150 oC
100 oC
25 oC
28452950
2905
1395 13721593
1480 14451115
1190
2600
28222938
3200
37653730
3675
i
h
g
f
e
d
c
b
a
0.1(B)
Wavenumber (cm-1)
123
d-i), can be attributed to similar species bonded more strongly on the Al2O3 surface
[34]. The broad band observed between 1550 and 1400 cm-1 is due to antisymmetric
and symmetric δ(CH3) modes (peaks at 1480 and 1445 cm-1) [35, 41] and may contain
a contribution from δ(OH) deformation mode [34]. The peaks located at 1190 and 1115
cm-1 can be assigned to γ(CH3) rocking modes [36, 37, 41] and the peak at 1090 cm-1
to νas(CO) antisymmetric stretching [37, 41] of adsorbed methanol and/or methoxy
species. The broad band located at ca. 2600 cm-1 can been assigned to a combination
band of the methyl rock (1115 cm-1) and methyl deformation (1480 cm-1) modes of
adsorbed methoxy species [35, 36]. Finally, the broad band centered at ca. 3200 cm-1
can be attributed to the O-H stretching frequency of molecularly adsorbed methanol
[34, 37].
It should be noted that all vibrational frequencies of adsorbed methanol lie, in
general, very close to those of their methoxy counterparts [33-37, 39-43] and also to
those of adsorbed dimethyl ether [37, 41, 44]. Thus, it is difficult to determine from
the spectra of Fig. 4.13B the extent to which methanol is adsorbed molecularly or in
the form of methoxy groups. However, the presence of undissociatively adsorbed
methanol is verified by the broad feature located at ca. 3200 cm-1, which is uniquely
associated with the O-H stretching frequency of methanol [35-37]. This band is
discernible in the spectra recorded in the temperature range of 25 to 150 °C (traces a-
c) and disappears at higher temperatures. This is in agreement with results of TPD
experiments of Fig. 14A, which show that weakly held methanol desorbs molecularly
from the Al2O3 surface in this temperature range.
As shown in the TPD pattern of Fig. 4.13A, evolution of small amounts of
methanol in the gas phase continues at temperatures higher than 150 °C, where
molecularly adsorbed methanol is not present on the catalyst surface (Fig. 4.13B).
This indicates that gas-phase methanol may be also formed by combination of surface
species according to [32, 42]:
CH3O (a) +OH (a) ↔ CH3OH (g) + O (surf) 4.5
CH3O (a) + H2O (a) ↔ CH3OH (g) + OH (a) 4.6
This argument is supported by the observation that heating at 200 °C (Fig.
4.13B, trace d), which induces desorption of weakly adsorbed methanol, leads in a
substantial decrease of the intensity of the negative bands in the ν(OH) region.
124
As mentioned above, vibrational frequencies of adsorbed dimethyl ether lie very
close to those of adsorbed methoxy species [41]. This may explain the reason why no
significant differences are observed in the position of IR bands in the ν(C-H) region
upon heating the sample at 150-250 oC (Fig. 14B, traces c-e), where evolution of DME
occurs in the gas phase (Fig. 14A). It may be noted, however, that the pair of peaks at
2938/2822 cm-1 decreases in intensity in this temperature range and that this results
in the resolution of the pair of peaks at ca. 2950/2845 cm-1. It may then be suggested
that formation of DME involves weakly adsorbed methoxy species (doublet at
2938/2822 cm-1) and not methoxy species that are bonded more strongly on the Al2O3
surface (doublet at 2950/2845 cm-1).
Regarding the mechanism of DME formation, it has been proposed that
dehydration of methanol over Al2O3 catalysts, may occur via two possible routes: The
first one involves interaction of adsorbed methoxy species with undissociated
methanol (4.7) [42], and the second involves reaction between two adsorbed methoxy
species adjacent to a hydroxyl group (4.8) [35, 37, 45].
CH3OH (ad) + CH3O (ad) ↔ CH3OCH3 +OH (ad) 4.7
2CH3O (ad) ↔ CH3OCH3 + O (surf) 4.8
2OH (a) → H2O (g) + O (a) 4.9
The present results support the second reaction pathway, because DME
evolution is observed at temperatures above 150 °C, where only methoxy species, and
not molecularly adsorbed methanol, are present on the catalyst surface (Fig. 4.13B).
In addition, evidence is provided that DME production is associated with methoxy
species that are weakly adsorbed on the Al2O3 surface.
Increase of temperature above 150 °C results in a progressive decrease of the
intensities of all bands associated to methoxy/DME species (Fig. 4.13B, traces d-i).
This is accompanied by the development of new bands located at 2905, 1593, 1395
and 1372 cm-1, which can be attributed to ν(CH), νas(COO), δ(CH) and νs(COO) modes,
respectively, of surface formate species [35, 37, 40, 46]. These species may be
produced by oxidation of methoxy groups with intermediate formation of
dioxomethylene species [32, 33, 46] or by decomposition of surface methoxy species
residing on strong Lewis acid sites [35]. The bands attributed to surface formate
125
species progressively increase in intensity with increasing temperature from 150 to
450 °C (traces c-i) and then disappear upon heating at higher temperatures (spectra
not shown for clarity). When methoxy species are completely removed from the
catalyst surface, the negative bands in the ν(OH) region return to base line levels,
indicating that all O-H bands have been gradually restored to their original shape and
intensity.
Comparison of the DRIFT spectra presented in Fig. 4.13B with the TPD pattern
of Fig. 4.13A shows that conversion of methoxy to formate species occurs at
temperatures where DME production is, practically, diminished and CH4, H2 and CO
start to evolve in the gas phase. This is in agreement with results of previous studies,
which reported that conversion of methoxy into formate species is accompanied by
evolution of CH4 and H2 [35], whereas decomposition of formates yields CO and H2O
[44]. Careful inspection of the DRIFT spectra of Fig. 4.13B shows that development of
bands attributed to formate species takes place at the expense of those corresponding
to the strongly held methoxy species (doublet at 2950/2845 cm-1). Thus, it may be
argued that weakly adsorbed methoxy species are converted to DME whereas more
strongly held methoxy species are converted to surface formates and, eventually, to
CH4, H2 and CO in the gas phase.
4.6.3 TPSR of methanol in the absence and in the presence of water
The effects of reaction temperature and feed composition on catalytic activity
and selectivity have been investigated with the use of the temperature-programmed
surface reaction (TPSR) technique. Results obtained following interaction of the Al2O3
catalyst with 0.5%CH3OH (in He) at 25 oC for 30 min and subsequent linear heating
(β=15 oC min-1) at 650 oC under the same flow are shown in Fig. 4.14A, where the MS
responses of methanol, DME, CH4, CO, CO2 and H2 are plotted as functions of
temperature.
It is observed that the TPSR pattern is qualitatively similar to that obtained for
TPD of methanol (Fig. 4.13A). In particular, increase of temperature results in
desorption of a substantial amount of weakly adsorbed methanol, which peaks at ca
90 oC and then decreases abruptly at temperatures higher than ca 150 oC. This is
accompanied by evolution of DME, which is the only reaction product formed in the
temperature range of 150 to 350 oC, in agreement with results of Fig. 4.9. Further
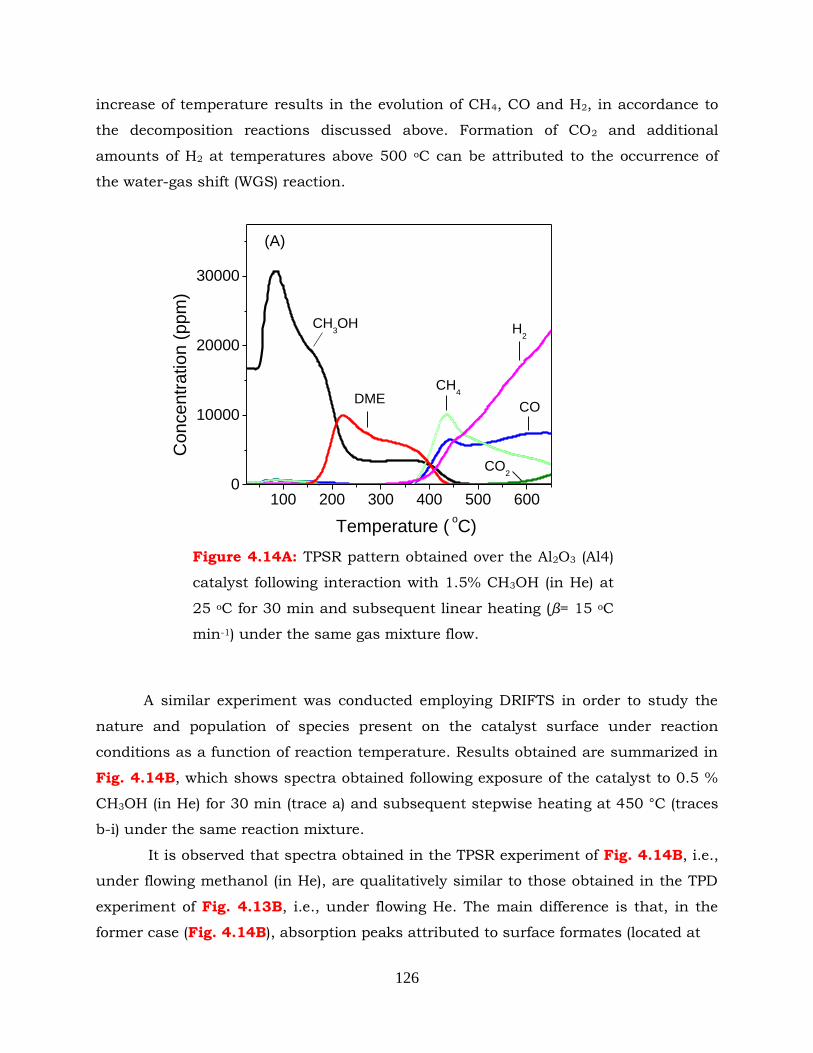
126
increase of temperature results in the evolution of CH4, CO and H2, in accordance to
the decomposition reactions discussed above. Formation of CO2 and additional
amounts of H2 at temperatures above 500 oC can be attributed to the occurrence of
the water-gas shift (WGS) reaction.
A similar experiment was conducted employing DRIFTS in order to study the
nature and population of species present on the catalyst surface under reaction
conditions as a function of reaction temperature. Results obtained are summarized in
Fig. 4.14B, which shows spectra obtained following exposure of the catalyst to 0.5 %
CH3OH (in He) for 30 min (trace a) and subsequent stepwise heating at 450 °C (traces
b-i) under the same reaction mixture.
It is observed that spectra obtained in the TPSR experiment of Fig. 4.14B, i.e.,
under flowing methanol (in He), are qualitatively similar to those obtained in the TPD
experiment of Fig. 4.13B, i.e., under flowing He. The main difference is that, in the
former case (Fig. 4.14B), absorption peaks attributed to surface formates (located at
Figure 4.14A: TPSR pattern obtained over the Al2O3 (Al4)
catalyst following interaction with 1.5% CH3OH (in He) at
25 oC for 30 min and subsequent linear heating (β= 15 oC
min-1) under the same gas mixture flow.
temperatures under He flow.
100 200 300 400 500 6000
10000
20000
30000
H2
CO2
CODME
CH3OH
CH4
Co
nce
ntr
atio
n (
pp
m)
Temperature ( oC)
(A)
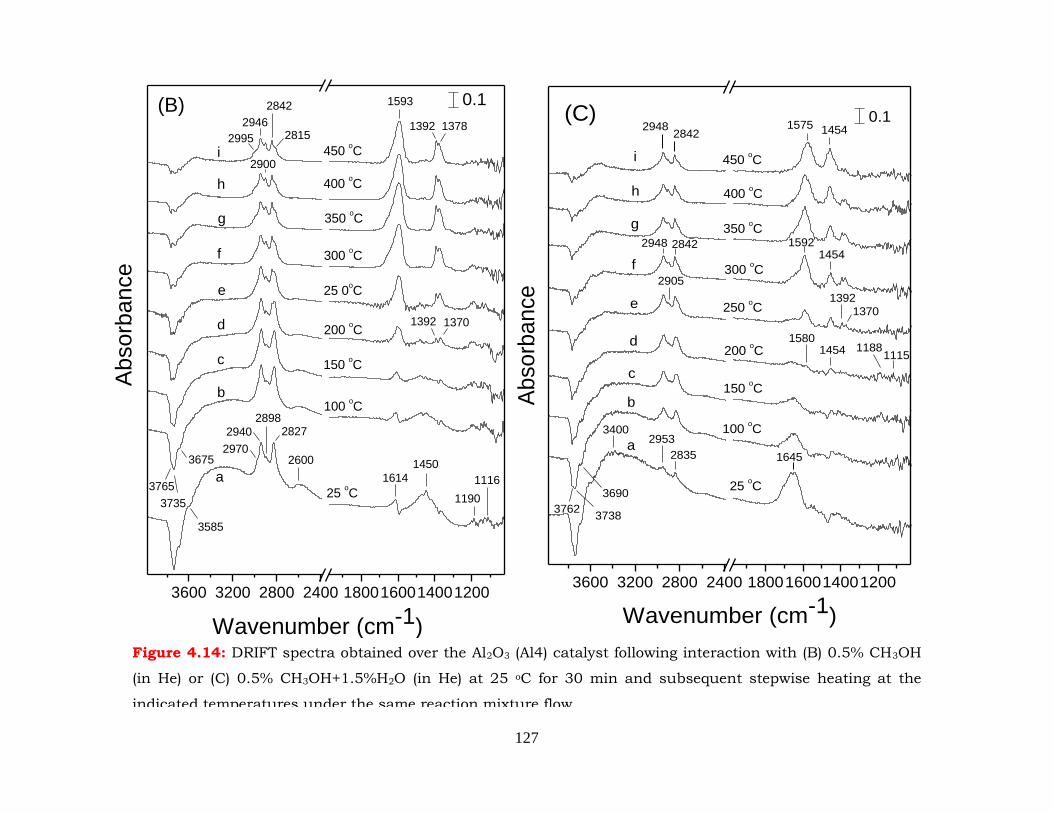
127
3600 3200 2800 2400 1800160014001200
2995 2815
2900
2842
2946
1392 1370
2970
2827
2600
2940
i
h
g
f
e
d
c
b
0.11593
13781392
1190
1450
1614 1116
3675
2898
3585
3765
3735
a
350 oC
450 oC
150 oC
25 oC
(B)
400 oC
300 oC
25 0oC
200 oC
100 oC
Ab
so
rba
nce
Wavenumber (cm-1)
3600 3200 2800 2400 1800160014001200
Abso
rban
ce
14541592
28422948 14541575
1580
11151188
i
1370
450 oC
400 oC
350 oC
300 oC
250 oC
200 oC
150 oC
100 oC
25 oC
28422948
2905
1454
1392
16452835
29533400
37623738
3690
h
g
f
e
d
c
b
a
0.1
Wavenumber (cm-1)
(C)
Figure 4.14: DRIFT spectra obtained over the Al2O3 (Al4) catalyst following interaction with (B) 0.5% CH3OH
(in He) or (C) 0.5% CH3OH+1.5%H2O (in He) at 25 oC for 30 min and subsequent stepwise heating at the
indicated temperatures under the same reaction mixture flow.
128
ca. 2900, 1593, 1392 and 1370 cm-1) appear at lower temperatures, and their relative
intensities are much higher, compared to those obtained under He flow (Fig. 4.13B).
Regarding methoxy species, they behave in a way similar to that discussed in Section
4.5.2. In particular, at temperatures up to ca. 150 °C (traces a-c) the surface is
populated mainly by the weakly adsorbed methoxy groups characterized by a pair of
peaks at 2940/2827 cm-1. At higher temperatures, where production of DME takes
place in the gas phase (Fig. 4.14B), the relative population of this species decreases,
providing additional evidence that it is related to DME formation.
Finally, at temperatures higher than 400 °C (traces h-i) the catalyst surface is
covered mainly by strongly adsorbed methoxy groups (2946/2842 cm-1) and formate
species that, as discussed above, are responsible for the evolution of CH4, H2 and CO
in the gas phase.
The effect of addition of water in the feed has been investigated by DRTIFS-
TPSR using a 0.5%CH3OH+1.5%H2O (in He) mixture and spectra obtained are
presented in Fig. 4.14C.
It is observed that the spectrum recorded at 25 oC (trace a) is characterized
mainly by bands attributed to adsorbed water (compare with Fig. 4.12). The
appearance of two weak bands at 2953 and 2835 cm-1 indicates that only small
amounts of adsorbed methanol/methoxy species are present on the catalyst surface
and shows clearly that adsorption of methanol at room temperature is suppressed
significantly in the presence of water. Stepwise increase of temperature results in a
progressive decrease of the amount of adsorbed water, which diminishes at 200-250
°C (traces d-e), and to a concomitant increase of the coverage of methoxy species,
which reaches a maximum in the same temperature range. This is accompanied by
the appearance of bands attributed to surface formate species, the intensity of which
increases significantly upon further increase of temperature (traces e-i).
It is of interest to note that a couple of new bands located at 1454 and 1575 cm-1
are resolved at 200 °C (trace d) and increase progressively in intensity upon increasing
temperature to 450 °C (traces e-i). These bands, which were not observed in TPD (Fig.
4.13B) and TPSR (Fig. 4.14B) of methanol, can be attributed to carbonate-carboxylate
species [47, 48]. These structures are not intermediate compounds in the dehydration
of methanol but may be responsible for the occurrence of side reactions that lead to
the appearance of H2 and CO in the gas phase.
129
4.7 Conclusions
The activity and selectivity of Al2O3 catalysts for the dehydration of methanol to
dimethyl ether have been investigated over a number of alumina samples of variable
physicochemical characteristics. Results show that catalytic behaviour is determined
by the textural properties, degree of crystallinity and total amount of acid sites of
Al2O3. Below are summarized the general conclusions of the obtained results.
Increase of specific surface area results in a shift of the methanol conversion
curve toward lower reaction temperatures.
Enhanced catalytic activity of high-SSA samples cannot be attributed solely to
the higher amount of surface acid sites (estimated by NH3-TPD) implying that the
reaction rate is determined to a large extent from other parameters, such as textural
properties and degree of crystallinity.
Conversion of methanol at a given temperature is generally higher for materials
with cylindrical pores of an average width of about 9-10 nm, total porosity of 0.60-0.80
cm3g-1 and crystallite size of ca 7-9 nm. Materials with higher porosity and/or smaller
crystallite size are less active, most probably due to their highly amorphous nature.
The apparent activation energy of the reaction is, practically, the same for all
studied catalysts taking an average value of 24±4 kcal mol-1.
Addition of water vapour in the feed does not influence selectivity to reaction
products but results in an increase of the apparent activation energy and in a
(reversible) shift of methanol conversion curve toward higher temperatures.
Results of mechanistic studies indicate that interaction of methanol with the
Al2O3 surface results in the formation of two kinds of methoxy groups of different
adsorption strength. Evidence is provided that DME evolution is associated with
methoxy species that are weakly adsorbed on the Al2O3 surface, whereas more
strongly held species decompose to yield surface formate and, eventually CH4 and CO
in the gas phase.
130
4.8 References
[1] A.R.Keshavarz, M.Rezaei, F.Yaripour, Power Technology 199 (2010) 176-179.
[2] F. Dumeignil, K. Sato, M. Imamura, N. Matsubayashi, E. Payen, H. Shimada, Applied
Catalysis A:General 241 (2003) 319-329.
[3] G. Leofantia, M. Padovan, G. Tozzola, B. Venturelli, Catalysis Today 41 (1998) 207-
219.
[4] J. Aguado, J.M. Escola, M.C. Castro, Microporous and Mesoporous Materials 128 (2010)
48-55.
[5] F. Prinetto, G. Ghiotti, P. Graffin, D. Tichit, Microporous and Mesoporous Materials 39
(2000) 229-247.
[6] D.L. Cocke, E.D. Johnson, R.P. Merrill, Catal. Rev. 26 (1984) 163-231.
[7] F. Arena, R. Dario, A. Parmaliana, Applied Catalysis A:General 170 (1998) 127-137.
[8] A.T. Shakhtakhtinskaya, Z.M. Mamedova, S.F. Mutallibova, S.Z. Alieva,
R.G.Mardzhanova, React. Kinet. Catal. Lett. 39 (1989) 137-140.
[9] D.M. Sung, Y.H. Kim, E.D. Park, J.E. Yie, Res. Chem. Intermed. 36 (2010) 653-660.
[10] J. Khom-in, P. Prasethdam, J. Panpranot, O. Mekasuwandumrong, Catalysis
Communications 9 (2008) 1955-1958.
[11] K. Lertjiamratn, P. Praserthdam, M. Arai, J. Panpranot, Applied Catalysis A:General 378
(2010) 119-123.
[12] M. Mollavali, F. Yaripour, H. Atashi, S. Sahebdelfar, Ind. Eng. Chem. Res. 47 (2008)
3265-3273.
[13] A. Corma, V. Fornes, M.I. Juan-Rajadell, J.M.L. Nieto, Applied Catalysis A:General 116
(1994) 151-163.
[14] S.M. Kim, Y.J. Lee, J.W.Bae, H.S. Potdar, K.W. Jun, Applied Catalysis A:General 348
(2008) 113-120.
[15] E. Kraleva, R. Palcheva, L. Dimitrov, U. Armbruster, A. Brückner, A. Spojakina, J.
Mater. Sci. 46 (2011) 7160-7168.
[16] M. Xu, J.H. Lunsford, D.W. Goodman, A. Bhattacharyya, Applied Catalysis A:General
149 (1997) 289-301.
[17] M. Mollavali, F. Yaripour, S. Mohammadi-Jam, H. Atashi, Fuel Processing Technology
90 (2009) 1093-1098.
[18] T. Takeguchi, K.-I. Yanagisawa, T. Inui, M. Inoue, Applied Catalysis A:General 192
(2000) 201-209.
[19] L. Wang, Y. Qi, Y. Wei, D. Fang, S. Meng, Z. Liu, Catalysis Letters 106 (2006) 61-66.
[20] J.J. Spivey, Chemical Engineering Communications 110 (1991) 123-142.
[21] Q. Tang, H. Xu, Y. Zheng, J. Wang, H. Li, J. Zhang, Applied Catalysis A:General 413-
414 (2012) 36-42.
[22] M. Raimondo, A.D. Stefanis, G. Perez, A.A.G. Tomlinson, Applied Catalysis A:General
171 (1998) 85-97.
[23] U.V. Mentzel, K.T. Hojholt, M.S. Holm, R. Fehrmann, P. Beato, Applied Catalysis
A:General 417-418 (2012) 290-297.
[24] K.C. Tokay, T. Dogua, G. Dogu, Chemical Engineering Communications 184 (2012)
278-285.
[25] Y. Fu, T. Hong, J. Chen, A. Auroux, J. Shen, Thermochimica Acta 434 (2005) 22-26.
[26] V. Vishwanathan, H.-S. Roh, J.-W. Kim, K.-W. Jun, Catalysis Letters 96 (2004) 23-28.
131
[27] J. Toyir, P.R.d.l. Piscina, J.L.G. Fierro, N. Homs, Applied Catalysis B 34 (2001) 255-
266.
[28] L. Vlaev, D. Damyanov, M.M. Mohamed, Colloids and Surfaces 36 (1989) 427-437.
[29] J. Szanyi, J.H. Kwak, R.J. Chimentao, C.H.F. Peden, J. Phys. Chem. C 111 (2007) 2661-
2669.
[30] H. Knozinger, P. Ratnasamy, Catal. Rev.-Sci. Eng. 17 (1978) 31-70.
[31] S.U. Rege, R.T. Yang, Chemical Engineering Science 56 (2001) 3781-3796.
[32] G. Busca, V. Lorenzelli, Journal of Catalysis 66 (1980) 155-161.
[33] G. Busca, Catalysis Today 27 (1996) 457-496.
[34] G. Busca, P.F. Rossi, V. Lorenzelli, M. Benaissa, J. Travert, J.-C. Lavalley, Journal of
Physical Chemistry 89 (1985) 5433-5439.
[35] A.R. McInroy, D.T. Lundie, J.M. Winfield, C.C. Dudman, P. Jones, D. Lennon,
Langmuir 21 (2005) 11092-11098.
[36] A.R. McInroy, D.T. Lundie, J.M. Winfield, C.C. Dudman, P. Jones, S.F. Parker, J.W.
Taylor, D. Lennon, Phys. Chem. Chem. Phys. 7 (2005) 3093-3101.
[37] S. Tamm, H.H. Ingelsten, M. Skoglundh, A.E.C. Palmqvist, Journal of Catalysis 276
(2010) 402-411.
[38] D.T. Lundie, A.R. McInroy, R. Marshall, J.M. Winfield, P. Jones, C.C. Dudman, S.F.
Parker, C. Mitchell, D. Lennon, J. Phys. Chem. B 109 (2005) 11592-11601.
[39] B.G. Frederick, G. Apai, T.N. Rhodin, Surface Science 277 (1992) 337-350.
[40] S. Bertarione, D. Scarano, A. Zecchina, V. Johanek, J. Hoffmann, S. Schauermann, J.
Libuda, G. Rupprechter, H.-J. Freund, Journal of Catalysis 223 (2004) 64-73.
[41] J.G. Chen, P. Basu, T.H. Ballinger, J.T.Y. Jr, Langmuir 5 (1989) 352-356.
[42] R.S. Schiffino, R.P. Merrill, Journal of Physical Chemistry 97 (1993) 6425-6435.
[43] S. Schauermann, J. Hoffmann, V. Johanek, J. Hartmann, J. Libuda, Phys . Chem. Chem.
Phys. 4 (2002) 3909-3918.
[44] E. Ozensoy, D. Herling, J. Szanyi, Catalysis Today 136 (2008) 46-54.
[45] V.A. Matyshak, T.I. Khomenko, G.I. Lin, I.N. Zavalishin, A.Y. Rozovskii, Kinet. Catal.
40 (1999) 274-295.
[46] G. Busca, J. Lamotte, J.-C. Lavalley, V. Lorenzelli, J. Am. Chem. Soc. 109 (1987) 5197-
5202.
[47] L.I. Lafer, V.I. Yakerson, A.M. Rubinshtein, Russian Chemical Bulletin 16 (1967) 2312-
2318.
[48] M.C. Sanchez-Sanchez, R.M.N. Yerga, D.I. Kondarides, X.E. Verykios, J.L.G. Fierro,
Journal of Physical Chemistry A 114 (2010) 3873-3882.
132
CHAPTER 5
METHANOL DEHYDRATION TO DIMETHYL
ETHER OVER ZEOLITES
In the present chapter, dehydration of methanol to DME is investigated over a
set of thirteen zeolite catalysts, including MFI (ZSM-5 and silicalite), faujasite (Y and
USY), Beta, Mordenite and Ferrierite zeolites. For comparison purposes, one γ-Al2O3
and two amorphous silica-alumina (ASA) catalysts are also tested. The chapter starts
with a short introduction part related to the properties of zeolites with emphasis given
on the characteristics of the materials investigated in the present study.
The materials have been characterized with respect to their textural properties
(B.E.T. and B.J.H. methods), acidity (TPD of ammonia and FTIR spectroscopy coupled
with in situ sorption of pyridine), chemical composition (ICP-AES), crystallinity and
morphology (XRD). Catalytic activity and selectivity for the title reaction have been
evaluated in the temperature range of 130-400oC, at atmospheric pressure, in the
absence and in the presence of water in the feed at a total flow rate of 30 cm3 min-1
(W/F=0.003 g/cm3 min-1). Kinetic measurements were performed in separate
experiments under differential reaction conditions.
5.1 Introduction
About 250 years ago a new family of minerals have been discovered and named as
zeolites from the Greek words "zeo" (to boil) and "lithos" (stone). Approximately 40
zeolite minerals are found in nature and, currently, 600 zeolite materials are known
and new ones are discovered every year. Each zeolitic structure is denoted with the
use of a three-letter code. For example FAU stands for faujasites, MFI for ZSM-5 and
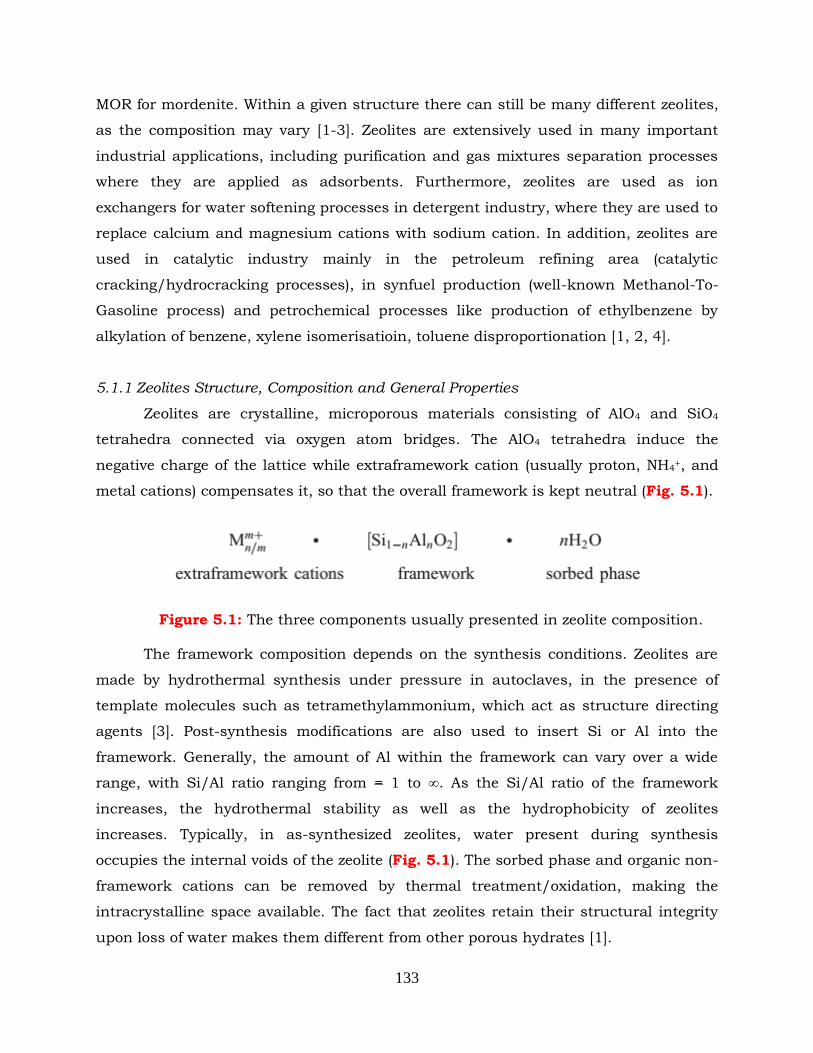
133
MOR for mordenite. Within a given structure there can still be many different zeolites,
as the composition may vary [1-3]. Zeolites are extensively used in many important
industrial applications, including purification and gas mixtures separation processes
where they are applied as adsorbents. Furthermore, zeolites are used as ion
exchangers for water softening processes in detergent industry, where they are used to
replace calcium and magnesium cations with sodium cation. In addition, zeolites are
used in catalytic industry mainly in the petroleum refining area (catalytic
cracking/hydrocracking processes), in synfuel production (well-known Methanol-To-
Gasoline process) and petrochemical processes like production of ethylbenzene by
alkylation of benzene, xylene isomerisatioin, toluene disproportionation [1, 2, 4].
5.1.1 Zeolites Structure, Composition and General Properties
Zeolites are crystalline, microporous materials consisting of AlO4 and SiO4
tetrahedra connected via oxygen atom bridges. The AlO4 tetrahedra induce the
negative charge of the lattice while extraframework cation (usually proton, NH4+, and
metal cations) compensates it, so that the overall framework is kept neutral (Fig. 5.1).
Figure 5.1: The three components usually presented in zeolite composition. The framework composition depends on the synthesis conditions. Zeolites are
made by hydrothermal synthesis under pressure in autoclaves, in the presence of
template molecules such as tetramethylammonium, which act as structure directing
agents [3]. Post-synthesis modifications are also used to insert Si or Al into the
framework. Generally, the amount of Al within the framework can vary over a wide
range, with Si/Al ratio ranging from = 1 to ∞. As the Si/Al ratio of the framework
increases, the hydrothermal stability as well as the hydrophobicity of zeolites
increases. Typically, in as-synthesized zeolites, water present during synthesis
occupies the internal voids of the zeolite (Fig. 5.1). The sorbed phase and organic non-
framework cations can be removed by thermal treatment/oxidation, making the
intracrystalline space available. The fact that zeolites retain their structural integrity
upon loss of water makes them different from other porous hydrates [1].
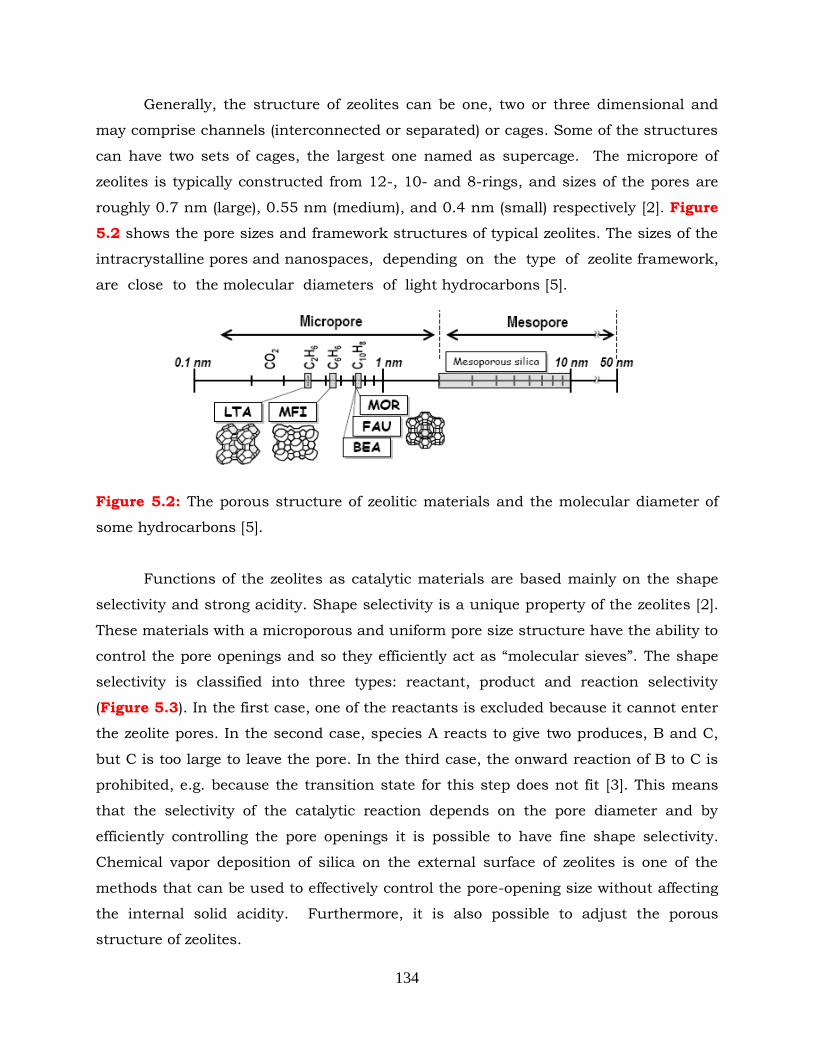
134
Generally, the structure of zeolites can be one, two or three dimensional and
may comprise channels (interconnected or separated) or cages. Some of the structures
can have two sets of cages, the largest one named as supercage. The micropore of
zeolites is typically constructed from 12-, 10- and 8-rings, and sizes of the pores are
roughly 0.7 nm (large), 0.55 nm (medium), and 0.4 nm (small) respectively [2]. Figure
5.2 shows the pore sizes and framework structures of typical zeolites. The sizes of the
intracrystalline pores and nanospaces, depending on the type of zeolite framework,
are close to the molecular diameters of light hydrocarbons [5].
Figure 5.2: The porous structure of zeolitic materials and the molecular diameter of
some hydrocarbons [5].
Functions of the zeolites as catalytic materials are based mainly on the shape
selectivity and strong acidity. Shape selectivity is a unique property of the zeolites [2].
These materials with a microporous and uniform pore size structure have the ability to
control the pore openings and so they efficiently act as “molecular sieves”. The shape
selectivity is classified into three types: reactant, product and reaction selectivity
(Figure 5.3). In the first case, one of the reactants is excluded because it cannot enter
the zeolite pores. In the second case, species A reacts to give two produces, B and C,
but C is too large to leave the pore. In the third case, the onward reaction of B to C is
prohibited, e.g. because the transition state for this step does not fit [3]. This means
that the selectivity of the catalytic reaction depends on the pore diameter and by
efficiently controlling the pore openings it is possible to have fine shape selectivity.
Chemical vapor deposition of silica on the external surface of zeolites is one of the
methods that can be used to effectively control the pore-opening size without affecting
the internal solid acidity. Furthermore, it is also possible to adjust the porous
structure of zeolites.
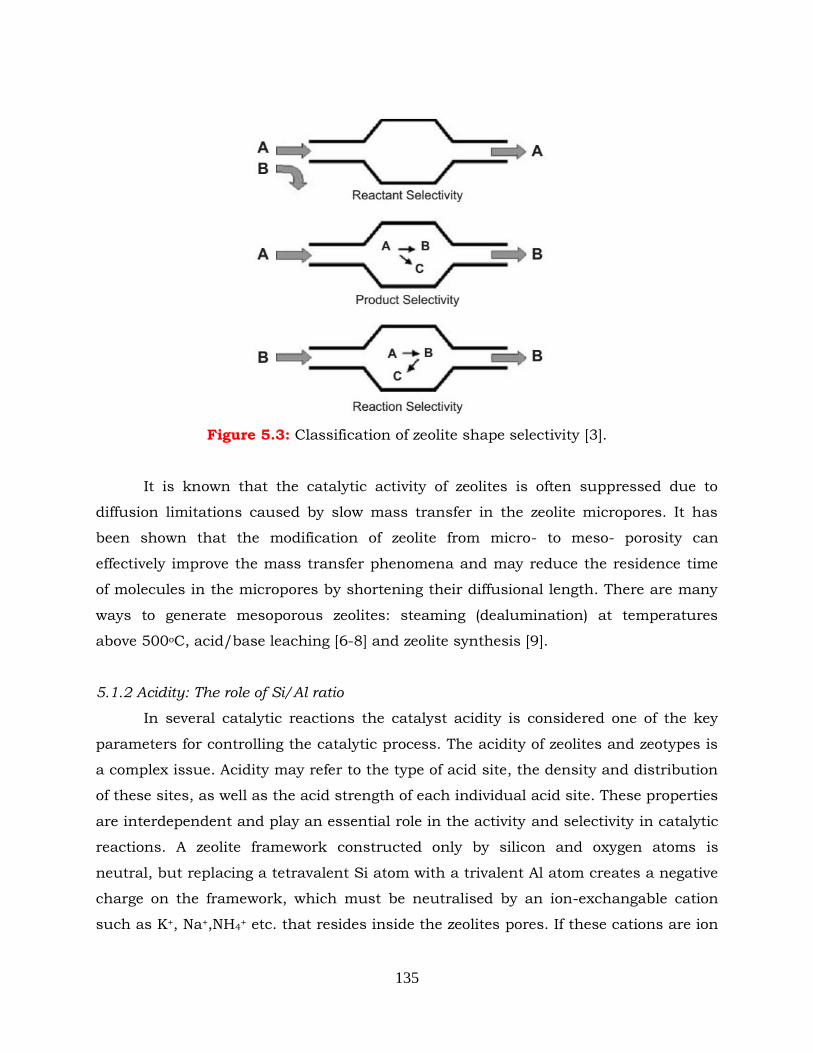
135
Figure 5.3: Classification of zeolite shape selectivity [3].
It is known that the catalytic activity of zeolites is often suppressed due to
diffusion limitations caused by slow mass transfer in the zeolite micropores. It has
been shown that the modification of zeolite from micro- to meso- porosity can
effectively improve the mass transfer phenomena and may reduce the residence time
of molecules in the micropores by shortening their diffusional length. There are many
ways to generate mesoporous zeolites: steaming (dealumination) at temperatures
above 500oC, acid/base leaching [6-8] and zeolite synthesis [9].
5.1.2 Acidity: The role of Si/Al ratio
In several catalytic reactions the catalyst acidity is considered one of the key
parameters for controlling the catalytic process. The acidity of zeolites and zeotypes is
a complex issue. Acidity may refer to the type of acid site, the density and distribution
of these sites, as well as the acid strength of each individual acid site. These properties
are interdependent and play an essential role in the activity and selectivity in catalytic
reactions. A zeolite framework constructed only by silicon and oxygen atoms is
neutral, but replacing a tetravalent Si atom with a trivalent Al atom creates a negative
charge on the framework, which must be neutralised by an ion-exchangable cation
such as K+, Na+,NH4+ etc. that resides inside the zeolites pores. If these cations are ion
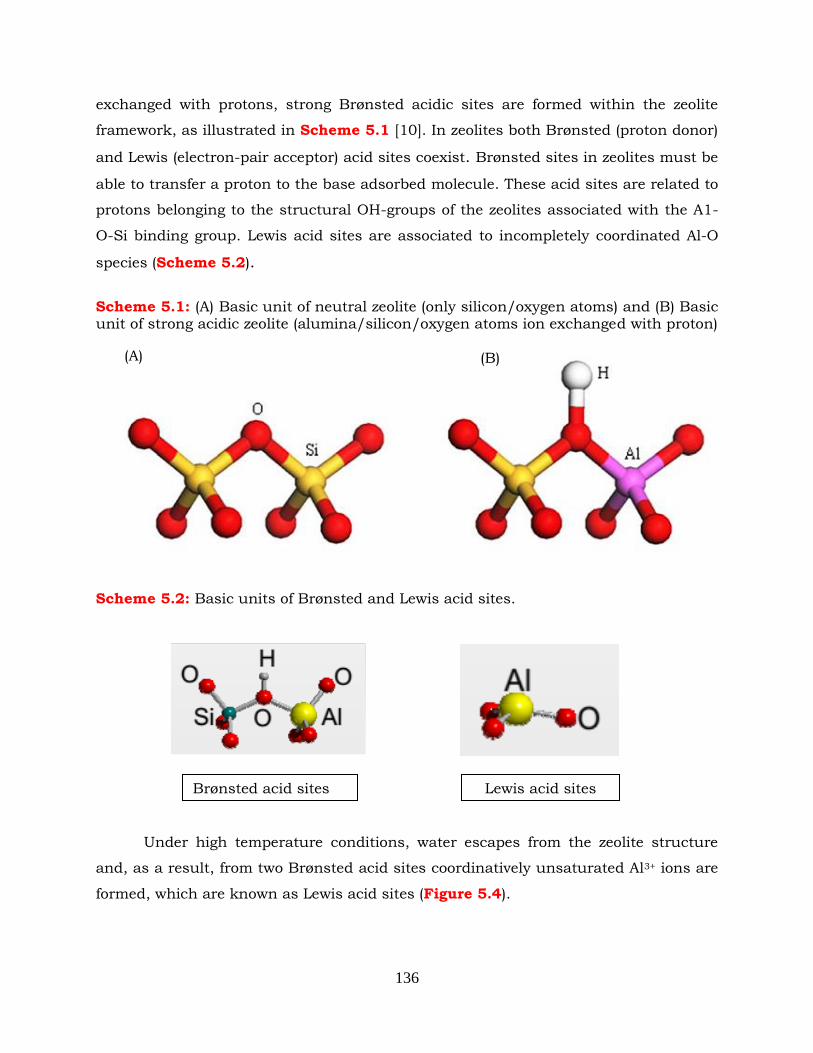
136
exchanged with protons, strong Brønsted acidic sites are formed within the zeolite
framework, as illustrated in Scheme 5.1 [10]. In zeolites both Brønsted (proton donor)
and Lewis (electron-pair acceptor) acid sites coexist. Brønsted sites in zeolites must be
able to transfer a proton to the base adsorbed molecule. These acid sites are related to
protons belonging to the structural OH-groups of the zeolites associated with the A1-
O-Si binding group. Lewis acid sites are associated to incompletely coordinated Al-O
species (Scheme 5.2).
Scheme 5.1: (A) Basic unit of neutral zeolite (only silicon/oxygen atoms) and (B) Basic unit of strong acidic zeolite (alumina/silicon/oxygen atoms ion exchanged with proton)
Scheme 5.2: Basic units of Brønsted and Lewis acid sites.
Under high temperature conditions, water escapes from the zeolite structure
and, as a result, from two Brønsted acid sites coordinatively unsaturated Al3+ ions are
formed, which are known as Lewis acid sites (Figure 5.4).
Brønsted acid sites Lewis acid sites
(A) (B)
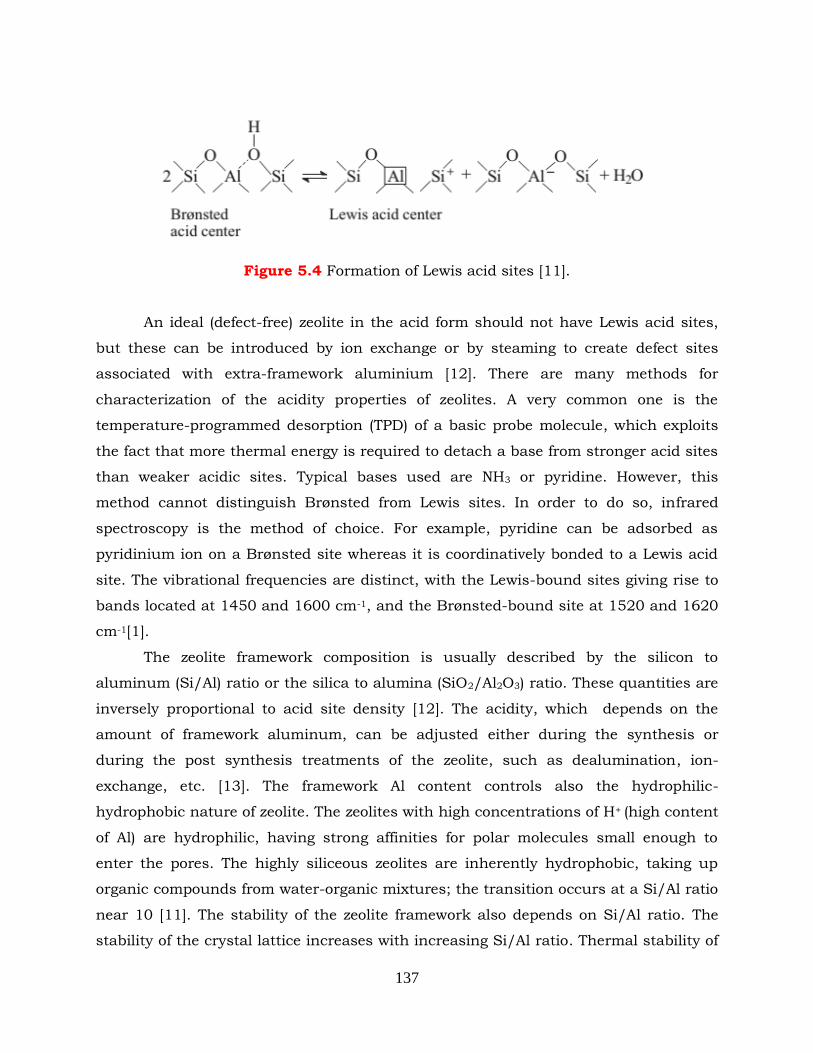
137
Figure 5.4 Formation of Lewis acid sites [11].
An ideal (defect-free) zeolite in the acid form should not have Lewis acid sites,
but these can be introduced by ion exchange or by steaming to create defect sites
associated with extra-framework aluminium [12]. There are many methods for
characterization of the acidity properties of zeolites. A very common one is the
temperature-programmed desorption (TPD) of a basic probe molecule, which exploits
the fact that more thermal energy is required to detach a base from stronger acid sites
than weaker acidic sites. Typical bases used are NH3 or pyridine. However, this
method cannot distinguish Brønsted from Lewis sites. In order to do so, infrared
spectroscopy is the method of choice. For example, pyridine can be adsorbed as
pyridinium ion on a Brønsted site whereas it is coordinatively bonded to a Lewis acid
site. The vibrational frequencies are distinct, with the Lewis-bound sites giving rise to
bands located at 1450 and 1600 cm-1, and the Brønsted-bound site at 1520 and 1620
cm-1[1].
The zeolite framework composition is usually described by the silicon to
aluminum (Si/Al) ratio or the silica to alumina (SiO2/Al2O3) ratio. These quantities are
inversely proportional to acid site density [12]. The acidity, which depends on the
amount of framework aluminum, can be adjusted either during the synthesis or
during the post synthesis treatments of the zeolite, such as dealumination, ion-
exchange, etc. [13]. The framework Al content controls also the hydrophilic-
hydrophobic nature of zeolite. The zeolites with high concentrations of H+ (high content
of Al) are hydrophilic, having strong affinities for polar molecules small enough to
enter the pores. The highly siliceous zeolites are inherently hydrophobic, taking up
organic compounds from water-organic mixtures; the transition occurs at a Si/Al ratio
near 10 [11]. The stability of the zeolite framework also depends on Si/Al ratio. The
stability of the crystal lattice increases with increasing Si/Al ratio. Thermal stability of
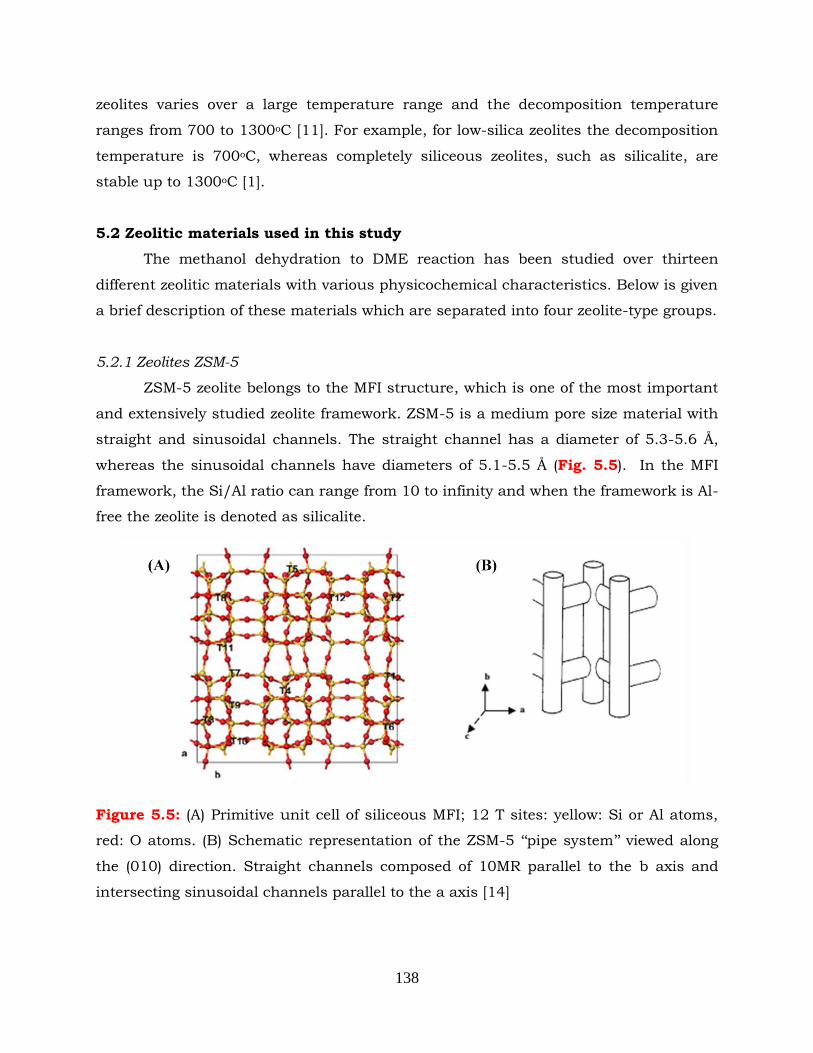
138
zeolites varies over a large temperature range and the decomposition temperature
ranges from 700 to 1300oC [11]. For example, for low-silica zeolites the decomposition
temperature is 700oC, whereas completely siliceous zeolites, such as silicalite, are
stable up to 1300oC [1].
5.2 Zeolitic materials used in this study
The methanol dehydration to DME reaction has been studied over thirteen
different zeolitic materials with various physicochemical characteristics. Below is given
a brief description of these materials which are separated into four zeolite-type groups.
5.2.1 Zeolites ZSM-5
ZSM-5 zeolite belongs to the MFI structure, which is one of the most important
and extensively studied zeolite framework. ZSM-5 is a medium pore size material with
straight and sinusoidal channels. The straight channel has a diameter of 5.3-5.6 Å,
whereas the sinusoidal channels have diameters of 5.1-5.5 Å (Fig. 5.5). In the MFI
framework, the Si/Al ratio can range from 10 to infinity and when the framework is Al-
free the zeolite is denoted as silicalite.
Figure 5.5: (A) Primitive unit cell of siliceous MFI; 12 T sites: yellow: Si or Al atoms,
red: O atoms. (B) Schematic representation of the ZSM-5 „„pipe system‟‟ viewed along
the (010) direction. Straight channels composed of 10MR parallel to the b axis and
intersecting sinusoidal channels parallel to the a axis [14]
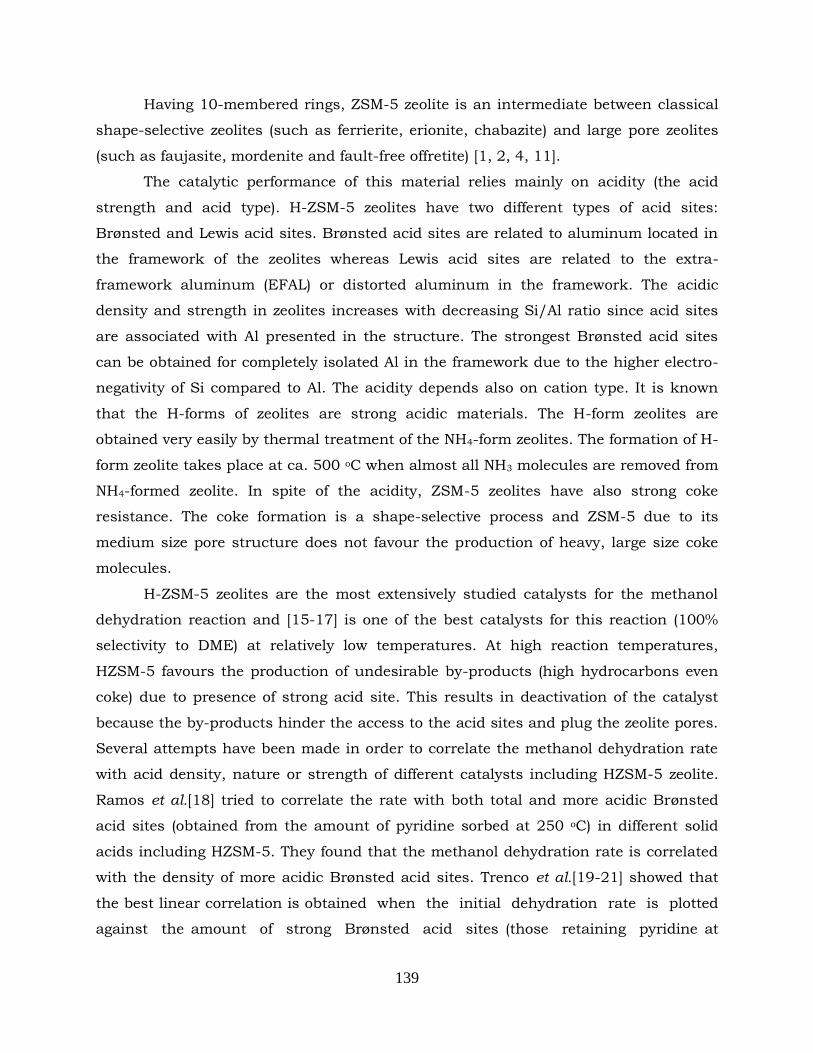
139
Having 10-membered rings, ZSM-5 zeolite is an intermediate between classical
shape-selective zeolites (such as ferrierite, erionite, chabazite) and large pore zeolites
(such as faujasite, mordenite and fault-free offretite) [1, 2, 4, 11].
The catalytic performance of this material relies mainly on acidity (the acid
strength and acid type). H-ZSM-5 zeolites have two different types of acid sites:
Brønsted and Lewis acid sites. Brønsted acid sites are related to aluminum located in
the framework of the zeolites whereas Lewis acid sites are related to the extra-
framework aluminum (EFAL) or distorted aluminum in the framework. The acidic
density and strength in zeolites increases with decreasing Si/Al ratio since acid sites
are associated with Al presented in the structure. The strongest Brønsted acid sites
can be obtained for completely isolated Al in the framework due to the higher electro-
negativity of Si compared to Al. The acidity depends also on cation type. It is known
that the H-forms of zeolites are strong acidic materials. The H-form zeolites are
obtained very easily by thermal treatment of the NH4-form zeolites. The formation of H-
form zeolite takes place at ca. 500 oC when almost all NH3 molecules are removed from
NH4-formed zeolite. In spite of the acidity, ZSM-5 zeolites have also strong coke
resistance. The coke formation is a shape-selective process and ZSM-5 due to its
medium size pore structure does not favour the production of heavy, large size coke
molecules.
H-ZSM-5 zeolites are the most extensively studied catalysts for the methanol
dehydration reaction and [15-17] is one of the best catalysts for this reaction (100%
selectivity to DME) at relatively low temperatures. At high reaction temperatures,
HZSM-5 favours the production of undesirable by-products (high hydrocarbons even
coke) due to presence of strong acid site. This results in deactivation of the catalyst
because the by-products hinder the access to the acid sites and plug the zeolite pores.
Several attempts have been made in order to correlate the methanol dehydration rate
with acid density, nature or strength of different catalysts including HZSM-5 zeolite.
Ramos et al.[18] tried to correlate the rate with both total and more acidic Brønsted
acid sites (obtained from the amount of pyridine sorbed at 250 oC) in different solid
acids including HZSM-5. They found that the methanol dehydration rate is correlated
with the density of more acidic Brønsted acid sites. Trenco et al.[19-21] showed that
the best linear correlation is obtained when the initial dehydration rate is plotted
against the amount of strong Brønsted acid sites (those retaining pyridine at
140
400◦C). They also reported that no such linear correlation is obtained when the
initial rates are plotted against the total (Brønsted + Lewis) amount of acid
sites (estimated from the NH3 uptakes) or the density of Brønsted acid sites
measured by FTIR-pyridine after desorbing the base at 250◦C [20]. The authors
stated that, the methanol dehydration activity (in the absence of deactivation
phenomena) in the studied zeolites is dictated by the density of strong
Brønsted acid sites rather than by the pore topology [20]. Kim et al. [22]
concluded that the solid acid catalysts with high acid strength show the highest
activity for methanol dehydration and that the γ-sites (peak observed at 500oC in NH3-
TPD spectra) in ZSM-5 catalysts are responsible for this reaction. On the contrary the
relatively weak acid sites appearing below 450◦ C in the NH3-TPD spectra are not
important for dehydration of methanol to DME. On the other hand, based on the
pyridine adsorption IR results, Mao et al.[23] concluded that there is no direct
relationship between the activity for methanol dehydration and the nature of acid sites
on HZSM-5 zeolites. Similarly, Laugel et al. [15] could not establish any clear
relationship between the concentration of Brønsted acid sites and the catalytic
activity of the different catalysts. In spite of the above findings, most researchers have
claimed that the reaction takes place on all kinds of acid sites. The acid sites with
weak or intermediate strength are responsible for the selective DME formation,
whereas, the strong acid sites may further convert DME to light olefins that finally
cause coke deposition and deactivation of catalyst [24-26].
In this study three ZSM-5 zeolites with different Si/Al ratio (provided by Zeolyst)
were tested: CBV 2314 (Si/Al = 11.5), CBV 5524G (Si/Al = 25), CBV 8014 (Si/Al = 40).
All the commercial samples were provided in ammonium form and were converted to
proton form via calcination at 500oC for 2 hrs in air flow. A Silicalite zeolite (provide by
Union Carbide) with Si/Al > 1000 was also used.
5.2.2 Zeolites Y
Zeolite Y (also zeolite X) exhibits the FAU (faujasite) structure and it is one of
the most widely used catalyst in industrial processes (isomerisation, cracking,
hydrocracking of petroleum products) [13]. In 1962, these zeolites were for the first
time used as catalysts and the results obtained brought a huge revolution in
petrochemical industry due to significant improvement of the existing processes [27].
141
The thermal stability of zeolite Y in these industrial processes is an important
parameter as the temperature can range from 700 to 900 oC. In 1967, in addition to
already investigated methods for stabilization of these zeolites, a new route has been
reported for the synthesis of thermally stable Y(FAU) zeolite by McDaniel and Maher.
The new highly stable form of Y was named “ultrastable Y (USY)” [4]. As shown in
Figure 5.6 the FAU framework structure consists of a double 6 ring (D6R hexagonal
prism), cages (inside diameter 7 Å) adjacent to hexagonal prism and supercages (inside
diameter 13 Å) placed among the cages [1, 11].
Figure 5.6: (A) Primitive unit cell of FAU zeolite. Due to the high symmetry only one T
site (yellow, T = Si or Al) and four inequivalent oxygen atoms (red, O).The ball and
stick model highlights the hexagonal prism and (B) Schematic representation of the
Faujasite structure FAU zeolite The corners denote the position of T sites (T = Si or Al)
and the lines the bridging oxygen atoms. Different cation positions are indicated by
Roman numerals whereas oxygen positions are indicated by Arabic numerals. Four
different positions of the protons covalently bound to the oxygen around an Al atom
[14].
The FAU structure resembles the diamond structure if we consider that the
sodalite cages are the carbon atoms and the double 6-rings are C-C bonds [28, 29].
This group of zeolites has the biggest channels and supercages, which permit access
to quite large molecules, making this structure applicable in catalytic processes.
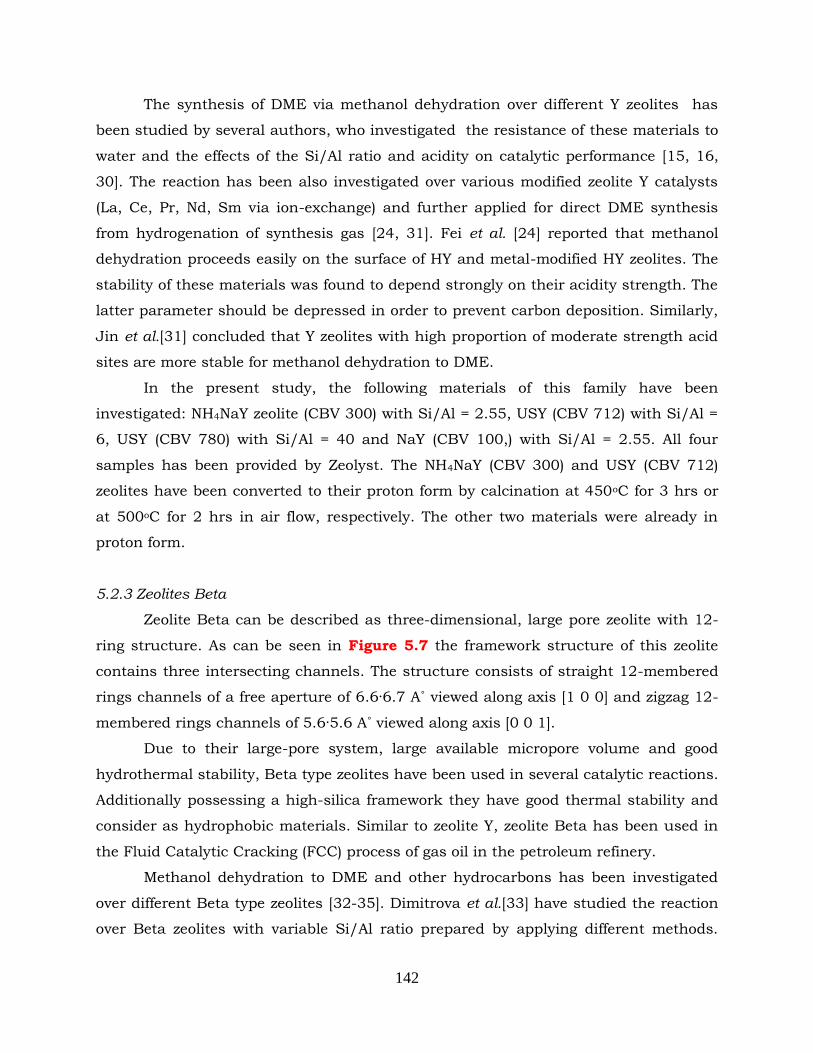
142
The synthesis of DME via methanol dehydration over different Y zeolites has
been studied by several authors, who investigated the resistance of these materials to
water and the effects of the Si/Al ratio and acidity on catalytic performance [15, 16,
30]. The reaction has been also investigated over various modified zeolite Y catalysts
(La, Ce, Pr, Nd, Sm via ion-exchange) and further applied for direct DME synthesis
from hydrogenation of synthesis gas [24, 31]. Fei et al. [24] reported that methanol
dehydration proceeds easily on the surface of HY and metal-modified HY zeolites. The
stability of these materials was found to depend strongly on their acidity strength. The
latter parameter should be depressed in order to prevent carbon deposition. Similarly,
Jin et al.[31] concluded that Y zeolites with high proportion of moderate strength acid
sites are more stable for methanol dehydration to DME.
In the present study, the following materials of this family have been
investigated: NH4NaY zeolite (CBV 300) with Si/Al = 2.55, USY (CBV 712) with Si/Al =
6, USY (CBV 780) with Si/Al = 40 and NaY (CBV 100,) with Si/Al = 2.55. All four
samples has been provided by Zeolyst. The NH4NaY (CBV 300) and USY (CBV 712)
zeolites have been converted to their proton form by calcination at 450oC for 3 hrs or
at 500oC for 2 hrs in air flow, respectively. The other two materials were already in
proton form.
5.2.3 Zeolites Beta
Zeolite Beta can be described as three-dimensional, large pore zeolite with 12-
ring structure. As can be seen in Figure 5.7 the framework structure of this zeolite
contains three intersecting channels. The structure consists of straight 12-membered
rings channels of a free aperture of 6.6·6.7 A˚ viewed along axis [1 0 0] and zigzag 12-
membered rings channels of 5.6·5.6 A˚ viewed along axis [0 0 1].
Due to their large-pore system, large available micropore volume and good
hydrothermal stability, Beta type zeolites have been used in several catalytic reactions.
Additionally possessing a high-silica framework they have good thermal stability and
consider as hydrophobic materials. Similar to zeolite Y, zeolite Beta has been used in
the Fluid Catalytic Cracking (FCC) process of gas oil in the petroleum refinery.
Methanol dehydration to DME and other hydrocarbons has been investigated
over different Beta type zeolites [32-35]. Dimitrova et al.[33] have studied the reaction
over Beta zeolites with variable Si/Al ratio prepared by applying different methods.
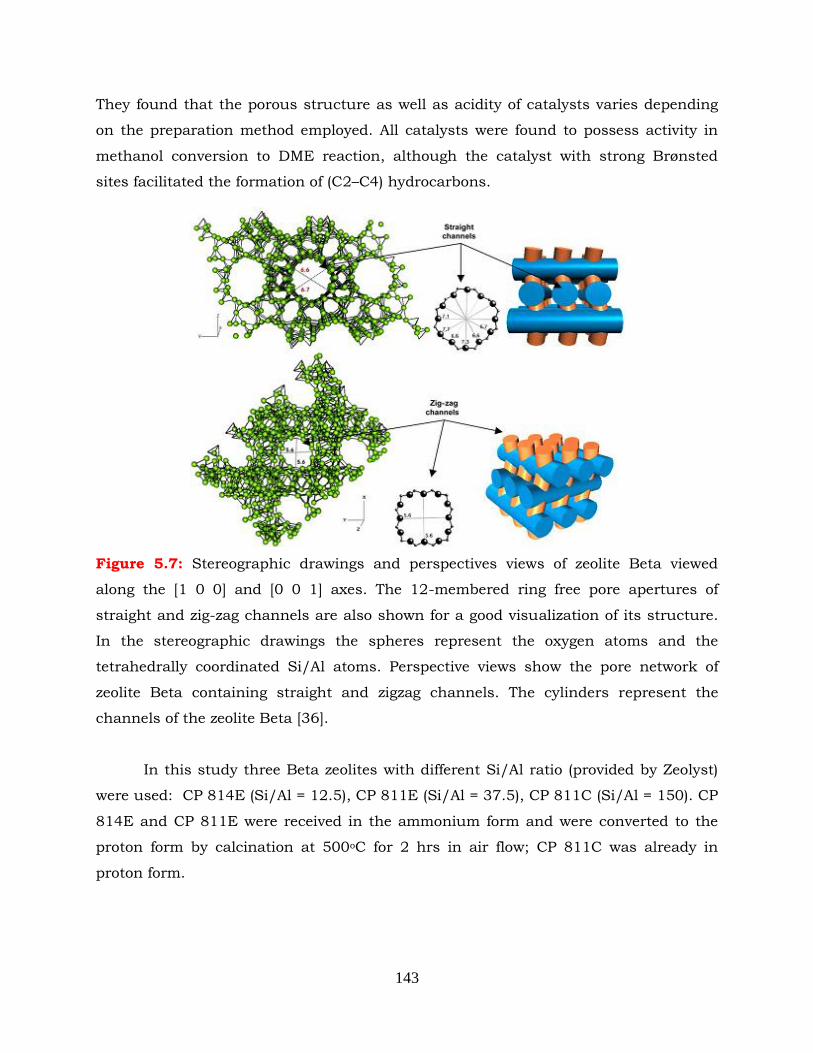
143
They found that the porous structure as well as acidity of catalysts varies depending
on the preparation method employed. All catalysts were found to possess activity in
methanol conversion to DME reaction, although the catalyst with strong Brønsted
sites facilitated the formation of (C2–C4) hydrocarbons.
Figure 5.7: Stereographic drawings and perspectives views of zeolite Beta viewed
along the [1 0 0] and [0 0 1] axes. The 12-membered ring free pore apertures of
straight and zig-zag channels are also shown for a good visualization of its structure.
In the stereographic drawings the spheres represent the oxygen atoms and the
tetrahedrally coordinated Si/Al atoms. Perspective views show the pore network of
zeolite Beta containing straight and zigzag channels. The cylinders represent the
channels of the zeolite Beta [36].
In this study three Beta zeolites with different Si/Al ratio (provided by Zeolyst)
were used: CP 814E (Si/Al = 12.5), CP 811E (Si/Al = 37.5), CP 811C (Si/Al = 150). CP
814E and CP 811E were received in the ammonium form and were converted to the
proton form by calcination at 500oC for 2 hrs in air flow; CP 811C was already in
proton form.
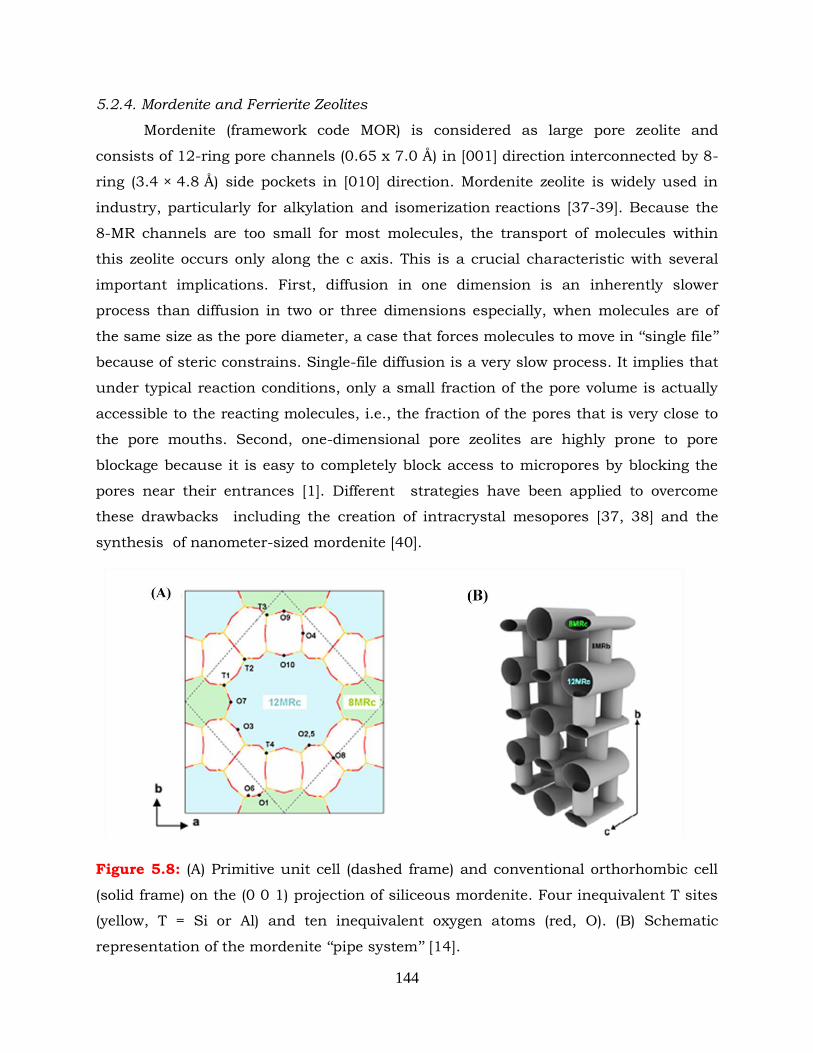
144
5.2.4. Mordenite and Ferrierite Zeolites
Mordenite (framework code MOR) is considered as large pore zeolite and
consists of 12-ring pore channels (0.65 x 7.0 Å) in [001] direction interconnected by 8-
ring (3.4 × 4.8 Å) side pockets in [010] direction. Mordenite zeolite is widely used in
industry, particularly for alkylation and isomerization reactions [37-39]. Because the
8-MR channels are too small for most molecules, the transport of molecules within
this zeolite occurs only along the c axis. This is a crucial characteristic with several
important implications. First, diffusion in one dimension is an inherently slower
process than diffusion in two or three dimensions especially, when molecules are of
the same size as the pore diameter, a case that forces molecules to move in „„single file‟‟
because of steric constrains. Single-file diffusion is a very slow process. It implies that
under typical reaction conditions, only a small fraction of the pore volume is actually
accessible to the reacting molecules, i.e., the fraction of the pores that is very close to
the pore mouths. Second, one-dimensional pore zeolites are highly prone to pore
blockage because it is easy to completely block access to micropores by blocking the
pores near their entrances [1]. Different strategies have been applied to overcome
these drawbacks including the creation of intracrystal mesopores [37, 38] and the
synthesis of nanometer-sized mordenite [40].
Figure 5.8: (A) Primitive unit cell (dashed frame) and conventional orthorhombic cell
(solid frame) on the (0 0 1) projection of siliceous mordenite. Four inequivalent T sites
(yellow, T = Si or Al) and ten inequivalent oxygen atoms (red, O). (B) Schematic
representation of the mordenite „„pipe system‟‟ [14].
145
Ferrierite (FER) is a medium-pore zeolite, possessing a two-dimensional
network consisting of 10-ring channels (4.3×5.5 Å) in the [0 0 1] direction
perpendicularly intersected with 8-MR channels (3.4×5.5 Å) in the [0 1 0] direction [2,
13]. In Figure 5.9 is shown the structure of this zeolite in two directions. Due to its
excellent stability toward thermal, hydrothermal as well as chemical treatments this
material attracted significant attention in industrial applications.
MOR zeolite has been used for the methanol conversion to DME reaction [41,
42] more frequently than FER zeolite. On the other hand, FER zeolite has been used
in direct DME production from synthesis gas [43-45]. A range of different MOR
catalysts have been investigated for methanol dehydration to DME [46]. Results
obtained showed that catalysts with high surface area and medium acid strength
(high Si/Al ratio) exhibit highest catalytic activity, selectivity and long term stability.
N. Khadan et al.[41] have investigated the methanol conversion to DME over five
different types of zeolites (Y, Mordenite, Beta, ZSM-5, Ferrierite). They concluded that
methanol conversion and selectivity toward DME are reduced as the Si/Al ratio is
increased. The methanol conversion depends on the amount of catalyst acidity
whereas DME selectivity and catalyst stability depend on the strength of acidic sites.
Figure 5.9: Structure of ferrierite in the [0 0 1] and [0 1 0] directions. The openings of
the 10-MR and 8-MR pores are colored [47].
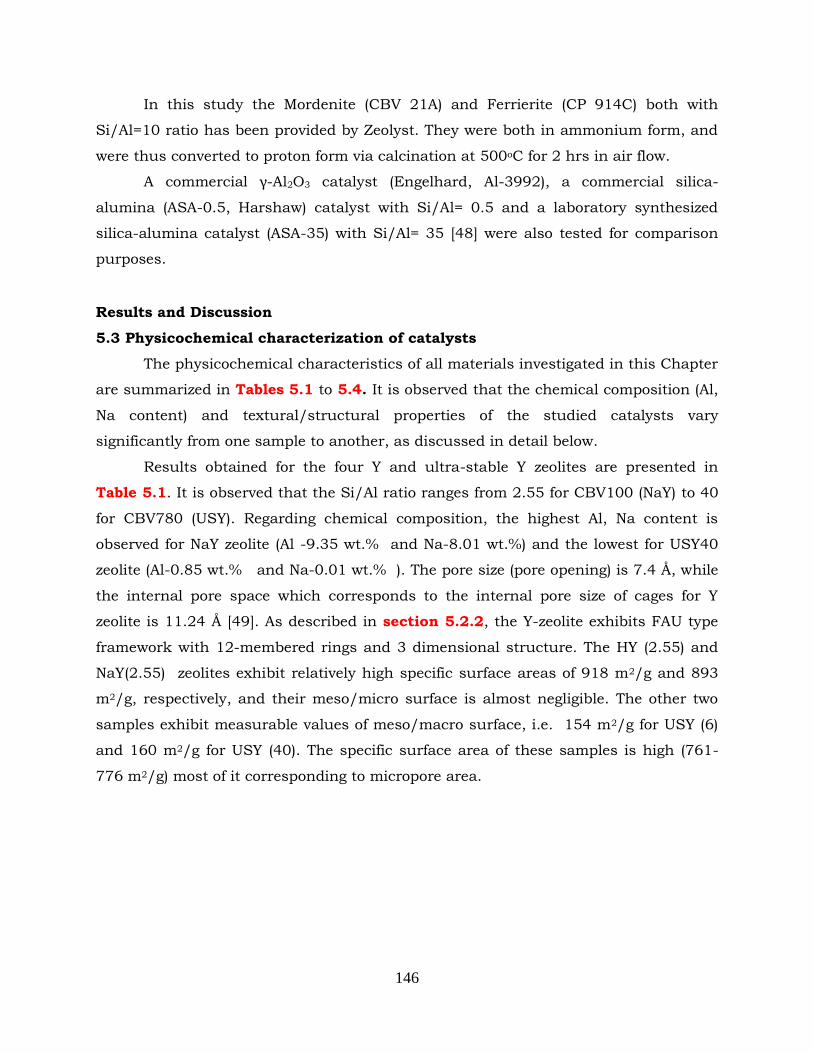
146
In this study the Mordenite (CBV 21A) and Ferrierite (CP 914C) both with
Si/Al=10 ratio has been provided by Zeolyst. They were both in ammonium form, and
were thus converted to proton form via calcination at 500oC for 2 hrs in air flow.
A commercial γ-Al2O3 catalyst (Engelhard, Al-3992), a commercial silica-
alumina (ASA-0.5, Harshaw) catalyst with Si/Al= 0.5 and a laboratory synthesized
silica-alumina catalyst (ASA-35) with Si/Al= 35 [48] were also tested for comparison
purposes.
Results and Discussion
5.3 Physicochemical characterization of catalysts
The physicochemical characteristics of all materials investigated in this Chapter
are summarized in Tables 5.1 to 5.4. It is observed that the chemical composition (Al,
Na content) and textural/structural properties of the studied catalysts vary
significantly from one sample to another, as discussed in detail below.
Results obtained for the four Y and ultra-stable Y zeolites are presented in
Table 5.1. It is observed that the Si/Al ratio ranges from 2.55 for CBV100 (NaY) to 40
for CBV780 (USY). Regarding chemical composition, the highest Al, Na content is
observed for NaY zeolite (Al -9.35 wt.% and Na-8.01 wt.%) and the lowest for USY40
zeolite (Al-0.85 wt.% and Na-0.01 wt.% ). The pore size (pore opening) is 7.4 Å, while
the internal pore space which corresponds to the internal pore size of cages for Y
zeolite is 11.24 Å [49]. As described in section 5.2.2, the Y-zeolite exhibits FAU type
framework with 12-membered rings and 3 dimensional structure. The HY (2.55) and
NaY(2.55) zeolites exhibit relatively high specific surface areas of 918 m2/g and 893
m2/g, respectively, and their meso/micro surface is almost negligible. The other two
samples exhibit measurable values of meso/macro surface, i.e. 154 m2/g for USY (6)
and 160 m2/g for USY (40). The specific surface area of these samples is high (761-
776 m2/g) most of it corresponding to micropore area.
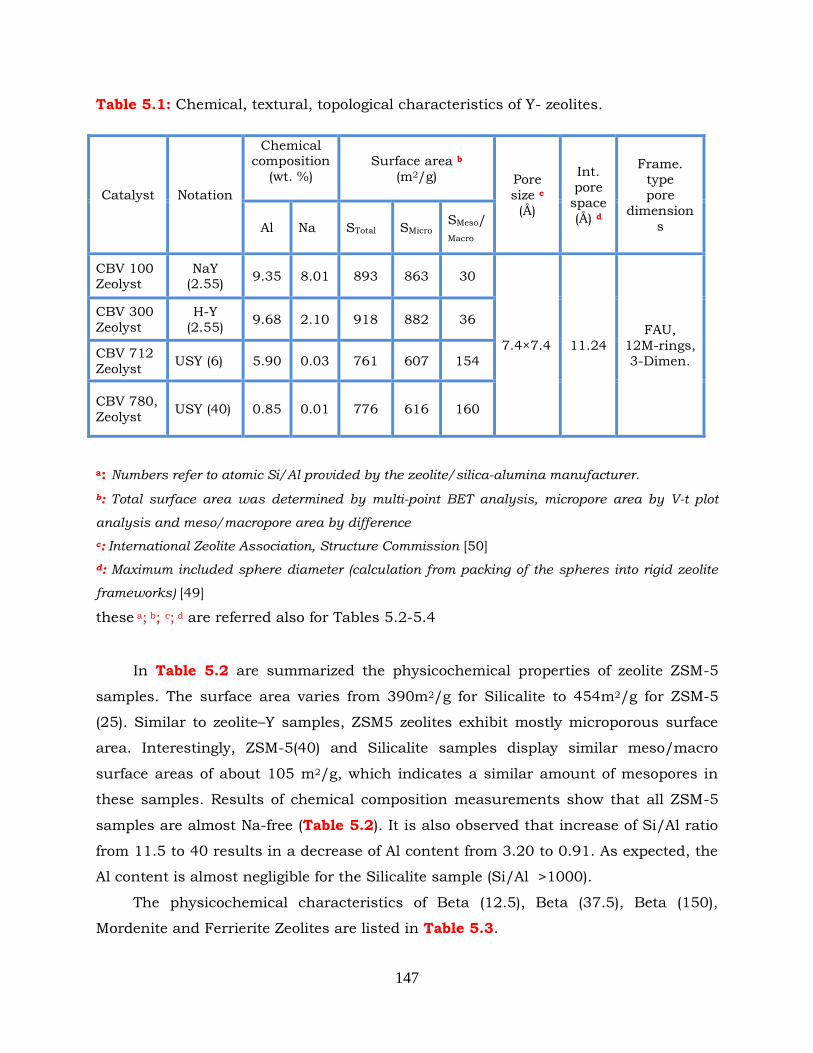
147
Table 5.1: Chemical, textural, topological characteristics of Y- zeolites.
a: Numbers refer to atomic Si/Al provided by the zeolite/silica-alumina manufacturer.
b: Total surface area was determined by multi-point BET analysis, micropore area by V-t plot
analysis and meso/macropore area by difference
c: International Zeolite Association, Structure Commission [50]
d: Maximum included sphere diameter (calculation from packing of the spheres into rigid zeolite
frameworks) [49]
these a; b; c; d are referred also for Tables 5.2-5.4
In Table 5.2 are summarized the physicochemical properties of zeolite ZSM-5
samples. The surface area varies from 390m2/g for Silicalite to 454m2/g for ZSM-5
(25). Similar to zeolite–Y samples, ZSM5 zeolites exhibit mostly microporous surface
area. Interestingly, ZSM-5(40) and Silicalite samples display similar meso/macro
surface areas of about 105 m2/g, which indicates a similar amount of mesopores in
these samples. Results of chemical composition measurements show that all ZSM-5
samples are almost Na-free (Table 5.2). It is also observed that increase of Si/Al ratio
from 11.5 to 40 results in a decrease of Al content from 3.20 to 0.91. As expected, the
Al content is almost negligible for the Silicalite sample (Si/Al >1000).
The physicochemical characteristics of Beta (12.5), Beta (37.5), Beta (150),
Mordenite and Ferrierite Zeolites are listed in Table 5.3.
Catalyst Notation
Chemical composition
(wt. %)
Surface area b
(m2/g) Pore
size c
(Å)
Int.
pore
space
(Å) d
Frame. type
pore
dimension
s Al Na STotal SMicro SMeso/
Macro
CBV 100 Zeolyst
NaY (2.55)
9.35 8.01 893 863 30
7.4×7.4 11.24
FAU,
12M-rings,
3-Dimen.
CBV 300
Zeolyst
H-Y
(2.55) 9.68 2.10 918 882 36
CBV 712
Zeolyst USY (6) 5.90 0.03 761 607 154
CBV 780,
Zeolyst USY (40) 0.85 0.01 776 616 160
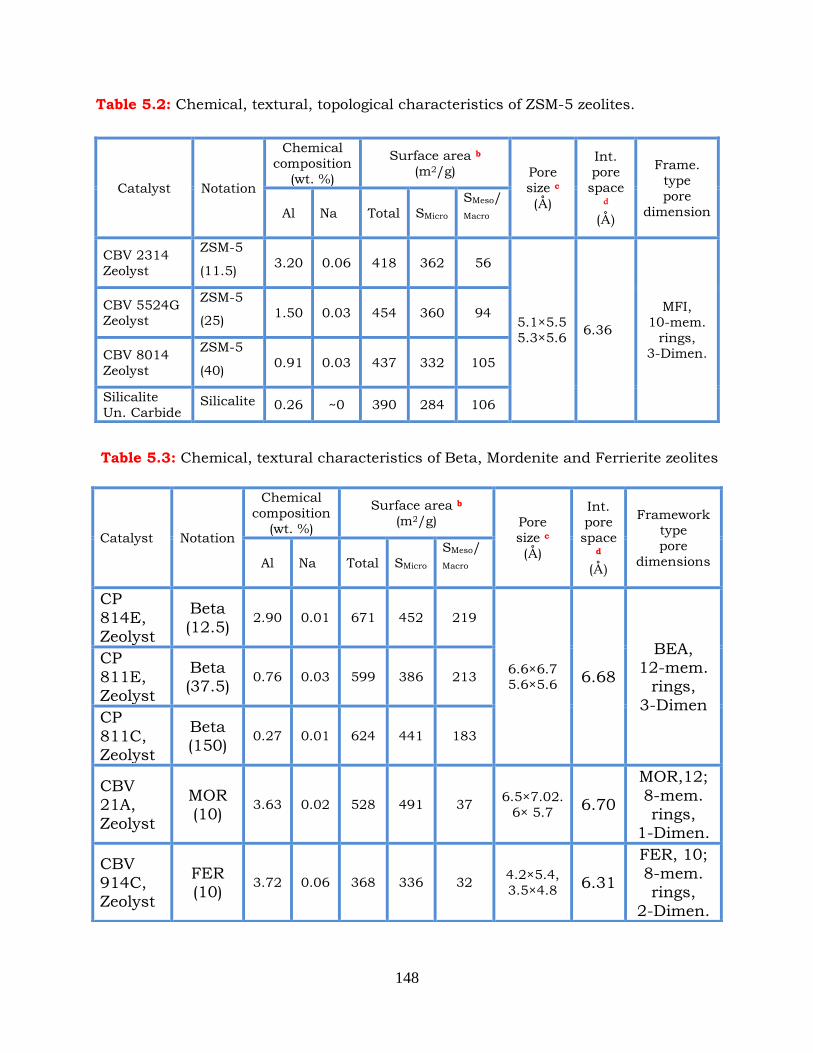
148
Table 5.2: Chemical, textural, topological characteristics of ZSM-5 zeolites.
Table 5.3: Chemical, textural characteristics of Beta, Mordenite and Ferrierite zeolites
Catalyst Notation
Chemical
composition
(wt. %)
Surface area b
(m2/g) Pore
size c
(Å)
Int.
pore
space
d
(Å)
Frame.
type
pore
dimension Al Na Total SMicro
SMeso/
Macro
CBV 2314
Zeolyst
ZSM-5
(11.5) 3.20 0.06 418 362 56
5.1×5.5
5.3×5.6 6.36
MFI,
10-mem.
rings, 3-Dimen.
CBV 5524G Zeolyst
ZSM-5
(25) 1.50 0.03 454 360 94
CBV 8014
Zeolyst
ZSM-5
(40) 0.91 0.03 437 332 105
Silicalite
Un. Carbide Silicalite 0.26 ~0 390 284 106
Catalyst Notation
Chemical
composition
(wt. %)
Surface area b
(m2/g) Pore
size c
(Å)
Int.
pore
space d
(Å)
Framework type
pore
dimensions Al Na Total SMicro
SMeso/
Macro
CP
814E, Zeolyst
Beta
(12.5) 2.90 0.01 671 452 219
6.6×6.7 5.6×5.6
6.68
BEA, 12-mem.
rings,
3-Dimen
CP
811E, Zeolyst
Beta (37.5)
0.76 0.03 599 386 213
CP
811C, Zeolyst
Beta (150)
0.27 0.01 624 441 183
CBV 21A,
Zeolyst
MOR (10)
3.63 0.02 528 491 37 6.5×7.02.
6× 5.7 6.70
MOR,12;
8-mem. rings,
1-Dimen.
CBV
914C, Zeolyst
FER (10)
3.72 0.06 368 336 32 4.2×5.4,
3.5×4.8 6.31
FER, 10;
8-mem. rings,
2-Dimen.
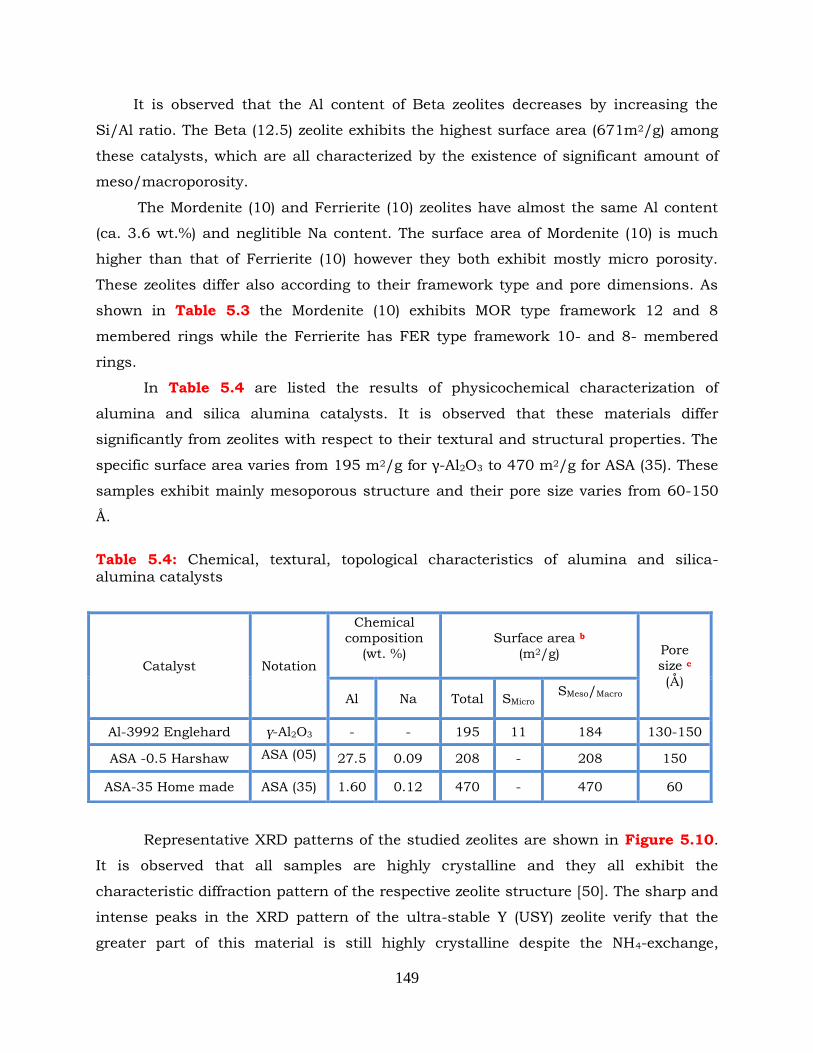
149
It is observed that the Al content of Beta zeolites decreases by increasing the
Si/Al ratio. The Beta (12.5) zeolite exhibits the highest surface area (671m2/g) among
these catalysts, which are all characterized by the existence of significant amount of
meso/macroporosity.
The Mordenite (10) and Ferrierite (10) zeolites have almost the same Al content
(ca. 3.6 wt.%) and neglitible Na content. The surface area of Mordenite (10) is much
higher than that of Ferrierite (10) however they both exhibit mostly micro porosity.
These zeolites differ also according to their framework type and pore dimensions. As
shown in Table 5.3 the Mordenite (10) exhibits MOR type framework 12 and 8
membered rings while the Ferrierite has FER type framework 10- and 8- membered
rings.
In Table 5.4 are listed the results of physicochemical characterization of
alumina and silica alumina catalysts. It is observed that these materials differ
significantly from zeolites with respect to their textural and structural properties. The
specific surface area varies from 195 m2/g for γ-Al2O3 to 470 m2/g for ASA (35). These
samples exhibit mainly mesoporous structure and their pore size varies from 60-150
Å.
Table 5.4: Chemical, textural, topological characteristics of alumina and silica-alumina catalysts
Representative XRD patterns of the studied zeolites are shown in Figure 5.10.
It is observed that all samples are highly crystalline and they all exhibit the
characteristic diffraction pattern of the respective zeolite structure [50]. The sharp and
intense peaks in the XRD pattern of the ultra-stable Y (USY) zeolite verify that the
greater part of this material is still highly crystalline despite the NH4-exchange,
Catalyst Notation
Chemical
composition
(wt. %)
Surface area b
(m2/g) Pore
size c
(Å)
Al Na Total SMicro SMeso/Macro
Al-3992 Englehard γ-Al2O3 - - 195 11 184 130-150
ASA -0.5 Harshaw ASA (05) 27.5 0.09 208 - 208 150
ASA-35 Home made ASA (35) 1.60 0.12 470 - 470 60
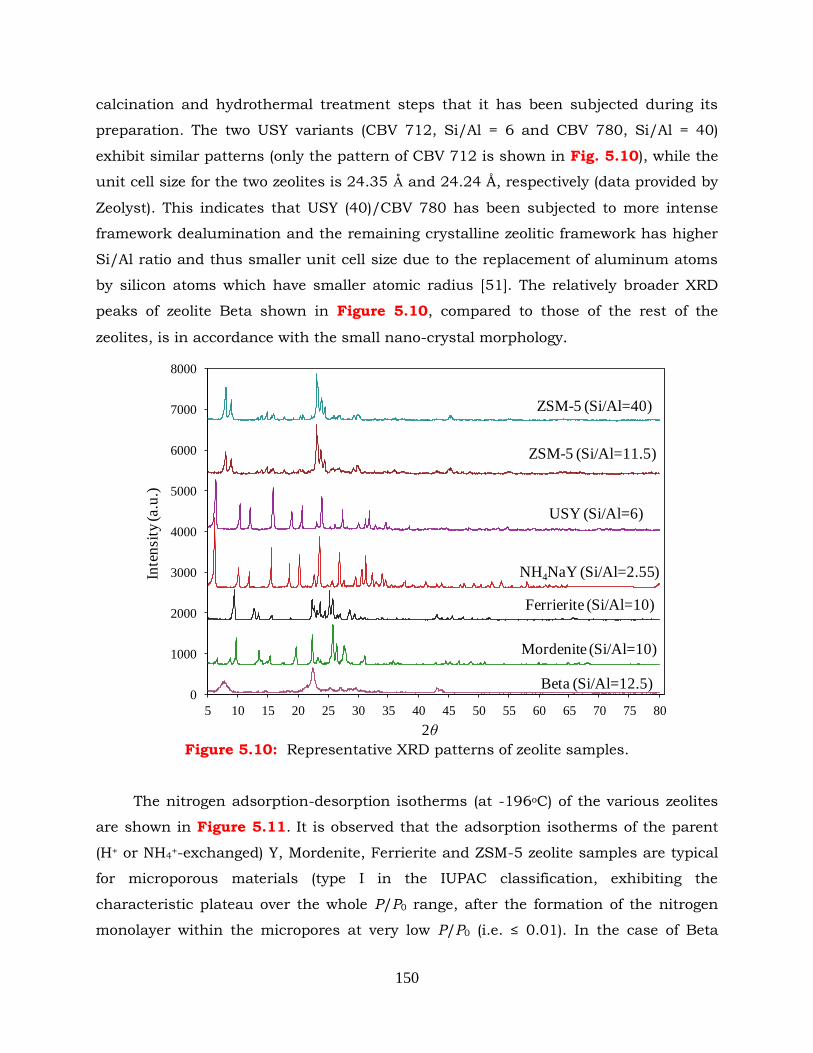
150
calcination and hydrothermal treatment steps that it has been subjected during its
preparation. The two USY variants (CBV 712, Si/Al = 6 and CBV 780, Si/Al = 40)
exhibit similar patterns (only the pattern of CBV 712 is shown in Fig. 5.10), while the
unit cell size for the two zeolites is 24.35 Å and 24.24 Å, respectively (data provided by
Zeolyst). This indicates that USY (40)/CBV 780 has been subjected to more intense
framework dealumination and the remaining crystalline zeolitic framework has higher
Si/Al ratio and thus smaller unit cell size due to the replacement of aluminum atoms
by silicon atoms which have smaller atomic radius [51]. The relatively broader XRD
peaks of zeolite Beta shown in Figure 5.10, compared to those of the rest of the
zeolites, is in accordance with the small nano-crystal morphology.
Figure 5.10: Representative XRD patterns of zeolite samples.
The nitrogen adsorption-desorption isotherms (at -196oC) of the various zeolites
are shown in Figure 5.11. It is observed that the adsorption isotherms of the parent
(H+ or NH4+-exchanged) Y, Mordenite, Ferrierite and ZSM-5 zeolite samples are typical
for microporous materials (type I in the IUPAC classification, exhibiting the
characteristic plateau over the whole P/P0 range, after the formation of the nitrogen
monolayer within the micropores at very low P/P0 (i.e. ≤ 0.01). In the case of Beta
0
1000
2000
3000
4000
5000
6000
7000
8000
5 10 15 20 25 30 35 40 45 50 55 60 65 70 75 80
Inte
nsi
ty (a.u
.)
2θ
Beta (Si/Al=12.5)
Mordenite (Si/Al=10)
Ferrierite (Si/Al=10)
NH4NaY (Si/Al=2.55)
USY (Si/Al=6)
ZSM-5 (Si/Al=11.5)
ZSM-5 (Si/Al=40)
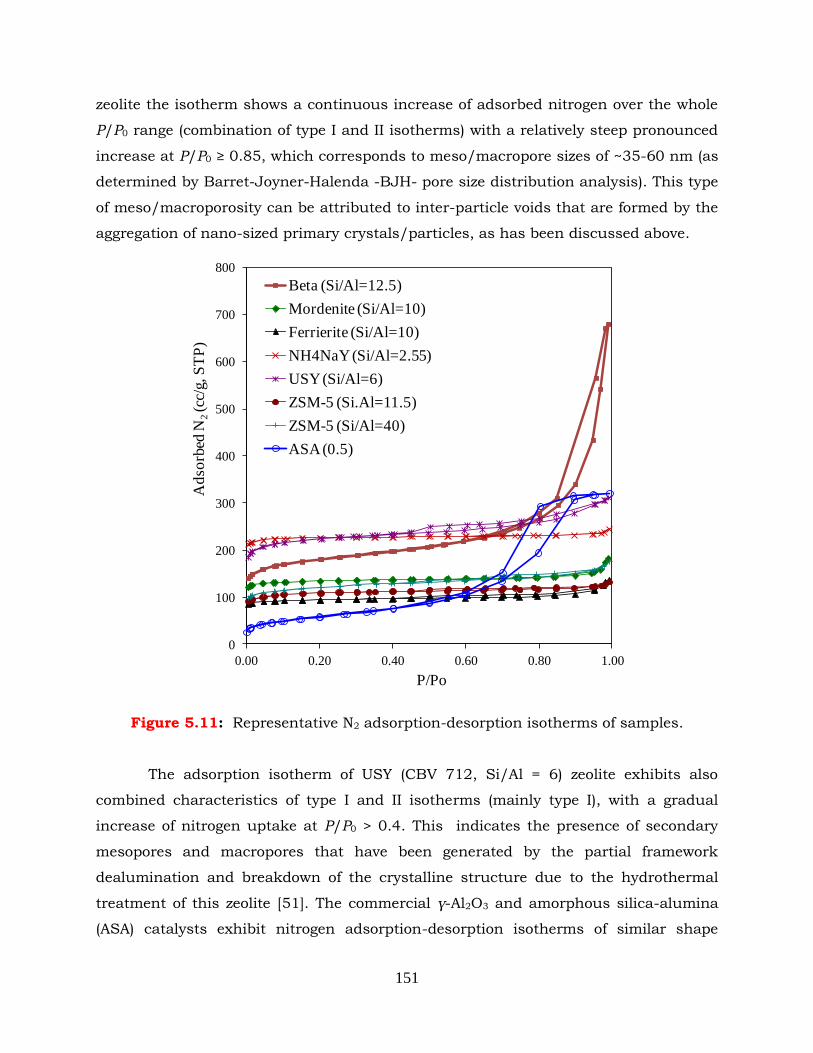
151
zeolite the isotherm shows a continuous increase of adsorbed nitrogen over the whole
P/P0 range (combination of type I and II isotherms) with a relatively steep pronounced
increase at P/P0 ≥ 0.85, which corresponds to meso/macropore sizes of ~35-60 nm (as
determined by Barret-Joyner-Halenda -BJH- pore size distribution analysis). This type
of meso/macroporosity can be attributed to inter-particle voids that are formed by the
aggregation of nano-sized primary crystals/particles, as has been discussed above.
Figure 5.11: Representative N2 adsorption-desorption isotherms of samples.
The adsorption isotherm of USY (CBV 712, Si/Al = 6) zeolite exhibits also
combined characteristics of type I and II isotherms (mainly type I), with a gradual
increase of nitrogen uptake at P/P0 > 0.4. This indicates the presence of secondary
mesopores and macropores that have been generated by the partial framework
dealumination and breakdown of the crystalline structure due to the hydrothermal
treatment of this zeolite [51]. The commercial γ-Al2O3 and amorphous silica-alumina
(ASA) catalysts exhibit nitrogen adsorption-desorption isotherms of similar shape
0
100
200
300
400
500
600
700
800
0.00 0.20 0.40 0.60 0.80 1.00
Ad
sorb
ed N
2(c
c/g, S
TP
)
P/Po
Beta (Si/Al=12.5)
Mordenite (Si/Al=10)
Ferrierite (Si/Al=10)
NH4NaY (Si/Al=2.55)
USY (Si/Al=6)
ZSM-5 (Si.Al=11.5)
ZSM-5 (Si/Al=40)
ASA (0.5)
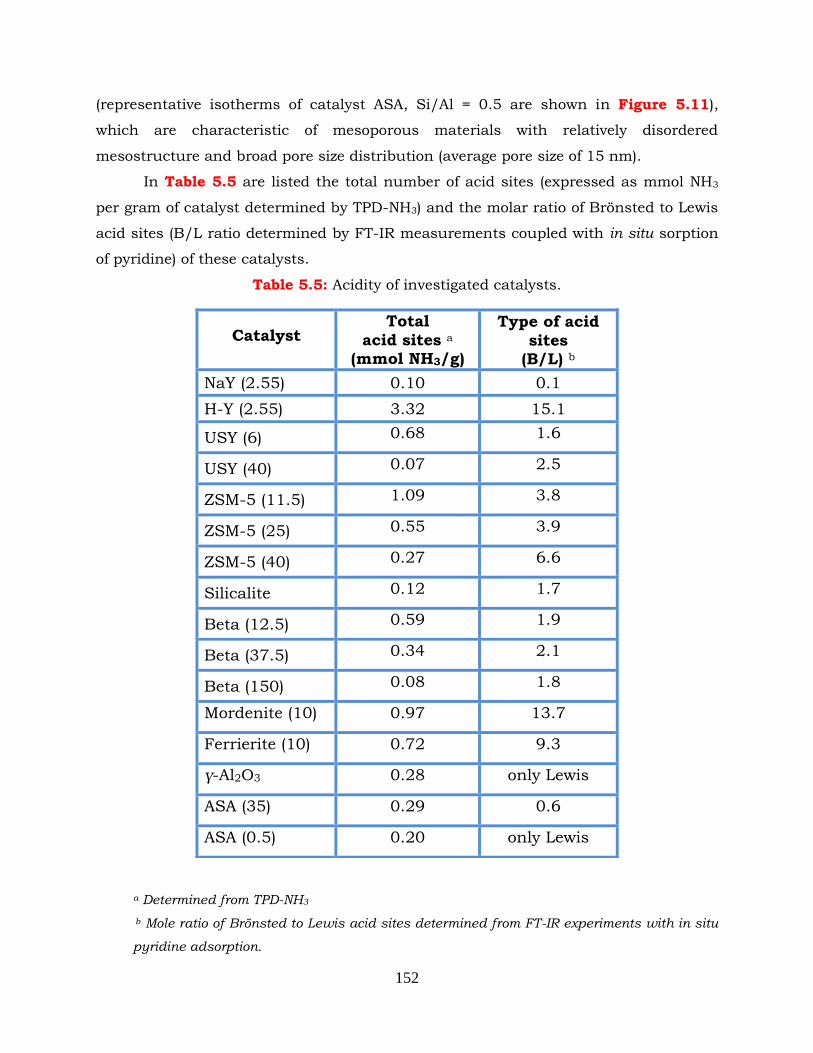
152
(representative isotherms of catalyst ASA, Si/Al = 0.5 are shown in Figure 5.11),
which are characteristic of mesoporous materials with relatively disordered
mesostructure and broad pore size distribution (average pore size of 15 nm).
In Table 5.5 are listed the total number of acid sites (expressed as mmol NH3
per gram of catalyst determined by TPD-NH3) and the molar ratio of Brönsted to Lewis
acid sites (B/L ratio determined by FT-IR measurements coupled with in situ sorption
of pyridine) of these catalysts.
Table 5.5: Acidity of investigated catalysts.
a Determined from TPD-NH3
b Mole ratio of Brönsted to Lewis acid sites determined from FT-IR experiments with in situ
pyridine adsorption.
Catalyst Total
acid sites a
(mmol NH3/g)
Type of acid
sites (B/L) b
NaY (2.55) 0.10 0.1
H-Y (2.55) 3.32 15.1
USY (6) 0.68 1.6
USY (40) 0.07 2.5
ZSM-5 (11.5) 1.09 3.8
ZSM-5 (25) 0.55 3.9
ZSM-5 (40) 0.27 6.6
Silicalite 0.12 1.7
Beta (12.5) 0.59 1.9
Beta (37.5) 0.34 2.1
Beta (150) 0.08 1.8
Mordenite (10) 0.97 13.7
Ferrierite (10) 0.72 9.3
γ-Al2O3 0.28 only Lewis
ASA (35) 0.29 0.6
ASA (0.5) 0.20 only Lewis
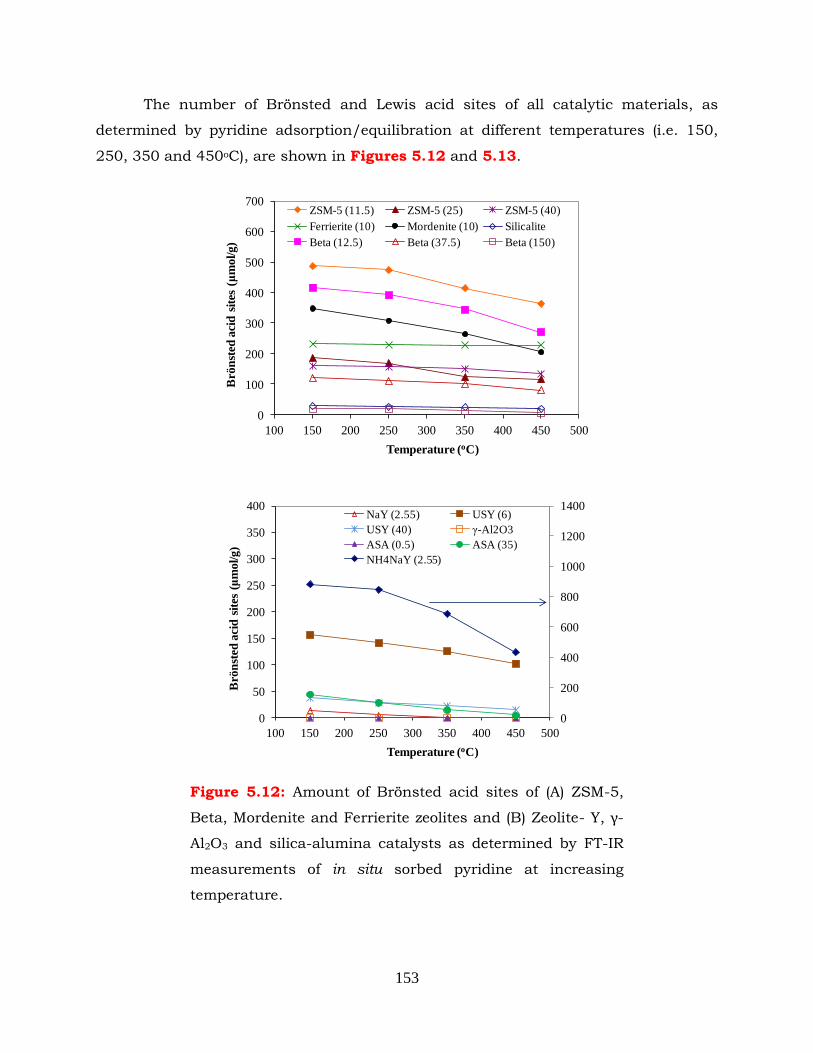
153
The number of Brönsted and Lewis acid sites of all catalytic materials, as
determined by pyridine adsorption/equilibration at different temperatures (i.e. 150,
250, 350 and 450oC), are shown in Figures 5.12 and 5.13.
0
100
200
300
400
500
600
700
100 150 200 250 300 350 400 450 500
Brö
nst
ed a
cid
sit
es (μ
mol/g)
Temperature (oC)
ZSM-5 (11.5) ZSM-5 (25) ZSM-5 (40)
Ferrierite (10) Mordenite (10) Silicalite
Beta (12.5) Beta (37.5) Beta (150)
0
200
400
600
800
1000
1200
1400
0
50
100
150
200
250
300
350
400
100 150 200 250 300 350 400 450 500
Brö
nst
ed a
cid
sit
es (μ
mol/
g)
Temperature (oC)
NaY (2.55) USY (6)
USY (40) γ-Al2O3
ASA (0.5) ASA (35)
NH4NaY (2.55)
Figure 5.12: Amount of Brönsted acid sites of (A) ZSM-5,
Beta, Mordenite and Ferrierite zeolites and (B) Zeolite- Y, γ-
Al2O3 and silica-alumina catalysts as determined by FT-IR
measurements of in situ sorbed pyridine at increasing
temperature.
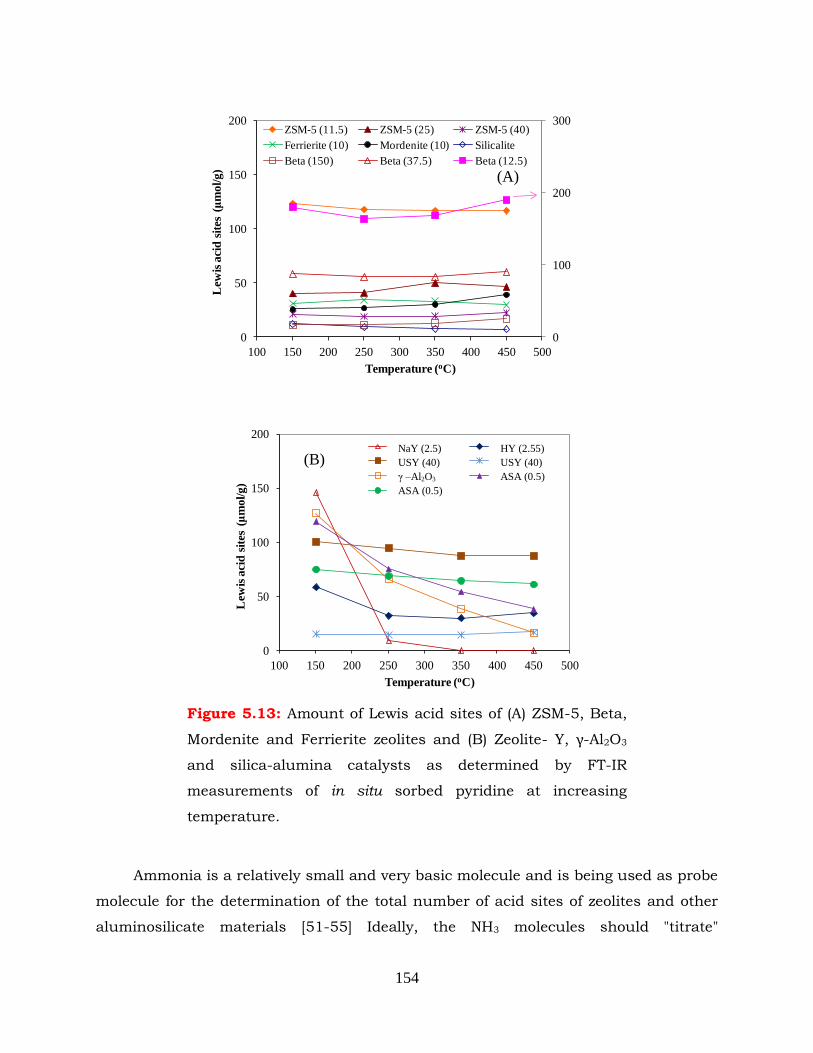
154
Ammonia is a relatively small and very basic molecule and is being used as probe
molecule for the determination of the total number of acid sites of zeolites and other
aluminosilicate materials [51-55] Ideally, the NH3 molecules should "titrate"
0
100
200
300
0
50
100
150
200
100 150 200 250 300 350 400 450 500
Lew
is a
cid
sit
es (μ
mo
l/g
)
Temperature (oC)
ZSM-5 (11.5) ZSM-5 (25) ZSM-5 (40)
Ferrierite (10) Mordenite (10) Silicalite
Beta (150) Beta (37.5) Beta (12.5)
0
50
100
150
200
100 150 200 250 300 350 400 450 500
Lew
is a
cid
sit
es
(μm
ol/
g)
Temperature (oC)
NaY (2.55) NH4NaY (2.55)
USY (6) USY (40)
γ-Al2O3 ASA (0.5)
ASA (35)
(A)
(B) NaY (2.5)
USY (40)
γ –Al2O3
ASA (0.5)
HY (2.55)
USY (40)
ASA (0.5)
Figure 5.13: Amount of Lewis acid sites of (A) ZSM-5, Beta,
Mordenite and Ferrierite zeolites and (B) Zeolite- Y, γ-Al2O3
and silica-alumina catalysts as determined by FT-IR
measurements of in situ sorbed pyridine at increasing
temperature.
155
quantitatively the Brönsted acid sites (bridging hydroxyls) that originate from the
aluminum atoms possessing tetrahedral coordination in the crystalline zeolitic
framework. In such a case the ammonia (acid sites) to aluminum mole ratio should be
equal to 1, assuming that the content of Na+ is negligible. From the data listed in
Table 5.5, the value of this ratio has been calculated to be 0.8-1.0 for the parent Y
and ZSM-5 zeolites, with most of the acid sites being of the Brönsted type. This is
evidenced by the FT-IR/pyridine results shown in Figure 5.12 and the relatively high
values of the B/L mole ratio (i.e., 4-15) listed in Table 5.5.
The NH3/aluminum mole ratio for the Beta zeolites is also high (0.8-1.2) and
close to unity. On the other hand, for the Beta zeolite with low Si/Al ratio (12.5), as
well as for the Mordenite and Ferriertie zeolites with low Si/Al ratios (10), the value of
the ratio drops to 0.5-0.7. This indicates that part of aluminum is not tetrahedrally
coordinated in the zeolitic framework and cannot generate acidic bridging hydroxyls.
The presence of extra-framework aluminum (or silicon-aluminum) oxyhydroxide
species in the parent H+-exchanged zeolites can be attributed either to incomplete
crystallization of the synthesis gel or to the various post-synthesis treatment steps
(calcination to remove the organic template, ion-exchange of the sodium cations with
ammonium ions, and final calcination to produce the H+-form) that are applied in
order to prepare the acidic H+-zeolites. These extra-framework Al (EFAL) species can
function as Lewis acid sites, which in the case of Beta zeolite are relatively increased
compared to the rest of zeolites (except the USY zeolites), as can be seen from the data
in Table 5.5 (the B/L ratio for the Beta zeolites is relatively low, ~2).
Similar to the case of USY zeolite production, the hydrothermal treatment of
zeolites leads to the formation of significant amounts of EFAL species [51, 52], which
result in lower values for the NH3/aluminum mole ratio, i.e., (0.3 for USY (6) and 0.2
for USY(40)). This is a strong indication that the EFAL species have limited capability
of adsorbing NH3 (compared to the bridging hydroxyls), while on the other hand, can
induce Lewis acidity (as also observed for the parent calcined Beta zeolites). Indeed,
the ratio of B/L acid sites for USY (6) is 1.6 (compared to 15 of the parent HY (2.55)
zeolite). Removal of a significant part of EFAL via post-synthesis treatment of USY
zeolites results in higher bulk Si/Al (as is the case of CBV (40) and eventually to
somehow improved ratio of B/L acid sites, i.e., 2.5 (Table 5.5).
156
Although the presence of EFAL species in the zeolite can result in lower
NH3/aluminium ratio than that expected if all aluminum was within the zeolite
framework, it may not be the sole reason, especially for the small pore zeolites. As
mentioned above, the NH3/aluminium ratio for Mordenite zeolite is 0.7 and for
Ferrierite is 0.5 thus being in accordance with the decreasing micropore size of these
two zeolites, especially compared to Y and Beta zeolites. The kinetic diameter of the
ammonia molecule is ~2.6 Å (critical diameter ~3.6 Å) and that of pyridine is ~5.9 Å,
being similar (or even larger in the case of pyridine) with the pore size of these two
zeolites. This possible effect of the size of probe molecule can be also identified in the
curves of Figure 5.12A, where it can be seen that despite the similar Si/Al ratios of
the ZSM-5(11.5), Beta(12.5), Mordenite (10) and Ferrierite (10) zeolite samples, the two
latter zeolites adsorb a considerably lower amount of pyridine on their Brönsted acid
sites.
As far as the acidity strength is concerned, it is well-known that the higher
amount of isolated framework Al atoms (higher framework Si/Al ratio) induce
Brönsted acid sites (attributed to bridging framework hydroxyls) of higher strength, as
is for example the case of ZSM-5 zeolite compared to Y zeolite [51, 52, 56, 57]. The
data and curves of Figures 5.12 and 5.13, which show the relative ability of the
zeolites to retain pyridine adsorbed on Brönsted and Lewis acid at various
equilibration temperatures (i.e. 150, 250, 350 and 450 oC), provide a qualitative
evaluation of the relative acidity strength of the zeolites. The higher the relative
amount of acid sites (i.e., the amount of sorbed pyridine) at higher equilibration
temperatures, the higher the acid strength of the catalyst. For ZSM-5 zeolites (Si/Al =
11.5, 25, 40) ~60-85% of the pyridine sorbed on Brönsted acid sites at 150oC remains
sorbed at 450 oC, indicating the relatively high acid strength of ZSM-5 zeolite
(especially of that with the higher Si/Al of 40). Interestingly, this value was 70% for
Silicalite, verifying the presence of Al traces in tetrahedral framework sites, which act
as strong Brönsted acid sites. In the case of Beta zeolites (Si/Al= 12.5, 37.5, 150) the
percentage is lower, i.e., 35-65%, as is for the parent Y zeolite (50%), the two USY
zeolites (65% for CBV 712 and 40% for CBV 780), and Mordenite zeolite (60%). On the
other hand, almost all pyridine remained sorbed on Ferrierite zeolite up to 450oC, but
this can be misleading since, as discussed above, pyridine cannot be considered as a
"safe" probe molecule for measuring the acidity of this small pore zeolite. In contrast to
157
the Brönsted acid sites, the Lewis sites of all zeolites exhibit relatively high strength,
since the same amount of pyridine remains sorbed on the samples over the whole
equilibration temperature range, i.e., 150-450oC (Figure 5.13).
With regard to the amorphous silica-alumina (ASA) and γ-Al2O3 catalysts, the
high aluminum content ASA sample (Si/Al = 0.5) and the γ-Al2O3 catalysts possess
only Lewis acid sites, while the ASA catalyst with low aluminum content (Si/Al= 35)
contains both Brönsted and Lewis acid sites, with B/L ratio of 0.6 (Table 5.5). The
Brönsted acid sites of ASA(35) as well as Lewis acid sites of ASA(0.5) and γ-Al2O3, are
of low strength, as can be revealed by the steep decline of the respective curves in Fig.
12B and Fig. 5.13B. Contrarily, the Lewis sites of ASA(35) Fig. 5.13B exhibit higher
strength.
5.4 Catalytic performance tests and kinetic studies
5.4.1 Zeolites ZSM-5 and silicalite
5.4.1.1 Catalytic performance in the absence of H2O in the feed
The catalytic performance tests in the absence of water in the feed were carried
out under following experimental conditions: feed composition: 30% CH3OH (in He);
mass of catalyst: 100 mg; total flow rate: 30 cm3 min-1.
Results of catalytic performance tests obtained over the three ZSM-5 and the
Silicalite catalysts are shown in Figure 5.14 (A-D) where the conversion of methanol
(XMeOH) and selectivities to reaction products (Si) are plotted for each sample as
functions of reaction temperature. The equilibrium conversion curve for methanol
dehydration to DME is also shown (dashed line), for comparison. Regarding the ZSM-
5(11.5) catalyst, it is observed that it exhibits measurable MeOH conversion at
temperatures lower than 150 oC and reaches equilibrium at ca. 290 oC (Fig. 5.14 A).
Under these conditions, the catalyst is 100% selective to DME. Increase of reaction
temperature above 300 oC results in an abrupt decrease of SDME and in the formation
of CH4, C2H4, C3H6, C3H8 and higher hydrocarbons (HC). This is accompanied by an
increase of methanol conversion, which takes values higher than those corresponding
to equilibrium conversion of MeOH to DME (Fig. 5.14 A). This is a typical behavior of
ZSM-5 zeolite in the methanol-to-hydrocarbons (i.e to light olefins and/or aromatics)
reaction owing to its strong Brönsted acid sites and its medium-size channel-like
micropore morphology [10, 58-61]. In the MTH process, the formation of DME has
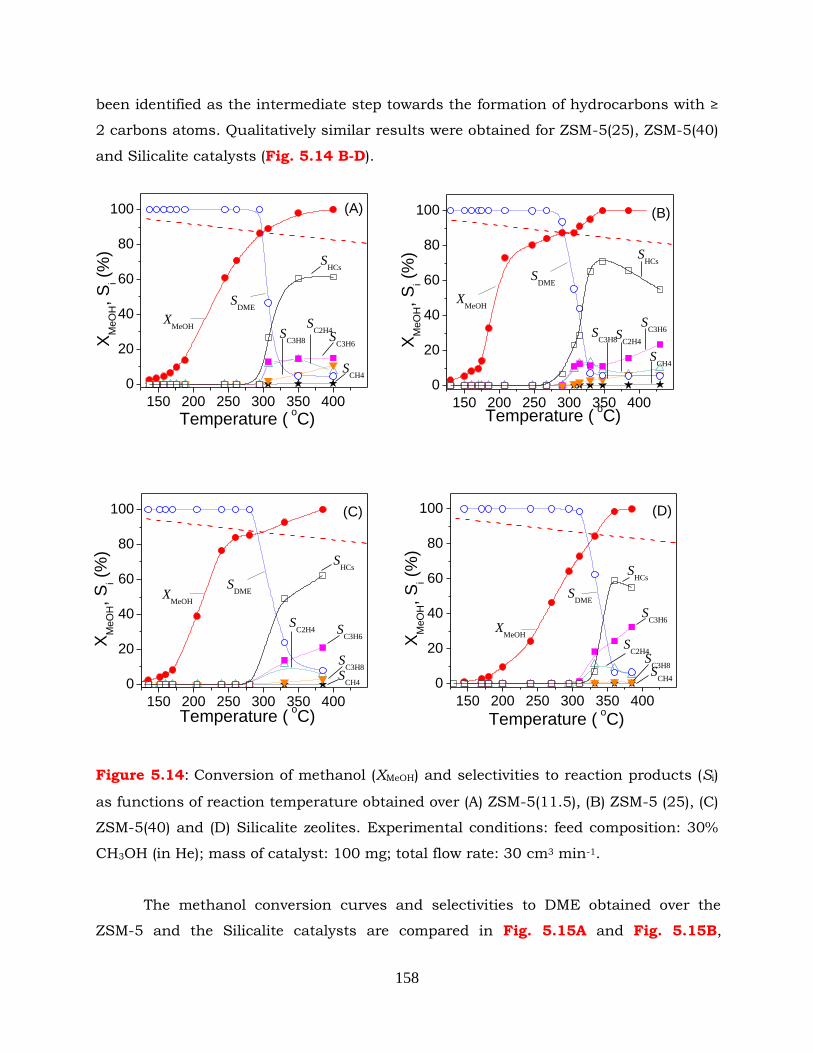
158
been identified as the intermediate step towards the formation of hydrocarbons with ≥
2 carbons atoms. Qualitatively similar results were obtained for ZSM-5(25), ZSM-5(40)
and Silicalite catalysts (Fig. 5.14 B-D).
Figure 5.14: Conversion of methanol (XMeOH) and selectivities to reaction products (Si)
as functions of reaction temperature obtained over (A) ZSM-5(11.5), (B) ZSM-5 (25), (C)
ZSM-5(40) and (D) Silicalite zeolites. Experimental conditions: feed composition: 30%
CH3OH (in He); mass of catalyst: 100 mg; total flow rate: 30 cm3 min-1.
The methanol conversion curves and selectivities to DME obtained over the
ZSM-5 and the Silicalite catalysts are compared in Fig. 5.15A and Fig. 5.15B,
150 200 250 300 350 400
0
20
40
60
80
100 (A)
SCH4
SHCs
SC3H6
SC2H4S
C3H8
SDME
XMeOH
Temperature ( oC)
XM
eO
H,
Si (
%)
150 200 250 300 350 400
0
20
40
60
80
100 (B)
SCH4
SHCs
SC3H6
SC2H4
SC3H8
SDME
XMeOH
Temperature ( oC)
XM
eO
H,
Si (
%)
150 200 250 300 350 400
0
20
40
60
80
100 (C)
SCH4
SHCs
SC3H6
SC2H4
SC3H8
SDMEX
MeOH
Temperature ( oC)
XM
eO
H,
Si (
%)
150 200 250 300 350 400
0
20
40
60
80
100 (D)
SCH4
SHCs
SC3H6
SC2H4
SC3H8
SDME
XMeOH
Temperature ( oC)
XM
eO
H,
Si (
%)
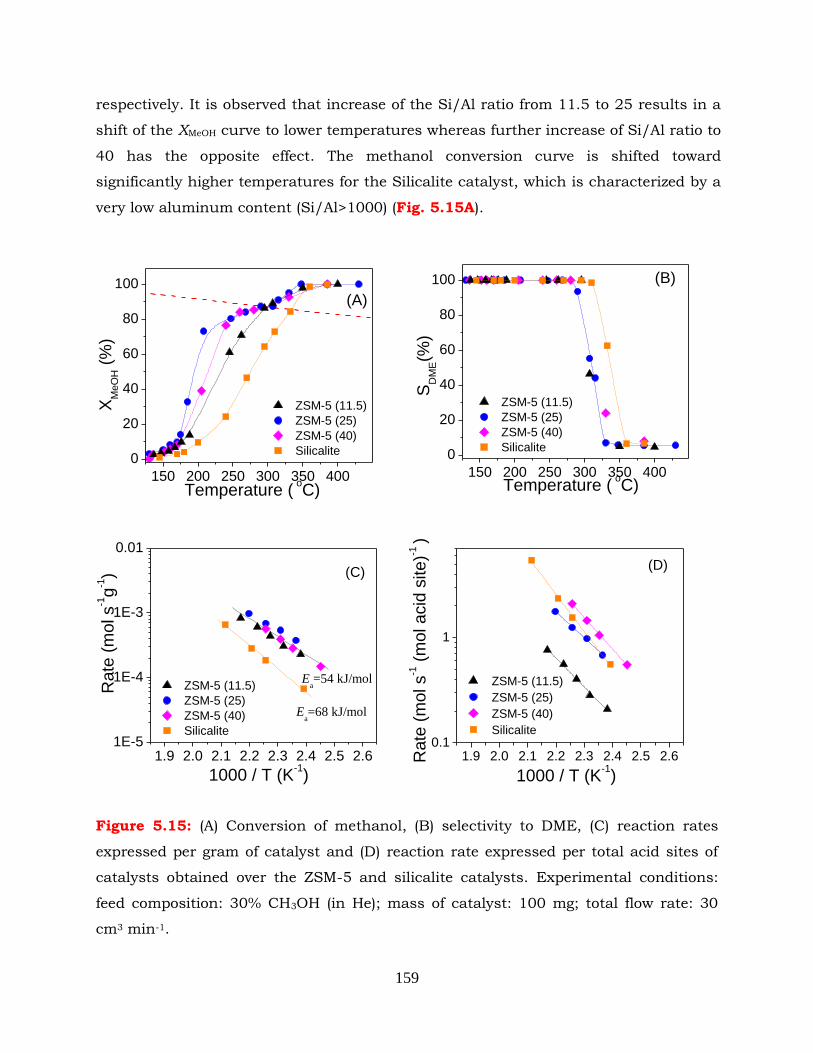
159
respectively. It is observed that increase of the Si/Al ratio from 11.5 to 25 results in a
shift of the XMeOH curve to lower temperatures whereas further increase of Si/Al ratio to
40 has the opposite effect. The methanol conversion curve is shifted toward
significantly higher temperatures for the Silicalite catalyst, which is characterized by a
very low aluminum content (Si/Al>1000) (Fig. 5.15A).
Figure 5.15: (A) Conversion of methanol, (B) selectivity to DME, (C) reaction rates
expressed per gram of catalyst and (D) reaction rate expressed per total acid sites of
catalysts obtained over the ZSM-5 and silicalite catalysts. Experimental conditions:
feed composition: 30% CH3OH (in He); mass of catalyst: 100 mg; total flow rate: 30
cm3 min-1.
150 200 250 300 350 400
0
20
40
60
80
100
(A)
ZSM-5 (11.5)
ZSM-5 (25)
ZSM-5 (40)
Silicalite
Temperature ( oC)
XM
eO
H (
%)
150 200 250 300 350 400
0
20
40
60
80
100 (B)
ZSM-5 (11.5)
ZSM-5 (25)
ZSM-5 (40)
Silicalite
Temperature ( oC)
SD
ME(%
)
1.9 2.0 2.1 2.2 2.3 2.4 2.5 2.61E-5
1E-4
1E-3
0.01
Ea=68 kJ/mol
(C)
Ea=54 kJ/mol
ZSM-5 (11.5)
ZSM-5 (25)
ZSM-5 (40)
Silicalite
Rate
(m
ol s
-1g
-1)
1000 / T (K-1)
1.9 2.0 2.1 2.2 2.3 2.4 2.5 2.60.1
1
(D)
Rate
(m
ol s
-1 (
mol acid
site)-1
)
ZSM-5 (11.5)
ZSM-5 (25)
ZSM-5 (40)
Silicalite
1000 / T (K-1)
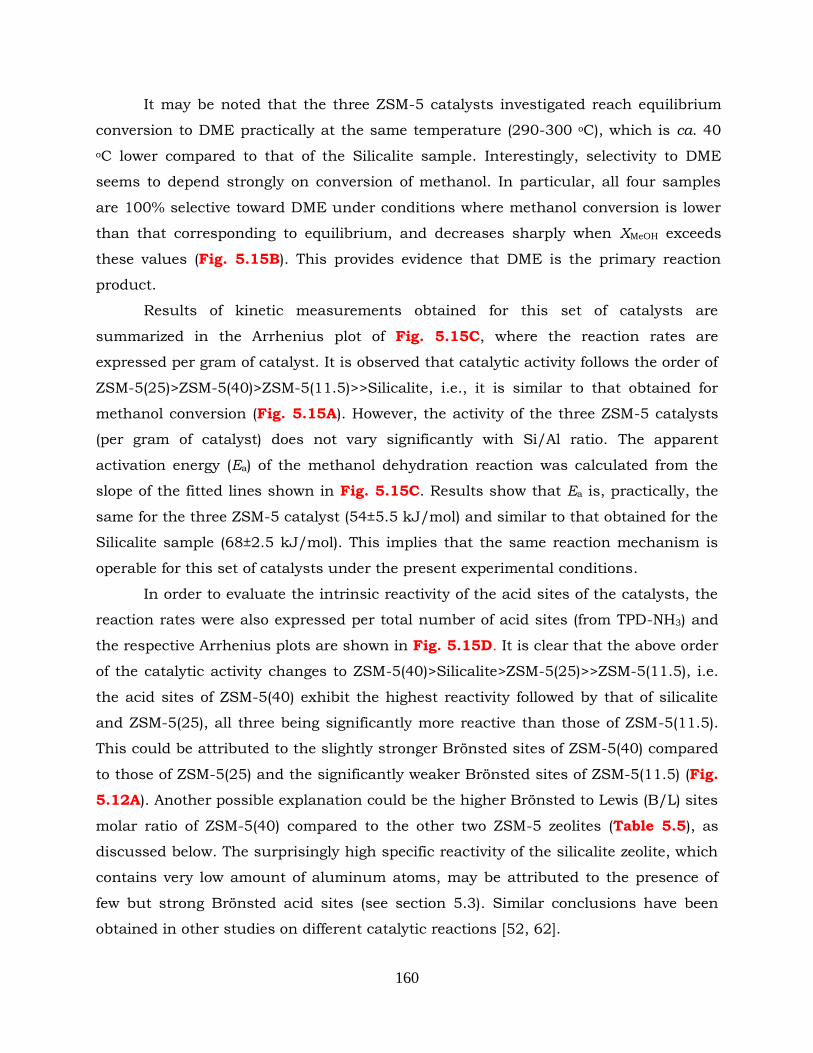
160
It may be noted that the three ZSM-5 catalysts investigated reach equilibrium
conversion to DME practically at the same temperature (290-300 oC), which is ca. 40
oC lower compared to that of the Silicalite sample. Interestingly, selectivity to DME
seems to depend strongly on conversion of methanol. In particular, all four samples
are 100% selective toward DME under conditions where methanol conversion is lower
than that corresponding to equilibrium, and decreases sharply when XMeOH exceeds
these values (Fig. 5.15B). This provides evidence that DME is the primary reaction
product.
Results of kinetic measurements obtained for this set of catalysts are
summarized in the Arrhenius plot of Fig. 5.15C, where the reaction rates are
expressed per gram of catalyst. It is observed that catalytic activity follows the order of
ZSM-5(25)>ZSM-5(40)>ZSM-5(11.5)>>Silicalite, i.e., it is similar to that obtained for
methanol conversion (Fig. 5.15A). However, the activity of the three ZSM-5 catalysts
(per gram of catalyst) does not vary significantly with Si/Al ratio. The apparent
activation energy (Ea) of the methanol dehydration reaction was calculated from the
slope of the fitted lines shown in Fig. 5.15C. Results show that Ea is, practically, the
same for the three ZSM-5 catalyst (54±5.5 kJ/mol) and similar to that obtained for the
Silicalite sample (68±2.5 kJ/mol). This implies that the same reaction mechanism is
operable for this set of catalysts under the present experimental conditions.
In order to evaluate the intrinsic reactivity of the acid sites of the catalysts, the
reaction rates were also expressed per total number of acid sites (from TPD-NH3) and
the respective Arrhenius plots are shown in Fig. 5.15D. It is clear that the above order
of the catalytic activity changes to ZSM-5(40)>Silicalite>ZSM-5(25)>>ZSM-5(11.5), i.e.
the acid sites of ZSM-5(40) exhibit the highest reactivity followed by that of silicalite
and ZSM-5(25), all three being significantly more reactive than those of ZSM-5(11.5).
This could be attributed to the slightly stronger Brönsted sites of ZSM-5(40) compared
to those of ZSM-5(25) and the significantly weaker Brönsted sites of ZSM-5(11.5) (Fig.
5.12A). Another possible explanation could be the higher Brönsted to Lewis (B/L) sites
molar ratio of ZSM-5(40) compared to the other two ZSM-5 zeolites (Table 5.5), as
discussed below. The surprisingly high specific reactivity of the silicalite zeolite, which
contains very low amount of aluminum atoms, may be attributed to the presence of
few but strong Brönsted acid sites (see section 5.3). Similar conclusions have been
obtained in other studies on different catalytic reactions [52, 62].
161
Although the presence of more and/or stronger Brönsted acid sites seems to be
the dominating factor in determining the reactivity of the ZSM-5 zeolites, still however
the contribution from the Lewis acid sites is important. This can be realized by
comparing the rates expressed per total acid site (Fig. 5.15D) with those expressed per
total Brönsted or Lewis acid site (Fig. 5.16 A and B). If the Brönsted acid sites were
the only active sites in DME formation, then the silicalite zeolite would have been the
more reactive catalyst (Fig. 5.16 A), which however is not the case.
Figure 5.16: Arrhenius plots of reaction rates obtained over the ZSM-5 and silicalite
catalysts (A) expressed per total Brönsted acid sites and (B) expressed per total Lewis
acid sites. Experimental conditions: feed composition: 30% CH3OH (in He); mass of
catalyst: 100 mg; total flow rate: 30 cm3 min-1.
5.4.1.2 Effects of the presence of H2O in the feed
Under realistic reaction conditions, where methanol is produced via
hydrogenation of CO2, the gas mixture contains considerable amounts of water steam,
which may influence the activity and stability of the methanol dehydration catalyst. In
order to address this issue, the effects of the presence of 10% water vapour in the feed
on catalytic performance have been investigated over the ZSM-5 and Silicalite samples,
and results obtained are summarized in Figure 5.17. Similar to what was observed in
the absence of H2O in the feed (Fig. 5.14), the ZSM-5 zeolite catalysts exhibit
1.9 2.0 2.1 2.2 2.3 2.4 2.5 2.60.1
1
10
(A)
Rate
per
Bro
nste
d a
cid
sites
ZSM-5 (11.5)
ZSM-5 (25)
ZSM-5 (40)
Silicalite
1000 / T (K-1)
1.9 2.0 2.1 2.2 2.3 2.4 2.5 2.60.1
1
10
(B)
Rate
per
Lew
is a
cid
sites
ZSM-5 (11.5)
ZSM-5 (25)
ZSM-5 (40)
Silicalite
1000 / T (K-1)
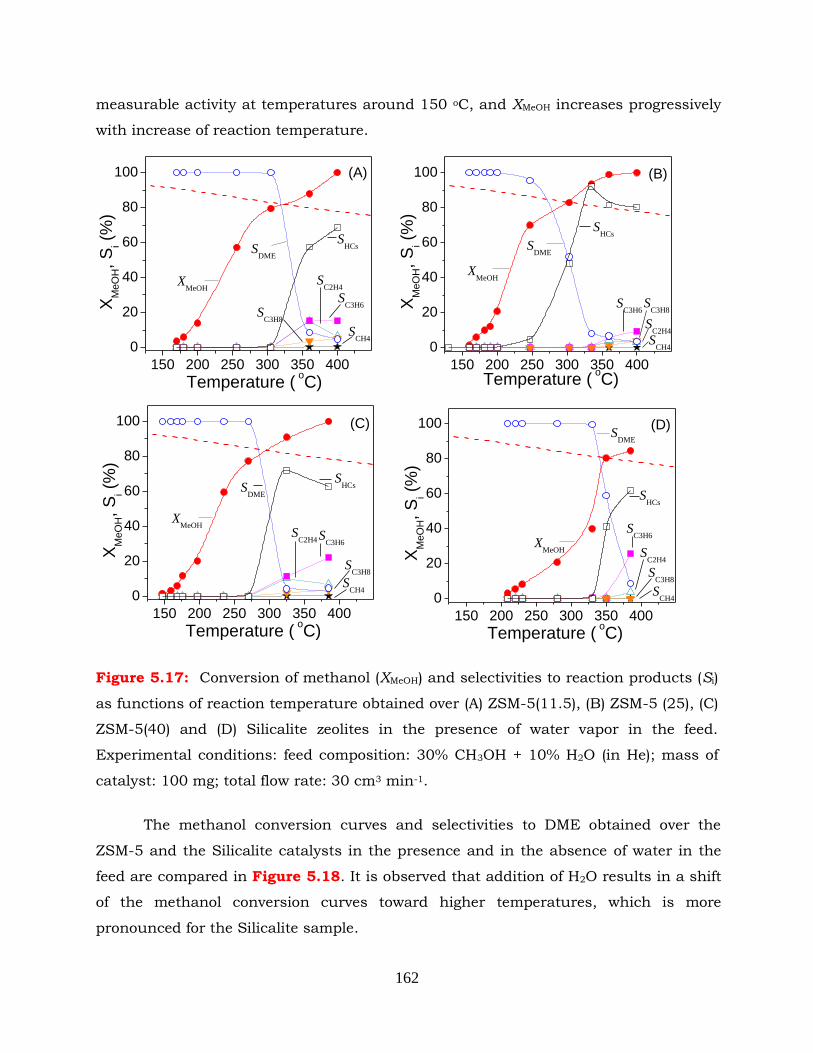
162
measurable activity at temperatures around 150 oC, and XMeOH increases progressively
with increase of reaction temperature.
Figure 5.17: Conversion of methanol (XMeOH) and selectivities to reaction products (Si)
as functions of reaction temperature obtained over (A) ZSM-5(11.5), (B) ZSM-5 (25), (C)
ZSM-5(40) and (D) Silicalite zeolites in the presence of water vapor in the feed.
Experimental conditions: feed composition: 30% CH3OH + 10% H2O (in He); mass of
catalyst: 100 mg; total flow rate: 30 cm3 min-1.
The methanol conversion curves and selectivities to DME obtained over the
ZSM-5 and the Silicalite catalysts in the presence and in the absence of water in the
feed are compared in Figure 5.18. It is observed that addition of H2O results in a shift
of the methanol conversion curves toward higher temperatures, which is more
pronounced for the Silicalite sample.
150 200 250 300 350 400
0
20
40
60
80
100 (A)
SCH4
SHCs
SC3H6
SC2H4
SC3H8
SDME
XMeOH
Temperature ( oC)
XM
eO
H,
Si (
%)
150 200 250 300 350 400
0
20
40
60
80
100 (B)
SCH4
SHCs
SC3H6
SC2H4
SC3H8
SDME
XMeOH
Temperature ( oC)
XM
eO
H,
Si (
%)
150 200 250 300 350 400
0
20
40
60
80
100 (C)
SCH4
SHCs
SC3H6
SC2H4
SC3H8
SDME
XMeOH
Temperature ( oC)
XM
eO
H,
Si (
%)
150 200 250 300 350 400
0
20
40
60
80
100 (D)
SCH4
SHCs
SC3H6
SC2H4
SC3H8
SDME
XMeOH
Temperature ( oC)
XM
eO
H,
Si (
%)
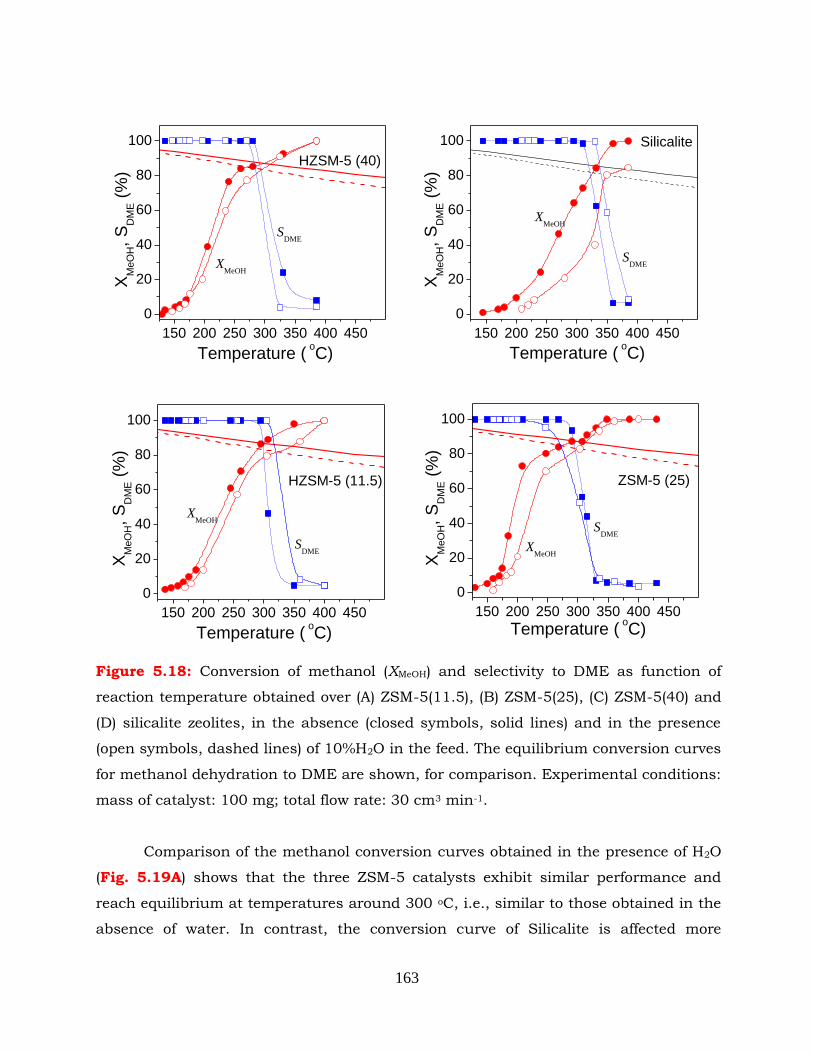
163
Figure 5.18: Conversion of methanol (XMeOH) and selectivity to DME as function of
reaction temperature obtained over (A) ZSM-5(11.5), (B) ZSM-5(25), (C) ZSM-5(40) and
(D) silicalite zeolites, in the absence (closed symbols, solid lines) and in the presence
(open symbols, dashed lines) of 10%H2O in the feed. The equilibrium conversion curves
for methanol dehydration to DME are shown, for comparison. Experimental conditions:
mass of catalyst: 100 mg; total flow rate: 30 cm3 min-1.
Comparison of the methanol conversion curves obtained in the presence of H2O
(Fig. 5.19A) shows that the three ZSM-5 catalysts exhibit similar performance and
reach equilibrium at temperatures around 300 oC, i.e., similar to those obtained in the
absence of water. In contrast, the conversion curve of Silicalite is affected more
150 200 250 300 350 400 450
0
20
40
60
80
100
HZSM-5 (11.5)
SDME
XMeOH
Temperature ( oC)
XM
eO
H,
SD
ME (
%)
150 200 250 300 350 400 450
0
20
40
60
80
100
ZSM-5 (25)
SDME
XMeOH
Temperature ( oC)
XM
eO
H,
SD
ME (
%)
150 200 250 300 350 400 450
0
20
40
60
80
100
HZSM-5 (40)
SDME
XMeOH
Temperature ( oC)
XM
eO
H,
SD
ME (
%)
150 200 250 300 350 400 450
0
20
40
60
80
100 Silicalite
SDME
XMeOH
Temperature ( oC)
XM
eO
H,
SD
ME (
%)
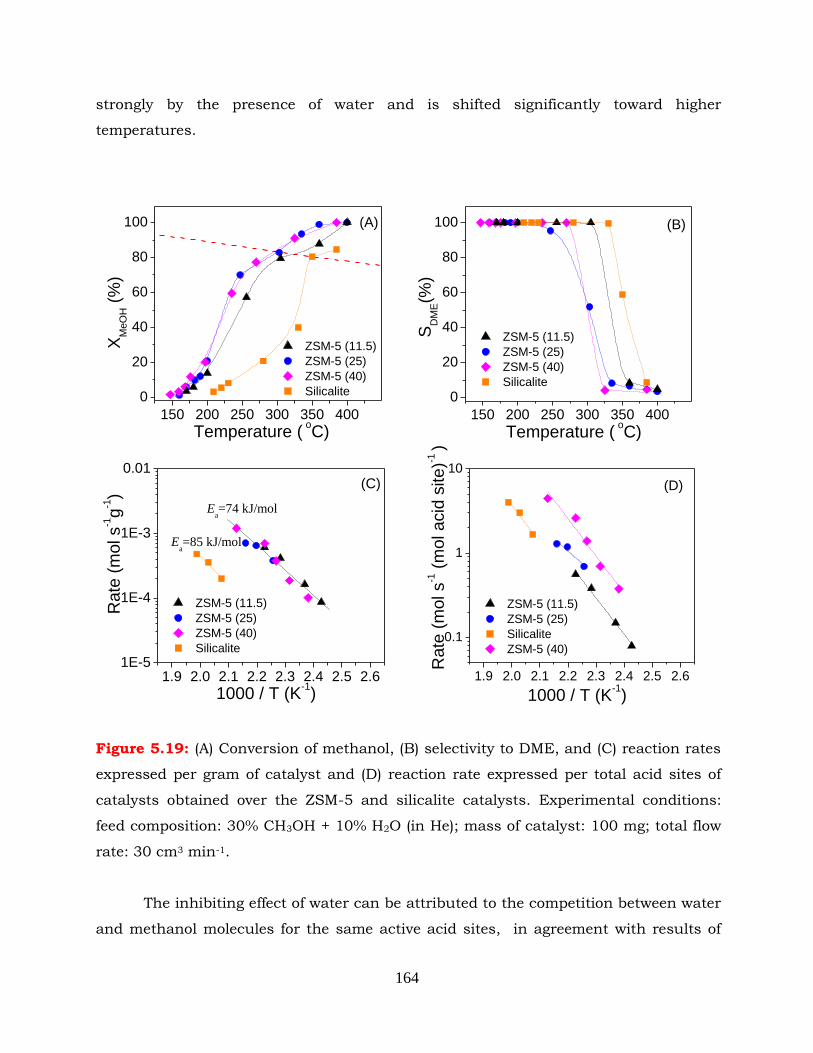
164
strongly by the presence of water and is shifted significantly toward higher
temperatures.
Figure 5.19: (A) Conversion of methanol, (B) selectivity to DME, and (C) reaction rates
expressed per gram of catalyst and (D) reaction rate expressed per total acid sites of
catalysts obtained over the ZSM-5 and silicalite catalysts. Experimental conditions:
feed composition: 30% CH3OH + 10% H2O (in He); mass of catalyst: 100 mg; total flow
rate: 30 cm3 min-1.
The inhibiting effect of water can be attributed to the competition between water
and methanol molecules for the same active acid sites, in agreement with results of
150 200 250 300 350 400
0
20
40
60
80
100 (A)
ZSM-5 (11.5)
ZSM-5 (25)
ZSM-5 (40)
Silicalite
Temperature ( oC)
XM
eO
H (
%)
150 200 250 300 350 400
0
20
40
60
80
100 (B)
ZSM-5 (11.5)
ZSM-5 (25)
ZSM-5 (40)
Silicalite
Temperature ( oC)
SD
ME(%
)
1.9 2.0 2.1 2.2 2.3 2.4 2.5 2.61E-5
1E-4
1E-3
0.01
Ea=85 kJ/mol
Ea=74 kJ/mol
(C)
ZSM-5 (11.5)
ZSM-5 (25)
ZSM-5 (40)
Silicalite
Rate
(m
ol s
-1g
-1)
1000 / T (K-1)
1.9 2.0 2.1 2.2 2.3 2.4 2.5 2.6
0.1
1
10
Rate
(m
ol s
-1 (
mol acid
site)-1
)
(D)
ZSM-5 (11.5)
ZSM-5 (25)
Silicalite
ZSM-5 (40)
1000 / T (K-1)
165
previous studies [63]. This implies that higher reaction temperatures are required to
compensate this loss and achieve similar rates with those obtained with the dry feed.
Regarding selectivity to reaction products, all samples are 100% selective
toward DME at temperatures lower than ca. 250 oC, and SDME decreases rapidly at
temperatures where XMeOH exceeds equilibrium for DME formation (Fig. 5.19B). It is of
interest to note that, under these conditions, selectivity toward higher hydrocarbons
(SHC) is generally higher in the presence of H2O (Fig. 5.17) compared to the dry feed
(Fig. 5.14).
The results of reaction rate measurements are summarized in the Arrhenius
plots of Fig. 5.19C, where the rates are expressed per gram of catalyst. Similar to what
was observed in the absence of water vapour (Fig. 5.15C) the three ZSM-5 catalysts
exhibit practically the same activity, which is significantly higher compared to that of
the silicalite zeolite. In all cases, reaction rates are lower in the presence of steam
(compare results of Fig. 5.15C and Fig. 5.19C). Addition of H2O affects also the
apparent activation energy of the reaction which, in the case of ZSM-5 catalysts,
increases from 54±5.5 kJ/mol to 74±5.6 kJ/mol. The situation is again different when
the rates are expressed per total acid sites of the catalysts (Fig. 5.19D). The ZSM-5(40)
zeolite appears to have the more active acid sites, as in the dry feed experiments, while
the reactivity of ZSM-5(11.5) seems to be less affected by the addition of water
compared to those of the rest of the catalysts (compare results of Fig. 5.15D and Fig.
5.19D).
In Figure 5.20 are compared the rates expressed per total Brönsted and Lewis
acid sites over this set of catalysts when water is present in the feed. It is observed
that the rates obtained for all catalysts fall almost on the same line (Fig. 5.20A). This
indicates that the activity of these samples for methanol dehydration reaction in the
presence of water is determined by the number of Brönsted sites present on the
catalyst surface. It is worth to mention that no such correlation was found in the
absence of water in the feed composition over these catalysts.
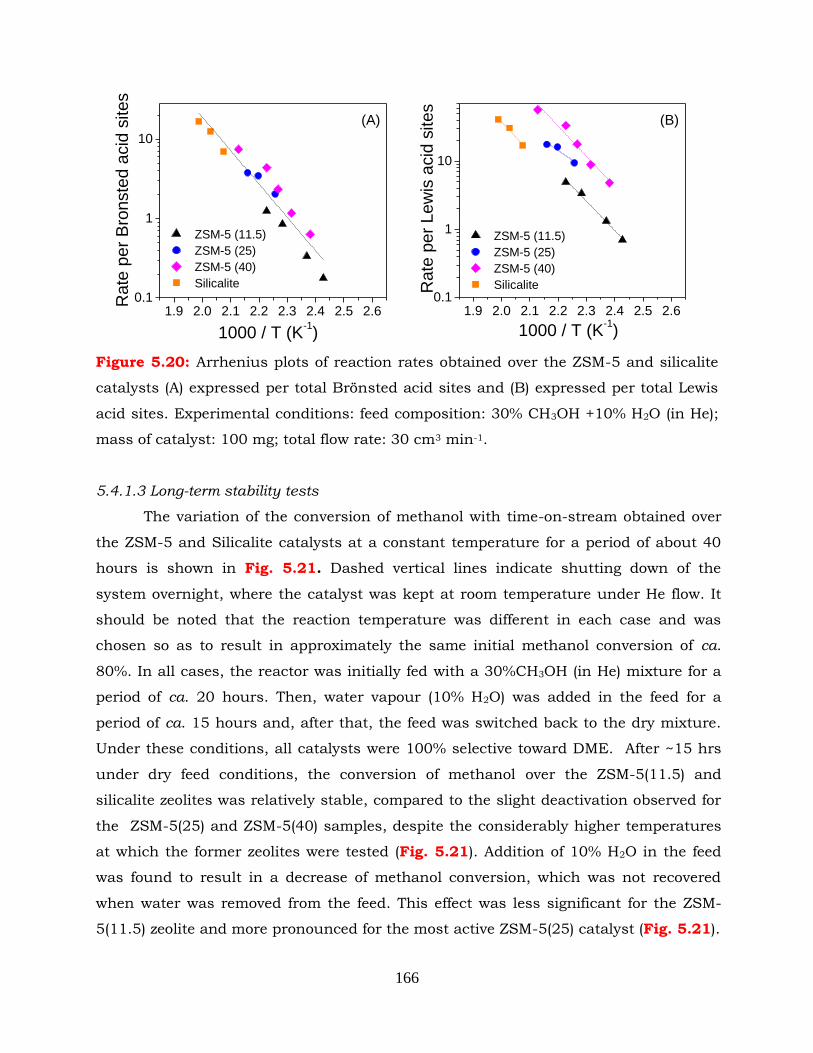
166
Figure 5.20: Arrhenius plots of reaction rates obtained over the ZSM-5 and silicalite
catalysts (A) expressed per total Brönsted acid sites and (B) expressed per total Lewis
acid sites. Experimental conditions: feed composition: 30% CH3OH +10% H2O (in He);
mass of catalyst: 100 mg; total flow rate: 30 cm3 min-1.
5.4.1.3 Long-term stability tests
The variation of the conversion of methanol with time-on-stream obtained over
the ZSM-5 and Silicalite catalysts at a constant temperature for a period of about 40
hours is shown in Fig. 5.21. Dashed vertical lines indicate shutting down of the
system overnight, where the catalyst was kept at room temperature under He flow. It
should be noted that the reaction temperature was different in each case and was
chosen so as to result in approximately the same initial methanol conversion of ca.
80%. In all cases, the reactor was initially fed with a 30%CH3OH (in He) mixture for a
period of ca. 20 hours. Then, water vapour (10% H2O) was added in the feed for a
period of ca. 15 hours and, after that, the feed was switched back to the dry mixture.
Under these conditions, all catalysts were 100% selective toward DME. After ~15 hrs
under dry feed conditions, the conversion of methanol over the ZSM-5(11.5) and
silicalite zeolites was relatively stable, compared to the slight deactivation observed for
the ZSM-5(25) and ZSM-5(40) samples, despite the considerably higher temperatures
at which the former zeolites were tested (Fig. 5.21). Addition of 10% H2O in the feed
was found to result in a decrease of methanol conversion, which was not recovered
when water was removed from the feed. This effect was less significant for the ZSM-
5(11.5) zeolite and more pronounced for the most active ZSM-5(25) catalyst (Fig. 5.21).
1.9 2.0 2.1 2.2 2.3 2.4 2.5 2.60.1
1
10
(B)
Rate
per
Lew
is a
cid
sites
ZSM-5 (11.5)
ZSM-5 (25)
ZSM-5 (40)
Silicalite
1000 / T (K-1)
1.9 2.0 2.1 2.2 2.3 2.4 2.5 2.60.1
1
10
(A)R
ate
per
Bro
nste
d a
cid
sites
ZSM-5 (11.5)
ZSM-5 (25)
ZSM-5 (40)
Silicalite
1000 / T (K-1)
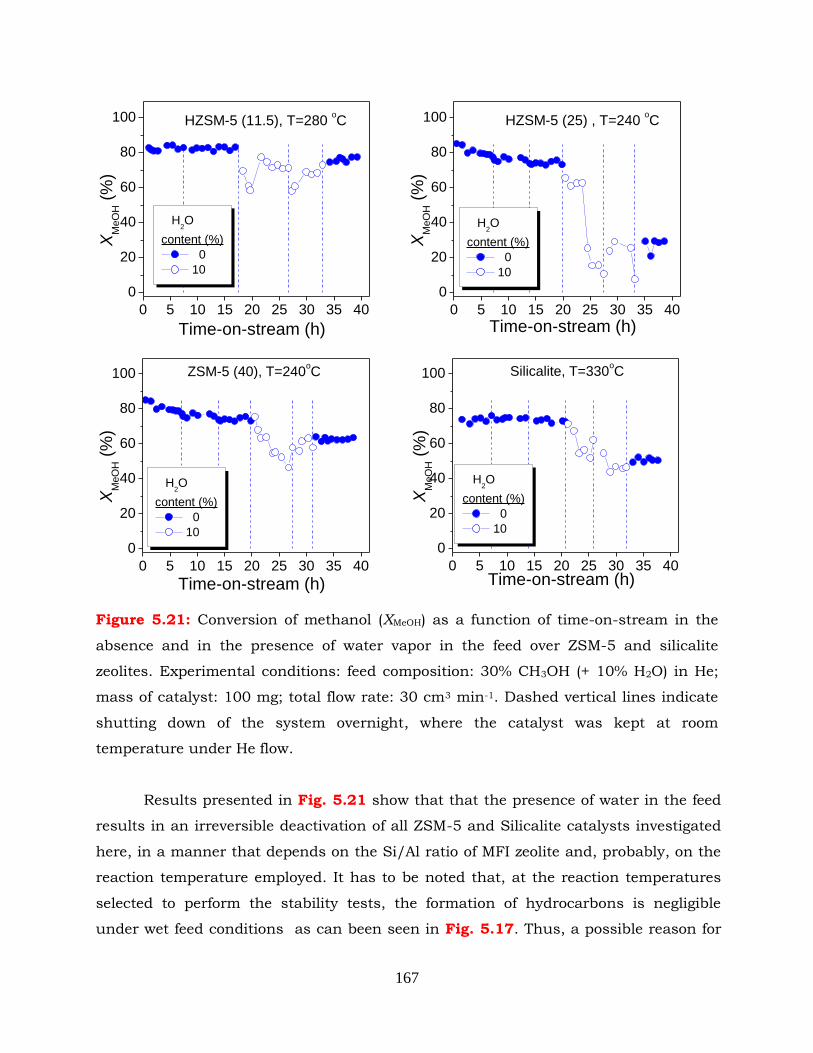
167
Figure 5.21: Conversion of methanol (XMeOH) as a function of time-on-stream in the
absence and in the presence of water vapor in the feed over ZSM-5 and silicalite
zeolites. Experimental conditions: feed composition: 30% CH3OH (+ 10% H2O) in He;
mass of catalyst: 100 mg; total flow rate: 30 cm3 min-1. Dashed vertical lines indicate
shutting down of the system overnight, where the catalyst was kept at room
temperature under He flow.
Results presented in Fig. 5.21 show that that the presence of water in the feed
results in an irreversible deactivation of all ZSM-5 and Silicalite catalysts investigated
here, in a manner that depends on the Si/Al ratio of MFI zeolite and, probably, on the
reaction temperature employed. It has to be noted that, at the reaction temperatures
selected to perform the stability tests, the formation of hydrocarbons is negligible
under wet feed conditions as can been seen in Fig. 5.17. Thus, a possible reason for
0 5 10 15 20 25 30 35 40
0
20
40
60
80
100 HZSM-5 (11.5), T=280 oC
H2O
content (%)
0
10
Time-on-stream (h)
XM
eO
H (
%)
0 5 10 15 20 25 30 35 40
0
20
40
60
80
100 HZSM-5 (25) , T=240 oC
H2O
content (%)
0
10
Time-on-stream (h)
XM
eO
H (
%)
0 5 10 15 20 25 30 35 40
0
20
40
60
80
100 ZSM-5 (40), T=240oC
H2O
content (%)
0
10
Time-on-stream (h)
XM
eO
H (
%)
0 5 10 15 20 25 30 35 40
0
20
40
60
80
100 Silicalite, T=330oC
H2O
content (%)
0
10
Time-on-stream (h)
XM
eO
H (
%)
168
this irreversible deactivation could be the framework dealumination of zeolites, even
under these mild hydrothermal conditions, which may lead to changes in their acidic
properties, i.e. decrease of the Brönsted acid sites associated with the framework
Si(OH)Al bridging hydroxyls.
5.4.2 Zeolites Y
5.4.2.1 Catalytic performance in the absence of H2O in the feed
Results of catalytic performance tests obtained over the four Y zeolites
investigated are presented in Fig. 5.22, where the conversion of methanol (Fig. 5.22A)
and selectivity toward DME (Fig. 5.22B) are plotted as functions of reaction
temperature. It is observed that the NaY(2.55) zeolite is practically inactive in the
temperature range of interest, with XMeOH reaching a value of only 30% at 445 oC (Fig.
5.22A). The low activity of this sample can be related to its low acidity (Table 5.1).
This is supported by the fact that the more acidic HY(2.55) catalyst, which has
the same Si/Al ratio, and has resulted from the Na-Y zeolite by ion-exchange, is
significantly more active. This sample exhibits measurable activity at temperatures
lower than 200 oC and reaches equilibrium conversion at ca. 380 oC. A similar
conversion curve, with higher conversions at intermediate temperatures, was obtained
for the ultra-stable USY(6) catalyst. Interestingly, an increase of the bulk Si/Al ratio of
the USY zeolites from 6 to 40 results in a significant decrease of catalytic activity. This
is evidenced by the shift of the MeOH conversion curve obtained for USY(40) to higher
temperatures by more than 60 oC, compared to USY(6) (Fig. 5.22A).
Regarding selectivity to reaction products, results presented in Fig. 5.22B show
that the H-Y zeolite is 100% selective towards DME at temperatures up to ca. 270-
280oC, where conversion of methanol is relatively low (~30%). These values are
significantly lower, compared to the ~100% selectivity and 80-90% conversion obtained
over the ZSM-5 zeolites at the same temperature. However, high conversion-selectivity
levels were obtained over the USY(6) zeolite at higher temperatures (~345oC), while the
USY(40) catalyst exhibited a lower conversion of ca. 60% for maximum selectivity of
100% at ~380oC.
Results of kinetic measurements obtained over Y zeolite catalysts are
summarized in the Arrhenius plot of Fig. 5.22C, where reaction rates are expressed
per gram of catalyst. It is observed that the HY(2.55) and USY(6) catalysts have similar
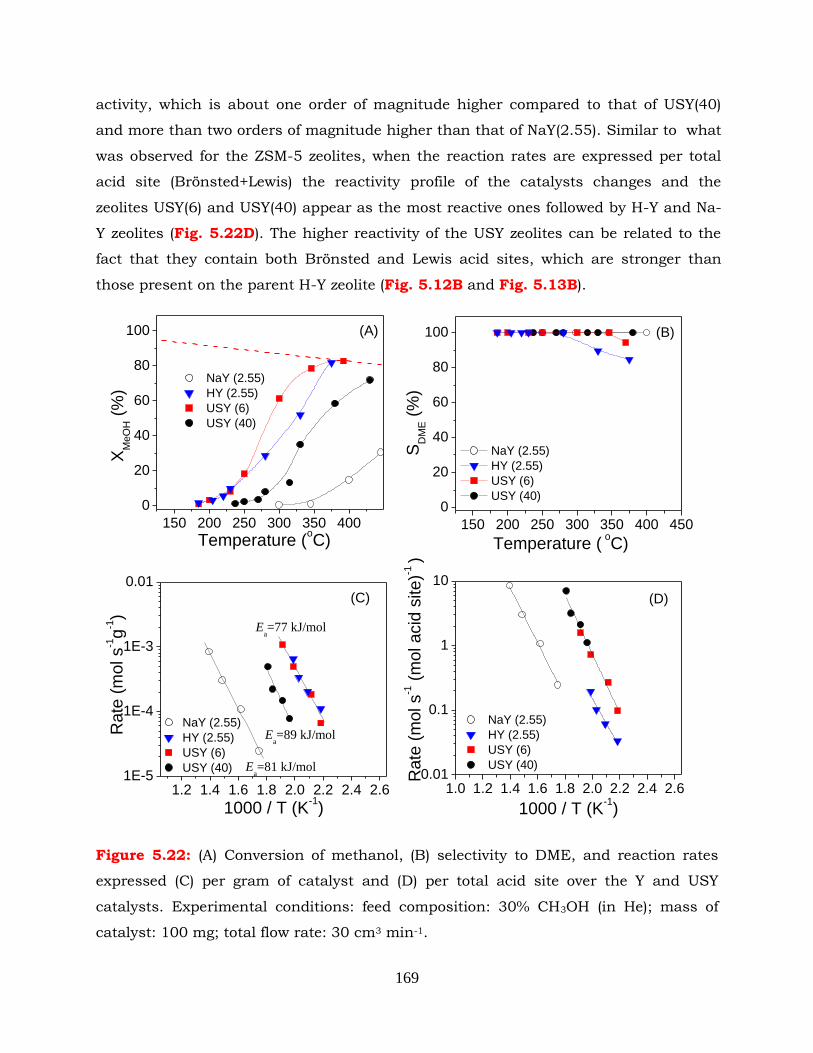
169
activity, which is about one order of magnitude higher compared to that of USY(40)
and more than two orders of magnitude higher than that of NaY(2.55). Similar to what
was observed for the ZSM-5 zeolites, when the reaction rates are expressed per total
acid site (Brönsted+Lewis) the reactivity profile of the catalysts changes and the
zeolites USY(6) and USY(40) appear as the most reactive ones followed by H-Y and Na-
Y zeolites (Fig. 5.22D). The higher reactivity of the USY zeolites can be related to the
fact that they contain both Brönsted and Lewis acid sites, which are stronger than
those present on the parent H-Y zeolite (Fig. 5.12B and Fig. 5.13B).
Figure 5.22: (A) Conversion of methanol, (B) selectivity to DME, and reaction rates
expressed (C) per gram of catalyst and (D) per total acid site over the Y and USY
catalysts. Experimental conditions: feed composition: 30% CH3OH (in He); mass of
catalyst: 100 mg; total flow rate: 30 cm3 min-1.
150 200 250 300 350 400
0
20
40
60
80
100 (A)
NaY (2.55)
HY (2.55)
USY (6)
USY (40)
XM
eO
H (
%)
Temperature (oC)
150 200 250 300 350 400 450
0
20
40
60
80
100 (B)
NaY (2.55)
HY (2.55)
USY (6)
USY (40)
Temperature ( oC)
SD
ME (
%)
1.0 1.2 1.4 1.6 1.8 2.0 2.2 2.4 2.60.01
0.1
1
10
Rate
(m
ol s
-1 (
mol acid
site)-1
)
(D)
NaY (2.55)
HY (2.55)
USY (6)
USY (40)
1000 / T (K-1)
1.2 1.4 1.6 1.8 2.0 2.2 2.4 2.61E-5
1E-4
1E-3
0.01
Ea=77 kJ/mol
Ea=89 kJ/mol
Ea=81 kJ/mol
(C)
NaY (2.55)
HY (2.55)
USY (6)
USY (40)
Rate
(m
ol s
-1g
-1)
1000 / T (K-1)
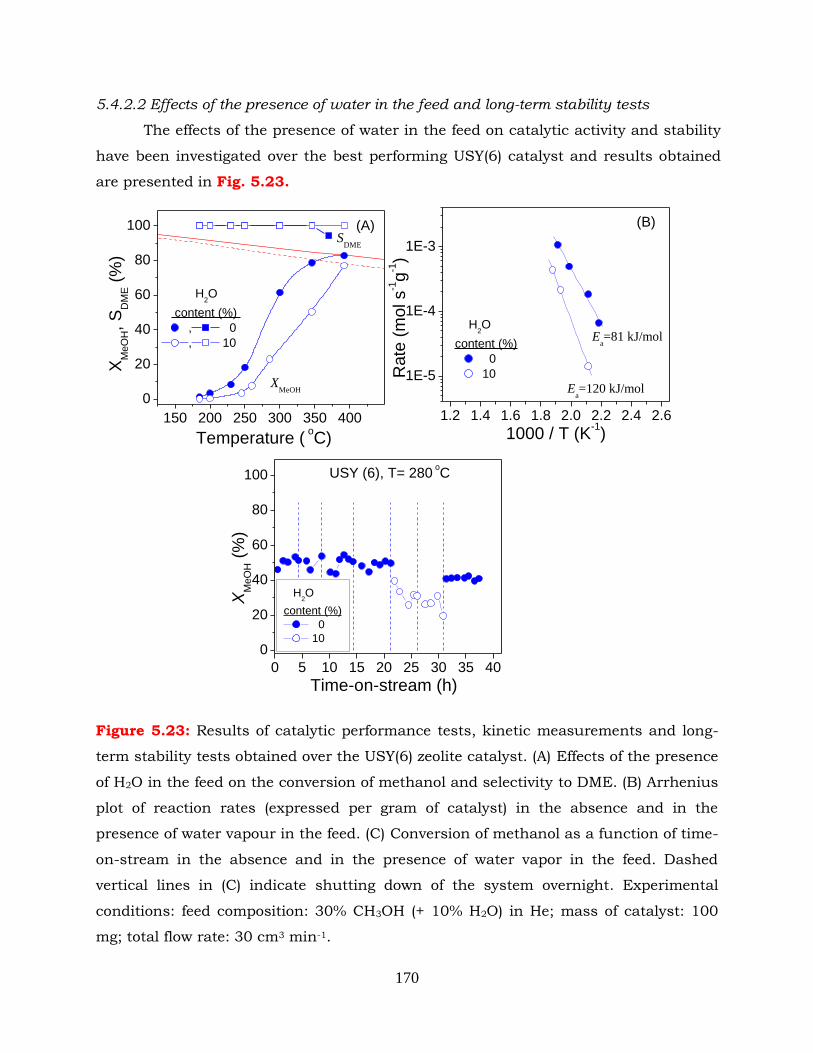
170
5.4.2.2 Effects of the presence of water in the feed and long-term stability tests
The effects of the presence of water in the feed on catalytic activity and stability
have been investigated over the best performing USY(6) catalyst and results obtained
are presented in Fig. 5.23.
Figure 5.23: Results of catalytic performance tests, kinetic measurements and long-
term stability tests obtained over the USY(6) zeolite catalyst. (A) Effects of the presence
of H2O in the feed on the conversion of methanol and selectivity to DME. (B) Arrhenius
plot of reaction rates (expressed per gram of catalyst) in the absence and in the
presence of water vapour in the feed. (C) Conversion of methanol as a function of time-
on-stream in the absence and in the presence of water vapor in the feed. Dashed
vertical lines in (C) indicate shutting down of the system overnight. Experimental
conditions: feed composition: 30% CH3OH (+ 10% H2O) in He; mass of catalyst: 100
mg; total flow rate: 30 cm3 min-1.
1.2 1.4 1.6 1.8 2.0 2.2 2.4 2.6
1E-5
1E-4
1E-3
H2O
content (%)
0
10
Ea=120 kJ/mol
Ea=81 kJ/mol
(B)
Rate
(m
ol s
-1g
-1)
1000 / T (K-1)
0 5 10 15 20 25 30 35 40
0
20
40
60
80
100 USY (6), T= 280 oC
H2O
content (%)
0
10
Time-on-stream (h)
XM
eO
H (
%)
150 200 250 300 350 400
0
20
40
60
80
100
H2O
content (%)
, 0
, 10
SDME
(A)
XMeOH
Temperature ( oC)
XM
eO
H,
SD
ME (
%)
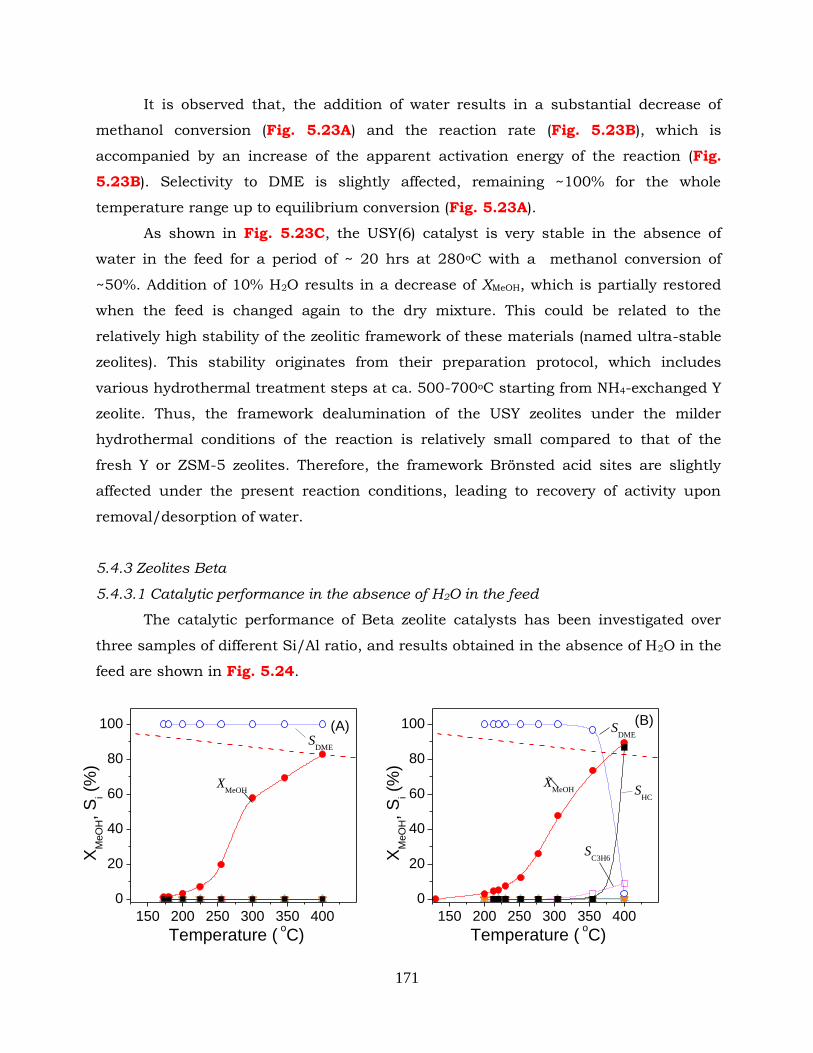
171
It is observed that, the addition of water results in a substantial decrease of
methanol conversion (Fig. 5.23A) and the reaction rate (Fig. 5.23B), which is
accompanied by an increase of the apparent activation energy of the reaction (Fig.
5.23B). Selectivity to DME is slightly affected, remaining ~100% for the whole
temperature range up to equilibrium conversion (Fig. 5.23A).
As shown in Fig. 5.23C, the USY(6) catalyst is very stable in the absence of
water in the feed for a period of ~ 20 hrs at 280oC with a methanol conversion of
~50%. Addition of 10% H2O results in a decrease of XMeOH, which is partially restored
when the feed is changed again to the dry mixture. This could be related to the
relatively high stability of the zeolitic framework of these materials (named ultra-stable
zeolites). This stability originates from their preparation protocol, which includes
various hydrothermal treatment steps at ca. 500-700oC starting from NH4-exchanged Y
zeolite. Thus, the framework dealumination of the USY zeolites under the milder
hydrothermal conditions of the reaction is relatively small compared to that of the
fresh Y or ZSM-5 zeolites. Therefore, the framework Brönsted acid sites are slightly
affected under the present reaction conditions, leading to recovery of activity upon
removal/desorption of water.
5.4.3 Zeolites Beta
5.4.3.1 Catalytic performance in the absence of H2O in the feed
The catalytic performance of Beta zeolite catalysts has been investigated over
three samples of different Si/Al ratio, and results obtained in the absence of H2O in the
feed are shown in Fig. 5.24.
150 200 250 300 350 400
0
20
40
60
80
100 (A)S
DME
XMeOH
Temperature ( oC)
XM
eO
H,
Si (
%)
150 200 250 300 350 400
0
20
40
60
80
100 (B)
SC3H6
SHC
SDME
XMeOH
Temperature ( oC)
XM
eO
H,
Si (
%)
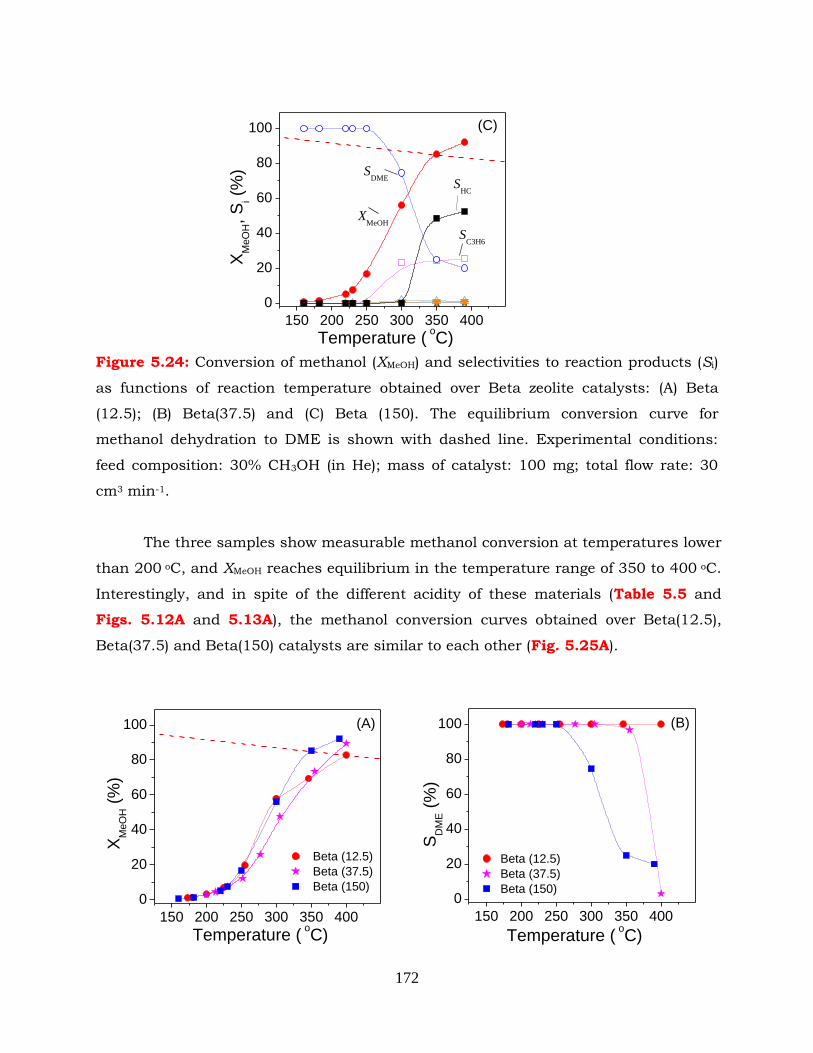
172
Figure 5.24: Conversion of methanol (XMeOH) and selectivities to reaction products (Si)
as functions of reaction temperature obtained over Beta zeolite catalysts: (A) Beta
(12.5); (B) Beta(37.5) and (C) Beta (150). The equilibrium conversion curve for
methanol dehydration to DME is shown with dashed line. Experimental conditions:
feed composition: 30% CH3OH (in He); mass of catalyst: 100 mg; total flow rate: 30
cm3 min-1.
The three samples show measurable methanol conversion at temperatures lower
than 200 oC, and XMeOH reaches equilibrium in the temperature range of 350 to 400 oC.
Interestingly, and in spite of the different acidity of these materials (Table 5.5 and
Figs. 5.12A and 5.13A), the methanol conversion curves obtained over Beta(12.5),
Beta(37.5) and Beta(150) catalysts are similar to each other (Fig. 5.25A).
150 200 250 300 350 400
0
20
40
60
80
100
SC3H6
SHC
SDME
XMeOH
Temperature ( oC)
XM
eO
H,
Si (
%)
(C)
150 200 250 300 350 400
0
20
40
60
80
100 (A)
Beta (12.5)
Beta (37.5)
Beta (150)
XM
eO
H (
%)
Temperature ( oC)
150 200 250 300 350 400
0
20
40
60
80
100 (B)
Beta (12.5)
Beta (37.5)
Beta (150)
Temperature ( oC)
SD
ME (
%)
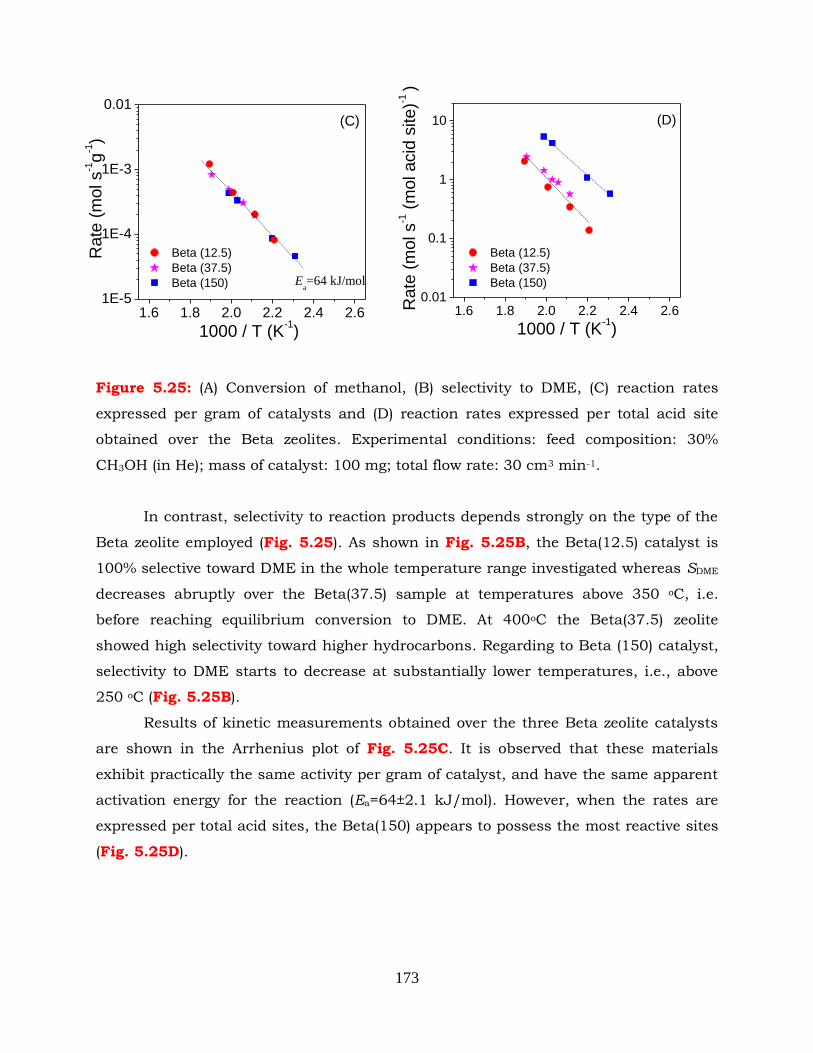
173
Figure 5.25: (A) Conversion of methanol, (B) selectivity to DME, (C) reaction rates
expressed per gram of catalysts and (D) reaction rates expressed per total acid site
obtained over the Beta zeolites. Experimental conditions: feed composition: 30%
CH3OH (in He); mass of catalyst: 100 mg; total flow rate: 30 cm3 min-1.
In contrast, selectivity to reaction products depends strongly on the type of the
Beta zeolite employed (Fig. 5.25). As shown in Fig. 5.25B, the Beta(12.5) catalyst is
100% selective toward DME in the whole temperature range investigated whereas SDME
decreases abruptly over the Beta(37.5) sample at temperatures above 350 oC, i.e.
before reaching equilibrium conversion to DME. At 400oC the Beta(37.5) zeolite
showed high selectivity toward higher hydrocarbons. Regarding to Beta (150) catalyst,
selectivity to DME starts to decrease at substantially lower temperatures, i.e., above
250 oC (Fig. 5.25B).
Results of kinetic measurements obtained over the three Beta zeolite catalysts
are shown in the Arrhenius plot of Fig. 5.25C. It is observed that these materials
exhibit practically the same activity per gram of catalyst, and have the same apparent
activation energy for the reaction (Ea=64±2.1 kJ/mol). However, when the rates are
expressed per total acid sites, the Beta(150) appears to possess the most reactive sites
(Fig. 5.25D).
1.6 1.8 2.0 2.2 2.4 2.61E-5
1E-4
1E-3
0.01
Ea=64 kJ/mol
(C)
Beta (12.5)
Beta (37.5)
Beta (150)
Rate
(m
ol s
-1g
-1)
1000 / T (K-1)
1.6 1.8 2.0 2.2 2.4 2.60.01
0.1
1
10
Rate
(m
ol s
-1 (
mol acid
site)-1
)
(D)
Beta (12.5)
Beta (37.5)
Beta (150)
1000 / T (K-1)
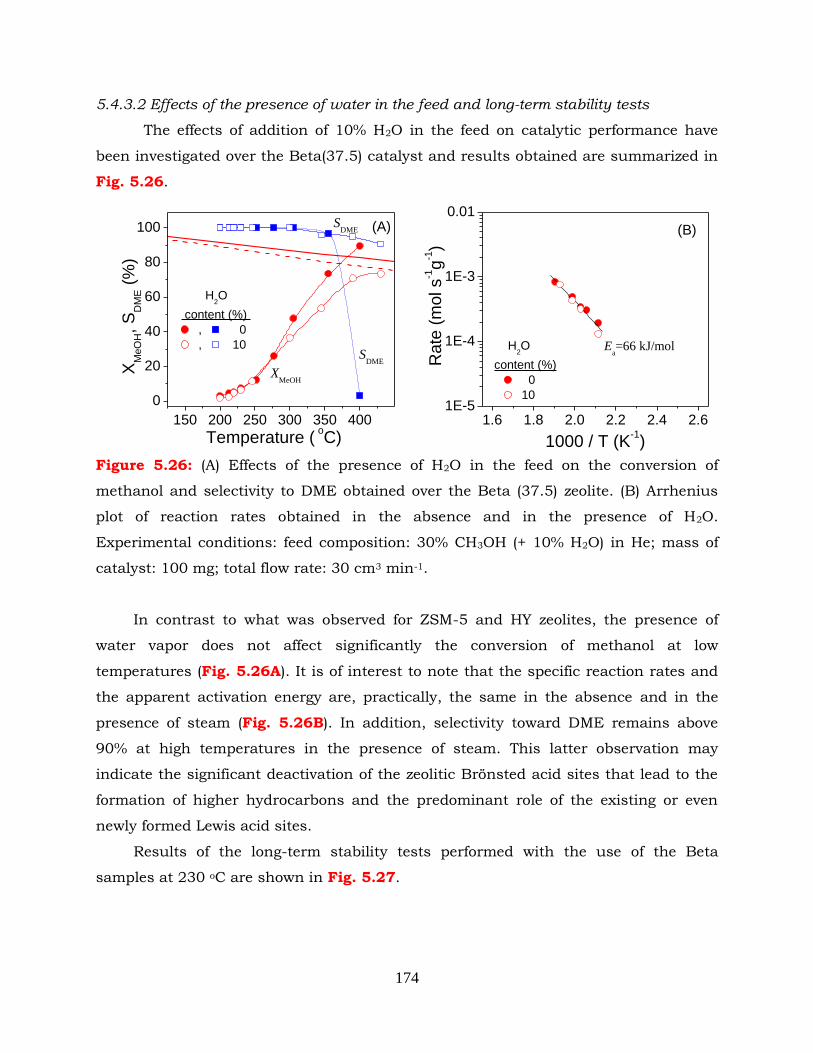
174
5.4.3.2 Effects of the presence of water in the feed and long-term stability tests
The effects of addition of 10% H2O in the feed on catalytic performance have
been investigated over the Beta(37.5) catalyst and results obtained are summarized in
Fig. 5.26.
Figure 5.26: (A) Effects of the presence of H2O in the feed on the conversion of
methanol and selectivity to DME obtained over the Beta (37.5) zeolite. (B) Arrhenius
plot of reaction rates obtained in the absence and in the presence of H2O.
Experimental conditions: feed composition: 30% CH3OH (+ 10% H2O) in He; mass of
catalyst: 100 mg; total flow rate: 30 cm3 min-1.
In contrast to what was observed for ZSM-5 and HY zeolites, the presence of
water vapor does not affect significantly the conversion of methanol at low
temperatures (Fig. 5.26A). It is of interest to note that the specific reaction rates and
the apparent activation energy are, practically, the same in the absence and in the
presence of steam (Fig. 5.26B). In addition, selectivity toward DME remains above
90% at high temperatures in the presence of steam. This latter observation may
indicate the significant deactivation of the zeolitic Brönsted acid sites that lead to the
formation of higher hydrocarbons and the predominant role of the existing or even
newly formed Lewis acid sites.
Results of the long-term stability tests performed with the use of the Beta
samples at 230 oC are shown in Fig. 5.27.
150 200 250 300 350 400
0
20
40
60
80
100
H2O
content (%)
, 0
, 10
SDME (A)
SDME
XMeOH
Temperature ( oC)
XM
eO
H,
SD
ME (
%)
1.6 1.8 2.0 2.2 2.4 2.61E-5
1E-4
1E-3
0.01
Ea=66 kJ/mol
(B)
H2O
content (%)
0
10
Rate
(m
ol s
-1g
-1)
1000 / T (K-1)
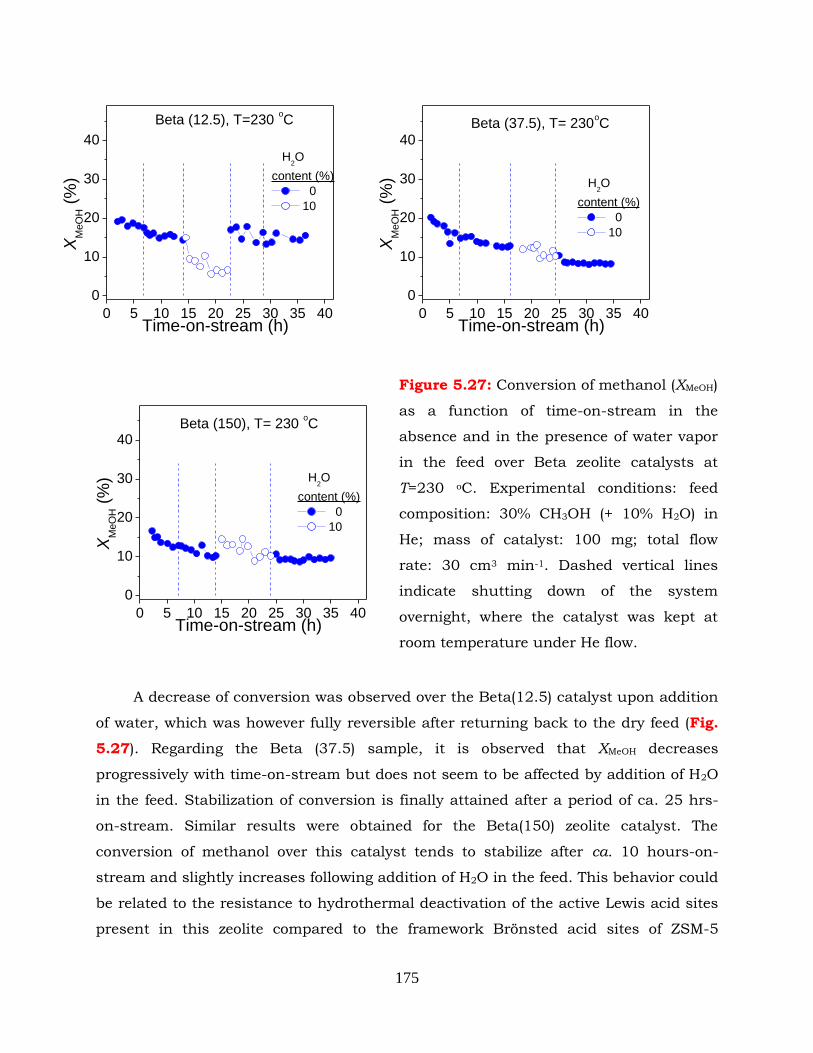
175
A decrease of conversion was observed over the Beta(12.5) catalyst upon addition
of water, which was however fully reversible after returning back to the dry feed (Fig.
5.27). Regarding the Beta (37.5) sample, it is observed that XMeOH decreases
progressively with time-on-stream but does not seem to be affected by addition of H2O
in the feed. Stabilization of conversion is finally attained after a period of ca. 25 hrs-
on-stream. Similar results were obtained for the Beta(150) zeolite catalyst. The
conversion of methanol over this catalyst tends to stabilize after ca. 10 hours-on-
stream and slightly increases following addition of H2O in the feed. This behavior could
be related to the resistance to hydrothermal deactivation of the active Lewis acid sites
present in this zeolite compared to the framework Brönsted acid sites of ZSM-5
Figure 5.27: Conversion of methanol (XMeOH)
as a function of time-on-stream in the
absence and in the presence of water vapor
in the feed over Beta zeolite catalysts at
T=230 oC. Experimental conditions: feed
composition: 30% CH3OH (+ 10% H2O) in
He; mass of catalyst: 100 mg; total flow
rate: 30 cm3 min-1. Dashed vertical lines
indicate shutting down of the system
overnight, where the catalyst was kept at
room temperature under He flow.
0 5 10 15 20 25 30 35 40
0
10
20
30
40Beta (37.5), T= 230
oC
H2O
content (%)
0
10
Time-on-stream (h)
XM
eO
H (
%)
0 5 10 15 20 25 30 35 40
0
10
20
30
40
Beta (12.5), T=230 oC
H2O
content (%)
0
10
Time-on-stream (h)
XM
eO
H (
%)
0 5 10 15 20 25 30 35 40
0
10
20
30
40Beta (150), T= 230
oC
H2O
content (%)
0
10
Time-on-stream (h)
XM
eO
H (
%)
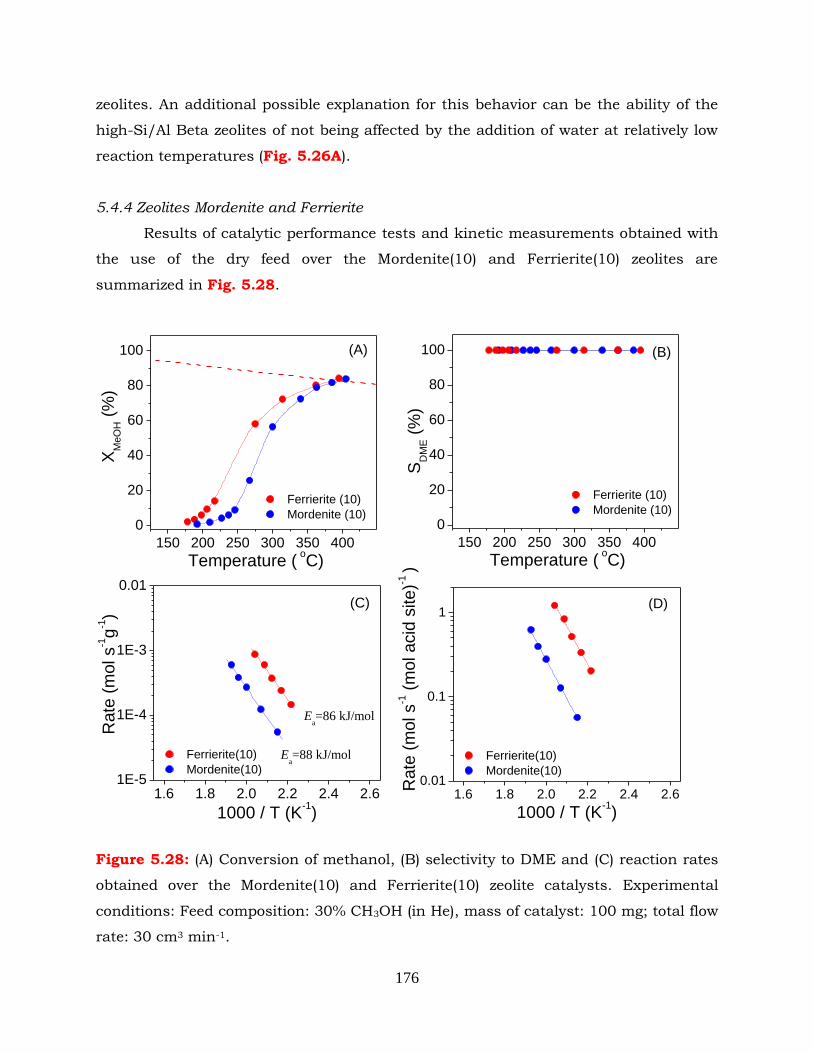
176
zeolites. An additional possible explanation for this behavior can be the ability of the
high-Si/Al Beta zeolites of not being affected by the addition of water at relatively low
reaction temperatures (Fig. 5.26A).
5.4.4 Zeolites Mordenite and Ferrierite
Results of catalytic performance tests and kinetic measurements obtained with
the use of the dry feed over the Mordenite(10) and Ferrierite(10) zeolites are
summarized in Fig. 5.28.
Figure 5.28: (A) Conversion of methanol, (B) selectivity to DME and (C) reaction rates
obtained over the Mordenite(10) and Ferrierite(10) zeolite catalysts. Experimental
conditions: Feed composition: 30% CH3OH (in He), mass of catalyst: 100 mg; total flow
rate: 30 cm3 min-1.
150 200 250 300 350 400
0
20
40
60
80
100 (A)
Ferrierite (10)
Mordenite (10)
XM
eO
H (
%)
Temperature ( oC)
150 200 250 300 350 400
0
20
40
60
80
100 (B)
Ferrierite (10)
Mordenite (10)
Temperature ( oC)
SD
ME (
%)
1.6 1.8 2.0 2.2 2.4 2.61E-5
1E-4
1E-3
0.01
Ea=88 kJ/mol
Ea=86 kJ/mol
(C)
Ferrierite(10)
Mordenite(10)
Rate
(m
ol s
-1g
-1)
1000 / T (K-1)
1.6 1.8 2.0 2.2 2.4 2.60.01
0.1
1
Rate
(m
ol s
-1 (
mol acid
site)-1
)
(D)
Ferrierite(10)
Mordenite(10)
1000 / T (K-1)
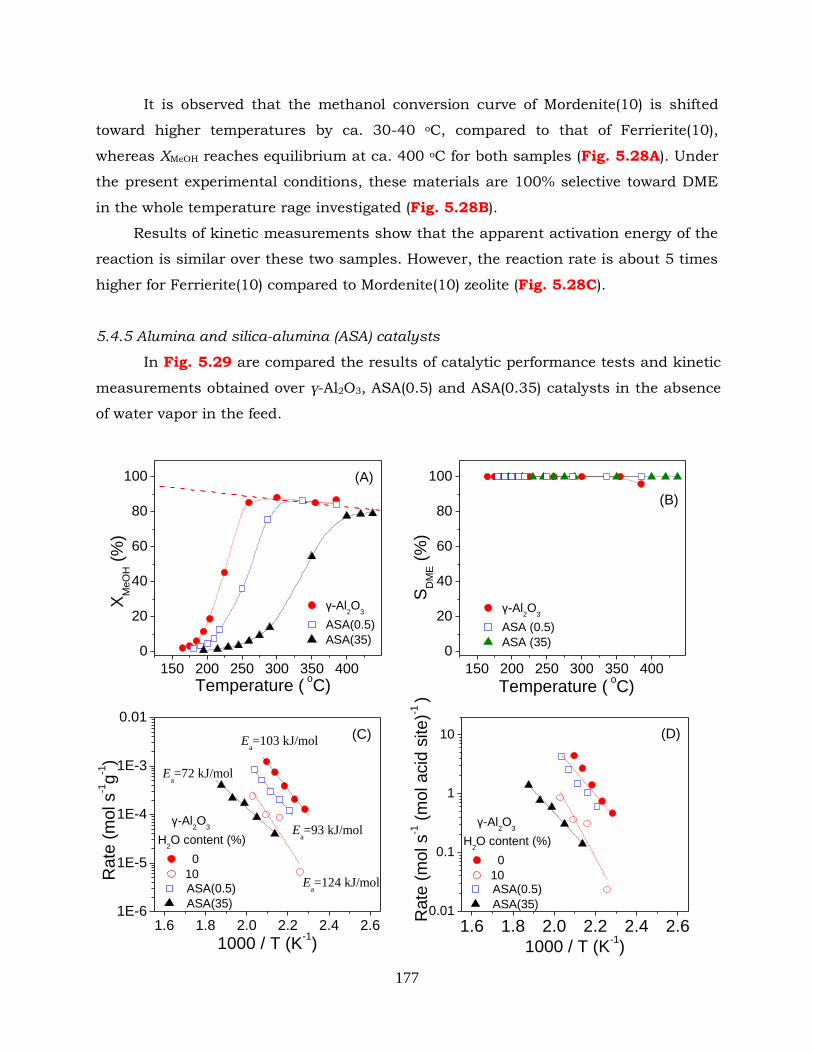
177
It is observed that the methanol conversion curve of Mordenite(10) is shifted
toward higher temperatures by ca. 30-40 oC, compared to that of Ferrierite(10),
whereas XMeOH reaches equilibrium at ca. 400 oC for both samples (Fig. 5.28A). Under
the present experimental conditions, these materials are 100% selective toward DME
in the whole temperature rage investigated (Fig. 5.28B).
Results of kinetic measurements show that the apparent activation energy of the
reaction is similar over these two samples. However, the reaction rate is about 5 times
higher for Ferrierite(10) compared to Mordenite(10) zeolite (Fig. 5.28C).
5.4.5 Alumina and silica-alumina (ASA) catalysts
In Fig. 5.29 are compared the results of catalytic performance tests and kinetic
measurements obtained over γ-Al2O3, ASA(0.5) and ASA(0.35) catalysts in the absence
of water vapor in the feed.
150 200 250 300 350 400
0
20
40
60
80
100 (A)
γ-Al2O
3
ASA(0.5)
ASA(35)
XM
eO
H (
%)
Temperature ( oC)
150 200 250 300 350 400
0
20
40
60
80
100
(B)
γ-Al2O
3
ASA (0.5)
ASA (35)
Temperature ( oC)
SD
ME (
%)
1.6 1.8 2.0 2.2 2.4 2.60.01
0.1
1
10
Rate
(m
ol s
-1 (
mol acid
site)-1
)
(D)
1000 / T (K-1)
γ-Al2O
3
H2O content (%)
0
10 ASA(0.5)
ASA(35)
1.6 1.8 2.0 2.2 2.4 2.61E-6
1E-5
1E-4
1E-3
0.01
Ea=124 kJ/mol
γ-Al2O
3
H2O content (%)
0
10
ASA(0.5)
ASA(35)
Ea=72 kJ/mol
Ea=93 kJ/mol
Ea=103 kJ/mol
(C)
Rate
(m
ol s
-1g
-1)
1000 / T (K-1)
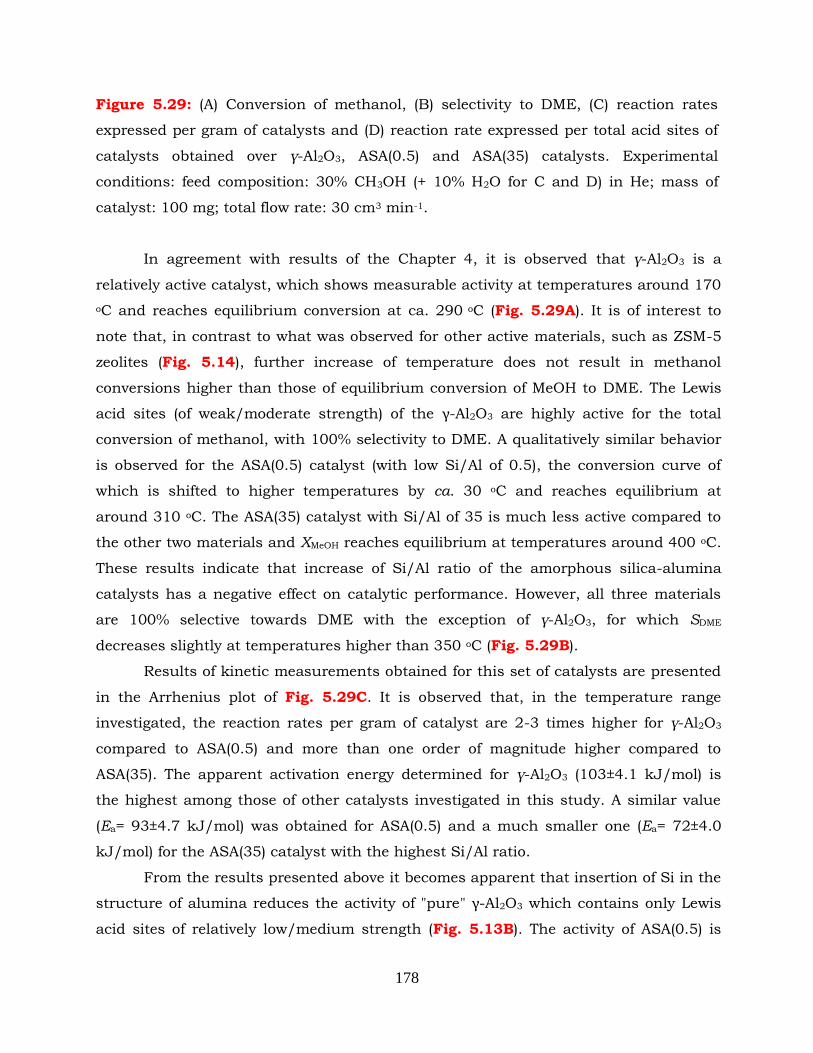
178
Figure 5.29: (A) Conversion of methanol, (B) selectivity to DME, (C) reaction rates
expressed per gram of catalysts and (D) reaction rate expressed per total acid sites of
catalysts obtained over γ-Al2O3, ASA(0.5) and ASA(35) catalysts. Experimental
conditions: feed composition: 30% CH3OH (+ 10% H2O for C and D) in He; mass of
catalyst: 100 mg; total flow rate: 30 cm3 min-1.
In agreement with results of the Chapter 4, it is observed that γ-Al2O3 is a
relatively active catalyst, which shows measurable activity at temperatures around 170
oC and reaches equilibrium conversion at ca. 290 oC (Fig. 5.29A). It is of interest to
note that, in contrast to what was observed for other active materials, such as ZSM-5
zeolites (Fig. 5.14), further increase of temperature does not result in methanol
conversions higher than those of equilibrium conversion of MeOH to DME. The Lewis
acid sites (of weak/moderate strength) of the γ-Al2O3 are highly active for the total
conversion of methanol, with 100% selectivity to DME. A qualitatively similar behavior
is observed for the ASA(0.5) catalyst (with low Si/Al of 0.5), the conversion curve of
which is shifted to higher temperatures by ca. 30 oC and reaches equilibrium at
around 310 oC. The ASA(35) catalyst with Si/Al of 35 is much less active compared to
the other two materials and XMeOH reaches equilibrium at temperatures around 400 oC.
These results indicate that increase of Si/Al ratio of the amorphous silica-alumina
catalysts has a negative effect on catalytic performance. However, all three materials
are 100% selective towards DME with the exception of γ-Al2O3, for which SDME
decreases slightly at temperatures higher than 350 oC (Fig. 5.29B).
Results of kinetic measurements obtained for this set of catalysts are presented
in the Arrhenius plot of Fig. 5.29C. It is observed that, in the temperature range
investigated, the reaction rates per gram of catalyst are 2-3 times higher for γ-Al2O3
compared to ASA(0.5) and more than one order of magnitude higher compared to
ASA(35). The apparent activation energy determined for γ-Al2O3 (103±4.1 kJ/mol) is
the highest among those of other catalysts investigated in this study. A similar value
(Ea= 93±4.7 kJ/mol) was obtained for ASA(0.5) and a much smaller one (Ea= 72±4.0
kJ/mol) for the ASA(35) catalyst with the highest Si/Al ratio.
From the results presented above it becomes apparent that insertion of Si in the
structure of alumina reduces the activity of "pure" γ-Al2O3 which contains only Lewis
acid sites of relatively low/medium strength (Fig. 5.13B). The activity of ASA(0.5) is
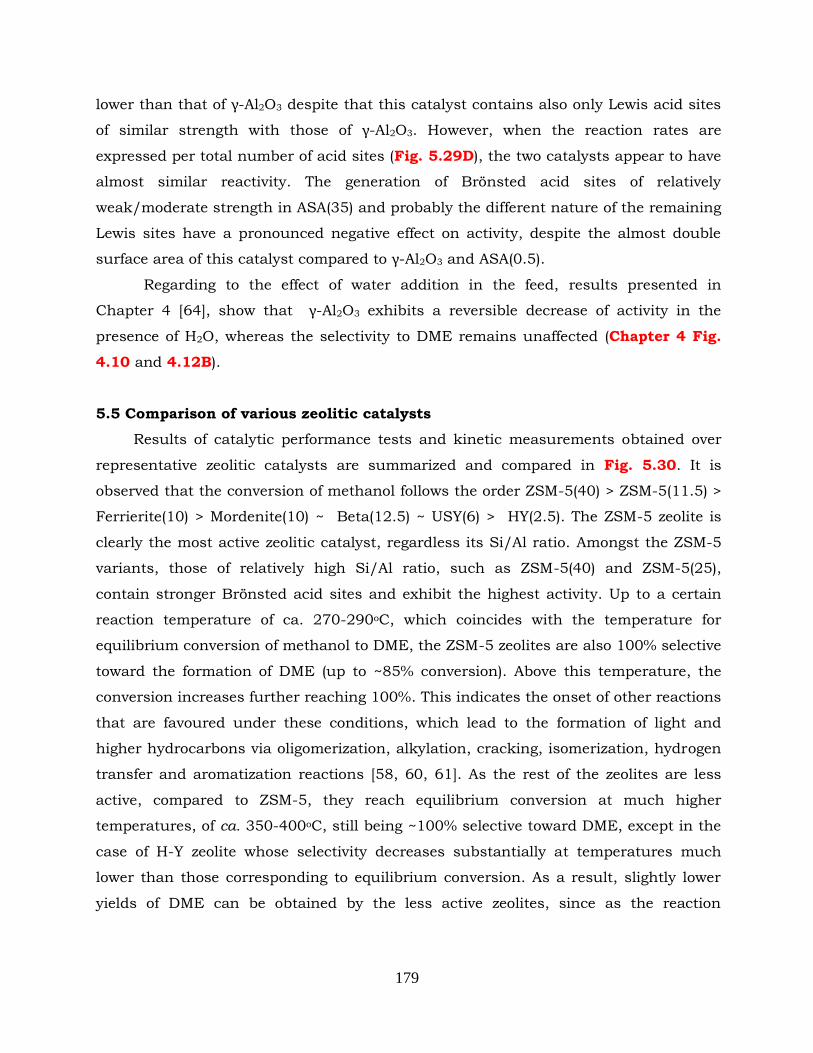
179
lower than that of γ-Αl2O3 despite that this catalyst contains also only Lewis acid sites
of similar strength with those of γ-Αl2O3. However, when the reaction rates are
expressed per total number of acid sites (Fig. 5.29D), the two catalysts appear to have
almost similar reactivity. The generation of Brönsted acid sites of relatively
weak/moderate strength in ASA(35) and probably the different nature of the remaining
Lewis sites have a pronounced negative effect on activity, despite the almost double
surface area of this catalyst compared to γ-Αl2O3 and ASA(0.5).
Regarding to the effect of water addition in the feed, results presented in
Chapter 4 [64], show that γ-Al2O3 exhibits a reversible decrease of activity in the
presence of H2O, whereas the selectivity to DME remains unaffected (Chapter 4 Fig.
4.10 and 4.12B).
5.5 Comparison of various zeolitic catalysts
Results of catalytic performance tests and kinetic measurements obtained over
representative zeolitic catalysts are summarized and compared in Fig. 5.30. It is
observed that the conversion of methanol follows the order ZSM-5(40) > ZSM-5(11.5) >
Ferrierite(10) > Mordenite(10) ~ Beta(12.5) ~ USY(6) > HY(2.5). The ZSM-5 zeolite is
clearly the most active zeolitic catalyst, regardless its Si/Al ratio. Amongst the ZSM-5
variants, those of relatively high Si/Al ratio, such as ZSM-5(40) and ZSM-5(25),
contain stronger Brönsted acid sites and exhibit the highest activity. Up to a certain
reaction temperature of ca. 270-290oC, which coincides with the temperature for
equilibrium conversion of methanol to DME, the ZSM-5 zeolites are also 100% selective
toward the formation of DME (up to ~85% conversion). Above this temperature, the
conversion increases further reaching 100%. This indicates the onset of other reactions
that are favoured under these conditions, which lead to the formation of light and
higher hydrocarbons via oligomerization, alkylation, cracking, isomerization, hydrogen
transfer and aromatization reactions [58, 60, 61]. As the rest of the zeolites are less
active, compared to ZSM-5, they reach equilibrium conversion at much higher
temperatures, of ca. 350-400oC, still being ~100% selective toward DME, except in the
case of H-Y zeolite whose selectivity decreases substantially at temperatures much
lower than those corresponding to equilibrium conversion. As a result, slightly lower
yields of DME can be obtained by the less active zeolites, since as the reaction
180
temperature increases the equilibrium conversion of methanol to DME drops from ca.
90% at 250oC to 85% at 400oC.
Figure 5.30: (A) Conversion of methanol, (B) selectivity to DME, (C) reaction rates
expressed per gram of catalysts and (D) reaction rates expressed per total acid sites
obtained over the zeolites ZSM-5(40), ZSM-5 (11.5), Ferrierite(10), Mordenite(10),
Beta(12.5), USY(6) and HY(2.55). Experimental conditions: feed composition: 30%
CH3OH (in He); mass of catalyst: 100 mg; total flow rate: 30 cm3 min-1.
The activity variation of the various zeolitic catalysts can be also revealed by
comparing the Arrhenius plots of reaction rates when expressed per gram of catalyst
150 200 250 300 350 400
0
20
40
60
80
100 (A)
ZSM-5 (40)
ZSM-5 (11.5)
USY (6)
HY (2.55)
Beta (12.5)
Ferrierite(10)
Mordenite(10)
Temperature ( oC)
XM
eO
H (
%)
150 200 250 300 350 400
0
20
40
60
80
100 (B)
Ferrierite(10)
Beta (12.5)
Mordenite(10)
USY (6)
HY (2.55)
ZSM-5 (40)
ZSM-5 (11.5)
Temperature ( oC)
SD
ME(%
)
1.9 2.0 2.1 2.2 2.3 2.4 2.5 2.61E-5
1E-4
1E-3
0.01
Ea=88 kJ/mol
Ea=74 kJ/mol
Ea=86 kJ/mol
Ea=57 kJ/mol
(C) ZSM-5 (40)
ZSM-5 (11.5)
Ferrierite(10)
USY (6)
Beta (12.5)
HY (2.55)
Mordenite(10)
Rate
(m
ol s
-1g
-1)
1000 / T (K-1)
1.9 2.0 2.1 2.2 2.3 2.4 2.5 2.6 2.70.01
0.1
1
10
Rate
(m
ol s
-1 (
mol acid
site)-1
)
(D)
ZSM-5 (40)
ZSM-5 (11.5)
Ferrierite(10)
USY (6)
Beta (12.5)
HY (2.55)
Mordenite(10)
1000 / T (K-1)
181
(Fig. 5.30C). Despite the clear differences in reactivity amongst the various zeolites,
the apparent activation energies (Ea) are not significantly different, thus indicating the
similar nature of active sites for the reaction under study. These sites could be either
Brönsted acid sites on the bridging hydroxyls of the zeolitic framework or extra-
framework Si or Si-Al oxy(hydro)oxide species acting as Lewis acid sites. The somehow
lower activation energy obtained over the ZSM-5 zeolites can be indicative that the
relatively stronger Brönsted acid sites of this type of zeolites are the most appropriate
for the dehydration of methanol to DME. An additional factor could be related with
favourable confinement effects induced within the ZSM-5 channel-like micropores of
~0.55 nm that may enhance diffusion and adsorption of methanol.
When the rates are expressed per total acid site (Fig. 5.30D), the reactivity of the
acid sites of the various zeolites can be qualitatively evaluated. It becomes clear that
the acid sites of ZSM-5(40) are the most reactive ones, even when compared to those of
ZSM-5(11.5), as discussed in the respective ZSM-5 section above. On the other hand,
the acid sites of H-Y and Mordenite zeolites appear to be the least reactive. A direct
comparison of the different microporous structures of the MFI, Beta, Mordenite and
Ferrierite zeolites, even for the catalyst samples with more or less similar Si/Al ratio of
ca. 10-12.5, would not be safe due to significant variations in the acidic properties of
these zeolites, i.e. number, strength and type (Brönsted or Lewis) of acid sites.
5.5.1 Correlation of reaction rates with acidity
The direct correlation of methanol dehydration reaction rates (expressed per gram
of catalyst) with the number of total acid sites of all the catalysts tested (including γ-
Al2O3 and ASA) is schematically depicted in Fig. 5.31. The rates are compared at the
standard temperature of 260oC at which all catalysts are ~ 100% selective towards
DME. In the same figure, the correlation of the reaction rates with the Brönsted to
Lewis acid sites ratio (B/L) is also shown. This latter correlation presents the
combined effect of Brönsted and Lewis acid sites on the reactivity of the catalysts. It
can be observed that the rate for ZSM-5 zeolites decreases with increasing total acid
sites, while it increases with increasing B/L ratio (Fig. 5.31 A and C). This is an
additional indication, in accordance with the discussion above, that the strong
Brönsted acid sites of ZSM-5 zeolites with relatively high Si/Al ratio (ca. 40) favour the
dehydration of methanol to DME, at least at the moderate temperature of 260oC.
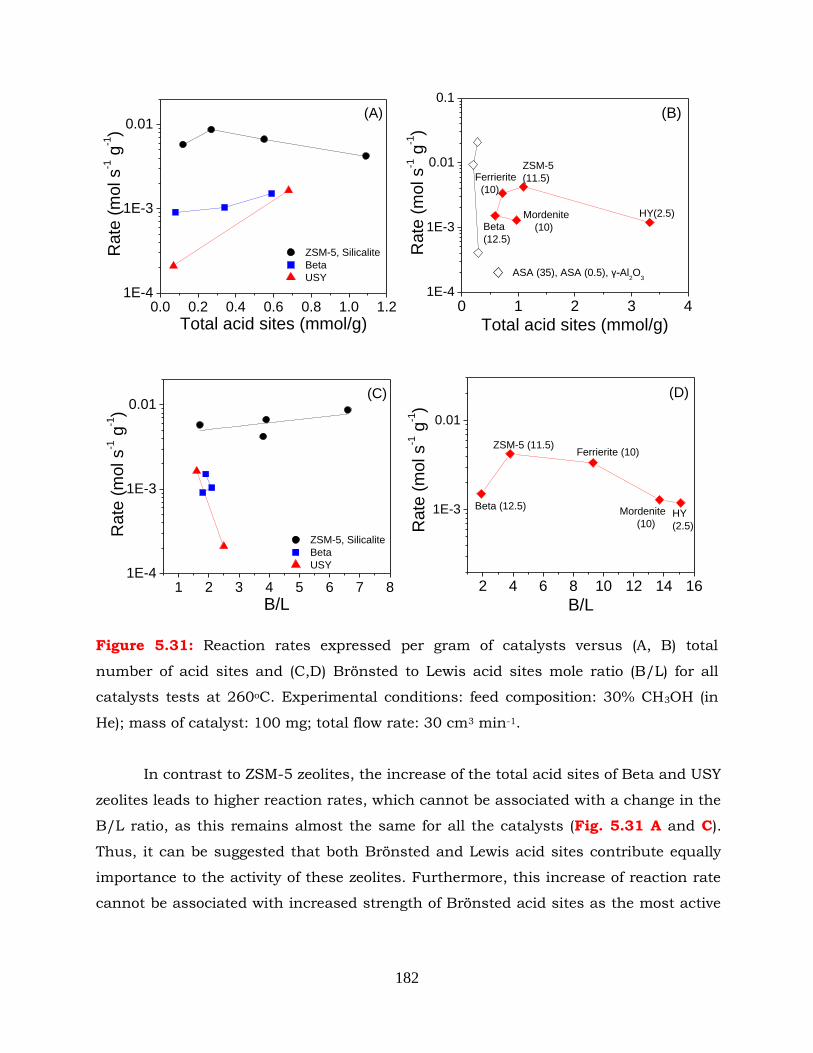
182
Figure 5.31: Reaction rates expressed per gram of catalysts versus (A, B) total
number of acid sites and (C,D) Brönsted to Lewis acid sites mole ratio (B/L) for all
catalysts tests at 260oC. Experimental conditions: feed composition: 30% CH3OH (in
He); mass of catalyst: 100 mg; total flow rate: 30 cm3 min-1.
In contrast to ZSM-5 zeolites, the increase of the total acid sites of Beta and USY
zeolites leads to higher reaction rates, which cannot be associated with a change in the
B/L ratio, as this remains almost the same for all the catalysts (Fig. 5.31 A and C).
Thus, it can be suggested that both Brönsted and Lewis acid sites contribute equally
importance to the activity of these zeolites. Furthermore, this increase of reaction rate
cannot be associated with increased strength of Brönsted acid sites as the most active
0.0 0.2 0.4 0.6 0.8 1.0 1.21E-4
1E-3
0.01
ZSM-5, Silicalite
Beta
USY
Rate
(m
ol s
-1 g
-1)
Total acid sites (mmol/g)
(A)
1 2 3 4 5 6 7 81E-4
1E-3
0.01
ZSM-5, Silicalite
Beta
USY
Rate
(m
ol s
-1 g
-1)
B/L
(C)
2 4 6 8 10 12 14 16
1E-3
0.01
HY
(2.5)
Mordenite
(10)
Ferrierite (10)ZSM-5 (11.5)
(D)
Rate
(m
ol s
-1 g
-1)
B/L
Beta (12.5)
0 1 2 3 41E-4
1E-3
0.01
0.1
(B)
ASA (35), ASA (0.5), γ-Al2O
3
Rate
(m
ol s
-1 g
-1)
Total acid sites (mmol/g)
Beta
(12.5)
ZSM-5
(11.5)Ferrierite
(10)
Mordenite
(10)
HY(2.5)
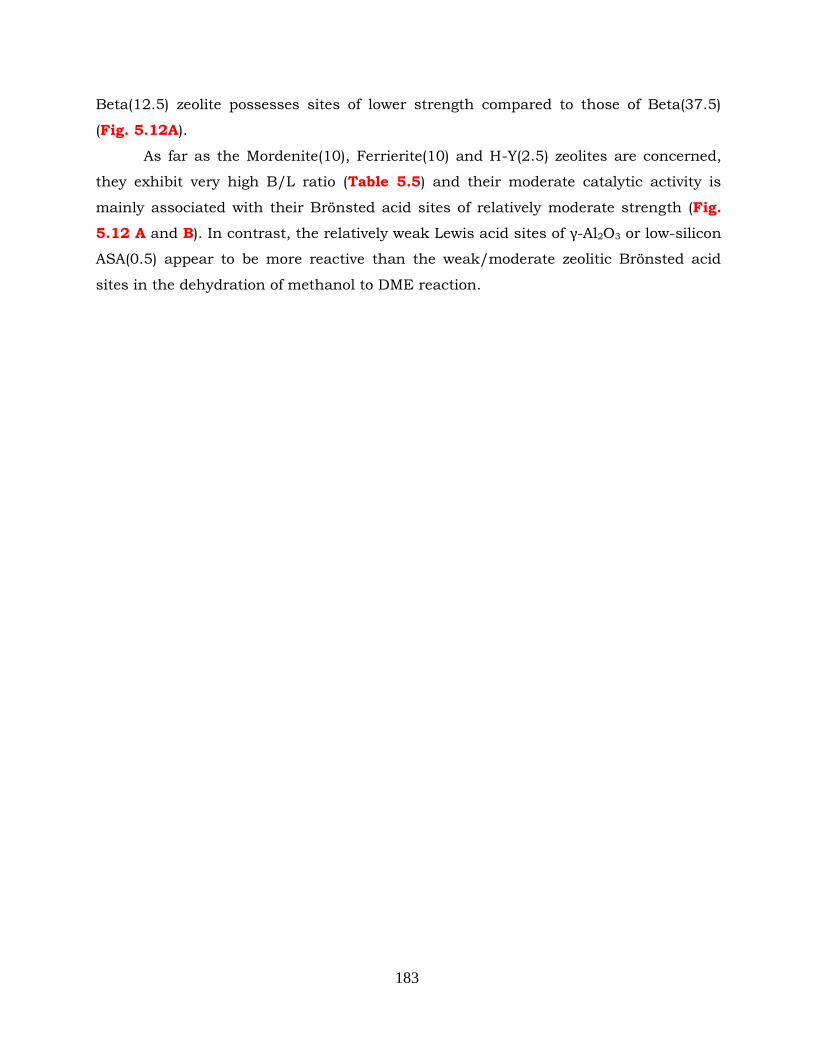
183
Beta(12.5) zeolite possesses sites of lower strength compared to those of Beta(37.5)
(Fig. 5.12A).
As far as the Mordenite(10), Ferrierite(10) and H-Y(2.5) zeolites are concerned,
they exhibit very high B/L ratio (Table 5.5) and their moderate catalytic activity is
mainly associated with their Brönsted acid sites of relatively moderate strength (Fig.
5.12 A and B). In contrast, the relatively weak Lewis acid sites of γ-Αl2O3 or low-silicon
ASA(0.5) appear to be more reactive than the weak/moderate zeolitic Brönsted acid
sites in the dehydration of methanol to DME reaction.
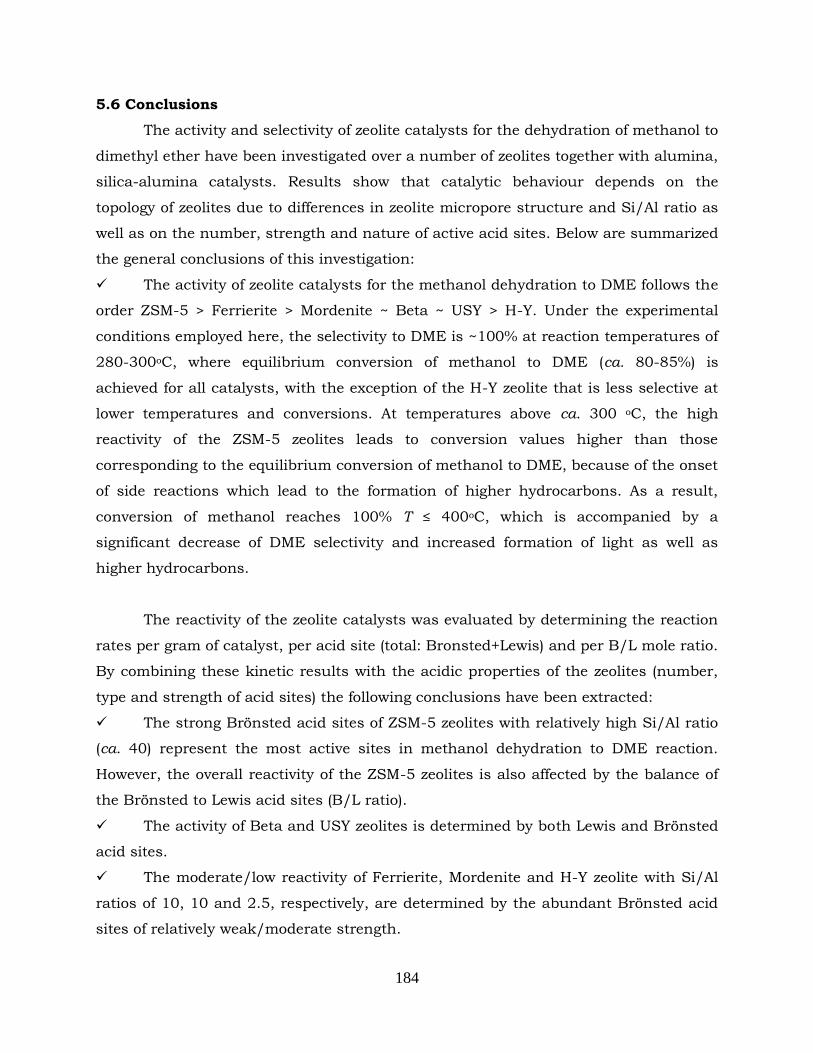
184
5.6 Conclusions
The activity and selectivity of zeolite catalysts for the dehydration of methanol to
dimethyl ether have been investigated over a number of zeolites together with alumina,
silica-alumina catalysts. Results show that catalytic behaviour depends on the
topology of zeolites due to differences in zeolite micropore structure and Si/Al ratio as
well as on the number, strength and nature of active acid sites. Below are summarized
the general conclusions of this investigation:
The activity of zeolite catalysts for the methanol dehydration to DME follows the
order ZSM-5 > Ferrierite > Mordenite ~ Beta ~ USY > H-Y. Under the experimental
conditions employed here, the selectivity to DME is ~100% at reaction temperatures of
280-300oC, where equilibrium conversion of methanol to DME (ca. 80-85%) is
achieved for all catalysts, with the exception of the H-Y zeolite that is less selective at
lower temperatures and conversions. At temperatures above ca. 300 oC, the high
reactivity of the ZSM-5 zeolites leads to conversion values higher than those
corresponding to the equilibrium conversion of methanol to DME, because of the onset
of side reactions which lead to the formation of higher hydrocarbons. As a result,
conversion of methanol reaches 100% T ≤ 400oC, which is accompanied by a
significant decrease of DME selectivity and increased formation of light as well as
higher hydrocarbons.
The reactivity of the zeolite catalysts was evaluated by determining the reaction
rates per gram of catalyst, per acid site (total: Bronsted+Lewis) and per B/L mole ratio.
By combining these kinetic results with the acidic properties of the zeolites (number,
type and strength of acid sites) the following conclusions have been extracted:
The strong Brönsted acid sites of ZSM-5 zeolites with relatively high Si/Al ratio
(ca. 40) represent the most active sites in methanol dehydration to DME reaction.
However, the overall reactivity of the ZSM-5 zeolites is also affected by the balance of
the Brönsted to Lewis acid sites (B/L ratio).
The activity of Beta and USY zeolites is determined by both Lewis and Brönsted
acid sites.
The moderate/low reactivity of Ferrierite, Mordenite and H-Y zeolite with Si/Al
ratios of 10, 10 and 2.5, respectively, are determined by the abundant Brönsted acid
sites of relatively weak/moderate strength.
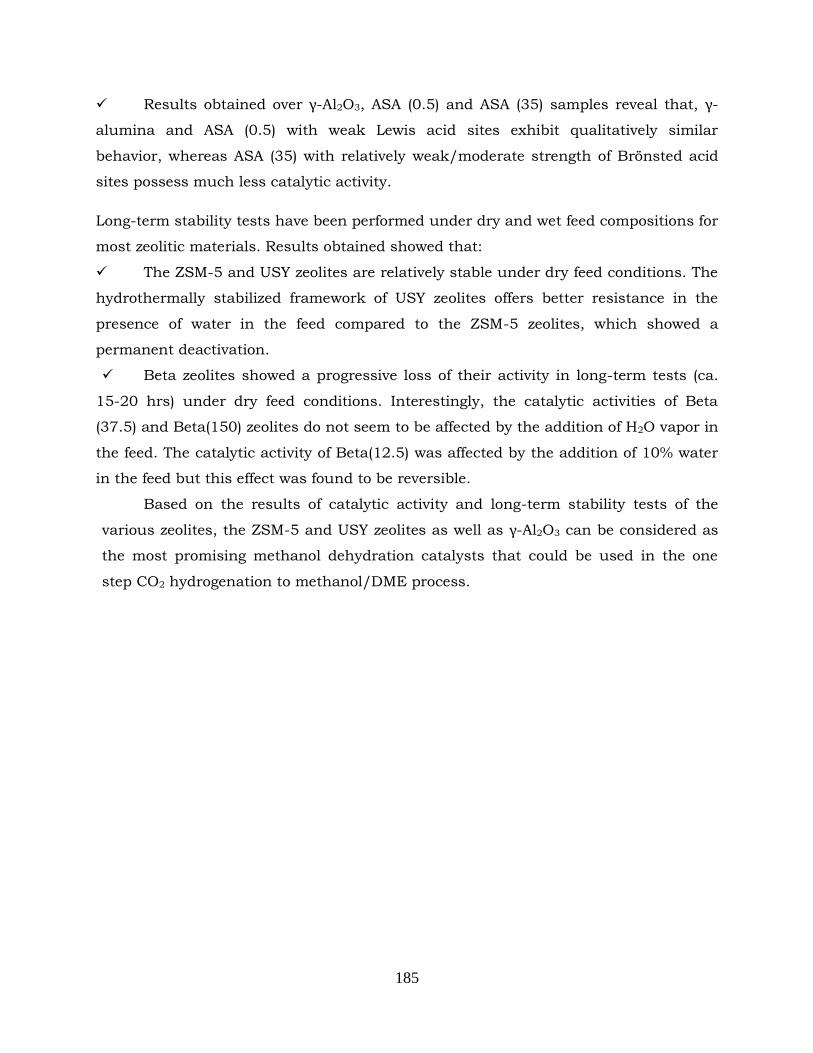
185
Results obtained over γ-Al2O3, ASA (0.5) and ASA (35) samples reveal that, γ-
alumina and ASA (0.5) with weak Lewis acid sites exhibit qualitatively similar
behavior, whereas ASA (35) with relatively weak/moderate strength of Brönsted acid
sites possess much less catalytic activity.
Long-term stability tests have been performed under dry and wet feed compositions for
most zeolitic materials. Results obtained showed that:
The ZSM-5 and USY zeolites are relatively stable under dry feed conditions. The
hydrothermally stabilized framework of USY zeolites offers better resistance in the
presence of water in the feed compared to the ZSM-5 zeolites, which showed a
permanent deactivation.
Beta zeolites showed a progressive loss of their activity in long-term tests (ca.
15-20 hrs) under dry feed conditions. Interestingly, the catalytic activities of Beta
(37.5) and Beta(150) zeolites do not seem to be affected by the addition of H2O vapor in
the feed. The catalytic activity of Beta(12.5) was affected by the addition of 10% water
in the feed but this effect was found to be reversible.
Based on the results of catalytic activity and long-term stability tests of the
various zeolites, the ZSM-5 and USY zeolites as well as γ-Al2O3 can be considered as
the most promising methanol dehydration catalysts that could be used in the one
step CO2 hydrogenation to methanol/DME process.
186
5.7 References
[1] S. M.Auerbach, K.A. Carrado, P.K. Dutta (Eds.), "Handbook of Zeolite Science and
Technology", Marcel Dekker Inc., 2003.
[2] M. Niwa, N. Katada, K. Okumura, "Characterization and Design of Zeolite Catalysts:
Solid Acidity, Shape Selectivity and Loading Properties", Springer Series in Materials
Science 141, 2010.
[3] I. Chorkendorff, J.W. Niemantsverdriet, “Concepts of Modern Catalysis and Kinetics”,
WILEY-VCH, Weinheim, 2003.
[4] H.v. Bekkum, E.M. Flanigen, P.A. Jacobs, J.C. Jansen (Eds.), "Introduction to Zeolite
Science and Practice", Studies in Surface Science and Catalysis 137, Elsevier
Science, 2001.
[5] T. Tago, T. Masuda, "Zeolite Nanocrystals- Synthesis and Applications, Nanocrystals ",
InTech, 2010.
[6] S.v. Donk, A.H. Janssen, J.H. Bitter, K.P.d. Jong, Catalysis Reviews: Science and
Engineering 45 (2003) 297-319.
[7] R.M. Mihályi, M. Kollár, P. Király, Z. Karoly, V. Mavrodinova, Applied Catalysis
A:General 417-418 (2012) 76-86.
[8] A.N.C.v. laak, L. Zhang, A.N. Parvulescu, P.C.A. Bruijnincx, B.M. Weckhuysen, K.P.d.
Jong, P.E.d. Jongh, Catalysis Today 168 (2011) 48-56.
[9] Z. Wang, P. Dornath, C.-C. Chang, H. Chen, W. Fan, Microporous and Mesoporous
Materials 181 (2013) 8-16.
[10] S. Teketel, M.W. Erichsen, F.L. Bleken, S. Svelle, K.P. Lillerud, U. Olsbye, Catalysis 26
(2014) 179-217.
[11] J. Hagen, “Industrial Catalysis. A Practical Approach” WILEY-VCH, Weinheim, 2006.
[12] J.F. Haw, Phys. Chem. Chem. Phys. 4 (2002) 5431-5441.
[13] M. Guisnet, J.-P. Gilson (Eds.), "Zeolites for Cleaner Technologies", Catalytic Science
Series 3, Imperial College Press, 2002.
[14] M.-C. Silaghi, C. Chizallet, P. Raybaud, Microporous and Mesoporous Materials 191
(2014) 82-96.
[15] G. Laugel, X. Nitsch, F. Ocampo, B. Louis, Applied Catalysis A: General 402 (2011)
139-145.
[16] L. Vanoye, A. Favre-Réguillon, P. Munno, J.F. Rodríguez, S. Dupuy, S. Pallier, I. Pitault,
C.D. Bellefon, Catalysis Today 215 (2013) 239-242.
[17] Q. Yang, H. Zhang, M. Kong, X. Bao, J. Fei, X. Zheng, Chinese Journal of Catalysis 34
(2013) 1576-1582.
[18] F.S. Ramos, A.M.D.d. Farias, L.E.P. Borges, J.L. Monteiro, M.A. Fraga, E.F. Sousa-
Aguiar, L.G. Appel, Catalysis Today 101 (2005) 39-44.
[19] A. García-Trenco, A. Martínez, Applied Catalysis A: General 411-412 (2012) 170-179.
[20] A. García-Trenco, S. Valencia, A. Martínez, Applied Catalysis A: General 468 (2013)
102-111.
[21] A. García-Trenco, A. Martínez, Catalysis Today 227 (2014) 144-153.
[22] J.-H. Kim, M.J. Park, S.J. Kim, O.-S. Joo, K.-D. Jung, Applied Catalysis A: General 264
(2004) 37-41.
[23] D. Mao, W. Yang, J. Xia, B. Zhang, Q. Song, Q. Chen, Journal of Catalysis 230 (2005)
140-149.
187
[24] J. Fei, Z. Hou, B. Zhu, H. Lou, X. Zheng, Applied Catalysis A: General 304 (2006) 49-
54.
[25] V. Vishwanathan, K.-W. Jun, J.-W. Kim, H.-S. Roh, Applied Catalysis A: General 276
(2004) 251-255.
[26] G.R. Moradi, M. Nazari, F. Yaripour, Fuel Processing Technology 89 (2008) 1287-1296.
[27] B.L. Su, M. Roussel, K. Vause, X.Y. Yang, F. Gilles, L. Shi, E. Leonova, M. Eden, X.
Zou, Microporous and Mesoporous Materials 105 (2007) 49-57.
[28] T. Nakano, T. Mizukane, Y. Nozue, Journal of Physics and Chemistry of Solids 71
(2010) 650-653.
[29] J.A.Kaduk, J.Faber, The Rigaku Journal 12 (1995) 14-34.
[30] S.J. Decanio, J.R. Sohn, P.O. Fritz, J.H. Lunsford, Journal of Catalysis 101 (1986) 132-
141.
[31] D. Jin, B. Zhu, Z. Hou, J. Fei, H. Lou, X. Zheng, Fuel 86 (2007) 2707-2713.
[32] D. Esquivel, A.J. Cruz-Cabeza, C. Jiménez-Sanchidrián, F.J. Romero-Salguero,
Microporous and Mesoporous Materials 179 (2013) 30-39.
[33] R. Dimitrova, G. Gunduz, L. Dimitrov, T. Tsoncheva, S. Yialmaz, E.A. Urquieta-
Gonzalez, Journal of Molecular Catalysis A: Chemical 214 (2004) 265-268.
[34] S.M. Solyman, N.A.K. Aboul-Gheit, F.M. Tawfik, M. Sadek, H.A. Ahmed, Egyptian
Journal of Petroleum 22 (2013) 91-99.
[35] E. Sarkadi-Priboczki, N. Kumar, T. Salmi, Z. Kovacs, D.Y. Murzin, Catalysis Letters 93
(2004) 101-107.
[36] P.S. Barcia, J.A.C. Silva, A.E. Rodrigues, Microporous and Mesoporous Materials 79
(2005) 145-163.
[37] J.-S. Lin, J.-J. Wang, J. Wang, I. Wang, R.J. Balasamy, A. Aitani, S. Al-Khattaf, T.-C.
Tsai, Journal of Catalysis 300 (2013) 81-90.
[38] S.V. Konnov, I.I. Ivanova, O.A. Ponomareva, V.I. Zaikovskii, Microporous and
Mesoporous Materials 164 (2012) 222-231.
[39] M. Guisnet, V. Fouche, M. Belloum, J.P. Bournonville, C. Travers, Applied Catalysis 71
(1991) 283-293.
[40] H. Xue, X. Huang, E. Ditzel, E. Zhan, M. Ma, W. Shen, Chinese Journal of Catalysis 34
(2013) 1496-1503.
[41] N. Khandan, M. Kazemeini, M. Aghaziarati, Applied Catalysis A: General 349 (2008)
6-12.
[42] S.M.K. Aboul-Fotouh, N.A.K. Aboul-Gheit, M.M.I. Hassan, Chinese Journal of Catalysis
32 (2011) 412-417.
[43] P.S.S. Prasad, J.W. Bae, S.-H. Kang, Y.-J. Lee, K.-W. Jun, Fuel Processing Technology
89 (2008) 1281-1286.
[44] J.W. Bae, S.-H. Kang, Y.-J. Lee, K.-W. Jun, Applied Catalysis B: Environmental 90
(2009) 426-435.
[45] S.-H. Kang, J.W. Bae, K.-W. Jun, H.S. Potdar, Catalysis Communications 9 (2008) 2035-
2039.
[46] G.R. Moradi, F. Yaripour, P. Vale-Sheyda, Fuel Processing Technology 91 (2010) 461-
468.
[47] A. Bonilla, D. Baudouin, J. Pérez-Ramírez, Journal of Catalysis 265 (2009) 170-180.
[48] J. Heveling, C.P. Nicolaides, M.S. Scurrell, Applied Catalysis A 173 (1998) 1-9.
188
[49] M.M.J. Treacy, M.D. Foster, Microporous and Mesoporous Materials 118 (2009) 106-
114.
[50] http://www.iza-structure.org/databases/.
[51] C.S. Triantafillidis, A.G. Vlessidis, N.P. Evmiridis, Ind. Eng. Chem. Res. 39 (2000) 307-
319.
[52] C.S. Triantafillidis, A.G. Vlessidis, L. Nalbandian, N.P. Evmiridis, Micropor. Mesopor.
Mater. 47 (2001) 369-388.
[53] K.S. Triantafyllidis, L. Nalbandian, P.N. Trikalitis, A.K. Ladavos, T. Mavromoustakos,
C.P. Nicolaides, Micropor. Mesopor. Mater. 75 (2004) 89-100.
[54] C.V. Hidalgo, H. Itoh, T. Hattori, M. Niwa, Y. Murakami, Journal of Catalysis 85 (1984)
362-369.
[55] L. Forni, E. Magni, E. Ortoleva, R. Monaci, V. Solinas, Journal of Catalysis 112 (1988)
444-452.
[56] L. Kubelkova, S. Beran, A. Malecka, V.M. Mastikhin, Zeolites 9 (1989) 12-17.
[57] N.-Y. Topsoe, K. Pedersen, E.G. Derouane, Journal of Catalysis 70 (1981) 41-52.
[58] T. Tsoncheva, R. Dimitrova, Applied Catalysis A: General 225 (2002) 101-107.
[59] M. Kaarsholm, F. Joensen, J. Nerlov, R. Cenni, J. Chaouki, G.S. Patience, Chemical
Engineering Science 62 (2007) 5527-5532.
[60] U. Olsbye, S. Svelle, M. Bjørgen, P. Beato, T.V.W. Janssens, F. Joensen, S. Bordiga,
K.P. Lillerud, Angew. Chem. Int. Ed 51 (2012) 5810-5831.
[61] H. Li, S. He, K. Ma, Q. Wu, Q. Jiao, K. Sun, Applied Catalysis A: General 450 (2013)
152-159.
[62] S.A. Karakoulia, K.S. Triantafyllidis, G. Tsilomelekis, S. Boghosian, A.A. Lemonidou,
Catalysis Today 141 (2009) 245-253.
[63] K.P. Moller, W. Bohringer, A.E. Schnitzler, E.v. Steen, C.T. O'Connor, Micropor.
Mesopor. Mater. 29 (1999) 127-144.
[64] S.S. Akarmazyan, P. Panagiotopoulou, A. Kambolis, C. Papadopoulou, D.I. Kondarides,
Applied Catalysis B: Environmental 145 (2014) 136-148.
189
CHAPTER 6
CO2 HYDROGENATION TO METHANOL/DME
In this chapter, the methanol synthesis reaction from CO2-H2 mixtures is
investigated over commercial and home-made CuO/ZnO/Al2O3 catalysts. Catalytic
activity, selectivities and yields of reaction products have been evaluated at 30 bar
pressure, in the temperature range of 170-250 oC, using different feed compositions
(CO2:H2= 1:3, 1:6, 1:9) and flow rates. The aim is to identify optimal experimental
conditions that could be then used in the study of the direct conversion of CO2/H2
mixtures into methanol/DME. The chapter involves also the investigation of the
direct CO2 hydrogenation to methanol/DME reaction over a set of bifunctional
catalysts comprising a methanol synthesis and a methanol dehydration
component. The latter experiments have been carried out at 30 bar pressure, in the
temperature range of 180-250 oC, using a feed composition of CO2:H2=1:6, and
30ml/min flow rate.
6.1 CO2 hydrogenation to methanol over copper-based catalysts
6.1.1 Preparation of copper-based catalysts
Two different commercial and home-made CuO/ZnO/Al2O3 catalysts have
been investigated for the methanol synthesis reaction (Table 6.1). The commercial
copper based catalyst, denoted as CZA1, was provided by Alfa Aesar (45776). The
home-made copper based catalyst, denoted as CZA2, was synthesized by co-
precipitation, following the method described by Baltes et al. [1]. The solutions of
the precursor salts (Cu(NO3)2·3H2O, (0.3 mol/L), Zn(NO3)2·6H2O (0.15 mol/L),
Al(NO3)3·9H2O (0.05 mol/L)) and the solution of the precipitant (Na2CO3 (1 mol/L))
were added dropwise (6ml/min) in 200 mL of distilled water kept at 65 °C under
vigorous stirring. The precipitation was performed at pH 6.2±0.1. During
precipitation and aging the temperature and pH were kept constant. After aging for
1 h, the precipitate was filtered and washed thoroughly with distilled water to
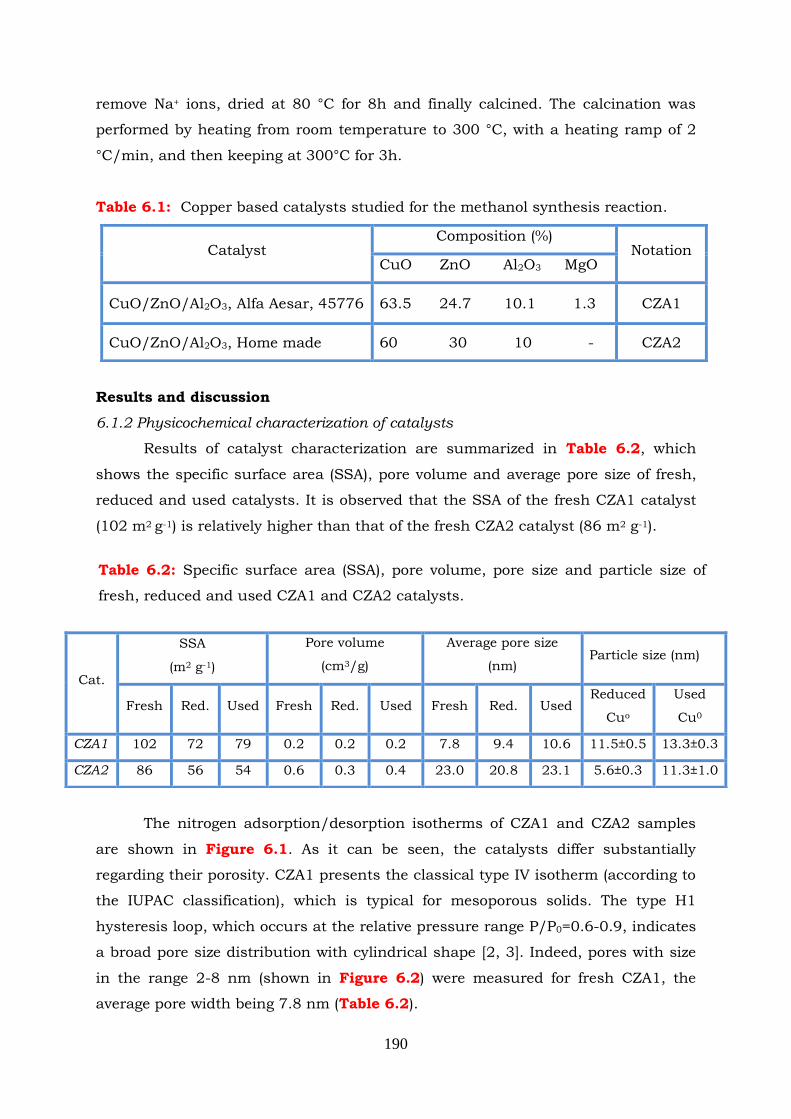
190
remove Na+ ions, dried at 80 °C for 8h and finally calcined. The calcination was
performed by heating from room temperature to 300 °C, with a heating ramp of 2
°C/min, and then keeping at 300°C for 3h.
Table 6.1: Copper based catalysts studied for the methanol synthesis reaction.
Results and discussion
6.1.2 Physicochemical characterization of catalysts
Results of catalyst characterization are summarized in Table 6.2, which
shows the specific surface area (SSA), pore volume and average pore size of fresh,
reduced and used catalysts. It is observed that the SSA of the fresh CZA1 catalyst
(102 m2 g-1) is relatively higher than that of the fresh CZA2 catalyst (86 m2 g-1).
The nitrogen adsorption/desorption isotherms of CZA1 and CZA2 samples
are shown in Figure 6.1. As it can be seen, the catalysts differ substantially
regarding their porosity. CZA1 presents the classical type IV isotherm (according to
the IUPAC classification), which is typical for mesoporous solids. The type H1
hysteresis loop, which occurs at the relative pressure range P/P0=0.6-0.9, indicates
a broad pore size distribution with cylindrical shape [2, 3]. Indeed, pores with size
in the range 2-8 nm (shown in Figure 6.2) were measured for fresh CZA1, the
average pore width being 7.8 nm (Table 6.2).
Catalyst Composition (%)
Notation CuO ZnO Al2O3 MgO
CuO/ZnO/Al2O3, Alfa Aesar, 45776 63.5 24.7 10.1 1.3 CZA1
CuO/ZnO/Al2O3, Home made 60 30 10 - CZA2
Cat.
SSA
(m2 g-1)
Pore volume
(cm3/g)
Average pore size
(nm) Particle size (nm)
Fresh Red. Used Fresh Red. Used Fresh Red. Used Reduced
Cuo
Used
Cu0
CZA1 102 72 79 0.2 0.2 0.2 7.8 9.4 10.6 11.5±0.5 13.3±0.3
CZA2 86 56 54 0.6 0.3 0.4 23.0 20.8 23.1 5.6±0.3 11.3±1.0
Table 6.2: Specific surface area (SSA), pore volume, pore size and particle size of
fresh, reduced and used CZA1 and CZA2 catalysts.
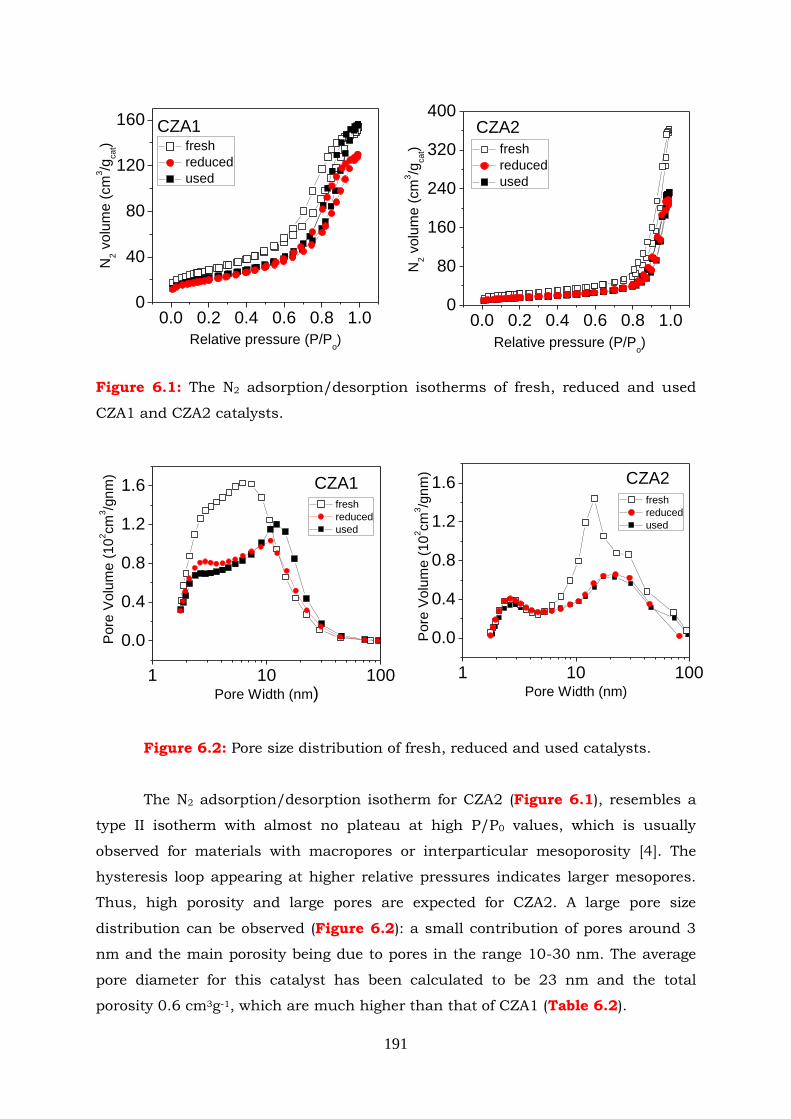
191
Figure 6.1: The N2 adsorption/desorption isotherms of fresh, reduced and used
CZA1 and CZA2 catalysts.
Figure 6.2: Pore size distribution of fresh, reduced and used catalysts.
The N2 adsorption/desorption isotherm for CZA2 (Figure 6.1), resembles a
type II isotherm with almost no plateau at high P/P0 values, which is usually
observed for materials with macropores or interparticular mesoporosity [4]. The
hysteresis loop appearing at higher relative pressures indicates larger mesopores.
Thus, high porosity and large pores are expected for CZA2. A large pore size
distribution can be observed (Figure 6.2): a small contribution of pores around 3
nm and the main porosity being due to pores in the range 10-30 nm. The average
pore diameter for this catalyst has been calculated to be 23 nm and the total
porosity 0.6 cm3g-1, which are much higher than that of CZA1 (Table 6.2).
1 10 100
0.0
0.4
0.8
1.2
1.6 CZA2
Pore
Volu
me (
10
2cm
3/g
nm
)
Pore Width (nm)
fresh
reduced
used
1 10 100
0.0
0.4
0.8
1.2
1.6 CZA1
Po
re V
olu
me
(1
02cm
3/g
nm
)
Pore Width (nm)
fresh
reduced
used
0.0 0.2 0.4 0.6 0.8 1.00
40
80
120
160
fresh
reduced
used
CZA1
N2 v
olu
me
(cm
3/g
ca
t)
Relative pressure (P/Po)
0.0 0.2 0.4 0.6 0.8 1.00
80
160
240
320
400CZA2
N2 v
olu
me (
cm
3/g
ca
t)
Relative pressure (P/Po)
fresh
reduced
used
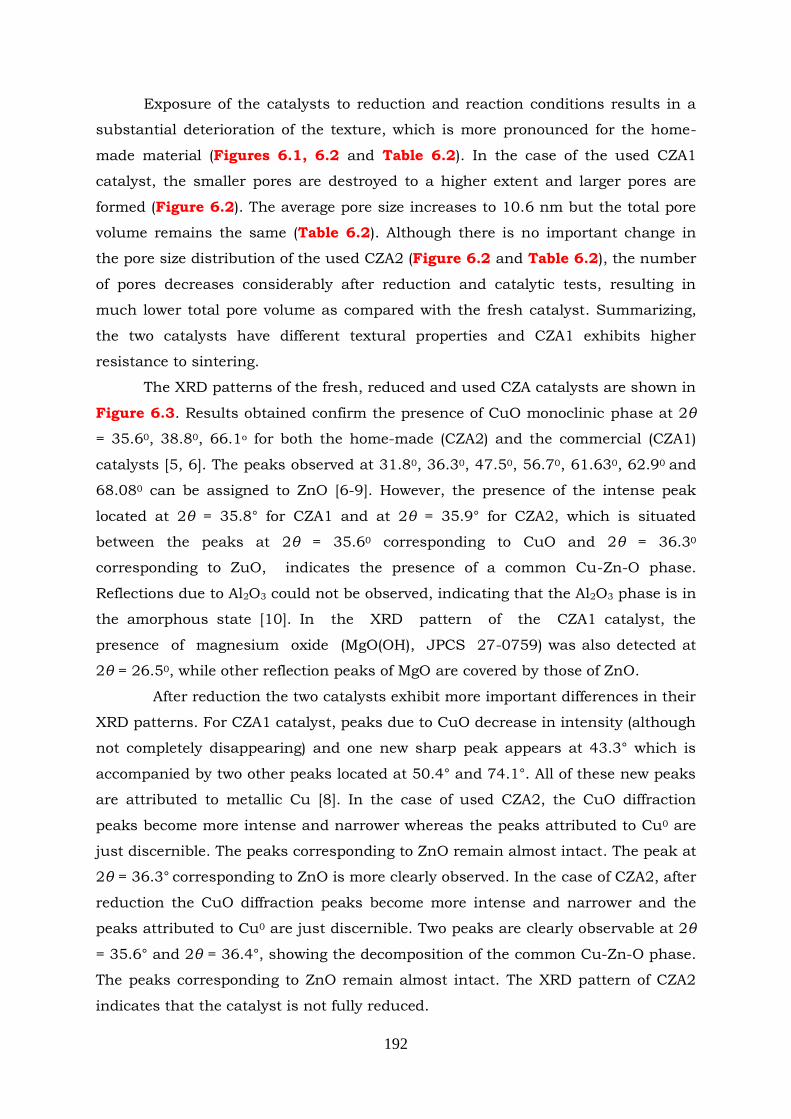
192
Exposure of the catalysts to reduction and reaction conditions results in a
substantial deterioration of the texture, which is more pronounced for the home-
made material (Figures 6.1, 6.2 and Table 6.2). In the case of the used CZA1
catalyst, the smaller pores are destroyed to a higher extent and larger pores are
formed (Figure 6.2). The average pore size increases to 10.6 nm but the total pore
volume remains the same (Table 6.2). Although there is no important change in
the pore size distribution of the used CZA2 (Figure 6.2 and Table 6.2), the number
of pores decreases considerably after reduction and catalytic tests, resulting in
much lower total pore volume as compared with the fresh catalyst. Summarizing,
the two catalysts have different textural properties and CZA1 exhibits higher
resistance to sintering.
The XRD patterns of the fresh, reduced and used CZA catalysts are shown in
Figure 6.3. Results obtained confirm the presence of CuO monoclinic phase at 2θ
= 35.60, 38.80, 66.1o for both the home-made (CZA2) and the commercial (CZA1)
catalysts [5, 6]. The peaks observed at 31.80, 36.30, 47.50, 56.70, 61.630, 62.90 and
68.080 can be assigned to ZnO [6-9]. However, the presence of the intense peak
located at 2θ = 35.8° for CZA1 and at 2θ = 35.9° for CZA2, which is situated
between the peaks at 2θ = 35.60 corresponding to CuO and 2θ = 36.30
corresponding to ZuO, indicates the presence of a common Cu-Zn-O phase.
Reflections due to Al2O3 could not be observed, indicating that the Al2O3 phase is in
the amorphous state [10]. In the XRD pattern of the CZA1 catalyst, the
presence of magnesium oxide (MgO(OH), JPCS 27-0759) was also detected at
2θ = 26.50, while other reflection peaks of MgO are covered by those of ZnO.
After reduction the two catalysts exhibit more important differences in their
XRD patterns. For CZA1 catalyst, peaks due to CuO decrease in intensity (although
not completely disappearing) and one new sharp peak appears at 43.3° which is
accompanied by two other peaks located at 50.4° and 74.1°. All of these new peaks
are attributed to metallic Cu [8]. In the case of used CZA2, the CuO diffraction
peaks become more intense and narrower whereas the peaks attributed to Cu0 are
just discernible. The peaks corresponding to ZnO remain almost intact. The peak at
2θ = 36.3° corresponding to ZnO is more clearly observed. In the case of CZA2, after
reduction the CuO diffraction peaks become more intense and narrower and the
peaks attributed to Cu0 are just discernible. Two peaks are clearly observable at 2θ
= 35.6° and 2θ = 36.4°, showing the decomposition of the common Cu-Zn-O phase.
The peaks corresponding to ZnO remain almost intact. The XRD pattern of CZA2
indicates that the catalyst is not fully reduced.
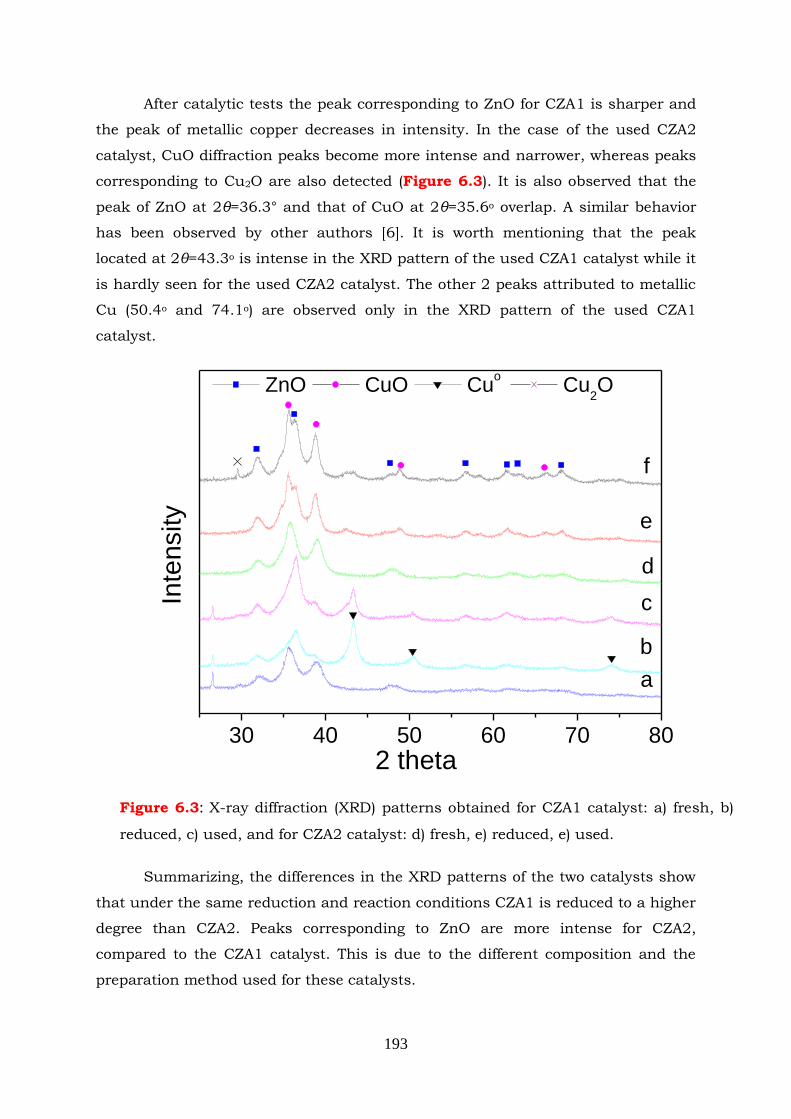
193
After catalytic tests the peak corresponding to ZnO for CZA1 is sharper and
the peak of metallic copper decreases in intensity. In the case of the used CZA2
catalyst, CuO diffraction peaks become more intense and narrower, whereas peaks
corresponding to Cu2O are also detected (Figure 6.3). It is also observed that the
peak of ZnO at 2θ=36.3° and that of CuO at 2θ=35.6o overlap. A similar behavior
has been observed by other authors [6]. It is worth mentioning that the peak
located at 2θ=43.3o is intense in the XRD pattern of the used CZA1 catalyst while it
is hardly seen for the used CZA2 catalyst. The other 2 peaks attributed to metallic
Cu (50.4o and 74.1o) are observed only in the XRD pattern of the used CZA1
catalyst.
Summarizing, the differences in the XRD patterns of the two catalysts show
that under the same reduction and reaction conditions CZA1 is reduced to a higher
degree than CZA2. Peaks corresponding to ZnO are more intense for CZA2,
compared to the CZA1 catalyst. This is due to the different composition and the
preparation method used for these catalysts.
Figure 6.3: X-ray diffraction (XRD) patterns obtained for CZA1 catalyst: a) fresh, b)
reduced, c) used, and for CZA2 catalyst: d) fresh, e) reduced, e) used.
30 40 50 60 70 80
f
e
ZnO CuO Cuo Cu
2O
2 theta
In
ten
sity
d
c
b
a
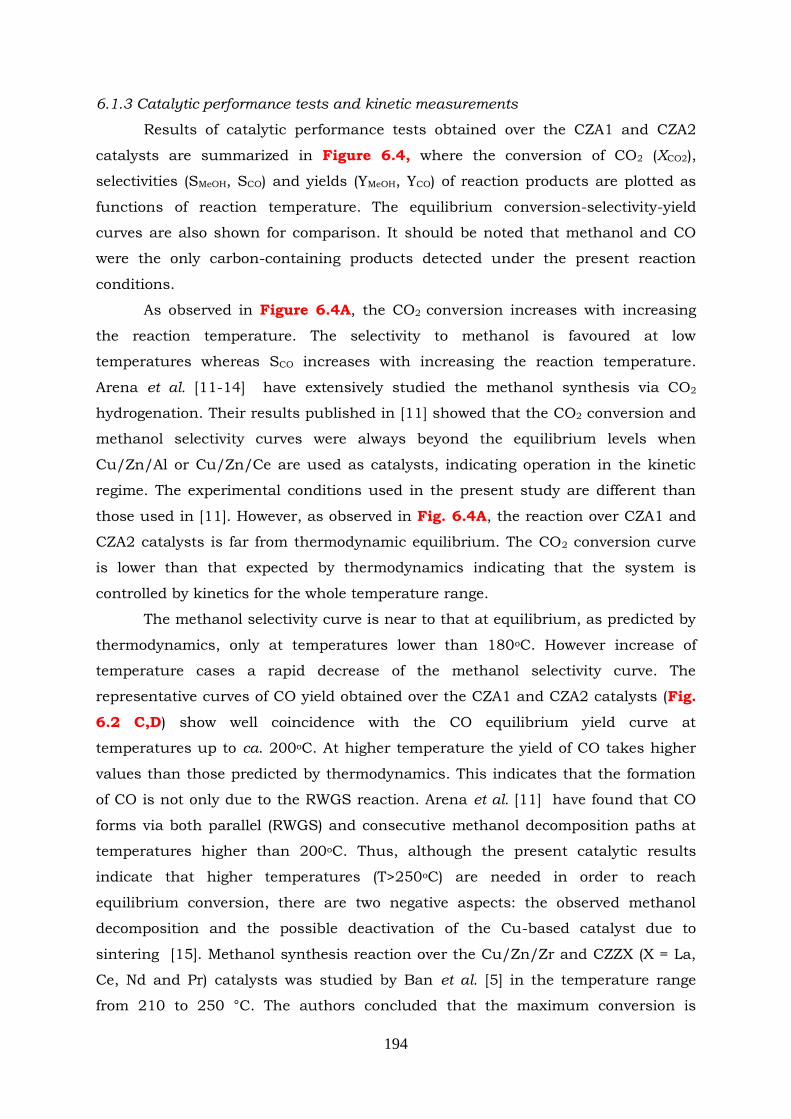
194
6.1.3 Catalytic performance tests and kinetic measurements
Results of catalytic performance tests obtained over the CZA1 and CZA2
catalysts are summarized in Figure 6.4, where the conversion of CO2 (XCO2),
selectivities (SMeOH, SCO) and yields (YMeOH, YCO) of reaction products are plotted as
functions of reaction temperature. The equilibrium conversion-selectivity-yield
curves are also shown for comparison. It should be noted that methanol and CO
were the only carbon-containing products detected under the present reaction
conditions.
As observed in Figure 6.4A, the CO2 conversion increases with increasing
the reaction temperature. The selectivity to methanol is favoured at low
temperatures whereas SCO increases with increasing the reaction temperature.
Arena et al. [11-14] have extensively studied the methanol synthesis via CO2
hydrogenation. Their results published in [11] showed that the CO2 conversion and
methanol selectivity curves were always beyond the equilibrium levels when
Cu/Zn/Al or Cu/Zn/Ce are used as catalysts, indicating operation in the kinetic
regime. The experimental conditions used in the present study are different than
those used in [11]. However, as observed in Fig. 6.4A, the reaction over CZA1 and
CZA2 catalysts is far from thermodynamic equilibrium. The CO2 conversion curve
is lower than that expected by thermodynamics indicating that the system is
controlled by kinetics for the whole temperature range.
The methanol selectivity curve is near to that at equilibrium, as predicted by
thermodynamics, only at temperatures lower than 180oC. However increase of
temperature cases a rapid decrease of the methanol selectivity curve. The
representative curves of CO yield obtained over the CZA1 and CZA2 catalysts (Fig.
6.2 C,D) show well coincidence with the CO equilibrium yield curve at
temperatures up to ca. 200oC. At higher temperature the yield of CO takes higher
values than those predicted by thermodynamics. This indicates that the formation
of CO is not only due to the RWGS reaction. Arena et al. [11] have found that CO
forms via both parallel (RWGS) and consecutive methanol decomposition paths at
temperatures higher than 200oC. Thus, although the present catalytic results
indicate that higher temperatures (T>250oC) are needed in order to reach
equilibrium conversion, there are two negative aspects: the observed methanol
decomposition and the possible deactivation of the Cu-based catalyst due to
sintering [15]. Methanol synthesis reaction over the Cu/Zn/Zr and CZZX (X = La,
Ce, Nd and Pr) catalysts was studied by Ban et al. [5] in the temperature range
from 210 to 250 °C. The authors concluded that the maximum conversion is
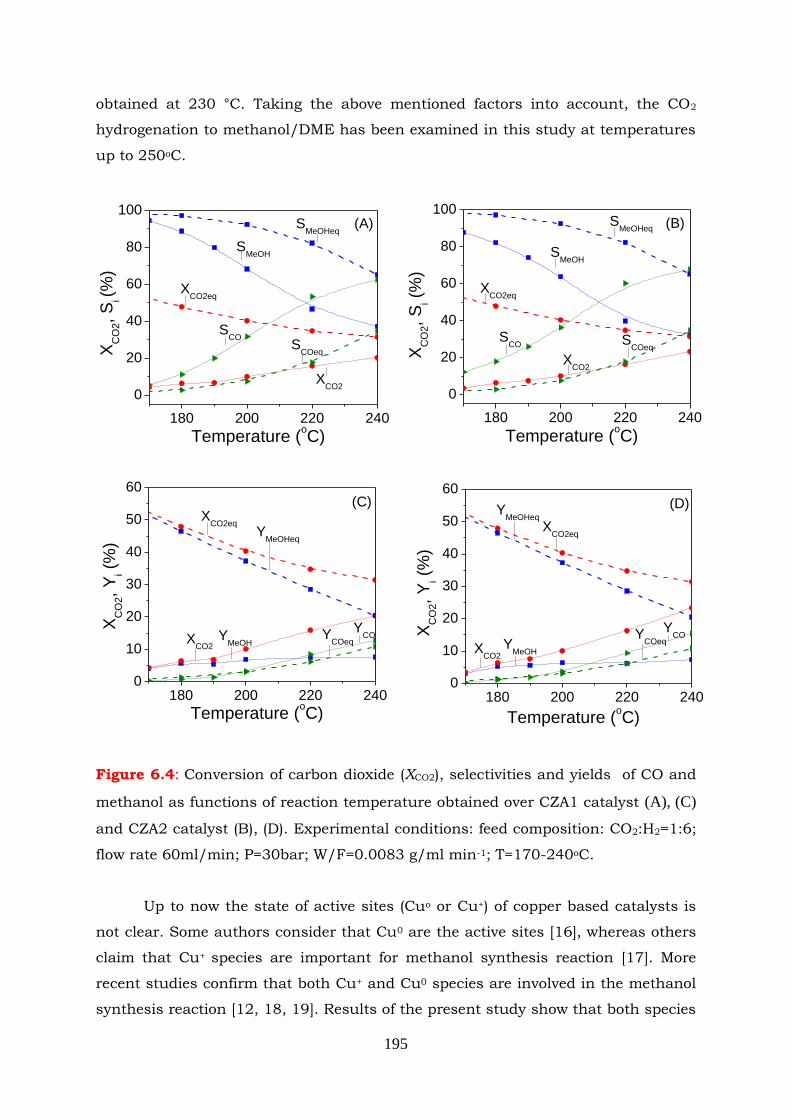
195
obtained at 230 °C. Taking the above mentioned factors into account, the CO2
hydrogenation to methanol/DME has been examined in this study at temperatures
up to 250oC.
Figure 6.4: Conversion of carbon dioxide (XCO2), selectivities and yields of CO and
methanol as functions of reaction temperature obtained over CZA1 catalyst (A), (C)
and CZA2 catalyst (B), (D). Experimental conditions: feed composition: CO2:H2=1:6;
flow rate 60ml/min; P=30bar; W/F=0.0083 g/ml min-1; T=170-240oC.
Up to now the state of active sites (Cuo or Cu+) of copper based catalysts is
not clear. Some authors consider that Cu0 are the active sites [16], whereas others
claim that Cu+ species are important for methanol synthesis reaction [17]. More
recent studies confirm that both Cu+ and Cu0 species are involved in the methanol
synthesis reaction [12, 18, 19]. Results of the present study show that both species
180 200 220 240
0
20
40
60
80
100
SCO
XC
O2,
Si (
%)
Temperature (oC)
SMeOH
XCO2
(B)SMeOHeq
XCO2eq
SCOeq
180 200 220 240
0
20
40
60
80
100S
MeOHeq
XCO2eq
SCO
XC
O2,
Si (%
)
Temperature (oC)
SMeOH
XCO2
(A)
SCOeq
180 200 220 2400
10
20
30
40
50
60
YMeOH
XCO2eq
YCOeq
YCO
XC
O2,
Yi (
%)
Temperature (oC)
YMeOHeq
XCO2
(D)
180 200 220 2400
10
20
30
40
50
60
YCOeq
YMeOHeq
XCO2
YCO
XC
O2,
Yi (
%)
Temperature (oC)
YMeOH
XCO2eq
(C)
196
are present on the reduced CZA1 and CZA2 catalysts (Fig. 6.3). However, the
relative amount of the metallic phase on the reduced CZA1 catalyst is higher than
that of the reduced CZA2 catalyst. If only metallic species were active for the title
reaction then CZA2 catalyst should not exhibit almost the same catalytic activity as
CZA1. Results presented in Fig. 6.4 show that conversion of CO2 is, practically, the
same for the CZA1 and CZA2 catalysts. However the selectivity as well as the yield
of methanol is a little higher over the CZA1 sample. It might be possible that the
Cu+ species facilitate the CO formation via RWGS reaction [20]. For exhibiting
better methanol selectivity, the CZA1 has been chosen as methanol synthesis
component of the bifunctional catalytic system for the direct CO2 conversion to
methanol/DME reaction.
Results of kinetic measurements obtained over the CZA catalysts are
summarized in the Arrhenius plot of Figure 6.5, where the reaction rates are
expressed per gram of catalyst.
Figure 6.5: Arrhenius plots of specific reaction rates obtained over the studied CZA
samples under differential reaction conditions.
As it can be seen the activity of these catalysts (per gram of catalyst) does
not vary significantly. The apparent activation energy (Ea) of the methanol
synthesis reaction was calculated from the slope of the fitted lines. It is observed
that Ea is, practically, the same for these two catalysts taking a value of 10.4 kcal
mol-1 for CZA1 and 13.4 kcal mol-1 for CZA2.
2.10 2.15 2.20 2.254E-5
6E-5
8E-5
1E-4
1.2E-4
CZA1, Ea=10.4kcal mol
-1
CZA2, Ea=13.4kcal mol
-1
Rate
(m
ol s
-1g
-1)
1000/T (K-1)
197
6.1.4 Effects of feed composition and flow rate on catalytic performance
In direct production of methanol/DME through CO2 hydrogenation the
evaluation of optimal reaction conditions is an important step for maximizing the
methanol/DME production, for shifting the CO2 conversion toward methanol and
also to minimizing catalyst deactivation. For this reason the effects of feed
composition and flow rate on catalytic performance have been studied over the
CZA1 sample. Results showing the effects of CO2:H2 ratio in the feed on the
conversion of CO2 and the selectivies to reaction products are presented in Figure
6.6. Reaction stoichiometry demands a CO2:H2 molar ratio 1:3. With this ratio, a
3% CO2 conversion is achieved at 180 °C, which increases to 14% at 240 °C.
However, as temperature increases, selectivity to CO augments at the expense of
methanol. These results indicate that a competition exists between methanol
synthesis, methanol decomposition and reverse water gas shift reactions: methanol
synthesis is favored at lower temperatures and the other two reactions at higher
temperatures.
Increasing the hydrogen content in the feed (changing the CO2:H2 molar ratio
to 1:6), enhances both CO2 conversion and methanol production over the entire
temperature range investigated (Fig. 6.6). Further increase of hydrogen content in
the feed, CO2:H2 molar ratio to 1:9, has no considerable effect on CO2 conversion
up to 220 °C, provoking an increment of CO2 conversion at higher temperatures.
However, for this CO2:H2 ratio, CO production is promoted for the whole
temperature range. Taking all the above into account, it may be concluded that
CO2 hydrogenation to methanol is favoured in the presence of excess of H2 in the
feed, in agreement with literature results [21]. The CO2:H2 = 1:6 molar ratio seems
adequate for methanol synthesis and has been chosen as the feed composition for
further investigations.
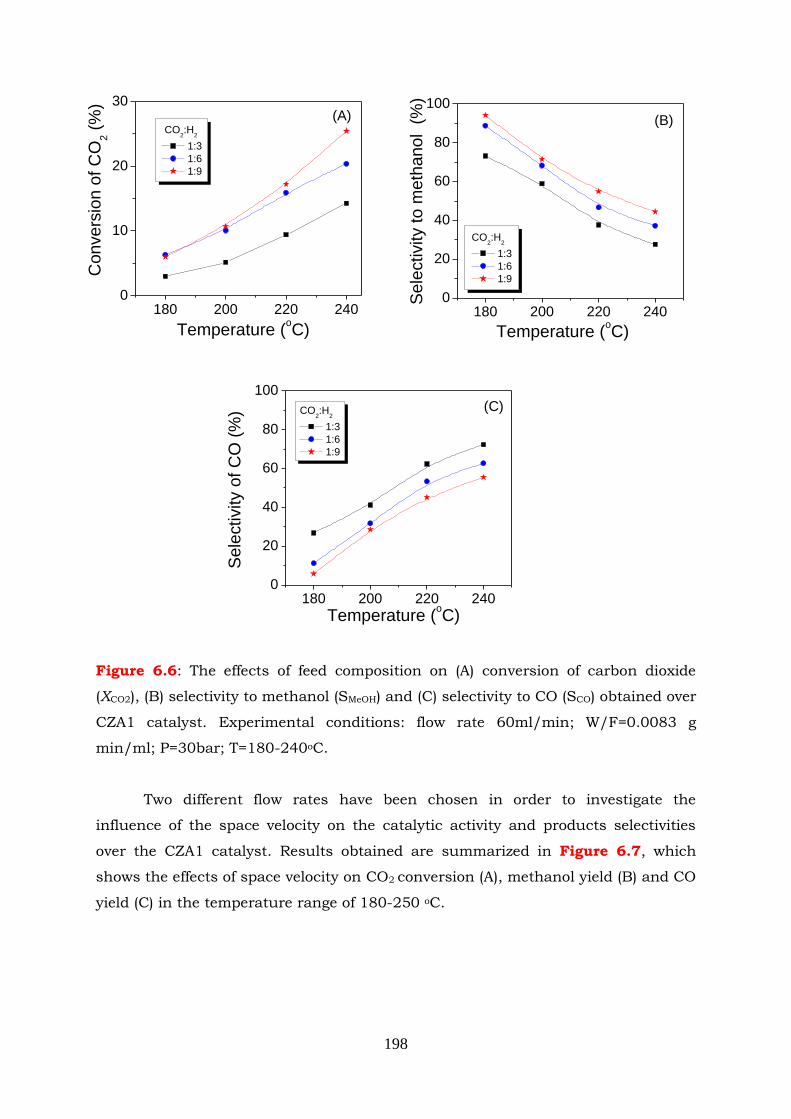
198
Figure 6.6: The effects of feed composition on (A) conversion of carbon dioxide
(XCO2), (B) selectivity to methanol (SMeOH) and (C) selectivity to CO (SCO) obtained over
CZA1 catalyst. Experimental conditions: flow rate 60ml/min; W/F=0.0083 g
min/ml; P=30bar; T=180-240oC.
Two different flow rates have been chosen in order to investigate the
influence of the space velocity on the catalytic activity and products selectivities
over the CZA1 catalyst. Results obtained are summarized in Figure 6.7, which
shows the effects of space velocity on CO2 conversion (A), methanol yield (B) and CO
yield (C) in the temperature range of 180-250 oC.
180 200 220 2400
10
20
30
CO2:H
2
1:3
1:6
1:9
C
onvers
ion o
f C
O2 (
%)
Temperature (oC)
(A)
180 200 220 2400
20
40
60
80
100
CO2:H
2
1:3
1:6
1:9
Sele
ctivity o
f C
O (
%)
Temperature (oC)
(C)
180 200 220 2400
20
40
60
80
100
CO2:H
2
1:3
1:6
1:9
Sele
ctivity t
o m
eth
anol (
%)
Temperature (oC)
(B)
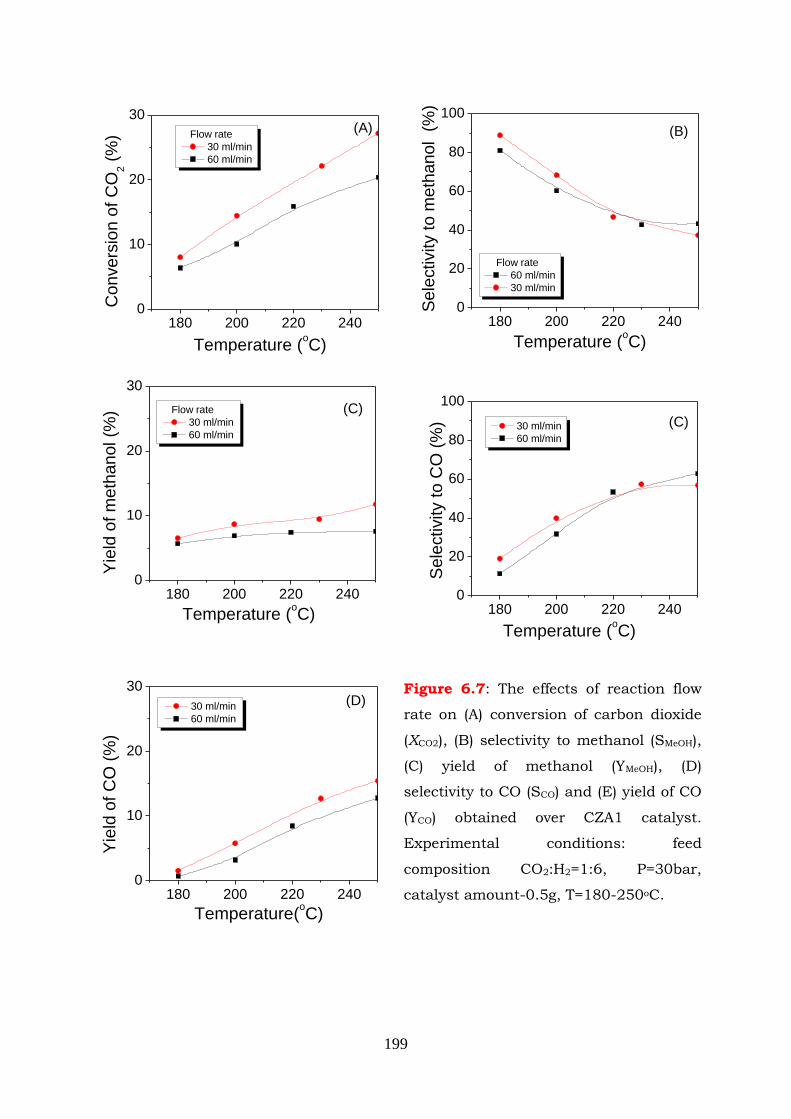
199
180 200 220 2400
10
20
30
Flow rate
30 ml/min
60 ml/min
Convers
ion o
f C
O2 (
%)
Temperature (oC)
(A)
180 200 220 2400
20
40
60
80
100
Flow rate
60 ml/min
30 ml/min
Sele
ctivity t
o m
eth
anol (
%)
Temperature (oC)
(B)
180 200 220 2400
10
20
30
Flow rate
30 ml/min
60 ml/min
Yie
ld o
f m
eth
anol (%
)
Temperature (oC)
(C)
180 200 220 2400
20
40
60
80
100
30 ml/min
60 ml/min
Sele
ctivity t
o C
O (
%)
Temperature (oC)
(C)
180 200 220 2400
10
20
30
30 ml/min
60 ml/min
Yie
ld o
f C
O (
%)
Temperature(oC)
(D)Figure 6.7: The effects of reaction flow
rate on (A) conversion of carbon dioxide
(XCO2), (B) selectivity to methanol (SMeOH),
(C) yield of methanol (YMeOH), (D)
selectivity to CO (SCO) and (E) yield of CO
(YCO) obtained over CZA1 catalyst.
Experimental conditions: feed
composition CO2:H2=1:6, P=30bar,
catalyst amount-0.5g, T=180-250oC.
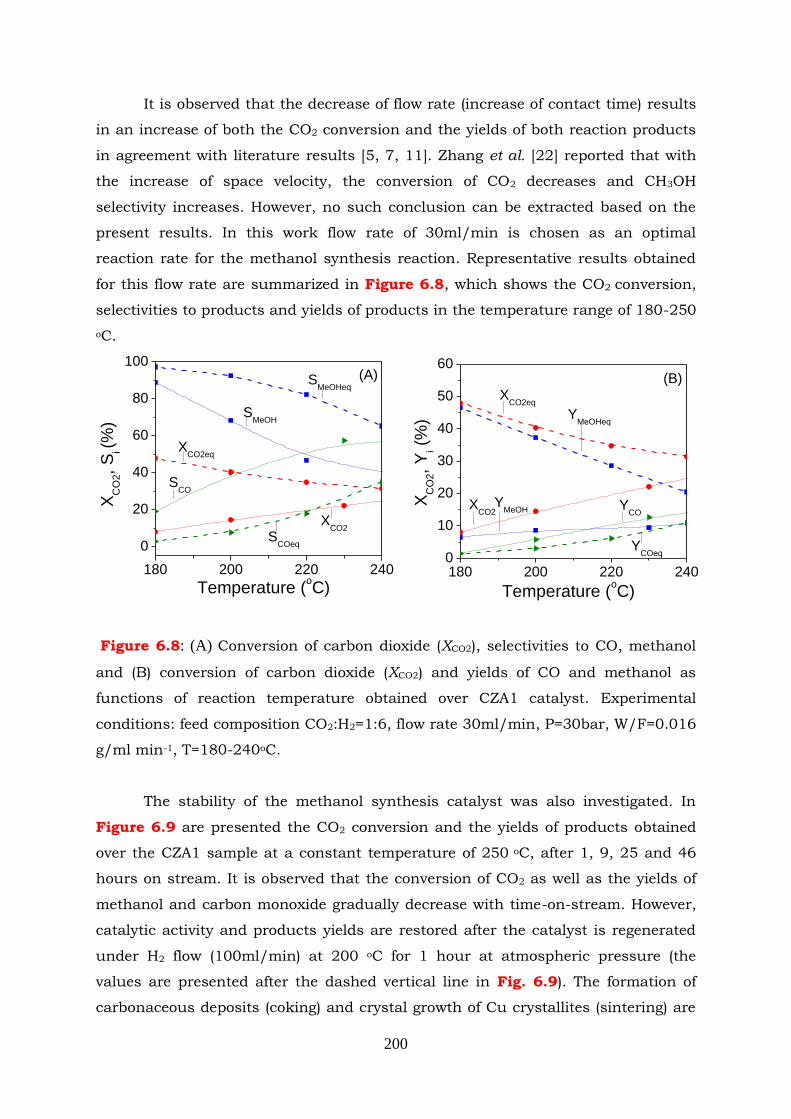
200
It is observed that the decrease of flow rate (increase of contact time) results
in an increase of both the CO2 conversion and the yields of both reaction products
in agreement with literature results [5, 7, 11]. Zhang et al. [22] reported that with
the increase of space velocity, the conversion of CO2 decreases and CH3OH
selectivity increases. However, no such conclusion can be extracted based on the
present results. In this work flow rate of 30ml/min is chosen as an optimal
reaction rate for the methanol synthesis reaction. Representative results obtained
for this flow rate are summarized in Figure 6.8, which shows the CO2 conversion,
selectivities to products and yields of products in the temperature range of 180-250
oC.
Figure 6.8: (A) Conversion of carbon dioxide (XCO2), selectivities to CO, methanol
and (B) conversion of carbon dioxide (XCO2) and yields of CO and methanol as
functions of reaction temperature obtained over CZA1 catalyst. Experimental
conditions: feed composition CO2:H2=1:6, flow rate 30ml/min, P=30bar, W/F=0.016
g/ml min-1, T=180-240oC.
The stability of the methanol synthesis catalyst was also investigated. In
Figure 6.9 are presented the CO2 conversion and the yields of products obtained
over the CZA1 sample at a constant temperature of 250 oC, after 1, 9, 25 and 46
hours on stream. It is observed that the conversion of CO2 as well as the yields of
methanol and carbon monoxide gradually decrease with time-on-stream. However,
catalytic activity and products yields are restored after the catalyst is regenerated
under H2 flow (100ml/min) at 200 oC for 1 hour at atmospheric pressure (the
values are presented after the dashed vertical line in Fig. 6.9). The formation of
carbonaceous deposits (coking) and crystal growth of Cu crystallites (sintering) are
180 200 220 240
0
20
40
60
80
100
SMeOHeq
XCO2eq
SCO
XC
O2,
Si (%
)
Temperature (oC)
SMeOH
XCO2
(A)
SCOeq
180 200 220 2400
10
20
30
40
50
60
YCOeq
YMeOHeq
XCO2
YCO
XC
O2,
Yi (
%)
Temperature (oC)
YMeOH
XCO2eq
(B)
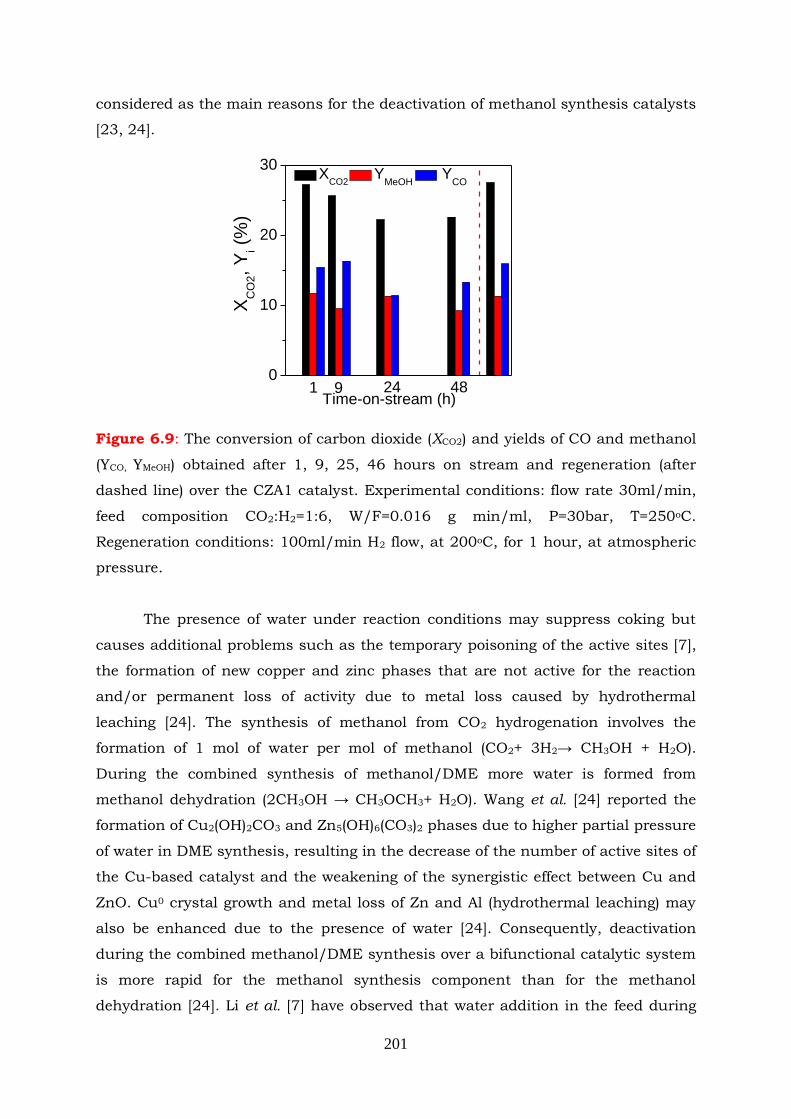
201
considered as the main reasons for the deactivation of methanol synthesis catalysts
[23, 24].
Figure 6.9: The conversion of carbon dioxide (XCO2) and yields of CO and methanol
(YCO, YMeOH) obtained after 1, 9, 25, 46 hours on stream and regeneration (after
dashed line) over the CZA1 catalyst. Experimental conditions: flow rate 30ml/min,
feed composition CO2:H2=1:6, W/F=0.016 g min/ml, P=30bar, T=250oC.
Regeneration conditions: 100ml/min H2 flow, at 200oC, for 1 hour, at atmospheric
pressure.
The presence of water under reaction conditions may suppress coking but
causes additional problems such as the temporary poisoning of the active sites [7],
the formation of new copper and zinc phases that are not active for the reaction
and/or permanent loss of activity due to metal loss caused by hydrothermal
leaching [24]. The synthesis of methanol from CO2 hydrogenation involves the
formation of 1 mol of water per mol of methanol (CO2+ 3H2→ CH3OH + H2O).
During the combined synthesis of methanol/DME more water is formed from
methanol dehydration (2CH3OH → CH3OCH3+ H2O). Wang et al. [24] reported the
formation of Cu2(OH)2CO3 and Zn5(OH)6(CO3)2 phases due to higher partial pressure
of water in DME synthesis, resulting in the decrease of the number of active sites of
the Cu-based catalyst and the weakening of the synergistic effect between Cu and
ZnO. Cu0 crystal growth and metal loss of Zn and Al (hydrothermal leaching) may
also be enhanced due to the presence of water [24]. Consequently, deactivation
during the combined methanol/DME synthesis over a bifunctional catalytic system
is more rapid for the methanol synthesis component than for the methanol
dehydration [24]. Li et al. [7] have observed that water addition in the feed during
0
10
20
30
48249Time-on-stream (h)
XC
O2, Y
i (%
)
XCO2
YMeOH
YCO
1
202
CO2 hydrogenation to methanol, results in the immediate decline of CO2
conversion, the decrease depending on the amount of water. Conversion has been
found to recover slowly to the original level when the water was removed from the
feed. These results suggested that poisoning of the active sites due to water is
reversible [7]. Taking into account that in the present case catalytic activity can be
easily restored under H2 flow at 200oC for 1 hour, it seems reasonable to assume
that under these reaction conditions (e.g. 30 bar and 250°C), the main reason for
deactivations is water strongly adsorbed on the active sites. This inhibits the CO2
hydrogenation reaction and leads in temporary catalyst deactivation, in accordance
with the conclusion of Li et al. [7].
6.2 CO2 hydrogenation to methanol/DME over hybrid catalysts
6.2.1 Preparation of copper-based catalyst admixed with alumina and W/alumina
catalysts
The catalysts used in this section have been made by admixing CZA1, a
metal based catalyst for methanol synthesis, and γ-Al2O3 (Engelhard, denoted as
Al4 see Chapter 4 Table 4.1), an acid component for methanol dehydration. The
selection of Al4 catalyst as an acid component is based on the results obtained
during the investigation of methanol dehydration reaction over different alumina
catalysts (Chapter 4). Briefly, the Al4 with SSAs around 190 m2 g-1, possessing
mainly mesoporous structure, was found to exhibit significant activity in methanol
dehydration reaction and was able to reach equilibrium conversions at
temperatures around 230 °C under atmospheric pressure. As an acidic catalyst,
Al4 possesses only Lewis acid sites with a weak to medium acidic strength.
One more catalyst has been made by admixing CZA1 with a separately
prepared W/Al2O3 catalyst. The supported WO3 catalyst has been used as alcohols
dehydration catalyst by many researchers [25-27]. In this work the W/Al2O3 has
been synthesized by wet-impregnation [28] of aqueous ammonium (para) tungstate,
(NH4)10H2(W2O7)6 (Sigma-Aldrich, 322385) onto Al2O3 (Engelhard, Al4) support. An
aqueous solution of ammonium tungstate was first prepared. The Al4 was added to
above solution. Afterwards the mixture was placed in a water bath and the
evaporation of water takes place at vacuum under 50°C. The resulting slurry was
dried at 100°C for 2 hours and then calcined at 450oC for 4 hours.
Prior to admixing the metallic and acidic components, they were dried,
crashed and sieved to the required mesh size (0.125<d<0.18mm). Subsequently,
they were mixed in a solution of methanol and the resulting slurry mixture was left
203
to dry at room temperature under stirring. In Table 6.3 are listed the investigated
admixed catalysts used in this section for CO2 hydrogenation to MeOH/DME
reaction.
Table 6.3: Copper based catalyst admixed with γ-alumina and WO3-γ-alumina catalysts.
Results and discussion
6.2.2 Catalytic performance tests over CZA1/Al4 and CZA1/WAl4 catalysts
6.2.2.1 CZA1/Al4 admixed catalyst (1:1 and 1:2 ratios)
Results of catalytic performance tests, obtained over the CZA1/Al4 (ratio 1:1)
catalyst with the use of CO2:H2=1:6 feed composition, are summarized in Figure
6.10, where the conversion of carbon dioxide, selectivities and yields of products
are plotted as functions of reaction temperature. The equilibrium conversion-
selectivity-yield curves are also shown for comparison. Results obtained indicate
that the admixed catalyst exhibits very low activity. The CO2 conversion at 240 oC
is 21.1%. It is observed that the CO2 conversion is far from equilibrium, especially
at low temperatures, and that the selectivity and yield of CO are much higher than
those at equilibrium. Frusteri et al. [29], studied multifunctional Cu–ZnO–ZrO2/H-
ZSM5 catalysts prepared by various methods and reported that methanol-to-CO
decomposition or RWGS reactions are more favoured than the CO2 hydrogenation
reaction at high temperature (>200 °C). It is observed also that the selectivity to
methanol is higher than that of equilibrium, whereas the selectivity to DME is only
1.18% at 240 oC. The presence of high concentrations of methanol (YMeOH=7 % at
240 oC) at the reactor effluent indicates that the amount of acid sites is insufficient
to convert the formed methanol to DME under these reaction conditions.
Catalyst
Mass ratio of
metal/acid
functions
Notation
Comm. copper based catalyst + γ-Al2O3 Engelhard 1:1 CZA1/Al4
Comm. copper based catalyst + γ-Al2O3 Engelhard 1:2 CZA1/Al4
Comm. copper based catalyst + WO3/γ-Al2O3 Engelhard
1:1 CZA1/WAl4
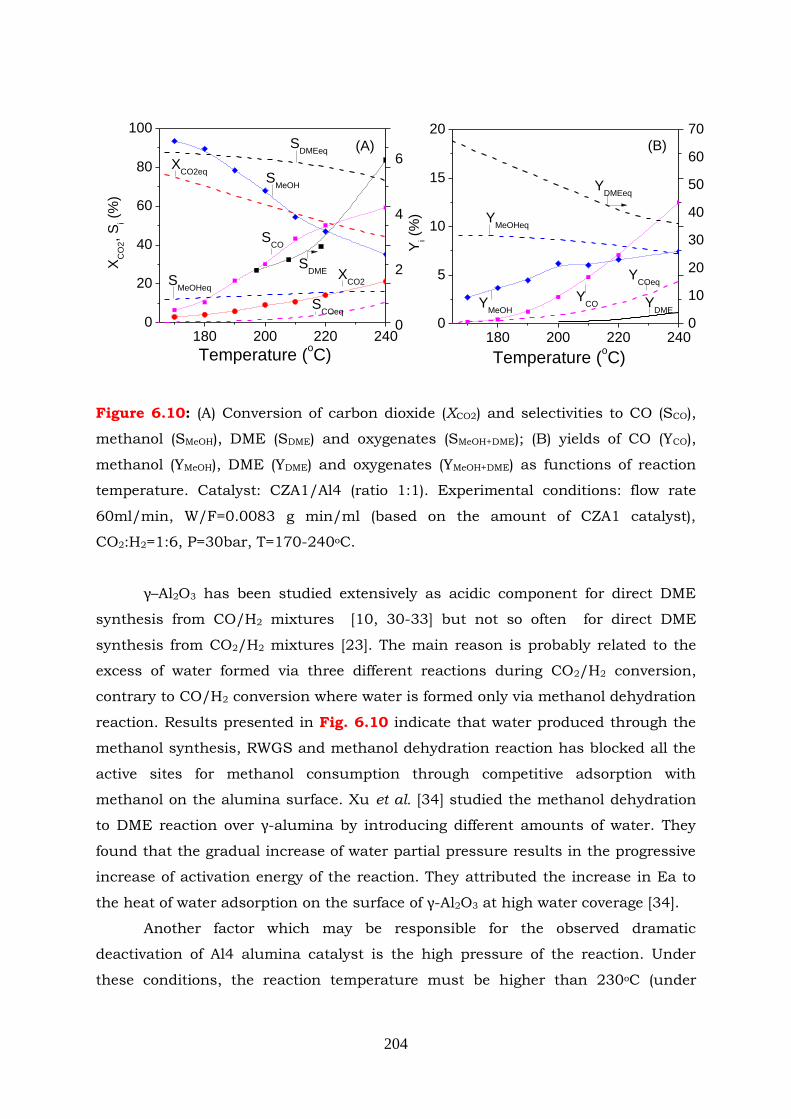
204
Figure 6.10: (A) Conversion of carbon dioxide (XCO2) and selectivities to CO (SCO),
methanol (SMeOH), DME (SDME) and oxygenates (SMeOH+DME); (B) yields of CO (YCO),
methanol (YMeOH), DME (YDME) and oxygenates (YMeOH+DME) as functions of reaction
temperature. Catalyst: CZA1/Al4 (ratio 1:1). Experimental conditions: flow rate
60ml/min, W/F=0.0083 g min/ml (based on the amount of CZA1 catalyst),
CO2:H2=1:6, P=30bar, T=170-240oC.
γ–Al2O3 has been studied extensively as acidic component for direct DME
synthesis from CO/H2 mixtures [10, 30-33] but not so often for direct DME
synthesis from CO2/H2 mixtures [23]. The main reason is probably related to the
excess of water formed via three different reactions during CO2/H2 conversion,
contrary to CO/H2 conversion where water is formed only via methanol dehydration
reaction. Results presented in Fig. 6.10 indicate that water produced through the
methanol synthesis, RWGS and methanol dehydration reaction has blocked all the
active sites for methanol consumption through competitive adsorption with
methanol on the alumina surface. Xu et al. [34] studied the methanol dehydration
to DME reaction over γ-alumina by introducing different amounts of water. They
found that the gradual increase of water partial pressure results in the progressive
increase of activation energy of the reaction. They attributed the increase in Ea to
the heat of water adsorption on the surface of γ-Al2O3 at high water coverage [34].
Another factor which may be responsible for the observed dramatic
deactivation of Al4 alumina catalyst is the high pressure of the reaction. Under
these conditions, the reaction temperature must be higher than 230oC (under
180 200 220 2400
20
40
60
80
100
SDME
SCO
XC
O2,
Si (
%)
Temperature (oC)
SMeOH
XCO2
(A)
XCO2eq
SDMEeq
SMeOHeq
SCOeq
0
2
4
6
180 200 220 2400
5
10
15
20
YMeOHeq
YDMEeq
YCOeq
YDME
YCO
Yi (
%)
Temperature (oC)
YMeOH
(B)
0
10
20
30
40
50
60
70
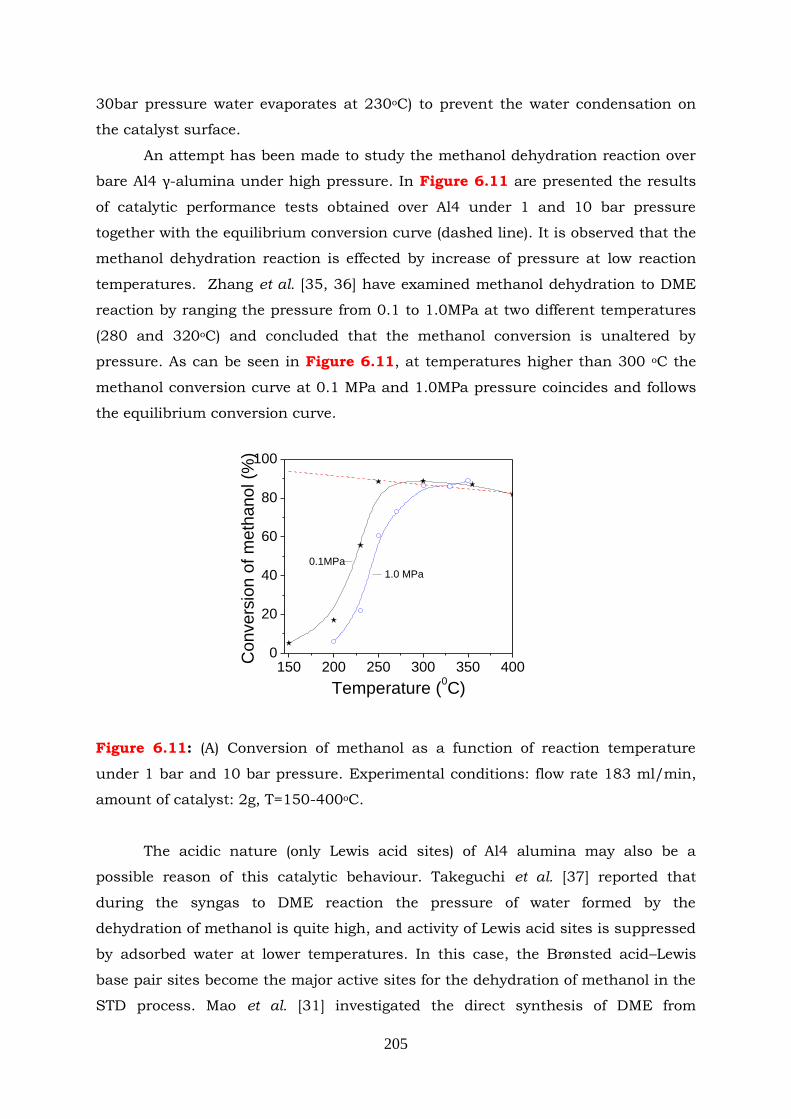
205
30bar pressure water evaporates at 230oC) to prevent the water condensation on
the catalyst surface.
An attempt has been made to study the methanol dehydration reaction over
bare Al4 γ-alumina under high pressure. In Figure 6.11 are presented the results
of catalytic performance tests obtained over Al4 under 1 and 10 bar pressure
together with the equilibrium conversion curve (dashed line). It is observed that the
methanol dehydration reaction is effected by increase of pressure at low reaction
temperatures. Zhang et al. [35, 36] have examined methanol dehydration to DME
reaction by ranging the pressure from 0.1 to 1.0MPa at two different temperatures
(280 and 320oC) and concluded that the methanol conversion is unaltered by
pressure. As can be seen in Figure 6.11, at temperatures higher than 300 oC the
methanol conversion curve at 0.1 MPa and 1.0MPa pressure coincides and follows
the equilibrium conversion curve.
Figure 6.11: (A) Conversion of methanol as a function of reaction temperature
under 1 bar and 10 bar pressure. Experimental conditions: flow rate 183 ml/min,
amount of catalyst: 2g, T=150-400oC.
The acidic nature (only Lewis acid sites) of Al4 alumina may also be a
possible reason of this catalytic behaviour. Takeguchi et al. [37] reported that
during the syngas to DME reaction the pressure of water formed by the
dehydration of methanol is quite high, and activity of Lewis acid sites is suppressed
by adsorbed water at lower temperatures. In this case, the Brønsted acid–Lewis
base pair sites become the major active sites for the dehydration of methanol in the
STD process. Mao et al. [31] investigated the direct synthesis of DME from
150 200 250 300 350 4000
20
40
60
80
100
0.1MPa
Convers
ion o
f m
eth
anol (%
)
Temperature (0C)
1.0 MPa
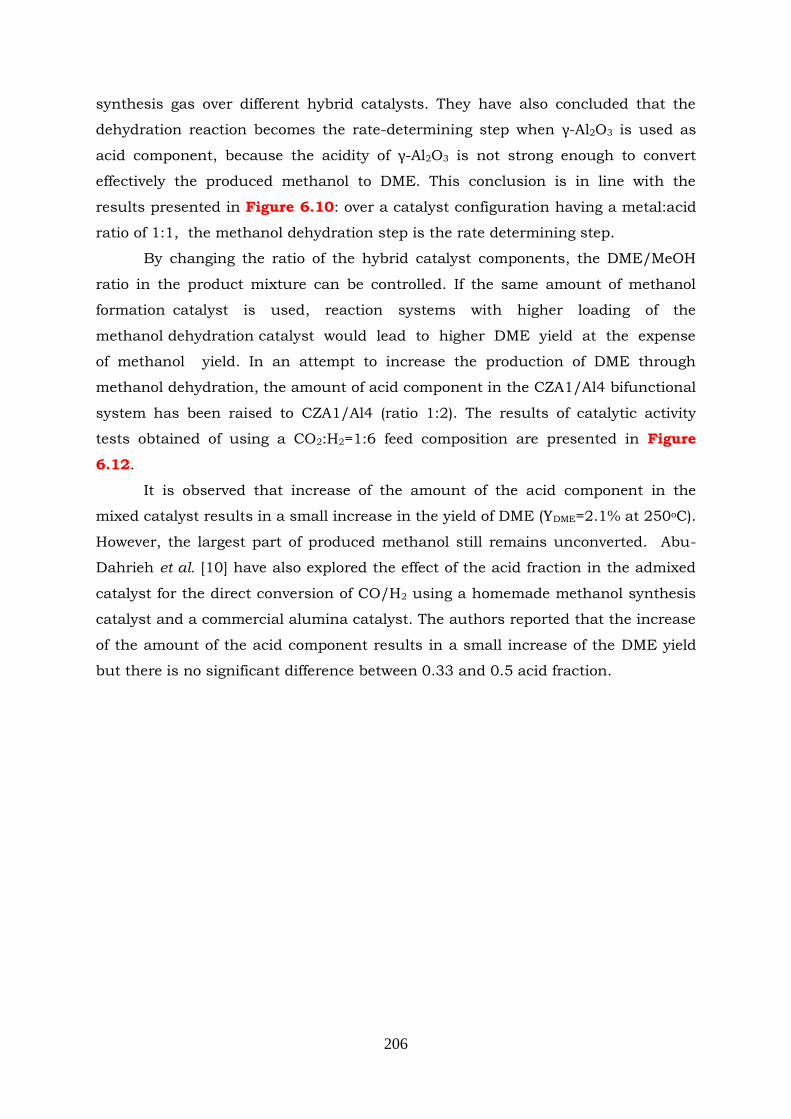
206
synthesis gas over different hybrid catalysts. They have also concluded that the
dehydration reaction becomes the rate-determining step when γ-Al2O3 is used as
acid component, because the acidity of γ-Al2O3 is not strong enough to convert
effectively the produced methanol to DME. This conclusion is in line with the
results presented in Figure 6.10: over a catalyst configuration having a metal:acid
ratio of 1:1, the methanol dehydration step is the rate determining step.
By changing the ratio of the hybrid catalyst components, the DME/MeOH
ratio in the product mixture can be controlled. If the same amount of methanol
formation catalyst is used, reaction systems with higher loading of the
methanol dehydration catalyst would lead to higher DME yield at the expense
of methanol yield. In an attempt to increase the production of DME through
methanol dehydration, the amount of acid component in the CZA1/Al4 bifunctional
system has been raised to CZA1/Al4 (ratio 1:2). The results of catalytic activity
tests obtained of using a CO2:H2=1:6 feed composition are presented in Figure
6.12.
It is observed that increase of the amount of the acid component in the
mixed catalyst results in a small increase in the yield of DME (YDME=2.1% at 250oC).
However, the largest part of produced methanol still remains unconverted. Abu-
Dahrieh et al. [10] have also explored the effect of the acid fraction in the admixed
catalyst for the direct conversion of CO/H2 using a homemade methanol synthesis
catalyst and a commercial alumina catalyst. The authors reported that the increase
of the amount of the acid component results in a small increase of the DME yield
but there is no significant difference between 0.33 and 0.5 acid fraction.
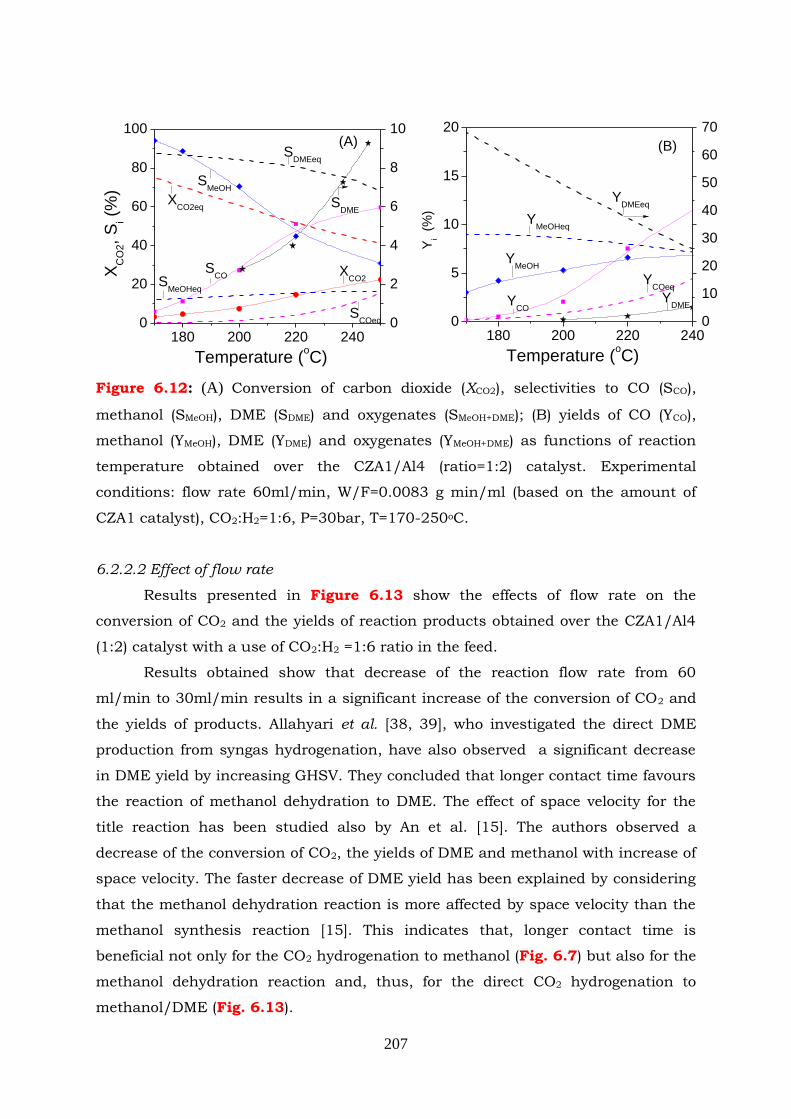
207
Figure 6.12: (A) Conversion of carbon dioxide (XCO2), selectivities to CO (SCO),
methanol (SMeOH), DME (SDME) and oxygenates (SMeOH+DME); (B) yields of CO (YCO),
methanol (YMeOH), DME (YDME) and oxygenates (YMeOH+DME) as functions of reaction
temperature obtained over the CZA1/Al4 (ratio=1:2) catalyst. Experimental
conditions: flow rate 60ml/min, W/F=0.0083 g min/ml (based on the amount of
CZA1 catalyst), CO2:H2=1:6, P=30bar, T=170-250oC.
6.2.2.2 Effect of flow rate
Results presented in Figure 6.13 show the effects of flow rate on the
conversion of CO2 and the yields of reaction products obtained over the CZA1/Al4
(1:2) catalyst with a use of CO2:H2 =1:6 ratio in the feed.
Results obtained show that decrease of the reaction flow rate from 60
ml/min to 30ml/min results in a significant increase of the conversion of CO2 and
the yields of products. Allahyari et al. [38, 39], who investigated the direct DME
production from syngas hydrogenation, have also observed a significant decrease
in DME yield by increasing GHSV. They concluded that longer contact time favours
the reaction of methanol dehydration to DME. The effect of space velocity for the
title reaction has been studied also by An et al. [15]. The authors observed a
decrease of the conversion of CO2, the yields of DME and methanol with increase of
space velocity. The faster decrease of DME yield has been explained by considering
that the methanol dehydration reaction is more affected by space velocity than the
methanol synthesis reaction [15]. This indicates that, longer contact time is
beneficial not only for the CO2 hydrogenation to methanol (Fig. 6.7) but also for the
methanol dehydration reaction and, thus, for the direct CO2 hydrogenation to
methanol/DME (Fig. 6.13).
180 200 220 2400
20
40
60
80
100(A)
XCO2
SCOeq
SMeOHeq
SDME
SDMEeq
SCO X
CO
2,
Si (
%)
Temperature (oC)
SMeOH
XCO2eq
0
2
4
6
8
10
180 200 220 2400
5
10
15
20
(B)
YDME
YMeOH
YCOeq
YDMEeq
YCO
Yi
(%)
Temperature (oC)
YMeOHeq
0
10
20
30
40
50
60
70
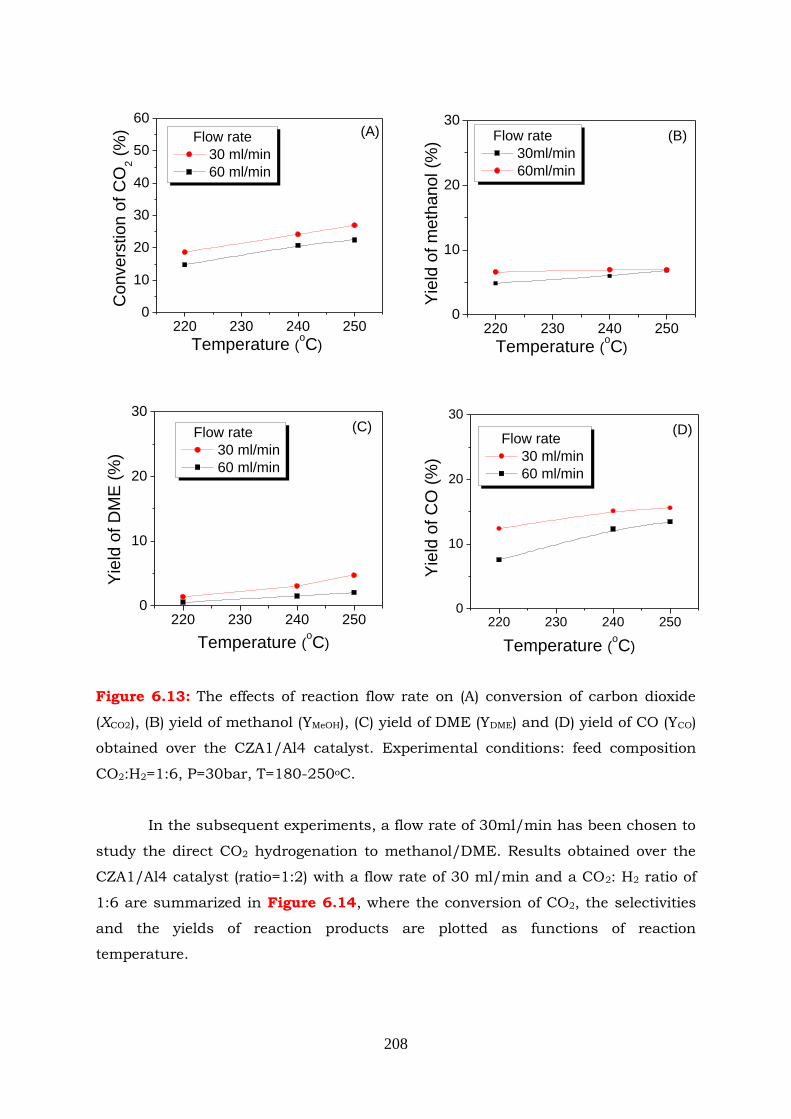
208
Figure 6.13: The effects of reaction flow rate on (A) conversion of carbon dioxide
(XCO2), (B) yield of methanol (YMeOH), (C) yield of DME (YDME) and (D) yield of CO (YCO)
obtained over the CZA1/Al4 catalyst. Experimental conditions: feed composition
CO2:H2=1:6, P=30bar, T=180-250oC.
In the subsequent experiments, a flow rate of 30ml/min has been chosen to
study the direct CO2 hydrogenation to methanol/DME. Results obtained over the
CZA1/Al4 catalyst (ratio=1:2) with a flow rate of 30 ml/min and a CO2: H2 ratio of
1:6 are summarized in Figure 6.14, where the conversion of CO2, the selectivities
and the yields of reaction products are plotted as functions of reaction
temperature.
220 230 240 2500
10
20
30
40
50
60
Flow rate
30 ml/min
60 ml/min
Convers
tion o
f C
O2 (
%)
Temperature (oC)
(A)
220 230 240 2500
10
20
30
Flow rate
30 ml/min
60 ml/min
Yie
ld o
f C
O (
%)
Temperature (oC)
(D)
220 230 240 2500
10
20
30
Flow rate
30ml/min
60ml/min
Y
ield
of
meth
anol (%
)
Temperature (oC)
(B)
220 230 240 2500
10
20
30
Flow rate
30 ml/min
60 ml/min
Yie
ld o
f D
ME
(%
)
Temperature (oC)
(C)
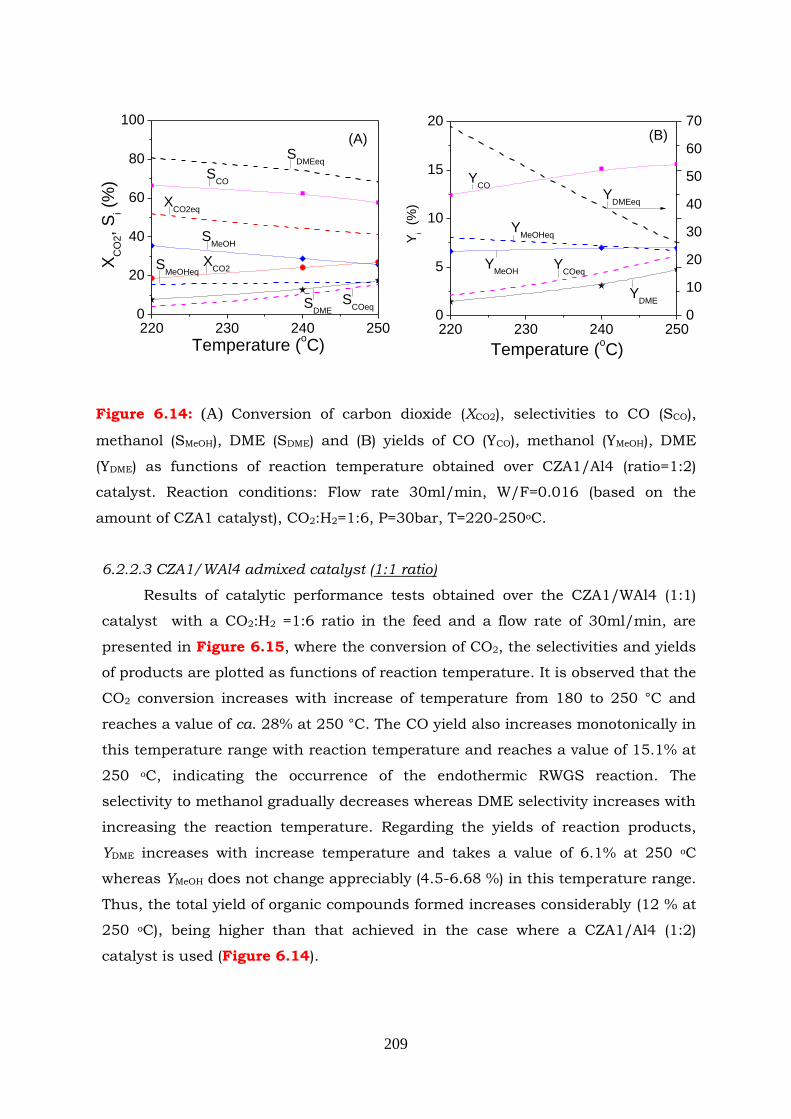
209
Figure 6.14: (A) Conversion of carbon dioxide (XCO2), selectivities to CO (SCO),
methanol (SMeOH), DME (SDME) and (B) yields of CO (YCO), methanol (YMeOH), DME
(YDME) as functions of reaction temperature obtained over CZA1/Al4 (ratio=1:2)
catalyst. Reaction conditions: Flow rate 30ml/min, W/F=0.016 (based on the
amount of CZA1 catalyst), CO2:H2=1:6, P=30bar, T=220-250oC.
6.2.2.3 CZA1/WAl4 admixed catalyst (1:1 ratio)
Results of catalytic performance tests obtained over the CZA1/WAl4 (1:1)
catalyst with a CO2:H2 =1:6 ratio in the feed and a flow rate of 30ml/min, are
presented in Figure 6.15, where the conversion of CO2, the selectivities and yields
of products are plotted as functions of reaction temperature. It is observed that the
CO2 conversion increases with increase of temperature from 180 to 250 °C and
reaches a value of ca. 28% at 250 °C. The CO yield also increases monotonically in
this temperature range with reaction temperature and reaches a value of 15.1% at
250 oC, indicating the occurrence of the endothermic RWGS reaction. The
selectivity to methanol gradually decreases whereas DME selectivity increases with
increasing the reaction temperature. Regarding the yields of reaction products,
YDME increases with increase temperature and takes a value of 6.1% at 250 oC
whereas YMeOH does not change appreciably (4.5-6.68 %) in this temperature range.
Thus, the total yield of organic compounds formed increases considerably (12 % at
250 oC), being higher than that achieved in the case where a CZA1/Al4 (1:2)
catalyst is used (Figure 6.14).
220 230 240 2500
20
40
60
80
100
(A)
XCO2
SCOeq
SMeOHeq
SDME
SDMEeq
SCO
XC
O2,
Si (
%)
Temperature (oC)
SMeOH
XCO2eq
220 230 240 2500
5
10
15
20(B)
YDME
YMeOH
YCOeq
YDMEeq
YCO
Yi
(%)
Temperature (oC)
YMeOHeq
0
10
20
30
40
50
60
70
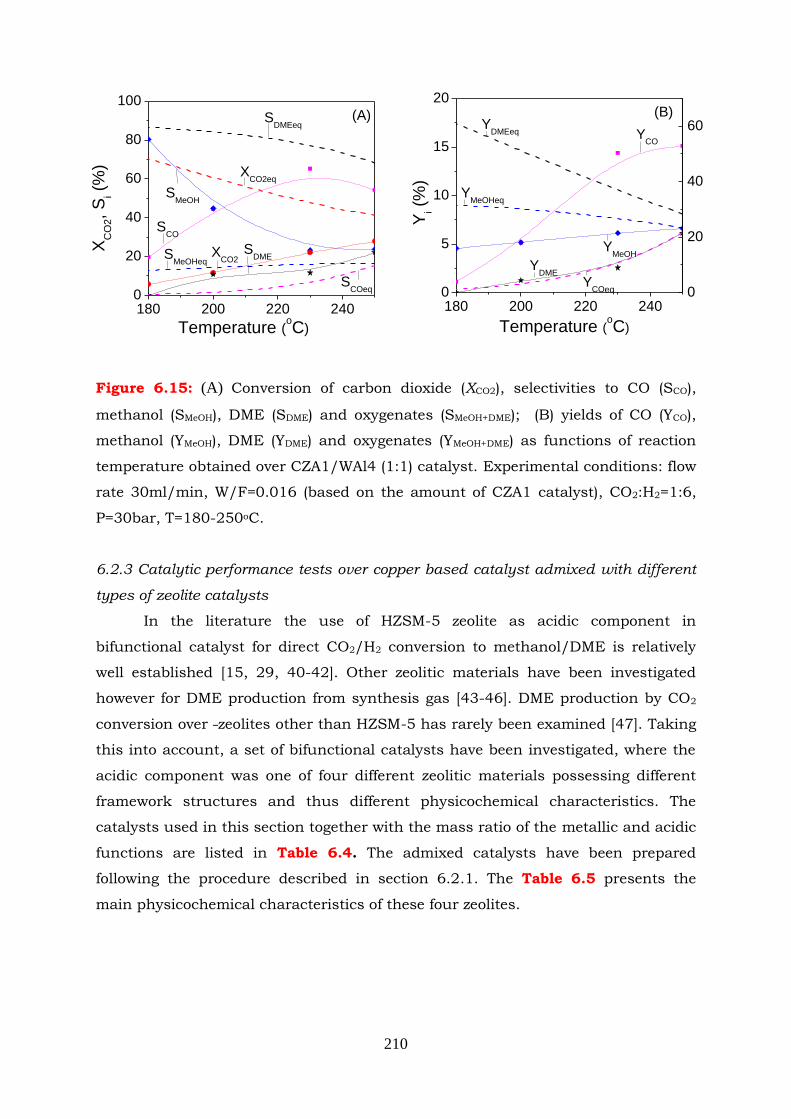
210
Figure 6.15: (A) Conversion of carbon dioxide (XCO2), selectivities to CO (SCO),
methanol (SMeOH), DME (SDME) and oxygenates (SMeOH+DME); (B) yields of CO (YCO),
methanol (YMeOH), DME (YDME) and oxygenates (YMeOH+DME) as functions of reaction
temperature obtained over CZA1/WAl4 (1:1) catalyst. Experimental conditions: flow
rate 30ml/min, W/F=0.016 (based on the amount of CZA1 catalyst), CO2:H2=1:6,
P=30bar, T=180-250oC.
6.2.3 Catalytic performance tests over copper based catalyst admixed with different
types of zeolite catalysts
In the literature the use of HZSM-5 zeolite as acidic component in
bifunctional catalyst for direct CO2/H2 conversion to methanol/DME is relatively
well established [15, 29, 40-42]. Other zeolitic materials have been investigated
however for DME production from synthesis gas [43-46]. DME production by CO2
conversion over zeolites other than HZSM-5 has rarely been examined [47]. Taking
this into account, a set of bifunctional catalysts have been investigated, where the
acidic component was one of four different zeolitic materials possessing different
framework structures and thus different physicochemical characteristics. The
catalysts used in this section together with the mass ratio of the metallic and acidic
functions are listed in Table 6.4. The admixed catalysts have been prepared
following the procedure described in section 6.2.1. The Table 6.5 presents the
main physicochemical characteristics of these four zeolites.
180 200 220 2400
20
40
60
80
100
SCOeq
SMeOHeq
SDMEeq
SDME
SCO
XC
O2,
Si (
%)
Temperature (oC)
SMeOH
XCO2
(A)
XCO2eq
180 200 220 2400
5
10
15
20
YMeOHeq
YDME
YCO
Yi (
%)
Temperature (oC)
YMeOH
(B)
YCOeq
YDMEeq
0
20
40
60
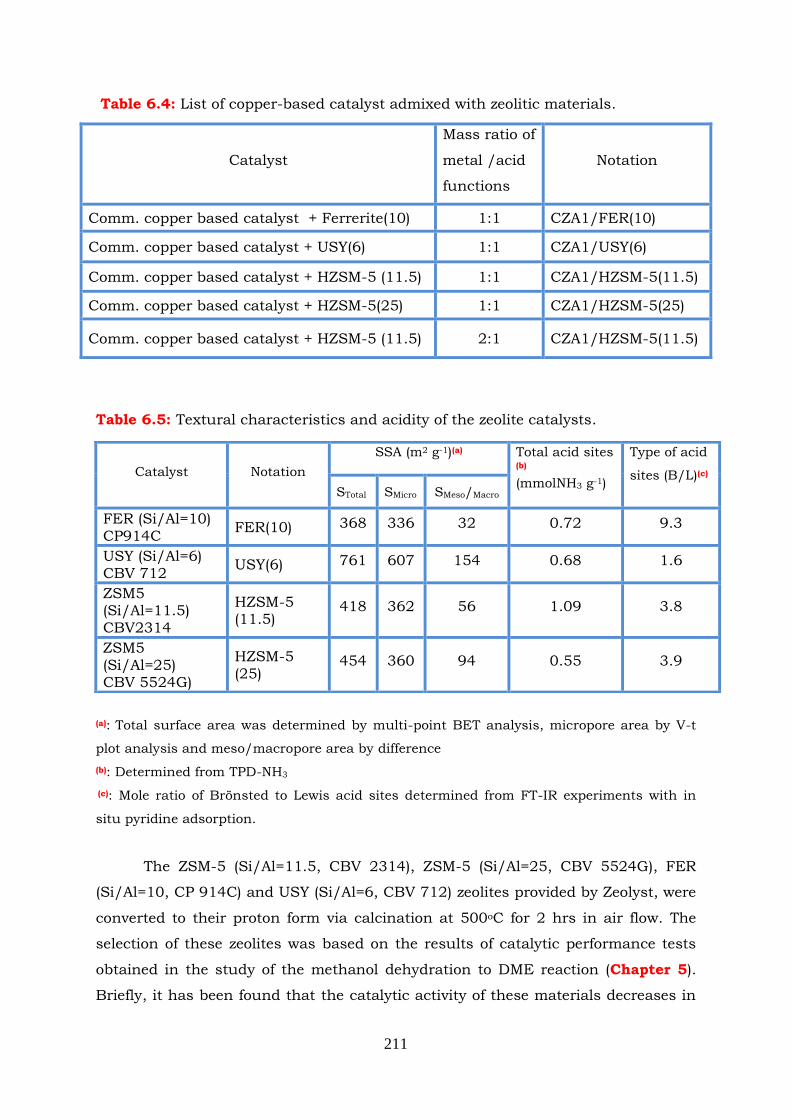
211
Table 6.4: List of copper-based catalyst admixed with zeolitic materials.
Table 6.5: Textural characteristics and acidity of the zeolite catalysts.
(a): Total surface area was determined by multi-point BET analysis, micropore area by V-t
plot analysis and meso/macropore area by difference
(b): Determined from TPD-NH3
(c): Mole ratio of Brönsted to Lewis acid sites determined from FT-IR experiments with in
situ pyridine adsorption.
The ZSM-5 (Si/Al=11.5, CBV 2314), ZSM-5 (Si/Al=25, CBV 5524G), FER
(Si/Al=10, CP 914C) and USY (Si/Al=6, CBV 712) zeolites provided by Zeolyst, were
converted to their proton form via calcination at 500oC for 2 hrs in air flow. The
selection of these zeolites was based on the results of catalytic performance tests
obtained in the study of the methanol dehydration to DME reaction (Chapter 5).
Briefly, it has been found that the catalytic activity of these materials decreases in
Catalyst
Mass ratio of
metal /acid
functions
Notation
Comm. copper based catalyst + Ferrerite(10) 1:1 CZA1/FER(10)
Comm. copper based catalyst + USY(6) 1:1 CZA1/USY(6)
Comm. copper based catalyst + HZSM-5 (11.5) 1:1 CZA1/HZSM-5(11.5)
Comm. copper based catalyst + HZSM-5(25) 1:1 CZA1/HZSM-5(25)
Comm. copper based catalyst + HZSM-5 (11.5) 2:1 CZA1/HZSM-5(11.5)
Catalyst Notation
SSA (m2 g-1)(a) Total acid sites (b)
(mmolNH3 g-1)
Type of acid
sites (B/L)(c)
STotal SMicro SMeso/Macro
FER (Si/Al=10) CP914C
FER(10) 368 336 32 0.72 9.3
USY (Si/Al=6) CBV 712
USY(6) 761 607 154 0.68 1.6
ZSM5 (Si/Al=11.5) CBV2314
HZSM-5 (11.5)
418 362 56 1.09 3.8
ZSM5 (Si/Al=25) CBV 5524G)
HZSM-5 (25)
454 360 94 0.55 3.9
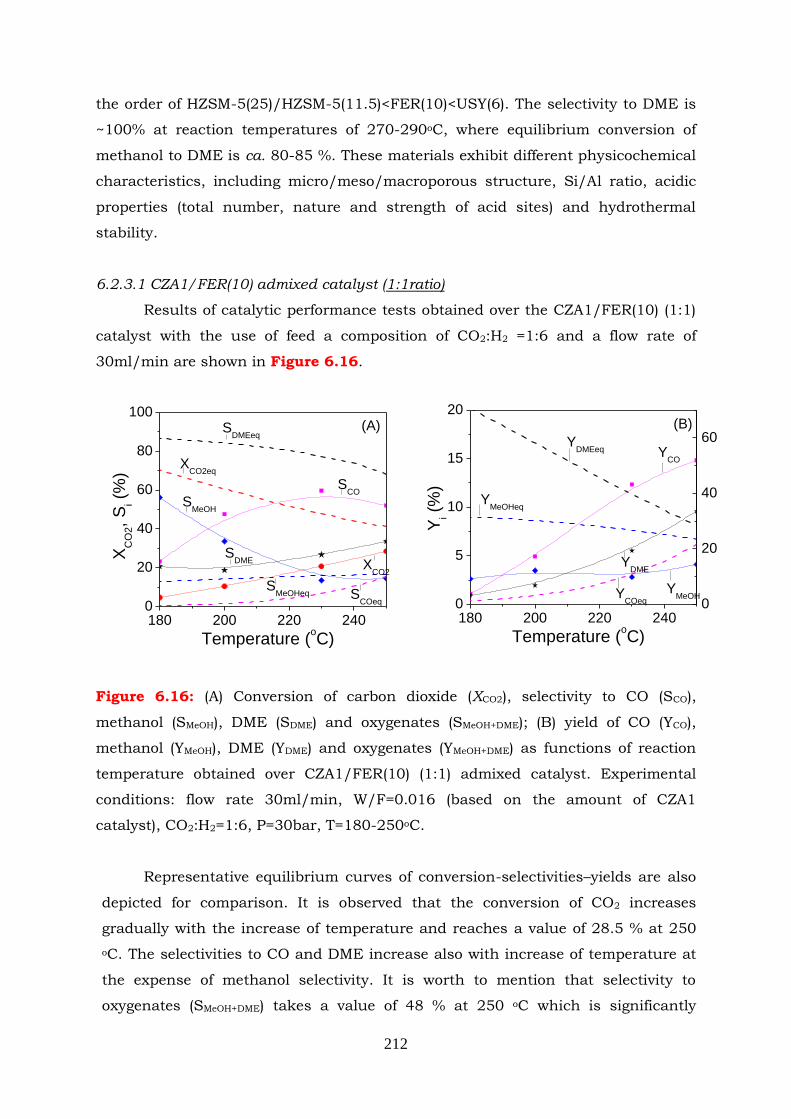
212
the order of HZSM-5(25)/HZSM-5(11.5)<FER(10)<USY(6). The selectivity to DME is
~100% at reaction temperatures of 270-290oC, where equilibrium conversion of
methanol to DME is ca. 80-85 %. These materials exhibit different physicochemical
characteristics, including micro/meso/macroporous structure, Si/Al ratio, acidic
properties (total number, nature and strength of acid sites) and hydrothermal
stability.
6.2.3.1 CZA1/FER(10) admixed catalyst (1:1ratio)
Results of catalytic performance tests obtained over the CZA1/FER(10) (1:1)
catalyst with the use of feed a composition of CO2:H2 =1:6 and a flow rate of
30ml/min are shown in Figure 6.16.
Figure 6.16: (A) Conversion of carbon dioxide (XCO2), selectivity to CO (SCO),
methanol (SMeOH), DME (SDME) and oxygenates (SMeOH+DME); (B) yield of CO (YCO),
methanol (YMeOH), DME (YDME) and oxygenates (YMeOH+DME) as functions of reaction
temperature obtained over CZA1/FER(10) (1:1) admixed catalyst. Experimental
conditions: flow rate 30ml/min, W/F=0.016 (based on the amount of CZA1
catalyst), CO2:H2=1:6, P=30bar, T=180-250oC.
Representative equilibrium curves of conversion-selectivities–yields are also
depicted for comparison. It is observed that the conversion of CO2 increases
gradually with the increase of temperature and reaches a value of 28.5 % at 250
oC. The selectivities to CO and DME increase also with increase of temperature at
the expense of methanol selectivity. It is worth to mention that selectivity to
oxygenates (SMeOH+DME) takes a value of 48 % at 250 oC which is significantly
180 200 220 2400
20
40
60
80
100
SMeOHeq
SDMEeq
XCO2eq
SDME
SCO
XC
O2,
Si (
%)
Temperature (oC)
SMeOH
XCO2
(A)
SCOeq
180 200 220 2400
5
10
15
20
YCOeq
YMeOHeq
YDME
YCO
Yi (
%)
Temperature (oC)
YMeOH
(B)
YDMEeq
0
20
40
60
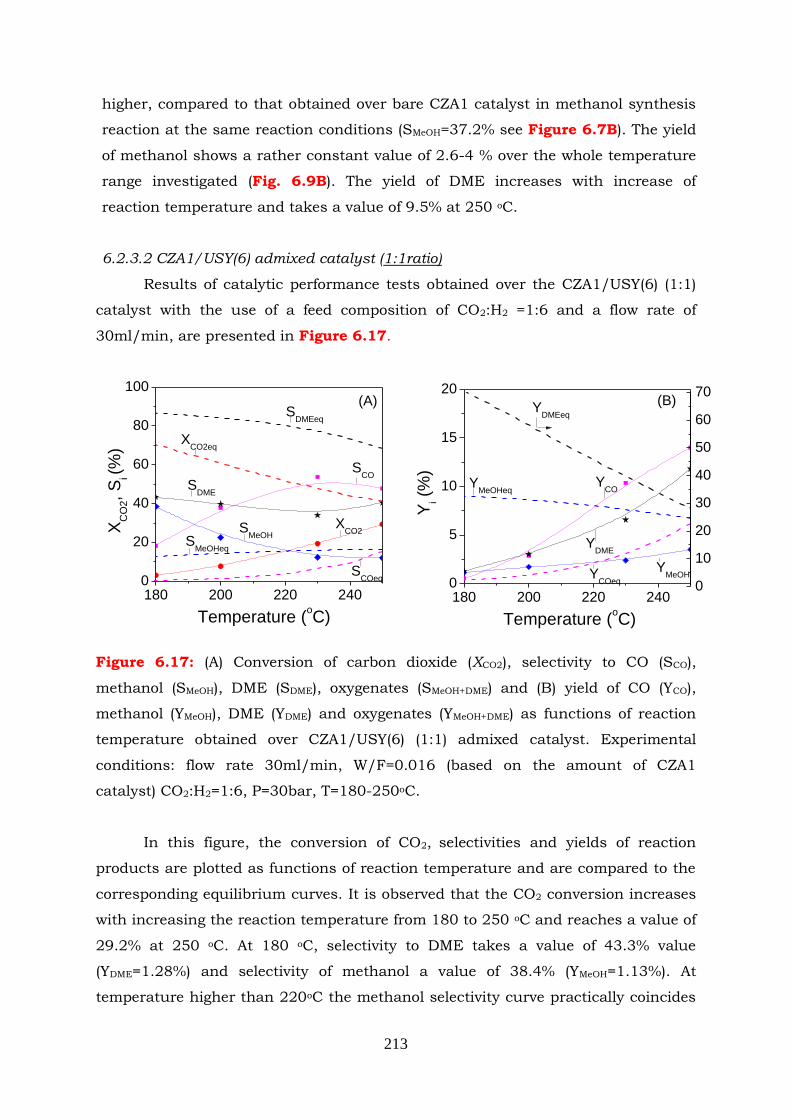
213
higher, compared to that obtained over bare CZA1 catalyst in methanol synthesis
reaction at the same reaction conditions (SMeOH=37.2% see Figure 6.7B). The yield
of methanol shows a rather constant value of 2.6-4 % over the whole temperature
range investigated (Fig. 6.9B). The yield of DME increases with increase of
reaction temperature and takes a value of 9.5% at 250 oC.
6.2.3.2 CZA1/USY(6) admixed catalyst (1:1ratio)
Results of catalytic performance tests obtained over the CZA1/USY(6) (1:1)
catalyst with the use of a feed composition of CO2:H2 =1:6 and a flow rate of
30ml/min, are presented in Figure 6.17.
Figure 6.17: (A) Conversion of carbon dioxide (XCO2), selectivity to CO (SCO),
methanol (SMeOH), DME (SDME), oxygenates (SMeOH+DME) and (B) yield of CO (YCO),
methanol (YMeOH), DME (YDME) and oxygenates (YMeOH+DME) as functions of reaction
temperature obtained over CZA1/USY(6) (1:1) admixed catalyst. Experimental
conditions: flow rate 30ml/min, W/F=0.016 (based on the amount of CZA1
catalyst) CO2:H2=1:6, P=30bar, T=180-250oC.
In this figure, the conversion of CO2, selectivities and yields of reaction
products are plotted as functions of reaction temperature and are compared to the
corresponding equilibrium curves. It is observed that the CO2 conversion increases
with increasing the reaction temperature from 180 to 250 oC and reaches a value of
29.2% at 250 oC. At 180 oC, selectivity to DME takes a value of 43.3% value
(YDME=1.28%) and selectivity of methanol a value of 38.4% (YMeOH=1.13%). At
temperature higher than 220oC the methanol selectivity curve practically coincides
180 200 220 2400
20
40
60
80
100
XCO2eq
SMeOHeq
SCOeq
SDMEeq
SDME
SCO
XC
O2,
Si (%
)
Temperature (oC)
SMeOH
XCO2
(A)
180 200 220 2400
5
10
15
20
YCOeq
YMeOHeq
YDMEeq
YDME
YCO
Yi (
%)
Temperature (oC)
YMeOH
(B)
0
10
20
30
40
50
60
70
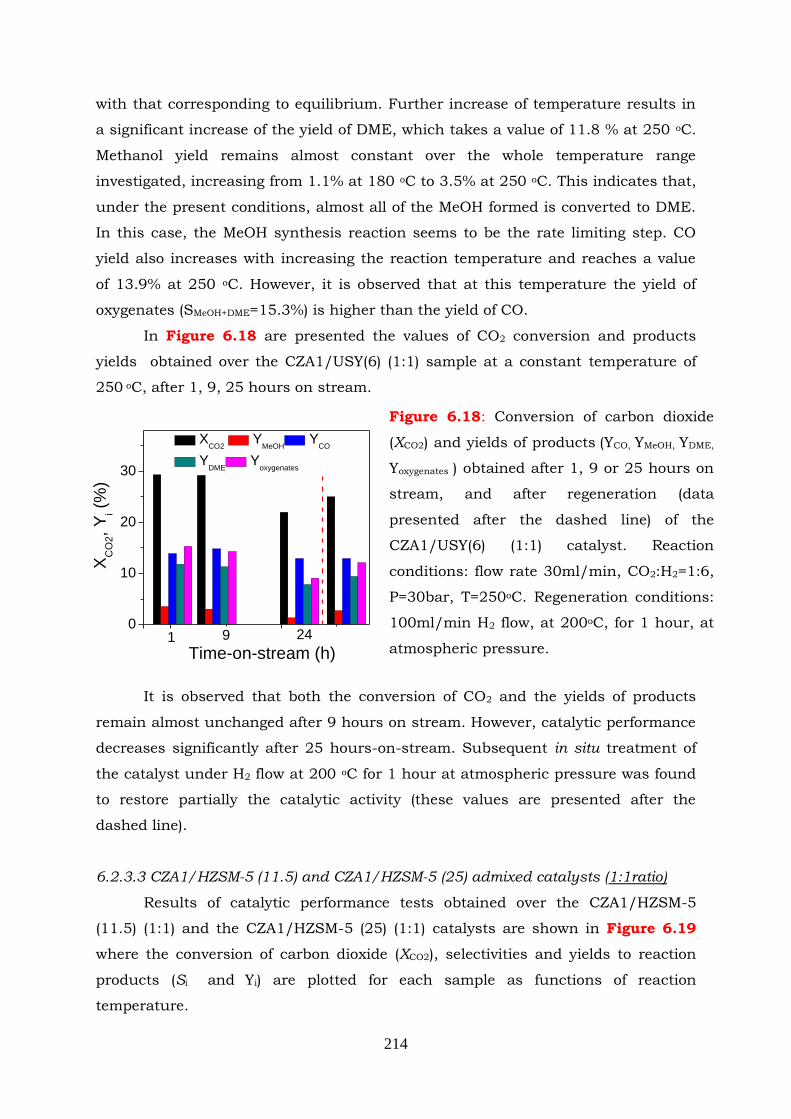
214
with that corresponding to equilibrium. Further increase of temperature results in
a significant increase of the yield of DME, which takes a value of 11.8 % at 250 oC.
Methanol yield remains almost constant over the whole temperature range
investigated, increasing from 1.1% at 180 oC to 3.5% at 250 oC. This indicates that,
under the present conditions, almost all of the MeOH formed is converted to DME.
In this case, the MeOH synthesis reaction seems to be the rate limiting step. CO
yield also increases with increasing the reaction temperature and reaches a value
of 13.9% at 250 oC. However, it is observed that at this temperature the yield of
oxygenates (SMeOH+DME=15.3%) is higher than the yield of CO.
In Figure 6.18 are presented the values of CO2 conversion and products
yields obtained over the CZA1/USY(6) (1:1) sample at a constant temperature of
250 oC, after 1, 9, 25 hours on stream.
It is observed that both the conversion of CO2 and the yields of products
remain almost unchanged after 9 hours on stream. However, catalytic performance
decreases significantly after 25 hours-on-stream. Subsequent in situ treatment of
the catalyst under H2 flow at 200 oC for 1 hour at atmospheric pressure was found
to restore partially the catalytic activity (these values are presented after the
dashed line).
6.2.3.3 CZA1/HZSM-5 (11.5) and CZA1/HZSM-5 (25) admixed catalysts (1:1ratio)
Results of catalytic performance tests obtained over the CZA1/HZSM-5
(11.5) (1:1) and the CZA1/HZSM-5 (25) (1:1) catalysts are shown in Figure 6.19
where the conversion of carbon dioxide (XCO2), selectivities and yields to reaction
products (Si and Yi) are plotted for each sample as functions of reaction
temperature.
0
10
20
30
XC
O2,
Yi (
%)
Time-on-stream (h)
XCO2
YMeOH
YCO
YDME
Yoxygenates
1 9 24
Figure 6.18: Conversion of carbon dioxide
(XCO2) and yields of products (YCO, YMeOH, YDME,
Yoxygenates ) obtained after 1, 9 or 25 hours on
stream, and after regeneration (data
presented after the dashed line) of the
CZA1/USY(6) (1:1) catalyst. Reaction
conditions: flow rate 30ml/min, CO2:H2=1:6,
P=30bar, T=250oC. Regeneration conditions:
100ml/min H2 flow, at 200oC, for 1 hour, at
atmospheric pressure.
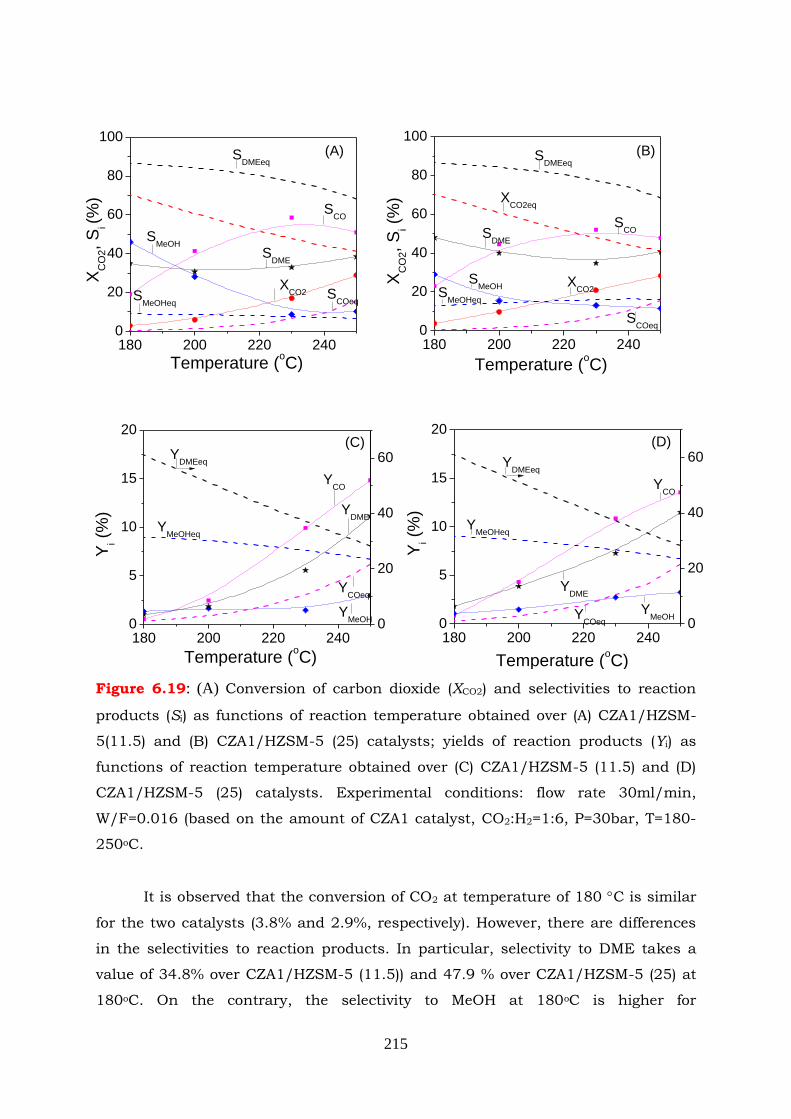
215
Figure 6.19: (A) Conversion of carbon dioxide (XCO2) and selectivities to reaction
products (Si) as functions of reaction temperature obtained over (A) CZA1/HZSM-
5(11.5) and (B) CZA1/HZSM-5 (25) catalysts; yields of reaction products (Yi) as
functions of reaction temperature obtained over (C) CZA1/HZSM-5 (11.5) and (D)
CZA1/HZSM-5 (25) catalysts. Experimental conditions: flow rate 30ml/min,
W/F=0.016 (based on the amount of CZA1 catalyst, CO2:H2=1:6, P=30bar, T=180-
250oC.
It is observed that the conversion of CO2 at temperature of 180 C is similar
for the two catalysts (3.8% and 2.9%, respectively). However, there are differences
in the selectivities to reaction products. In particular, selectivity to DME takes a
value of 34.8% over CZA1/HZSM-5 (11.5)) and 47.9 % over CZA1/HZSM-5 (25) at
180oC. On the contrary, the selectivity to MeOH at 180oC is higher for
180 200 220 2400
5
10
15
20
YDME
YCOeq
YMeOHeq
YDMEeq
YCO
Yi (
%)
Temperature (oC)
YMeOH
(C)
0
20
40
60
180 200 220 2400
5
10
15
20
YDMEeq
YCOeq
YMeOHeq
YDME
YCO
Yi (
%)
Temperature (oC)
YMeOH
(D)
0
20
40
60
180 200 220 2400
20
40
60
80
100
SDMEeq
SDME
SCO
XC
O2,
Si (%
)
Temperature (oC)
SMeOH
XCO2
(A)
SMeOHeq
SCOeq
180 200 220 2400
20
40
60
80
100
SCOeq
SMeOHeq
SDMEeq
XCO2eq
SDME
SCO
XC
O2,
Si (
%)
Temperature (oC)
SMeOH X
CO2
(B)
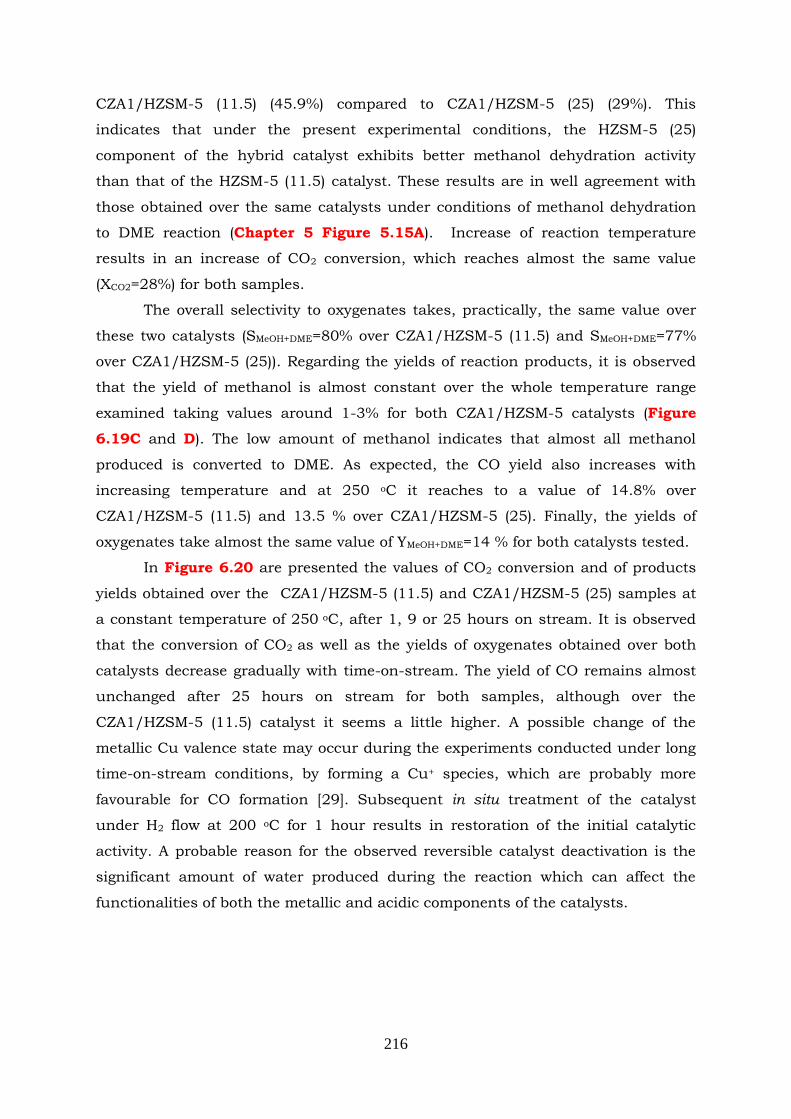
216
CZA1/HZSM-5 (11.5) (45.9%) compared to CZA1/HZSM-5 (25) (29%). This
indicates that under the present experimental conditions, the HZSM-5 (25)
component of the hybrid catalyst exhibits better methanol dehydration activity
than that of the HZSM-5 (11.5) catalyst. These results are in well agreement with
those obtained over the same catalysts under conditions of methanol dehydration
to DME reaction (Chapter 5 Figure 5.15A). Increase of reaction temperature
results in an increase of CO2 conversion, which reaches almost the same value
(XCO2=28%) for both samples.
The overall selectivity to oxygenates takes, practically, the same value over
these two catalysts (SMeOH+DME=80% over CZA1/HZSM-5 (11.5) and SMeOH+DME=77%
over CZA1/HZSM-5 (25)). Regarding the yields of reaction products, it is observed
that the yield of methanol is almost constant over the whole temperature range
examined taking values around 1-3% for both CZA1/HZSM-5 catalysts (Figure
6.19C and D). The low amount of methanol indicates that almost all methanol
produced is converted to DME. As expected, the CO yield also increases with
increasing temperature and at 250 oC it reaches to a value of 14.8% over
CZA1/HZSM-5 (11.5) and 13.5 % over CZA1/HZSM-5 (25). Finally, the yields of
oxygenates take almost the same value of YMeOH+DME=14 % for both catalysts tested.
In Figure 6.20 are presented the values of CO2 conversion and of products
yields obtained over the CZA1/HZSM-5 (11.5) and CZA1/HZSM-5 (25) samples at
a constant temperature of 250 oC, after 1, 9 or 25 hours on stream. It is observed
that the conversion of CO2 as well as the yields of oxygenates obtained over both
catalysts decrease gradually with time-on-stream. The yield of CO remains almost
unchanged after 25 hours on stream for both samples, although over the
CZA1/HZSM-5 (11.5) catalyst it seems a little higher. A possible change of the
metallic Cu valence state may occur during the experiments conducted under long
time-on-stream conditions, by forming a Cu+ species, which are probably more
favourable for CO formation [29]. Subsequent in situ treatment of the catalyst
under H2 flow at 200 oC for 1 hour results in restoration of the initial catalytic
activity. A probable reason for the observed reversible catalyst deactivation is the
significant amount of water produced during the reaction which can affect the
functionalities of both the metallic and acidic components of the catalysts.
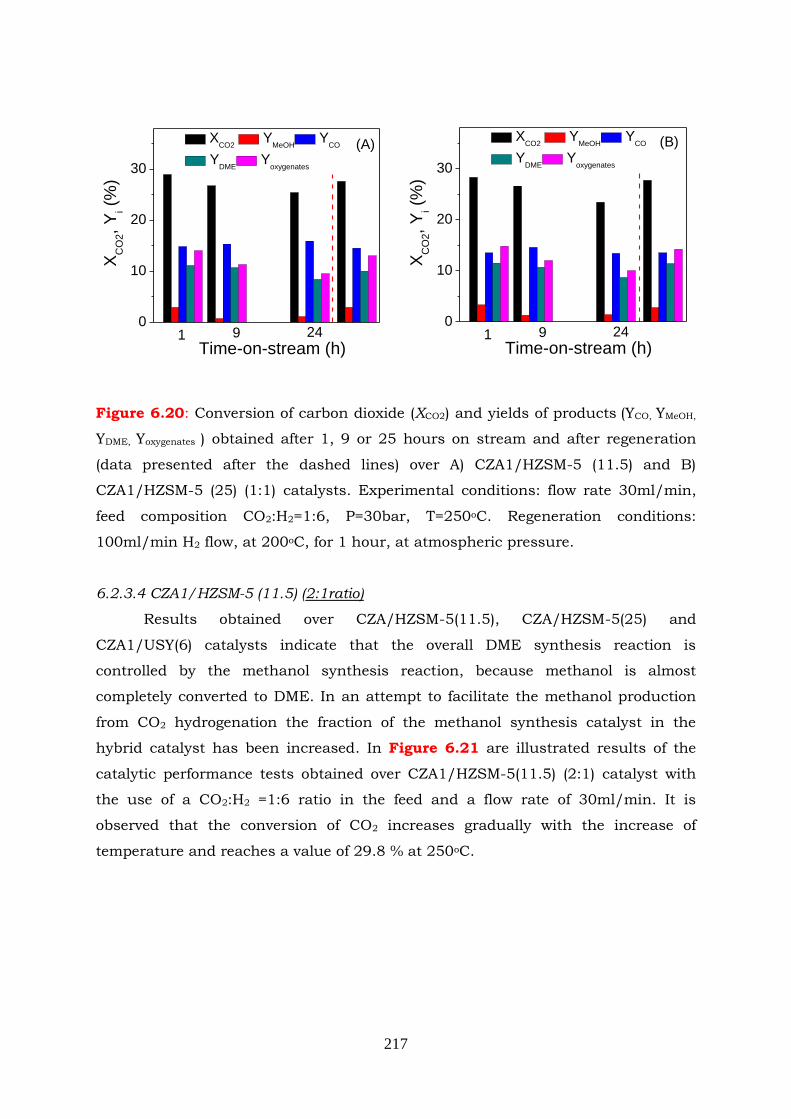
217
Figure 6.20: Conversion of carbon dioxide (XCO2) and yields of products (YCO, YMeOH,
YDME, Yoxygenates ) obtained after 1, 9 or 25 hours on stream and after regeneration
(data presented after the dashed lines) over A) CZA1/HZSM-5 (11.5) and B)
CZA1/HZSM-5 (25) (1:1) catalysts. Experimental conditions: flow rate 30ml/min,
feed composition CO2:H2=1:6, P=30bar, T=250oC. Regeneration conditions:
100ml/min H2 flow, at 200oC, for 1 hour, at atmospheric pressure.
6.2.3.4 CZA1/HZSM-5 (11.5) (2:1ratio)
Results obtained over CZA/HZSM-5(11.5), CZA/HZSM-5(25) and
CZA1/USY(6) catalysts indicate that the overall DME synthesis reaction is
controlled by the methanol synthesis reaction, because methanol is almost
completely converted to DME. In an attempt to facilitate the methanol production
from CO2 hydrogenation the fraction of the methanol synthesis catalyst in the
hybrid catalyst has been increased. In Figure 6.21 are illustrated results of the
catalytic performance tests obtained over CZA1/HZSM-5(11.5) (2:1) catalyst with
the use of a CO2:H2 =1:6 ratio in the feed and a flow rate of 30ml/min. It is
observed that the conversion of CO2 increases gradually with the increase of
temperature and reaches a value of 29.8 % at 250oC.
0
10
20
30
(A)
XC
O2,
Yi (
%)
Time-on-stream (h)
XCO2
YMeOH
YCO
YDME
Yoxygenates
1 9 240
10
20
30
XC
O2,
Yi (
%)
Time-on-stream (h)
XCO2
YMeOH
YCO
YDME
Yoxygenates
1 9 24
(B)
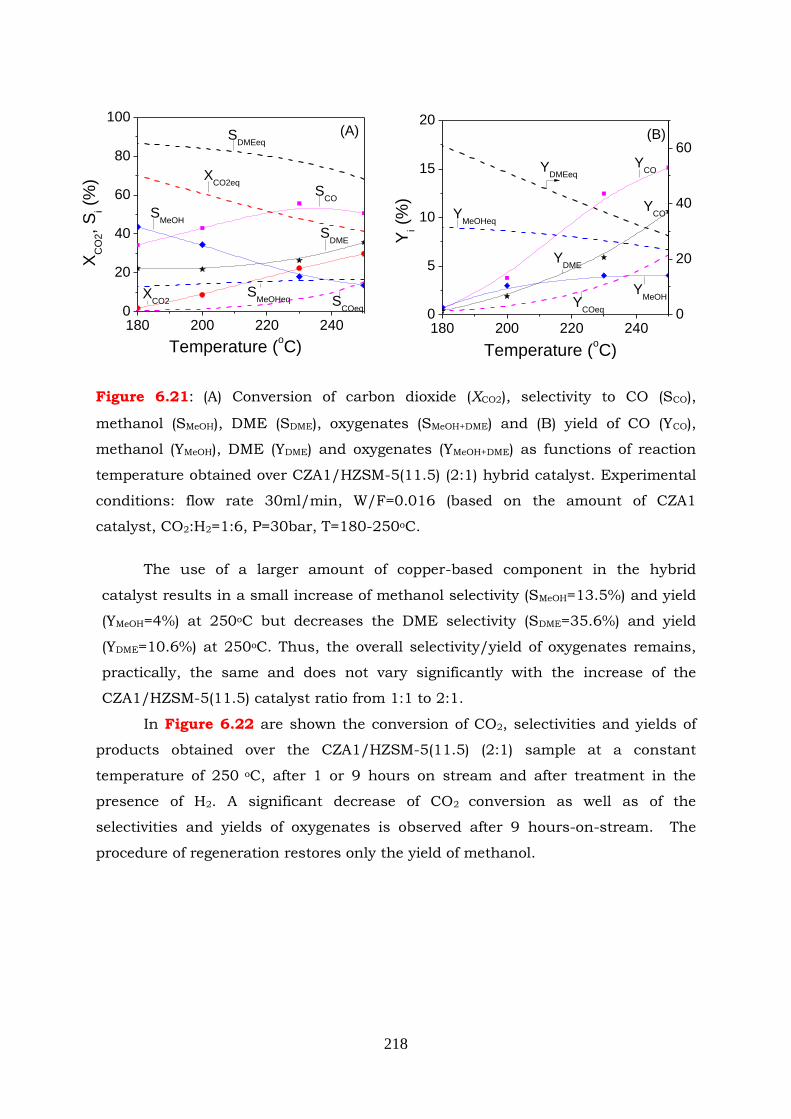
218
Figure 6.21: (A) Conversion of carbon dioxide (XCO2), selectivity to CO (SCO),
methanol (SMeOH), DME (SDME), oxygenates (SMeOH+DME) and (B) yield of CO (YCO),
methanol (YMeOH), DME (YDME) and oxygenates (YMeOH+DME) as functions of reaction
temperature obtained over CZA1/HZSM-5(11.5) (2:1) hybrid catalyst. Experimental
conditions: flow rate 30ml/min, W/F=0.016 (based on the amount of CZA1
catalyst, CO2:H2=1:6, P=30bar, T=180-250oC.
The use of a larger amount of copper-based component in the hybrid
catalyst results in a small increase of methanol selectivity (SMeOH=13.5%) and yield
(YMeOH=4%) at 250oC but decreases the DME selectivity (SDME=35.6%) and yield
(YDME=10.6%) at 250oC. Thus, the overall selectivity/yield of oxygenates remains,
practically, the same and does not vary significantly with the increase of the
CZA1/HZSM-5(11.5) catalyst ratio from 1:1 to 2:1.
In Figure 6.22 are shown the conversion of CO2, selectivities and yields of
products obtained over the CZA1/HZSM-5(11.5) (2:1) sample at a constant
temperature of 250 oC, after 1 or 9 hours on stream and after treatment in the
presence of H2. A significant decrease of CO2 conversion as well as of the
selectivities and yields of oxygenates is observed after 9 hours-on-stream. The
procedure of regeneration restores only the yield of methanol.
180 200 220 2400
20
40
60
80
100
SMeOHeq S
COeq
XCO2eq
SDMEeq
SDME
SCO
XC
O2,
Si (
%)
Temperature (oC)
SMeOH
XCO2
(A)
180 200 220 2400
5
10
15
20
YDME
YCOeq
YMeOHeq
YCO
YDMEeq
YCO
Yi (
%)
Temperature (oC)
YMeOH
(B)
0
20
40
60
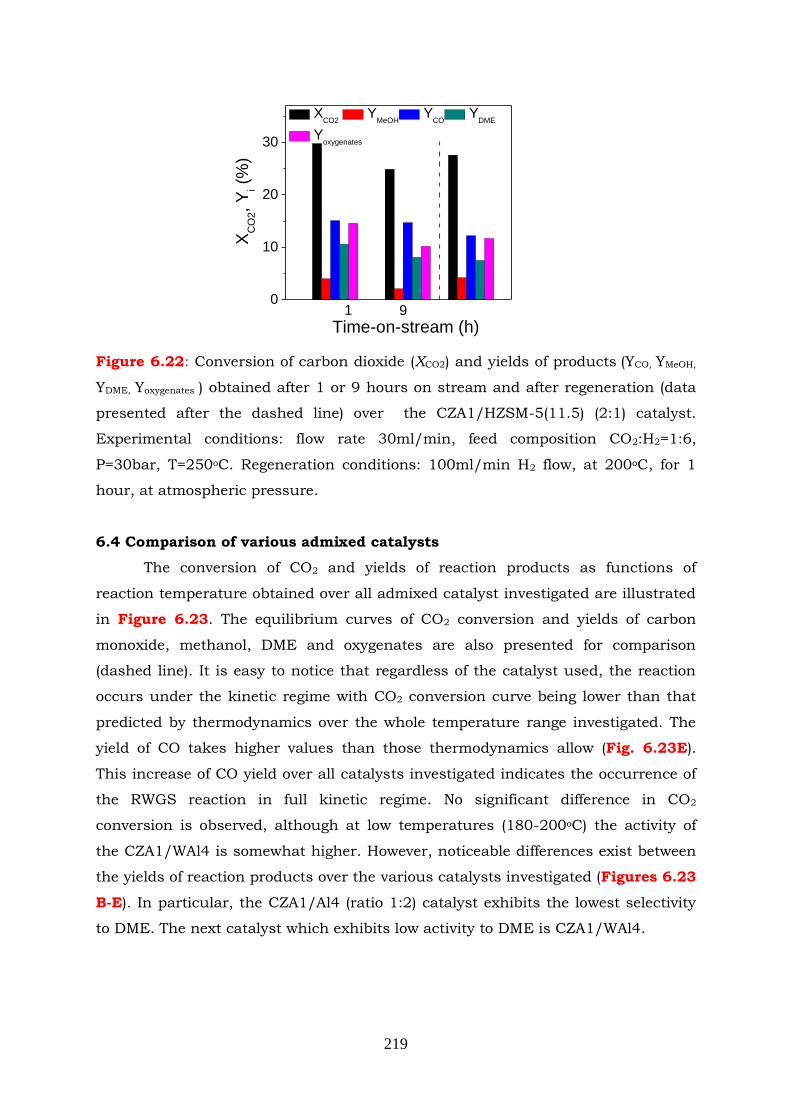
219
Figure 6.22: Conversion of carbon dioxide (XCO2) and yields of products (YCO, YMeOH,
YDME, Yoxygenates ) obtained after 1 or 9 hours on stream and after regeneration (data
presented after the dashed line) over the CZA1/HZSM-5(11.5) (2:1) catalyst.
Experimental conditions: flow rate 30ml/min, feed composition CO2:H2=1:6,
P=30bar, T=250oC. Regeneration conditions: 100ml/min H2 flow, at 200oC, for 1
hour, at atmospheric pressure.
6.4 Comparison of various admixed catalysts
The conversion of CO2 and yields of reaction products as functions of
reaction temperature obtained over all admixed catalyst investigated are illustrated
in Figure 6.23. The equilibrium curves of CO2 conversion and yields of carbon
monoxide, methanol, DME and oxygenates are also presented for comparison
(dashed line). It is easy to notice that regardless of the catalyst used, the reaction
occurs under the kinetic regime with CO2 conversion curve being lower than that
predicted by thermodynamics over the whole temperature range investigated. The
yield of CO takes higher values than those thermodynamics allow (Fig. 6.23E).
This increase of CO yield over all catalysts investigated indicates the occurrence of
the RWGS reaction in full kinetic regime. No significant difference in CO2
conversion is observed, although at low temperatures (180-200oC) the activity of
the CZA1/WAl4 is somewhat higher. However, noticeable differences exist between
the yields of reaction products over the various catalysts investigated (Figures 6.23
B-E). In particular, the CZA1/Al4 (ratio 1:2) catalyst exhibits the lowest selectivity
to DME. The next catalyst which exhibits low activity to DME is CZA1/WAl4.
0
10
20
30
XC
O2,
Yi (
%)
Time-on-stream (h)
XCO2
YMeOH
YCO
YDME
Yoxygenates
1 9
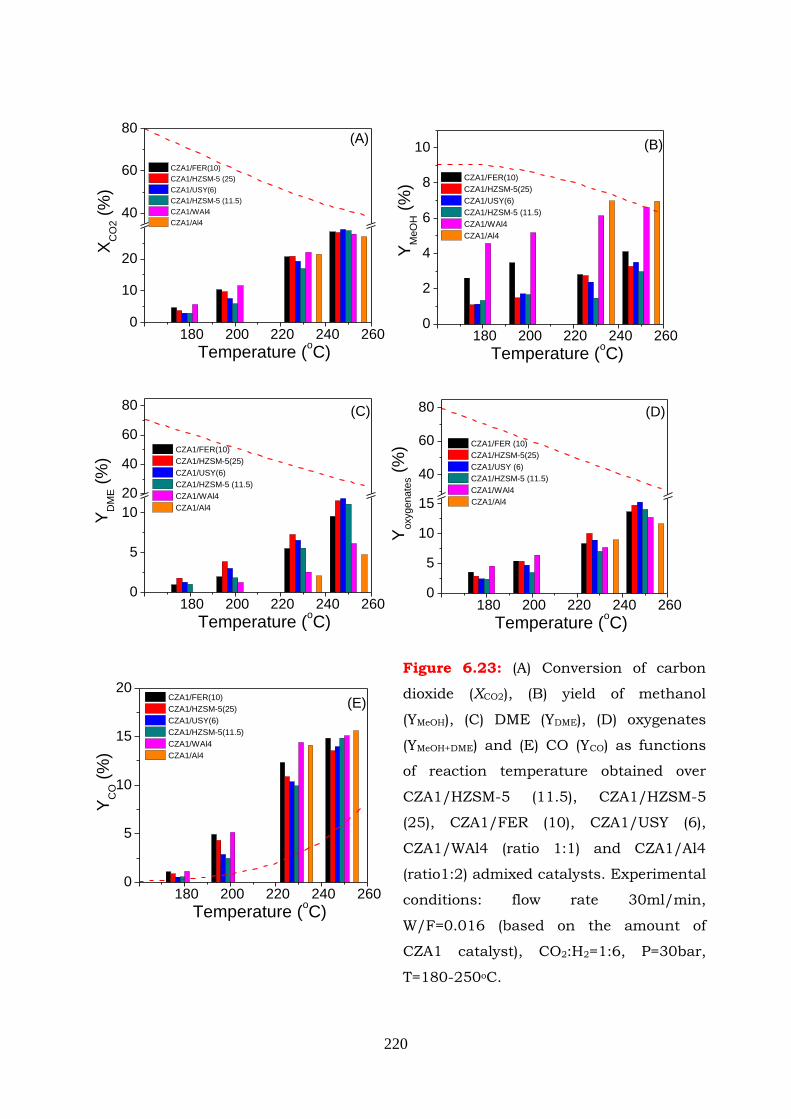
220
Figure 6.23: (A) Conversion of carbon
dioxide (XCO2), (B) yield of methanol
(YMeOH), (C) DME (YDME), (D) oxygenates
(YMeOH+DME) and (E) CO (YCO) as functions
of reaction temperature obtained over
CZA1/HZSM-5 (11.5), CZA1/HZSM-5
(25), CZA1/FER (10), CZA1/USY (6),
CZA1/WAl4 (ratio 1:1) and CZA1/Al4
(ratio1:2) admixed catalysts. Experimental
conditions: flow rate 30ml/min,
W/F=0.016 (based on the amount of
CZA1 catalyst), CO2:H2=1:6, P=30bar,
T=180-250oC.
180 200 220 240 2600
2
4
6
8
10
YM
eO
H (
%)
Temperature (oC)
CZA1/FER(10)
CZA1/HZSM-5(25)
CZA1/USY(6)
CZA1/HZSM-5 (11.5)
CZA1/WAl4
CZA1/Al4
(B)
180 200 220 240 2600
5
10
20
40
60
80
YD
ME (
%)
Temperature (oC)
CZA1/FER(10)
CZA1/HZSM-5(25)
CZA1/USY(6)
CZA1/HZSM-5 (11.5)
CZA1/WAl4
CZA1/Al4
(C)
180 200 220 240 2600
5
10
15
40
60
80
Yoxygenate
s (
%)
Temperature (oC)
CZA1/FER (10)
CZA1/HZSM-5(25)
CZA1/USY (6)
CZA1/HZSM-5 (11.5)
CZA1/WAl4
CZA1/Al4
(D)
180 200 220 240 2600
10
20
40
60
80
XC
O2 (
%)
Temperature (oC)
CZA1/FER(10)
CZA1/HZSM-5 (25)
CZA1/USY(6)
CZA1/HZSM-5 (11.5)
CZA1/WAl4
CZA1/Al4
(A)
180 200 220 240 2600
5
10
15
20
YC
O (
%)
Temperature (oC)
CZA1/FER(10)
CZA1/HZSM-5(25)
CZA1/USY(6)
CZA1/HZSM-5(11.5)
CZA1/WAl4
CZA1/Al4
(E)
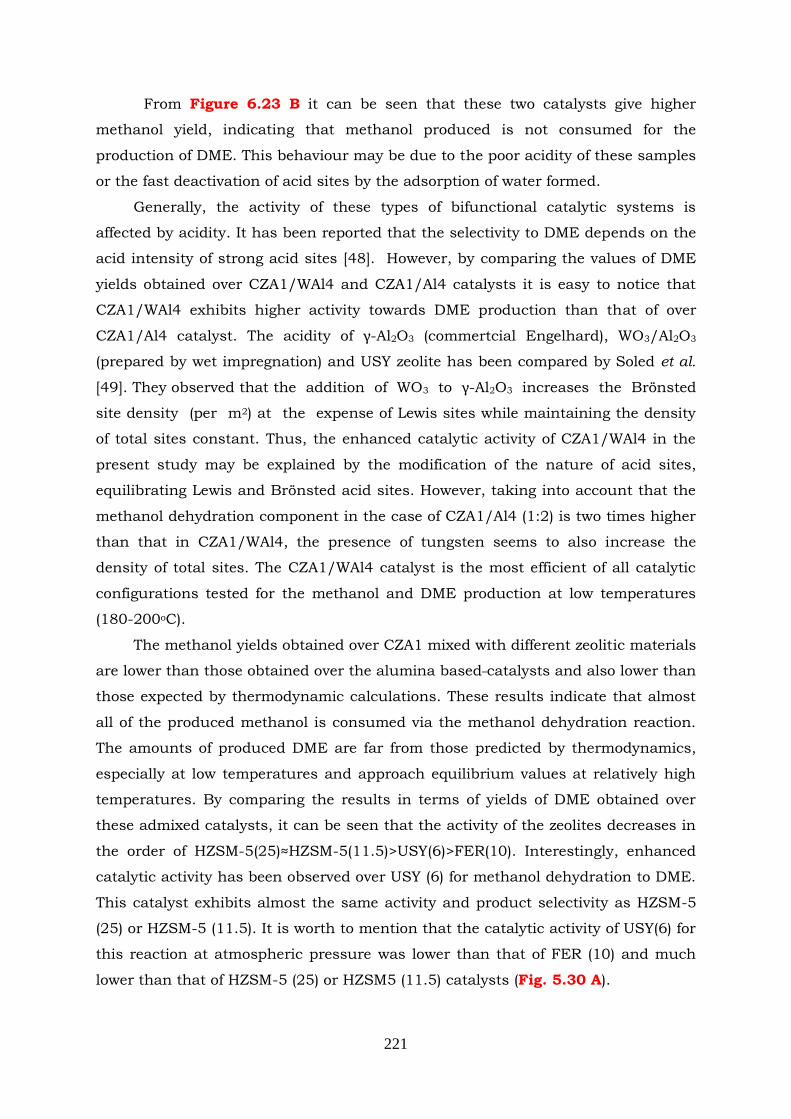
221
From Figure 6.23 B it can be seen that these two catalysts give higher
methanol yield, indicating that methanol produced is not consumed for the
production of DME. This behaviour may be due to the poor acidity of these samples
or the fast deactivation of acid sites by the adsorption of water formed.
Generally, the activity of these types of bifunctional catalytic systems is
affected by acidity. It has been reported that the selectivity to DME depends on the
acid intensity of strong acid sites [48]. However, by comparing the values of DME
yields obtained over CZA1/WAl4 and CZA1/Al4 catalysts it is easy to notice that
CZA1/WAl4 exhibits higher activity towards DME production than that of over
CZA1/Al4 catalyst. The acidity of γ-Al2O3 (commertcial Engelhard), WO3/Al2O3
(prepared by wet impregnation) and USY zeolite has been compared by Soled et al.
[49]. They observed that the addition of WO3 to γ-Al2O3 increases the Brönsted
site density (per m2) at the expense of Lewis sites while maintaining the density
of total sites constant. Thus, the enhanced catalytic activity of CZA1/WAl4 in the
present study may be explained by the modification of the nature of acid sites,
equilibrating Lewis and Brönsted acid sites. However, taking into account that the
methanol dehydration component in the case of CZA1/Al4 (1:2) is two times higher
than that in CZA1/WAl4, the presence of tungsten seems to also increase the
density of total sites. The CZA1/WAl4 catalyst is the most efficient of all catalytic
configurations tested for the methanol and DME production at low temperatures
(180-200oC).
The methanol yields obtained over CZA1 mixed with different zeolitic materials
are lower than those obtained over the alumina based catalysts and also lower than
those expected by thermodynamic calculations. These results indicate that almost
all of the produced methanol is consumed via the methanol dehydration reaction.
The amounts of produced DME are far from those predicted by thermodynamics,
especially at low temperatures and approach equilibrium values at relatively high
temperatures. By comparing the results in terms of yields of DME obtained over
these admixed catalysts, it can be seen that the activity of the zeolites decreases in
the order of HZSM-5(25)≈HZSM-5(11.5)>USY(6)>FER(10). Interestingly, enhanced
catalytic activity has been observed over USY (6) for methanol dehydration to DME.
This catalyst exhibits almost the same activity and product selectivity as HZSM-5
(25) or HZSM-5 (11.5). It is worth to mention that the catalytic activity of USY(6) for
this reaction at atmospheric pressure was lower than that of FER (10) and much
lower than that of HZSM-5 (25) or HZSM5 (11.5) catalysts (Fig. 5.30 A).
222
Indeed, the reaction environment of direct DME formation through CO2
hydrogenation is different than that of DME formation via methanol dehydration. In
the former case, the presence of reactants (CO2 and H2) or significant amount of
produced CO can influence the acidic properties of methanol dehydration
component of the admixed catalyst. Generally, CO/H2 serve as weak base probe
molecules for characterization of the acidity of zeolitic materials [50-53].
Furthermore, carbon monoxide is a small probe molecule, which may interact only
with strong acid sites in zeolites as can be observed by infrared spectroscopy [54].
Dondue et al. [50] have studied the acid sites of ZSM-5 and Y zeolites by using
various probe molecules, including CO. They observed the TPD spectra of CO only
at high temperature (620-690oC) which indicates that CO molecules interact with
the very strong acid sites. The authors concluded that the unusuall strong
adsorption of CO seems to be an important finding for the recognition of the
strongest Brönsted acid sites of zeolites. Regarding the H2-zeolite interaction, it has
been shown that the adsorption of H2 in MFI zeolite is very low compared to that of
CO2 or CO [51]. Thus it is possible, that these compounds may interact with strong
Brönsted acid sites of zeolitic materials and decrease the concentration and/or the
strength of these acid sites.
The acidic properties of zeolitic materials used in admixed catalysts are
summarized in Table 6.5. It can be seen that the USY (6) catalyst possess the
lowest number of total acid sites (0.68 mmol NH3/g) and the HZSM-5 (11.5) the
highest (1.09 mmol NH3/g). In both ZSM-5 zeolites, most of acid sites are of the
Brönsted type, as evidenced from the relatively high values of the B/L mole ratio
(~4) given in Table 6.5. The FER (10) zeolite exhibits very high B/L molar ratio
(9.3). On the contrary to these, the B/L mole ratio of USY (6) zeolite is rather low
(1.6) due to presence of extra-framework aluminium species, which induce Lewis
acidity. In addition, ZSM-5 zeolites are characterized by relatively high acid
strength. This is conclude by the fact that ~85% of pyridine sorbed on Brönsted
acid sites at 150oC remains sorbed at 450oC, whereas this percentage is only ~65%
for USY (6) zeolite. Thus, the relatively low catalytic activity of ZSM-5 (11.5), ZSM-5
(25) and FER(10) catalysts for the direct formation of DME can be attributed to the
possible interaction between the reaction intermediate species and the strong
Brönsted acid sites of these zeolites. This interaction may result in reduction of
strong acidity of zelites.
In addition to the reaction environment, the partial deactivation of the
catalysts may be due to the interaction between the two catalytic components of
223
the admixed CZA1/ZSM-5 catalysts. In particular, the acid properties of the
methanol dehydration component can be altered by the presence of oxide mixtures
(CuO–ZnO) [55, 56]. The contact between these components depends mainly on the
preparation method, which can result in an increase or a decrease of zeolite acidity
in bifunctional catalyst [56-60]. It has been reported that, in addition to coke
deposition, Cu sintering and presence of high amounts of water, the interaction of
ion-exchange copper/zinc with protons of the zeolite can also case deactivation of
catalyst [45, 56, 57, 61-63]. It has been reported that isolated Cu2+ cations occupy
exchange positions in HZSM-5 zeolite, which results in a decrease of its Brönsted
acidity [61]. As a consequence, the catalyst activity decreases due to the reduced
zeolite activity for the methanol dehydration reaction. Thus, the decreased catalytic
performance of the two CZA1/ZSM-5 and the CZA1/FER (10) catalysts may be
explained also by the possible detrimental interaction between metal-acid
components, which results in reduction of Brönsted acidity of zeolite. On the other
hand, the USY (6) zeolite, which has the lowest B/L mole ratio, does not seem to be
affected from these interactions, exhibiting almost similar activity as the ZSM-5
zeolites.
Another factor which may also influence the catalytic activity is the different
microporous structure of these zeolites. Generally, it is known that the diffusion of
DME is hindered in the narrow microporous channels of ZSM-5 zeolites, where
DME does not diffuse quickly enough [64-67]. When DME production occurs via
CO2 hydrogenation at high pressures in the presence of bifunctional catalysts, the
mass transfer limitations might by stronger than those of DME production through
methanol dehydration at atmospheric pressure. Comparison of the textural
properties of these three zeolites shows that USY (6) exhibits a significant amount
of meso/macro porosity (meso/macro surface area is 154 m2/g), whereas HZSM-5
(25) and FER zeolites have almost microporous structure (SMeso/Macro=94 m2/g for
HZSM-5 (25) and SMeso/Macro=32 m2/g for FER (10)). Thus, the existence of
mesoporous structure in USY(6) zeolite might also have a beneficial role in terms of
DME yield in direct CO2 conversion to methanol/DME. However, the direct
comparison of the structures of ZSM-5, Ferrierite(10) and USY(6) is not safe, as the
acidic properties of these zeolites, i.e. number and strength of Brönsted/Lewis acid
may differ significantly from each other.
224
6.5 Conclusions
The catalytic performance of commercial and home-made CuO/ZnO/Al2O3
catalysts for the direct conversion of CO2/H2 mixtures into methanol/DME have
been investigated, focusing on the optimization of operating conditions. Below are
summarized the general conclusions of this work.
Both Cu+/Cu0 species are important for the conversion of CO2/H2, although
the presence of Cuo seems to be more important for selectivity/yield of methanol.
The conversion of CO2 and the yields of reaction products steadily increase
when the concentration of H2 in the feed is increased.
Higher contact times result in an increase of the CO2 conversion and the
yields of reaction products.
The calculated apparent activation energy for methanol synthesis is 10.4
kcal mol-1 for the catalyst in which copper is completely reduced (CZA1) and 13.4
kcal mol-1 for the catalyst in which Cu0, Cu2O and CuO can be detected after
reduction and after catalytic tests (CZA2).
The main reason for the deactivation of copper based-catalysts is the
presence of water, which is strongly adsorbed on the active sites, inhibiting the CO2
hydrogenation reaction. When water is removed from the feed, the catalytic activity
and products selectivity are recovered slowly to their original levels indicating that
deactivation by water is reversible.
The direct CO2 hydrogenation to methanol/DME has also been investigated
using admixed catalysts comprising a methanol synthesis and a methanol
dehydration component. The general conclusions of this part of the study are
summarized as follows:
The conversion of CO2 and the yields of products increase with increase of
contact time.
Under the experimental conditions employed, the measured values of the
conversion of CO2 were always found to be lower than the corresponding
equilibrium values predicted by thermodynamics, indicating operation in the
kinetic regime. On the contrary, the values of CO yields were always higher than
those expected by thermodynamics.
The nature of the methanol dehydration component of the admixed
catalysts is important for both CO2 conversion and methanol dehydration.
The conversion of CO2 at 250oC is almost the same for all samples
consisting of CZA1 admixed with the four different zeolites catalysts investigated.
225
The CO2 conversion obtained over CZA1 admixed with W/γ-Al2O3 and γ-Al2O3 is
lower than that obtained using zeolites as methanol dehydration component.
DME selectivity/yield, depends strongly on the nature of acid sites (both
Lewis and Brönsted) as well as the textural (meso/macro porosity) and topological
properties of methanol dehydration component of the admixed catalysts. The yield
of DME obtained at a temperature of 250oC decreases following the order
CZA1/ZSM-5, CZA1/USY(6) >CZA1/FER (10) > CZA1/ WAl4 >> CZA1/Al4.
The best catalytic performance was obtained for the CZA1/ZSM-5
bifunctional system. Increase of the mass ratio of the methanol synthesis
component from 1:1 to 2:1 over this catalyst had no significant effect on the yield
of oxygenates.
The bifunctional catalytic system deactivated with time-on-stream.
Deactivation is mainly due to water and it is reversible to a great extent. In the case
of CZA1/ZSM-5 (1:1) admixed catalysts, the catalytic activity and products
selectivity are almost recovered after regeneration of the used catalysts with H2 flow
at 200 oC for 1 hour.
226
6.6 References
[1] C. Baltes, S. Vukojevic, F. Schüth, Journal of Catalysis 258 (2008) 334-344.
[2] G. Leofanti, M. Padovan, G. Tozzola, B. Venturelli, Catalysis Today 41 (1998) 207-
219.
[3] F. Dumeignil, K. Sato, M. Imamura, N. Matsubayashi, E. Payen, H. Shimada, Applied
Catalysis A: General 241 (2003) 319-329.
[4] J. Aguado, J.M. Escola, M.C. Castro, Microporous and Mesoporous Materials 128
(2010) 48-55.
[5] H. Ban, C. Li, K. Asami, K. Fujimoto, Catalysis Communications 54 (2014) 50-54.
[6] R. Khoshbin, M. Haghighi, Chemical Engineering Research and Design 91 (2013)
1111-1122.
[7] C. Li, X. Yuan, K. Fujimoto, Applied Catalysis A: General 469 (2014) 306-311.
[8] R. Ladera, F.J. Pérez-Alonso, J.M. González-Carballo, M. Ojeda, S. Rojas, J.L.G.
Fierro, Applied Catalysis B: Environmental 142-143 (2013) 241-248.
[9] L. Zhang, Y. Zhang, S. Chen, Applied Catalysis A: General 415-416 (2012) 118-123.
[10] J. Abu-Dahrieh, D. Rooney, A. Goguet, Y. Saih, Chemical Engineering Journal 203
(2012) 201-211.
[11] F. Arena, G. Mezzatesta, G. Zafarana, G. Trunfio, F. Frusteri, L. Spadaro, Journal of
Catalysis 300 (2013) 141-151.
[12] F. Arena, G. Italiano, K. Barbera, S. Bordiga, G. Bonura, L. Spadaro, F. Frusteri,
Applied Catalysis A: General 350 (2008) 16-23.
[13] F. Arena, K. Barbera, G. Italiano, G. Bonura, L. Spadaro, F. Frusteri, Journal of
Catalysis 249 (2007) 185–194.
[14] G. Bonura, F. Arena, G. Mezzatesta, C. Cannilla, L. Spadaro, F. Frusteri, Catalysis
Today 171 (2011) 251– 256.
[15] X. An, Y.-Z. Zuo, Q. Zhang, D.-z. Wang, J.-F. Wang, Ind. Eng. Chem. Res. 47 (2008)
6547-6554.
[16] G.C. Chinchen, K.C. Waugh, Journal of Catalysis 97 (1986) 280-283.
[17] G.R. Sheffer, T.S. King, Journal of Catalysis 115 (1989) 376-387.
[18] T. Fujitani, J. Nakamura, Applied Catalysis A: General 191 (2000) 111-129.
[19] F. Wang, Y. Liu, Y. Gan, W. Ding, W. Fang, Y. Yang, Fuel Processing Technology
110 (2013) 190-196.
[20] S.-I. Fujita, M. Usui, N. Takezawa, Journal of Catalysis 134 (1992) 220-225.
[21] J. Erena, I. Sierra, A.T. Aguayo, A. Ateka, M. Olazar, J. Bilbao, Chemical
Engineering Journal 174 (2011) 660-667.
[22] Y. Zhang, J. Fei, Y. Yu, X. Zheng, Energy Conversion and Management 47 (2006)
3360-3367.
[23] S.P. Naik, T. Ryu, V. Bui, J.D. Miller, N.B. Drinnan, W. Zmierczak, Chemical
Engineering Journal 167 (2011) 362–368.
[24] D. Wang, Y. Han, Y. Tan, N. Tsubaki, Fuel Processing Technology 90 (2009) 446–
451.
[25] I.E. Wachs, T. Kim, E.I. Ross, Catalysis Today 116 (2006) 162-168.
[26] J. Macht, C.D. Baertsch, M. May-Lozano, S.L. Soled, Y. Wang, E. Iglesia, Journal of
Catalysis 227 (2004) 479–491.
[27] C.D. Baertsch, K.T. Komala, Y.-H. Chua, E. Iglesia, Journal of Catalysis 205 (2002)
44-57.
[28] T. Kim, A. Burrows, C.J. Kiely, I.E. Wachs, Journal of Catalysis 246 (2007) 370–381
[29] F. Frusteri, M. Cordaro, C. Cannilla, G. Bonura, Applied Catalysis B: Environmental
162 (2015) 57–65.
227
[30] F.S. Ramos, A.M.D.d. Farias, L.E.P. Borges, J.L. Monteiro, M.A. Fraga, E.F. Sousa-
Aguiar, L.G. Appel, Catalysis Today 101 (2005) 39-44.
[31] D. Mao, W. Yang, J. Xia, B. Zhang, G. Lu, Journal of Molecular Catalysis A:
Chemical 250 (2006) 138-144.
[32] G.R. Moradi, M. Nazari, F. Yaripour, Fuel Processing Technology 89 (2008) 1287-
1296.
[33] I. Sierra, J. Erena, A.T. Aguayo, J.M. Arandes, J. Bilbao, Applied Catalysis B:
Environmental 94 (2010) 108-116.
[34] M. Xu, J.H. Lunsford, D.W. Goodman, A. Bhattacharyya, Applied Catalysis A:
General 149 (1997) 289-301.
[35] L. Zhang, H.-T. Zhang, W.-Y. Ying, D.-Y. Fang, World Academy of Science,
Engineering and Technology 59 (2011) 1538-1543.
[36] L. Zhang, H. Zhang, W. Ying, D. Fang, Canadian Journal of Chemical Engineering
91 (2013) 1538-1546.
[37] T. Takeguch, K.-i. Yanagisawa, T. Inui, M. Inoue, Applied Catalysis A: General 192
(2000) 201-209.
[38] S. Allahyari, M. Haghighi, A. Ebadi, S. Hosseinzadeh, Ultrasonics Sonochemistry 21
(2014) 663-673.
[39] S. Allahyari, M. Haghighi, A. Ebadi, H.Q. Saeedi, International Journal of Energy
Research, John Wiley & Sons, Ltd. (2014).
[40] G. Bonura, M. Cordaro, C. Cannilla, A. Mezzapica, L. Spadaro, F. Arena, F. Frusteri,
Catalysis Today 228 (2014) 51-57.
[41] S. Wang, D. Mao, X. Guo, G. Wu, G. Lu, Catalysis Communications 10 (2009) 1367-
1370.
[42] Y. Zhao, J. Chen, J. Zhang, Journal of Natural Gas Chemistry 16 (2007) 389-392.
[43] P.S. Prasad, J.W. Bae, S.-H. Kang, Y.-J. Lee, K.-W. Jun, Fuel Processing Technology
89 (2008) 1281-1286.
[44] W. Yan, W. Wen-li, C. Yue-xian, Z. Jia-jun, L. Rui-feng, Journal of Fuel Chemistry
and Technology 41 (2013) 872-882.
[45] R. Montesano, A. Narvaez, D. Chadwick, Applied Catalysis A: General 482 (2014)
69-77.
[46] F.A.P. Cavalcanti, A.Y. Stakheev, W.M.H. Sachtler, Journal of Catalysis 134 (1992)
226-241.
[47] S.-E. Park, S.S. Nam, M.J. Choi, K.W. Lee, Energy Convers. Mgmt 36 (1992) 573-
576.
[48] G. Wengui, W. Hua, W. Yuhao, G. Wei, J. Miaoyao, Journal of Rare Earths 31 (2013)
470-476.
[49] S.L. Soled, G.B. McVicker, L.L. Murrell, L.G. Sherman, N.C. Dispenziere, Jr., S.L.
Hsu, D. Waldman, Journal of Catalysis 111 (1988) 286-295
[50] V. Dondur, V. Rakic, L. Damjanovic, A. Auroux, J. Serb. Chem. Soc. 70 (2005) 457-
474.
[51] S.K. Wirawan, D. Creaser, Separation and Purification Technology 52 (2006) 224-
231.
[52] M.A. Makarova, K.M. Al-Ghefaili, J. Dwyer, J. Chem. Soc. Faraday Trans. 90 (1994)
383-386.
[53] G. Ertl, H. Knözinger, F. Schüth, J. Weitkamp (Eds.), "Handbook of Heterogeneous
Catalysis", (Sec. Ed.) Wiley-VCH Verlag GmbH& Co. KGaA, Weinheim, Germany,
2008.
228
[54] H. Chon, S.I. Woo, S.E. Park (Eds.), "Recent Adavances and New Horizons in
Zeolite Science and Technology" Studies in Surface Science and Catalysis, Vol. 102,
Elsevier Science B.V., 1996.
[55] Q. Ge, Y. Huang, F. Qiu, S. Li, Applied Catalysis A: General 167 (1998) 23-30.
[56] J.H. Flores, M.I.P.d. Silva, Colloids and Surfaces A: Physicochem. Eng. Aspects 322
(2008) 113-123.
[57] V.V. Ordomsky, M. Cai, V. Sushkevich, S. Moldovan, O. Ersen, C. Lancelot, V.
Valtchev, A.Y. Khodakov, Applied Catalysis A: General 486 (2014) 266-275.
[58] Z. Li, J. Li, M. Dai, Y. Liu, D. Han, J. Wu, Fuel 121 (2014) 173-177.
[59] R. Ahmad, D. Schrempp, S. Behrens, J. Sauer, M. Döring, U. Arnold, Fuel Processing
Technology 121 (2014) 38-46.
[60] S.P. Naik, H. Du, H. Wan, V. Bui, J.D. Miller, W.W. Zmierczak, Ind. Eng. Chem.
Res. 47 (2008) 9791-9794.
[61] A. García-Trenco, A. Vidal-Moya, A. Martínez, Catalysis Today 179 (2012) 43-51.
[62] A. García-Trenco, S. Valencia, A. Martínez, Applied Catalysis A: General 468 (2013)
102-111.
[63] A. García-Trenco, A. Martínez, Applied Catalysis A: General 411-412 (2012) 170-
179.
[64] A. Rownaghi, F. Rezaei, M. Stante, J. Hedlund, Applied Catalysis B: Environmental
119-120 (2012) 56-61.
[65] Q. Tang, H. Xu, Y. Zheng, J. Wang, H. Li, J. Zhang, Applied Catalysis A: General
413-414 (2012) 36-42.
[66] Y. Sang, H. Liu, S. He, H. Li, Q. Jiao, Q. Wu, K. Sun, Journal of Energy Chemistry
22 (2013) 769-777.
[67] J. Zhen, Q. Zeng, Y. Yi, Y. Wang, J. Ma, B. Qin, X. Zhang, W. Sun, R. Li, Catalysis
Today 168 (2011) 124-132.
229
CHAPTER 7
GENERAL CONCLUSIONS
SUGGESTIONS FOR FUTURE WORK
In the present thesis the production of DME from CO2/H2 mixtures has been
investigated by considering both the indirect (two-step) and the direct (one-step)
catalytic processes. In the case of the indirect process, the CO2 hydrogenation to
methanol has been investigated over commercial and home-made copper-based
catalysts. The methanol dehydration to DME, i.e., the second step of the indirect
process, has been investigated over a range of acidic materials including γ-alumina,
silica-alumina and zeolite catalysts. The aim of studying these two reactions was to
identify the optimal experimental conditions as well as to develop efficient, selective
and stable metal-based and acid catalysts that could be combined and used for the
direct conversion of CO2/H2 mixtures into methanol/DME (one-step process). The
general conclusions of this work are summarized below.
7.1 Methanol dehydration to DME over Al2O3 catalysts
The methanol dehydration to DME reaction has been studied over eight
different alumina catalysts with various physicochemical characteristics. Results
obtained show that catalytic activity and selectivity to DME are determined by the
textural properties, degree of crystallinity and total amount of surface acid sites of
Al2O3. The following conclusions have been extracted based on the results of
catalyst characterization and catalytic performance tests:
Increase of specific surface area results in a shift of the methanol conversion
curve toward lower reaction temperatures.
Enhanced catalytic activity of high-specific surface area (SSA) samples
cannot be attributed solely to the higher amount of surface acid sites (estimated by
230
NH3-TPD) implying that the reaction rate is determined to a large extent from other
parameters, such as textural properties and degree of crystallinity.
Conversion of methanol at a given temperature is generally higher for
materials with cylindrical pores of an average width of about 9-10 nm, total
porosity of 0.60-0.80 cm3g-1 and crystallite size of ca 7-9 nm. Materials with higher
porosity and/or smaller crystallite size are less active, most probably due to their
highly amorphous nature.
The apparent activation energy of the reaction is, practically, the same for
all studied Al2O3 catalysts taking an average value of 24±4 kcal mol-1.
Addition of water vapour in the feed does not influence selectivity to reaction
products but results in an increase of the apparent activation energy and in a
(reversible) shift of methanol conversion curve toward higher temperatures.
Results of mechanistic studies indicate that interaction of methanol with the
Al2O3 surface results in the formation of two kinds of methoxy groups of different
adsorption strength. Evidence is provided that DME evolution is associated with
methoxy species that are weakly adsorbed on the Al2O3 surface, whereas more
strongly held species decompose to yield surface formate and, eventually CH4 and
CO in the gas phase.
7.2 Methanol dehydration to DME over zeolite catalysts
The methanol dehydration to DME reaction has been studied also over
thirteen different zeolitic materials and their catalytic performance was compared
to that of alumina and silica-alumina catalysts. The catalytic activity and selectivity
of zeolites was found to depend on the topology of these materials, related to
differences in zeolite micropore structure and Si/Al ratio, as well as on the number,
strength and nature of active acid sites. The following conclusions have been
extracted:
The activity of zeolite catalysts for the methanol dehydration to DME follows
the order ZSM-5 > Ferrierite > Mordenite ~ Beta ~ USY > H-Y. Under the
experimental conditions employed here, the selectivity to DME is ~100% at reaction
temperatures of 280-300oC, where equilibrium conversion of methanol to DME (ca.
80-85%) is achieved for all catalysts, with the exception of the H-Y zeolite that is
less selective at lower temperatures and conversions. At temperatures above ca.
300 oC, the high reactivity of the ZSM-5 zeolites leads to conversion values higher
than those corresponding to the equilibrium conversion of methanol to DME,
because of the onset of side reactions which lead to the formation of higher
231
hydrocarbons. As a result, conversion of methanol reaches 100% at T ≤ 400oC,
which is accompanied by a significant decrease of DME selectivity and increased
formation of light as well as higher hydrocarbons.
The reactivity of the zeolite catalysts has been evaluated by determining the
reaction rates per gram of catalyst, per acid site (total: Bronsted+Lewis) and per
B/L mole ratio. By combining these kinetic results with the acidic properties of the
zeolites (number, type and strength of acid sites) the following conclusions have
been extracted:
The strong Brönsted acid sites of ZSM-5 zeolites with relatively high Si/Al
ratio (ca. 40) represent the most active sites for the methanol dehydration to DME
reaction. However, the overall reactivity of the ZSM-5 zeolites is also affected by the
balance of the Brönsted to Lewis acid sites (B/L ratio).
The activity of Beta and USY zeolites is determined by both Lewis and
Brönsted acid sites.
The moderate/low reactivity of Ferrierite, Mordenite and H-Y zeolite with
Si/Al ratios of 10, 10 and 2.5, respectively, is determined by the abundant
Brönsted acid sites of relatively weak/moderate strength.
Results obtained over γ-Al2O3, ASA (0.5) and ASA (35) samples reveal that γ-
alumina and ASA (0.5) with weak Lewis acid sites exhibit qualitatively similar
behavior, whereas ASA (35) with relatively weak/moderate strength of Brönsted
acid sites possess much less catalytic activity.
Long-term stability tests have been performed under dry and wet feed
compositions for most zeolitic materials. Results obtained showed that:
The ZSM-5 and USY zeolites are relatively stable under dry feed conditions.
The hydrothermally stabilized framework of USY zeolites offers better resistance in
the presence of water in the feed compared to the ZSM-5 zeolites, which showed a
permanent deactivation.
Beta zeolites showed a progressive loss of their activity in long-term stability
tests (ca. 15-20 hrs) under dry feed conditions. Interestingly, the catalytic activities
of Beta (37.5) and Beta(150) zeolites do not seem to be affected by the addition of
H2O vapor in the feed. The catalytic activity of Beta(12.5) was affected by the
addition of 10% water in the feed but this effect was found to be reversible.
232
7.3 CO2 hydrogenation to methanol
The methanol synthesis reaction from CO2-H2 mixtures has been studied
over commercial (CZA1) and home-made (CZA2) CuO/ZnO/Al2O3 catalysts. Below
are summarized the general conclusions of this investigation:
Both Cu+/Cu0 species are important for the conversion of CO2/H2, although
the presence of Cu0 seems to be more important for selectivity/yield of methanol.
The conversion of CO2 and the yields of reaction products steadily increase
when the concentration of H2 in the feed is increased.
Higher contact times result in an increase of the CO2 conversion and the
yields of reaction products.
The apparent activation energy for methanol synthesis is 10.4 kcal mol-1 for
the catalyst in which copper is completely reduced (CZA1) and 13.4 kcal mol-1 for
the catalyst in which Cu0, Cu2O and CuO can be detected after reduction and after
catalytic tests (CZA2).
The main reason for the deactivation of copper based-catalysts is the
presence of water, which is strongly adsorbed on the active sites, thus inhibiting
the CO2 hydrogenation reaction. When water is removed from the feed, the
catalytic activity and products‟ selectivity are recovered slowly to their original
levels, indicating that deactivation by water is reversible.
7.4 Direct CO2 hydrogenation to methanol/DME
The direct CO2 hydrogenation to methanol/DME has been investigated using
admixed catalysts comprising a methanol synthesis and a methanol dehydration
component. The general conclusions of this part of the study are summarized as
follows:
The conversion of CO2 and the yields of products increase with increase of
contact time.
Under the experimental conditions employed, the measured values of the
conversion of CO2 were always found to be lower than the corresponding
equilibrium values predicted by thermodynamics, indicating operation in the
kinetic regime. On the contrary, the values of CO yields were always higher than
those expected by thermodynamics.
The nature of the methanol dehydration component of the admixed catalysts
is important for both CO2 conversion and methanol dehydration.
The conversion of CO2 at 250oC is almost the same for all samples consisting
of CZA1 admixed with the four different zeolites catalysts investigated. The CO2
233
conversion obtained over CZA1 admixed with W/γ-Al2O3 and γ-Al2O3 is lower than
that obtained using zeolites as methanol dehydration component.
DME selectivity/yield, depends strongly on the nature of acid sites (both
Lewis and Brönsted) as well as the textural (meso/macro porosity) and topological
properties of the methanol dehydration component of the admixed catalysts. The
yield of DME obtained at a temperature of 250oC decreases following the order
CZA1/ZSM-5, CZA1/USY(6) > CZA1/FER (10) > CZA1/ WAl4 >> CZA1/Al4.
The best catalytic performance was obtained for the CZA1/ZSM-5
bifunctional system. Increase of the mass ratio of the methanol synthesis
component from 1:1 to 2:1 over this catalyst had no significant effect on the yield
of oxygenates.
The bifunctional catalytic system deactivates with time-on-stream.
Deactivation is mainly due to the presence of water and it is reversible to a great
extent. In the case of CZA1/ZSM-5 (1:1) admixed catalysts, the catalytic activity
and selectivity are almost recovered after regeneration of the used catalysts with H2
flow at 200 oC for 1 hour.
7.5 Suggestions for future work
The future work could focus on the following aspects:
Further investigation of the methanol dehydration reaction over zeolite
catalysts at high pressure conditions.
Synthesis and testing of other metal-based catalysts for methanol synthesis
reaction.
Synthesis and testing of other bifunctional catalytic systems for CO2
hydrogenation to methanol/dimethyl ether reaction, by applying various
preparation methods.
Detailed investigation of the CO2 hydrogenation to methanol/dimethylether
reaction mechanism with the use of in-situ FTIR and transient-MS techniques.