Embed Size (px)
Citation preview

In order to obtain expressions for the individual values This
To obtain uy, , and u ~ , ~ , an additional relationship is required. can be found in the special case D y = DE = D. this relationship we shall suppose that
where f (r , t ) is some unspecified’function; in fact, we shall show that f ( r , t ) is identically equal to zero. Using Equation A l , together with D y = DB = D, we find that f (r , t ) must satisfy
with the initial condition f (r ,O) = 0, r 2 a. similarly yields
Equation A2
CY' buY(r,t) buB(r,t) bf(r, t) YCB’ a r br
r = a , t > O : ~- +- s-- - 0 (A6) br
The unspecified function f (r , t ) is therefore one which satisfies Equation A5, has initial value zero for all r 2 a, and has zero gradient at r = a. Taking cognizance of the fact that Equa- tion A5 is linear and of second-order in the variable r, we are a t once led to the result that f ( r , t ) 0.
Returning to Equation A4 we now have
DY = DB: U B , ~ / U Y , ~ = -(b/y)(Cr’/CB’) (‘47) as the required second relationship between the ultimate frac- tional concentration changes u y , , and uB ,_. Substitution of Equation A7 into Equation A3 immediately yields Equa- tion 8 of the text.
RECEIVED for review June 19, 1970. 1970.
Accepted October 1,
Simultaneous Determination of Silicate and Phosphate by an Automated Differential Kinetic Procedure
J. D. Ingle, Jr., and S. R. Crouch Department of Chemistry, Michigan State University, East Lansing, Mich. 48823
A differential kinetic method is presented for simul- taneous determinations of silicate and phosphate in mixtures. Phosphate and silicate each react with Mo(VI) to form yellow heteropoly acids which can be reduced to heteropoly blues. The initial rate of forma- tion of the heteropoly blue from phosphate can be made much faster than the corresponding silicate heteropoly blue under certain experimental conditions. Thus phosphate can be determined with little inter- ference from silicate. Silicate can be determined under a second set of conditions by measuring the initial rate of formation of p-12-molybdosilicic acid, which forms at a much slower rate than 12-molyb- dophosphoric acid. Data are presented to illustrate that 1-10 ppm of silicon can be determined in the pres- ence of up to 10 ppm of phosphorus with better than 3% accuracy. Simultaneous phosphate determina- tions in the 1-10 ppm of P range in the presence of up to 50 ppm of Si can be made with 1% accuracy. Both species can be determined in mixtures in less than five minutes of total analysis time using an automated reaction rate system.
COLORIMETRIC PROCEDURES for the determination of phosphate and silicate are often based on the formation of the yellow heteropolymolybdates of these anions or the reduced hetero- poly blues ( I , 2). Colorimetric determination of both anions in mixtures is difficult because the heteropolymolybdates of phosphate and silicate have quite similar absorption spectra as do the heteropoly blues (3). Mixtures of the two anions have generally been treated by separating the two species, by proper
(1) Am. Pub. Health Assoc., Inc. New York, “Standard Methods for the Examination of Water, Sewage, and Industrial Wastes,” 11th ed., 1960.
(2) F. Feigl, “Spot Tests In Inorganic Analysis,” Elsevier Publish- ing Company, Amsterdam, the Netherlands, 1958.
(3) D. G. Boltz and M. G. Mellon, IND. ENG. CHEM., ANAL. ED., 19, 873 (1947).
control of reaction conditions, o r by adding reagents which destroy or prevent the formation of one of the heteropoly acids. For example, determinations of silicate in the presence of phosphate can involve separation of phosphate by precipi- tation prior to colorimetric determination of silicate ( 4 ) , con- trol of solution p H so that only the heteropoly blue of silicate is formed (3, or destruction of 12-molybdophosphoric acid (12-MPA) with a complexing agent such as oxalic acid (6). Phosphate can be determined in the presence of silicate by precipitating the silicate prior to colorimetric determination of phosphate ( 4 ) , addition of tartaric acid to prevent formation of 12-molybdosilicic acid (12-MSA) (6), or selective extraction of 12-MPA into a suitable organic solvent (7, 8). Simul- taneous analyses of both species in mixture usually involve combinations of these techniques,
Because of the importance of silicate and phosphate deter- minations in the testing of such samples as natural waters, sewage, and boiler waters, steels, minerals, and soils, a rapid and accurate simultaneous differential kinetic method, which requires no separations, has been developed. The method is based on kinetic differences in the formation reactions of the heteropolymolybdates and the reduced heteropoly blues of phosphate and silicate. By proper p H control, the formation of the heteropoly blue from silicate, molybdate, and ascorbic acid can be made extremely slow in comparison to the forma- tion of the corresponding phosphate heteropoly blue. Thus,
~~
(4) I. M. Kolthoff, E. B. Sandell, E. J. Meehan, and S. Brucken- stein, “Quantitative Chemical Analysis,” The Macmillan Com- pany. London, England, 1969.
( 5 ) H. L. Kahler, IND. ENG. CHEM., ANAL. ED., 13, 536(1941). (6) R. A. Chalmers and A. C. Sinclair, Anal. Chim. Acta, 34,
(7) M. A. Desesa and L. B. Rogers, ANAL. CHEM., 26, 1381 (1954). (8) J. Paul, Anal. Chim. Acta, 25, 178 (1960).
412 (1966).
ANALYTICAL CHEMISTRY, VOL. 43, NO. 1, JANUARY 1971 7
(D
i T 0
cn m a +60sec. I
TIME Figure 1. Recorded reaction rate curves for formation of the heteropoly blues of phosphate and silicate measured at 650 nrn
(a) 2.5 ppm P and 50 ppm Si (b) 100 ppmSi
measurement of the initial rate of heteropoly blue formation gives information related to the phosphate concentration with very little interference from silicate. With no reducing agent present, the two yellow heteropolymolybdates are formed a t significantly different rates. The formation of 12-MPA is complete in a few seconds (9), while the formation of 12-MSA requires much longer reaction times. By delaying rate mea- surements until the 12-MPA formation is essentially complete, silicate can be determined with little interference from phos- phate.
The differential rate procedure is precise and accurate for mixtures of phosphate and silicate. Phosphate in the range 2.5-10 ppm of P can be determined in the presence of up to 50 ppm of Si with relative errors of less than 1 %. Silicate at the 2.5-10 ppm of Si level can be determined in the presence of up to 10 ppm of P with 1-3 accuracy. Higher concentra- tions of phosphate cause low results in silicate determinations.
GENERAL CONSIDERATIONS
A mechanistic study of the formation of 12-MPA and its reduction to the heteropoly blue has shown the reaction rate to be first-order in phosphate in both reactions (9, IO). The formation of 12-MPA is fast, and the initial rate must be measured with a stopped-flow apparatus. The reduction of 12-MPA to the heteropoly blue is slower, and the initial rate can be measured with a conventional mixing apparatus. The fact that the 12-MPA formation equilibrium is much faster than the subsequent reduction, results in a steady state con- centration of 12-MPA and a first-order dependence of phos- phate in the reduction.
Silicate undergoes a similar reaction with molybdate. The kinetics of the formation of 6-12-MSA have been studied and the rate was shown to be first-order with respect to silicate in perchloric acid (11). The p isomer of 12-MSA forms when
(9) A. C. Javier, S. R. Crouch, and H. V. Malmstadt, ANAL.
(10) S. R. Crouch and H. V. Malmstadt, ibid., 39, 1084 (1967). (11) L. G. Hargis, ibid., 42, 1494 (1970).
CHEW, 40, 1922 (1968).
the acid to molybdate ratio is greater than 1.5. The p form converts to the a isomer on standing (12).
In the present study, the formation of P-12-MSA was found to be first-order with respect to silicate in sulfuric acid solu- tions and much slower than the formation of 12-MPA. Thus, silicate can be determined by measuring the initial rate of p- 12-MSA formation in a conventional mixing apparatus. Since the measurement is made within 1 minute after mixing, the slow conversion of the p-12-MSA to a-12-MSA is negligi- ble.
Attempts to measure the initial rate of the reduction of p- 12-MSA to the heteropoly blue and relate this to silicate con- centrations failed. This failure can be attributed to the rela- tively slow rate of formation of p-12-MSA. In order for the reduction to be first-order in silicate, the reversible equilibrium step, formation of p-12-MSA, must be much faster than the irreversible reduction so that a steady state concentration of p-12-MSA exists. This condition is true for the reduction of 12-MPA, but not for p-12-MSA.
For a mixture of phosphate and silicate, both anions con- tribute to the rates of the heteropoly blue and heteropoly acid reactions as indicated in Equations 1 and 2 :
Rate(b) = kP(b)eXP(-kp(b)t)[P043-10 t ksi(b)exp( - ksi(b) t)[SiO 32-10 (1)
Rate(,) = k ~ ~ , ~ e x p ( - ~ ~ ( ~ ~ t ) [ P O ~ ~ - - l ~ + ksiwexp( - ksi(y) t)[Si03*-Io (2)
where the subscripts b and y represent the formation of the heteropoly blues and the yellow heteropoly acids, respectively, and [P043-]o and [Si032-]0 represent the initial concentrations of phosphate and silicate.
If the reaction conditions are manipulated so that the pseudo-first-order rate constants in Equations 1 or 2 differ significantly, then the kinetic contributions of phosphate and silicate to the total rate can be separated by measurement at the proper times. Differential kinetic methods for studying reaction mixtures with widely differing rate constants and the criteria for neglecting either the slower or faster reacting com- ponent have been presented (13,14).
Experimentally it was found that, under conditions where phosphate has been previously determined by the rate of re- duction of 12-MPA (IO), the rate of formation of P-12-MSA is extremely slow. Figure 1 shows reaction rate curves for a pure silicate sample (curve b) and a silicate-phosphate mixture (curve a). As can be seen, even a 100 ppm of Si sample gives a negligible reaction rate over the first several minutes after initiating the reaction. A sample containing 2.5 ppm of P, however, gives a relatively large change in absorbance over the same time period. This implies that kSi(b) << kp(b). If the rate of heteropoly blue formation is measured during the initial stages of the reaction, Equation 1 becomes
Rate(b) = kP(b)[P043-]0 (3)
Under all reaction conditions studied, the formation of 12-MPA was always much faster than that of p-12-MSA. Thus, the condition ksi(,) >> k ~ ( ~ ) could not be obtained.
(12) J. D. H. Strickland, J. Amer. Chem. Soc., 74, 862, 868, 872 (1952).
(13) H. B. Mark and G. A, Rechnitz, “Kinetics in Analytical Chemistry,” Interscience Publishers, New York, N. Y., 1968.
(14) H. B. Mark, Jr., L. J. Papa, and C. N. Reilley, “Advances in Analytical Chemistry and Instrumentation,” Vol. 2, Wiley, New York, N. Y., 1963, pp 255-385.
8 0 ANALYTICAL CHEMISTRY, VOL. 43, NO. 1, JANUARY 1971

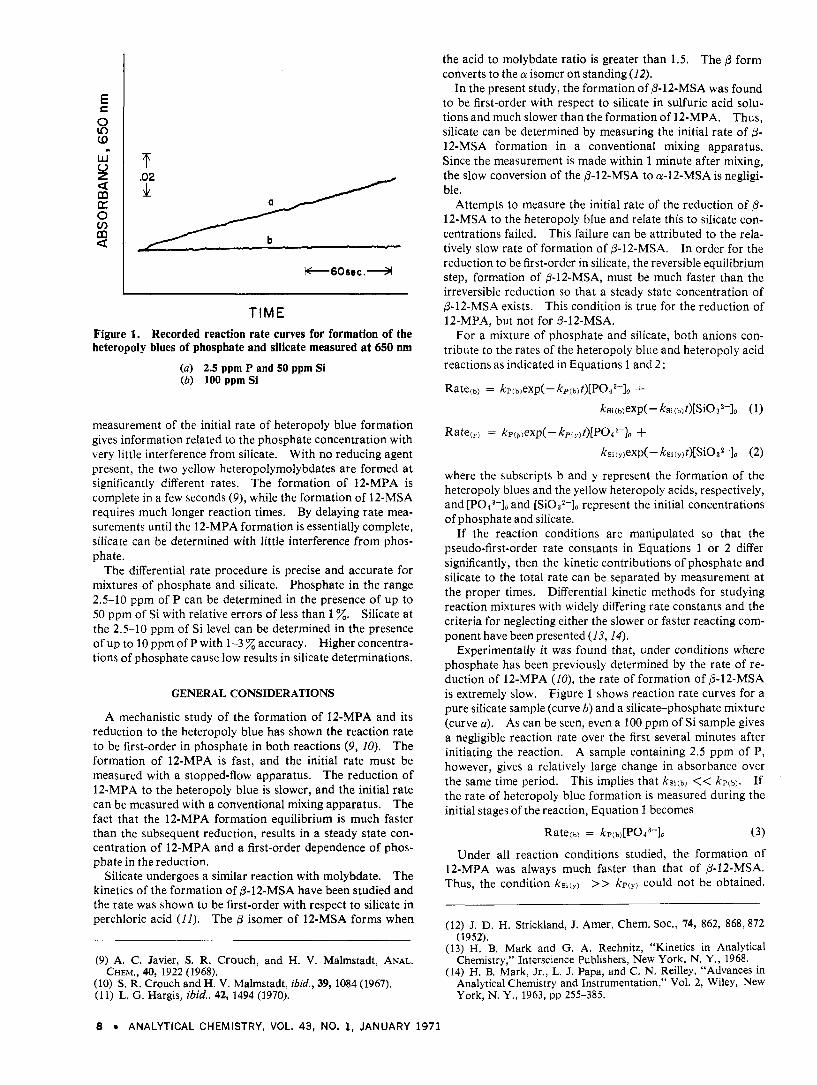
At lower acidities or higher molybdate concentrations than those used for the phosphate determination, the rate of formation of P-12-MSA is measurable after the phosphate has reacted. Figure 2 illustrates the recorded reaction rate curves for the reaction of molybdate with 10 ppm of P (curve b) and a mixture of 10 ppm of P and 2.5 ppm of Si (curve a). The reaction to form 12-MPA comes to equilibrium quite rapidly compared to the silicate reaction. Thus, the for- mation of 12-MPA offers little interference in measuring the rate of formation of P-12-MSA. If the measurement of the rate is made after 12-MPA has formed, but during the initial stages of the silicate reaction, Equation 2 can be written
Rate(,, = ksi(y,[Si032-]o (4)
EXPERIMENTAL
Spectrophotometric Measurements. The basic spectro- photometric reaction rate measuring system has been pre- viously described (15). The absorbance mode was used for all rate measurements. This is necessary for silicate deter- minations because the % transmittance range over which the measurements are made varies with the phosphate concentra- tion. Thus, nonlinearities would result in the % transmittance mode.
A fixed-time digital counting system (15) was used to yield a direct digital readout of reaction rates. Appropriate delay and measurement times were chosen as previously discussed (15). The progress of reac- tions was followed on a recorder to ensure that no abnormali- ties occurred during kinetic runs and to confirm that the automated rate measurements were made during the linear portion of the absorbance us. time curve.
Phosphate Determinations. Reagents for the determination of phosphate were prepared as previously described (15). The reaction was followed at 650 nm. Two milliliters of acid-molybdate and 1 ml of the silicate and phosphate mix- ture were added to the cell and allowed to mix and equili- brate. The reaction was initiated by injecting 100 pl of the ascorbic acid solution into the cell with a hypodermic syringe.
A stock solution of approximately 100 ppm of silicon was prepared by dissolving 1.015 g of Na2SiO3.9H20 and diluting to 1 liter. The stock solution was diluted to provide concentrations of 2.5-50 ppm of Si. These working solutions were adjusted to pH 3 with HoS04. Monomeric silicon units have been shown to be most stable in the 1-3 pH range and above pH 13 (16). This solution should be standardized by conventional gravimetric tech- niques for accurate silicate determinations.
A 0.155 Mo(V1) solution in 1.14N H2S04 was prepared by dissolving 9.35 g of Na2Mo04 .2Hz0 in deionized water in a 250-ml volumetric flask. Eight milliliters of concentrated H2S04 were then added and the solution was diluted to volume. This solution was allowed to stand one day before use. All solutions were stored in polyethylene bottles to prevent silicate leaching. The formation of the yellow heteropolymolybdates was followed at 400 nm. Two milli- liters of the acid-molybdate solution were added to the reac- tion cell. The reaction was initiated by injecting 1 ml of the silicate sample or silicate and phosphate mixture with a syringe.
Rate Measurements.
Silicate Determinations.
RESULTS AND DISCUSSION
Silicate Determination. Since the determination of silicate by measurement of the rate of formation of p-12-MSA has
E 0 0 d
u z E 0 v,
C
w-
a m
m a
b
I .:2
I J 1
TI ME Figure 2. Recorded reaction rate curves for formation of 12- MPA and P-12-MSA measured at 400 nm
(a) 10 ppm P and 2.5 ppm Si (b) 10 ppm P
Table I. Determination of Silicate Silicon concentration, ppm
Digital Re1 error,
7980 3 3.05 +1.6 13338 5 5 .10 +2 .0 20919 8 . . . . . . 26037 10 9 .96 -0 .4
readouta Taken Foundb z
a Averages of 5 results. Based on 8 ppm standard: integration time of 40 sec; premeas-
urement time, 45 sec.
not previously been reported, initial experiments were done to determine the accuracy which could be expected for pure Si standards. Under the conditions chosen, the digital rate readout varies linearly with the silicate concentration over the 0-10 ppm of Si range. Results of silicate analyses based on one silicate standard are presented in Table I, and the data indicate 2% or better accuracy.
Analysis of Phosphate-Silicate Mixtures. Analysis of phosphate by measurement of the initial rate of 12-MPA formation (17) or the initial rate of heteropoly blue formation has been reported (18). Mixtures of phosphate and silicate were prepared to determine if synergistic or other effects existed and to determine the concentration ranges over which Equations 3 and 4 are applicable. Results of the simul- taneous determinations are shown in Table 11. These data indicate that phosphate in the 0-10 ppm of P range can be determined with accuracies of about 1 % in the presence of as much as 50 ppm of Si. The data also demonstrate that silicate can be determined with better than 3 % accuracy in the presence of up to 10 ppm of P. Relative standard de- viations were typically 2-4 for both determinations. For both silicate and phosphate analyses, 40-second measurement times and 45-second premeasurement times are used. The
(15) J. D. Ingle and S. R. Crouch, ANAL. CHEM., 42, 1055 (1970). (16) H. R. Skell in “Treatise on Analytical Chemistry,” I. M. Kolt-
hoff and P. J. Elving, Ed., Part 11, Vol. 2, Wiley andsons, Inc. New York, N. Y., 1961.
(17) A. C. Javier, S. R. Crouch, and H. V. Malmstadt, ANAL.
(18) S. R. Crouch and H. V. Malmstadt, ibid., 39, 1090 (1967). CHEM., 41, 239 (1969).
ANALYTICAL CHEMISTRY, VOL. 43, NO. 1, JANUARY 1971 9

Table 11. Simultaneous Determination of Phosphate
Concentration of and Silicate
Concentration of mixtures found, ppm"
Phos- error, Phos- error, mixtures taken, ppm Re1 Re1
Silicon phorus Silicon z phorus z 0.0 5.0 . . . . . . . . . . . . 2.5 10.0 2.57 $2.8 10.04 +0.4 5.0 5.0 4.94 -1.2 5.02 +0.4 5.0 50.0 4.55 -9.0 . . . . . I
10.0 2.5 9.82 -1.8 2.48 -0.8 5 .0 0.0 . . . . . . . . . . . .
50.0 5 .0 . . . . . . 5.04 +0.8 (1 Based on 5-ppm silicon standard and 5-ppm phosphorus
standard: integration time, 40 sec; premeasurement time, 45 sec.
45-second premeasurement time is sufficient for the reaction to form 12-MPA to come to equilibrium. Once standards have been run, 5 determinations of silicate and phosphate can be made in about 15 minutes.
For the highest phosphate concentration shown in Table I1 a negative error is evident in the determination of silicate. This error is not attributed to a synergistic effect, but to a "concentration depletion effect," which results because the formation of 12-MPA requires 12 moles of molybdenum for every mole of phosphate. Thus, a t high phosphate con- centrations, the molybdate concentration after reaction with phosphate is substantially lower than the initial concentration. Since the rate of formation of P-12-MSA is dependent on the molybdate concentration, the depletion of Mo(V1) results in a lower rate and errors in silicate determinations in the pres- ence of large amounts of phosphate. Preliminary results obtained at lower acid and molybdate concentrations were satisfactory for pure silicate solutions. However, the con- centration depletion effect became important a t lower phos- phate concentrations. Higher molybdate concentrations were
tried to reduce the concentration depletion effect, but the high densities of these solutions prevented efficient mixing and caused noisy reaction rate curves.
Silicate determinations are not so accurate as phosphate determinations as shown by the data in Table 11. There are several possible reasons for the lower accuracy in silicate determinations. The concentration depletion effect men- tioned above can give low results if large amounts of phos- phate (>25 ppm) are present. Positive errors can result if the phosphate reaction is not complete before the rate of for- mation of P-12-MSA is measured. The errors due to this latter effect also increase with increasing phosphate con- centration. Thus, the silicate procedure is recommended only for phosphate concentrations in the range of 0-25 ppm of P.
Possibly this procedure can be extended to wider concen- tration ranges. Complete kinetic and equilibrium studies of the formation of the heteropolymolybdates and the heteropoly blues should yield information which can be used to optimize all reaction conditions. Such studies are now in progress in several laboratories.
Also simultaneous determinations of phosphate and silicate can probably be made using only one reaction by employing a stopped-flow apparatus to measure the rate of formation of both 12-MPA and P-12-MSA. Initial rates measured during the first few milliseconds can be related to the phosphate con- centration, while after 30 seconds a second reaction rate measurement can be used to determine silicate. Work in this area is in progress.
RECEIVED for review July 23, 1970. Accepted October 5 , 1970. Presented at 160th National Meeting, ACS, Chicago, Ill., Sept. 1970. One of us (J. D. Ingle, Jr.) gratefully ac- knowledges a National Science Foundation traineeship and an ACS Analytical Division Fellowship. This work was partially supported by NSF Grant No. GP-18123.
Radioisotopic X-Ray Analysis of Silver Ores Using Compton Scatter for Matrix Compensation
P. G . Burkhalter' U. S . Department of the Interior, Bureau of Mines, College Park, Md. 20740
Radioisotopic X-ray analysis with semiconductor SEMICONDUCTOR DETECTORS combined with radioisotopic detectors was evaluated for determining silver in ores. are being used for nondiffractive X-ray analysis (1-31, X-ray and scatter peak intensities were obtained using computer processing for curve fitting backgrounds Laboratory studies at College Park in the area of mineral under the Ag Ka peaks and unfolding overlapping technology have emphasized delineation of ore deposits (4 , 5 ) spectra. The discrete Compton and coherent scatter such as field analvsis of drill cores. Semiconductor detectors peaks obtainable with monoenergetic excitation Were evaluated as internal standards for matrix compensa- tion. The Ag Ka-to-Compton ratio provides compensa- tion for X-ray absorption and a single, linear calibration curve can be for silver determination in both uniform and variable matrix ores. For a set of samples taken from a drill core, silver was determined to within *lo% for concentrations above and the de- tection limit was 0.3 oz/ton (10 ppm). For variable matrix ores, silver can be determined within 120%.
offer advantages bf portability for field usage and have cient stability so that the sensitivity for silver (about 10ppm) is comparable to that obtained by conventional X-ray fluorescent
(1) A. P. Langheinrich and J. W. Forster, Adcan. X-Ray Anal., 11, 275 (1968).
(2) J , R. Rhodes, ORNL-llC-10 (v,ll, 442 (1967). (3) J. D. Frierman, H. R. Bowman, I. Perlman, and C. M. York,
(4) P. G. Burkhalter, Symp. Nucl. Techniques Mineral Resources, Science, 164,588 (1969).
. , IAEA, Vienna, STIlPUBjl98, p 365 (1969).
Isotopes, 21 (7), 395 (1970). 'Presently with U. S. Naval Research Laboratory, Code 7680, ( 5 ) P. G. Burkhalter and H. E. Marr 111, Int. J . Appl. Radiat.
Washington, D. C. 20390.
10 ANALYTICAL CHEMISTRY, VOL. 43, NO. 1, JANUARY 1971