Embed Size (px)
Citation preview

INSTITUTE OF PHYSICS PUBLISHING JOURNAL OF NEURAL ENGINEERING
J. Neural Eng. 2 (2005) 17–34 doi:10.1088/1741-2560/2/2/003
Simulations of motor unit numberestimation techniquesLora A Major and Kelvin E Jones
Department of Biomedical Engineering, University of Alberta, Edmonton, Canada
E-mail: [email protected]
Received 19 November 2004Accepted for publication 24 February 2005Published 8 April 2005Online at stacks.iop.org/JNE/2/17
AbstractMotor unit number estimation (MUNE) is an electrodiagnostic procedure used to evaluate thenumber of motor axons connected to a muscle. All MUNE techniques rely on assumptionsthat must be fulfilled to produce a valid estimate. As there is no gold standard to compare theMUNE techniques against, we have developed a model of the relevant neuromuscularphysiology and have used this model to simulate various MUNE techniques. The modelallows for a quantitative analysis of candidate MUNE techniques that will hopefully contributeto consensus regarding a standard procedure for performing MUNE.
1. Introduction
Neurogenic diseases such as amyotrophic lateral sclerosis(ALS, also referred to as Lou Gehrig’s or motor neuronedisease) are characterized by degeneration of the nervecells that control voluntary muscle contraction, resultingin progressive weakness and ultimately death. There is aneed to assess the severity and progression of neurogenicdiseases, especially delayed progression as a result of newtreatments. Motor unit number estimation (MUNE) is apromising electrodiagnostic method to meet this need [1].
MUNE provides an estimate of the number of motor axonsmaking functional contacts with a muscle. Skeletal musclescomprise thousands of muscle fibers and the muscle fibers arecontacted by a group of nerve cells located in the spinal cord,the motoneurons. Each motoneuron gives rise to a long axonthat electrically transmits action potentials from the spinalcord to the muscle where a single axon branches to contact anumber of muscle fibers. A single motoneuron together withthe muscle fibers it contacts is called a motor unit: the smallestfunctional subdivision of the neuromuscular system [2, 3].
In 1971, McComas proposed a simple neurophysiologicaltechnique for estimating the number of motor units in a muscle[4]. A maximal bioelectric response of the muscle wasrecorded using surface electromyography (EMG) followinga supramaximal electrical stimulation of the muscle’s nerve.The maximal EMG response was then divided by an estimateof the average single motor unit response. The result wasan estimate of the number of single motor unit responses
that made up the maximal EMG response. Since thisoriginal description in 1971, many investigators have used thismethod and suggested revisions and alternative techniques forperforming MUNE [1, 5, 6]. The difference between mostof the MUNE techniques is how to experimentally estimatethe average single motor unit response, and whether responsesare measured electrically, with EMG, or as the force output ofthe motor units. The different experimental MUNE techniquescan be grouped based on the method used to activate the musclebeing studied: stimulation-based or voluntary contractions.A schematic of the experimental configuration for these twotypes of MUNE is illustrated in figure 1.
If the numbers of motor units in different human muscleswere known by more direct means, e.g., from anatomicalstudies, then the different MUNE techniques could becompared against this gold standard. These data are notavailable, though there have been some anatomical studiesthat have attempted to estimate motor axon numbers fromhistological cross-sections of nerves [7, 8]. Since theanatomical data are also limited by arbitrary assumptionsand small data sets, there exists no objective standard forcomparison of the different MUNE techniques. To addressthe need for quantitative comparison of different MUNEtechniques, we have developed a model of the relevantneuromuscular physiology involved in MUNE.
Since the modeled muscle has a known number of motorunits, we can quantitatively compare the estimates generatedby different MUNE techniques to an artificial ‘gold standard’.We have used the model to simulate four MUNE techniques
1741-2560/05/020017+18$30.00 © 2005 IOP Publishing Ltd Printed in the UK 17
L A Major and K E Jones
(a)
(b)
ForceTransducer
+
-
surface EMG
MUAP triggers
force output
window average = SMUP
window average = twitch
+
-
ForceTransducer
+
-
-
+
IStimulus
single-unit twitchor
compound twitchforce output =
SMUPor
CMAPsurface EMG =
Figure 1. Methods to estimate single motor unit tensile and electrical responses. (a) Schematic illustration of median nerve stimulation.Current stimulus is applied through a bipolar electrode configuration while twitch tension is measured by a force transducer on the thumband sEMG is measured with a belly-tendon electrode configuration on the thenar eminence. Minimal stimulation evokes a single motor unitresponse. Increasing stimulation yields compound muscle responses in quantal increments until all motor units are activated and the totalmuscle response is observed. (b) Schematic illustration of sampling a single motor unit response by spike-triggered averaging. Force andsEMG are measured during weak voluntary contraction. Simultaneously, an intramuscular electrode records spiking activity (MUAPs) frommultiple motor units. MUAPs are sorted to identify spike times for individual motor units. Single motor unit spike trains are correlated withthe motor output signals to extract the tensile or sEMG response for that unit. At least 200 spikes times are needed for successful signalaveraging.
and have compared the reliability of each. We have alsocompared the relative utility of using EMG versus force asthe output measurement from the muscle. The results suggestthat the use of a spike-triggered averaging MUNE techniqueusing EMG produces the least variable results. The modelalso confirmed the experimental evidence that stimulationof motor axons is random with respect to axon diameter,which is contrary to standard bioelectric threshold theory[9]. We conclude that the use of models allows a detailedtesting of methodological assumptions in different MUNEtechniques which will lead to a more accurate and reliable
method of performing MUNE. This will translate into earlierdiagnosis and improved treatment assessment of patients withneurogenic disease.
2. Methods
The structure and organization of the model were based ona previous model of human motor units [10, 11]. Themodel consists of 250 motor units, which is equivalent toestimates of the number of motor units in human hand muscles[7, 12–14]. Each motor unit produces electrical and force
18

Simulations of MUNE
outputs in response to stimulation or voluntary activation. Themodel is used to simulate four different MUNE techniques:(1) McComas’ original Incremental Stimulation (IS) [4];(2) Milner-Brown and Brown’s Revised IncrementalStimulation (RIS) [15]; (3) Multiple Point Stimulation (MPS)[16, 17]; and (4) Spike-Triggered Averaging (STA) [18]. Themodel was developed in Matlab v7.0 and simulations were runon PCs under Windows XP operating system.
2.1. Motor unit twitch tension
The force output of a motor unit to a single impulse, i.e. twitchtension, was modeled using the function
fi(t) = Pi
Ti
t exp
(1 − t
Ti
), (1)
where t is the time (ms), and peak amplitude, Pi, andcontraction time, Ti, of the ith motor unit in a pool of sizeN are given by
Pi = exp
(ln(Prange)
N − 1(i − 1)
), (2)
and
Ti = T1
(1
Pi
) 1c
, (3)
respectively, where Prange is the range of twitch amplitudes andc is a coefficient for scaling twitch contraction times. Prange
was set to 100 as in [11], so the twitch amplitudes increaseexponentially from 1 to 100 across the motor unit pool (seefigure 2(a)).
Two factors contribute to the range of motor unit twitchamplitudes: innervation ratio (the number of muscle fibersactivated by a unit), and muscle fiber type. Any motorunit innervates many fibers, but only one type. Both factorscombined contribute to the hundredfold increase in single-unittwitch tension over the motor unit pool.
T1 is the contraction time of the slowest motor unit,which was 90 ms. The coefficient c = logTrange(Prange),where Trange is the range of contraction times (ratio TN: T1),which decrease monotonically across the motor unit pool (seefigure 2(b)). Note that the inverse correspondence betweenmotor unit contraction time and twitch tension (3) has beenobserved in cats, but the nature of this relationship in humansis unclear [19]. However, many studies agree approximatelyon contraction times in the thenar group varying approximatelyfrom 30 ms to 90 ms [20]. The largest motor unit was specifiedto contract 3 times faster than the smallest (slowest) unit,therefore c = log3100 ≈ 4.2.
Total force output from the muscle was calculated bylinear summation of forces exerted by all motor units in thepool. The whole pool may be synchronously activated by asingle pulse of electrical stimulation administered to the motoraxons (as in the stimulation-based MUNE methods); or eachunit may be activated by a stochastic train of impulses from thebrain (voluntary contraction). In this latter case, a nonlineargain function, gi, was applied to the twitch amplitude of eachunit according to its normalized mean firing rate, Ti Fri . The
amplitude modification reflects the empirical nonlinear force–frequency relationship of muscle output [11, 21–23]:
gi =
1 − e−2(Ti Fri )3
Ti Fri
/1 − e−2(0.4)3
0.4, Ti Fri > 0.4
1, otherwise.
(4)
Note that for motor units firing at a normalized rate of lessthan 0.4, the twitch tension was not affected by the imposedforce–frequency nonlinearity. The force produced by the ithmotor unit, firing at a mean rate of Frm, is given by
Fi(t) =k∑
j=1
gifi(t − tij ), (5)
where tij is the occurrence of its jth action potential. Seesection 2.4 for details on motor unit recruitment and stochasticfiring, including the formulation of mean firing rate, Fri. Theforce produced by the whole muscle over time is given by
Fm(t) =N∑
i=1
Fi(t). (6)
2.2. Single motor unit potential
The electrical response of a motor unit recorded by surfaceEMG is termed the surface motor unit potential (SMUP). Weused a phenomenological representation of the SMUP, the firstderivative of a Gaussian function. The temporal spread of theGaussian was set to 1 ms such that the peak-to-peak durationof each SMUP was 2 ms (total duration of about 8 ms),
si(t) = d
dt
(Ai√2π
e−t2
2
)= − Ai√
2πt e
−t2
2 , (7)
where t is in ms. While this is a gross simplification comparedto sophisticated models of the interference pattern generatedby EMG [24, 25], for our present purpose it is a goodapproximation to published SMUPs [4] and to a dipole sourcemodel of EMG [10, 26, 27]. Each SMUP had an identical timecourse, but the amplitudes were chosen to vary exponentiallyover a tenfold range.
Ai = exp
(ln(Arange)
N − 1(i − 1)
). (8)
Note that the motor unit EMG amplitudes are determined bythe same exponential formula as the twitch peak amplitudes(2), only over a smaller range (Arange = 10). In this way, SMUPamplitudes vary across the motor unit pool as the square root ofthe corresponding motor unit twitch amplitude [28], as shownin figure 2(d).
The surface EMG was calculated by linear summation ofSMUP trains from all motor units in the pool [29]. Unlike,motor unit force output, EMG is not subject to nonlinearscaling with respect to firing frequency of the constituent motorunits. Therefore, the expression for a single SMUP is given by
Si(t) =k∑
j=1
si(t − tij ), (9)
19

L A Major and K E Jones
-100 0 100 200 300 400 5000
10
20
30
40
50
60
70
80
90
100
Twitc
hW
avef
orm
(arb
itrar
yun
it s)
40 50 60 70 80 900
2
4
6
8
10
12
14
16
18
20
22
Contraction Time (ms)
100 120 140 160 180 200 220 240Half Relaxation Time (ms)
Fre
quen
cy
30
Amplitude (arbitrary units)
20 40 60 80 1000
10
20
30
40
50
60
70
80
90
Fre
quen
cy
10
20 40 60 80 100
35
40
45
50
55
60
65
70
75
80
85
90
Con
trac
tion
Tim
e(m
s)
3010
(a)
Amplitude (arbitrary units)
(c)Time (ms)
(d )
(b)
Figure 2. (a) Histogram of twitch amplitudes in the motor unit pool. (b) Histogram of twitch contraction times in the motor unit pool.Equation (1) results in half relaxation times of the twitches that vary linearly with contraction time (half relaxation times shown on top axis).Recent human data suggest that half relaxation times may be shorter. (c) Scatter plot of motor unit contraction times versus twitchamplitude. (d) Representative twitch waveforms. Smallest/slowest twitch is that of motor unit 1, largest/fastest twitch is that of motor unit250. Not all 250 motor unit twitches are shown.
Table 1. Muscle model output parameters.
Muscle output parameters Equations References
Twitch amplitude distribution Exponential (2) [11]Twitch amplitude range 100 [11]Twitch contraction time distribution Inverse exponential [11]Maximum twitch contraction time 90 ms [11, 20]Twitch contraction time range 3 [11, 20]SMUP amplitude distribution Exponential (8) [28]SMUP amplitude range 10 [28]Force–frequency relationship Imposed nonlinearity (4), (5) [11, 21–23]
and the corresponding CMAP is
Sm(t) =N∑
i=1
Si(t). (10)
See table 1 for a summary of the muscle model outputparameters.
2.3. Axon threshold to electrical stimulation
Parameters for the muscle model were chosen to reflectthe physiology of the thenar muscles of the human hand.We imitated stimulation of those motor axons according tothe common technique of surface stimulation of the mediannerve at the wrist [12]. It is well known that the larger the
diameter of an axon, the lower its extracellular stimulationthreshold. Furthermore, thresholds also depend on theimpedance of the tissue between the axon membranes andthe stimulating electrodes. In this way, the threshold of agiven axon depends on its diameter, as well as its depth withinthe motor fascicle.
The diameters of myelinated axons in human musclenerves have a bimodal distribution [30, 31]. The large-diameter axons comprise both motor axons and sensoryafferents and range in diameter from 5 to 15 µm. A pool ofaxon diameters was generated using a Gaussian distribution,restricting the maximum and minimum diameters to 15 µm and5 µm, respectively. The axon diameters were then sorted andassigned to the pool of motor units according to size, such that
20

Simulations of MUNE
Axon Depth (µm)
Axo
n T
hres
hold
(m
A)
2200
2300
2400
5
10
15
0.5
0.6
0.7
0.8
0.9
1
1.1
Axon Diameter (µm)
Figure 3. Axon thresholds (with respect to depth and diameter)resulting from axon depolarization model. The scale and shape ofthe threshold versus diameter relationship is very similar tofigure 21.5 in [34] where they used the Hodgkin–Huxley model tocalculate axon thresholds.
the smallest motor unit was given the smallest axon diameter,and the largest motor unit was given the largest diameter.
The motor fascicle to the thenar muscles has a diameterof 200 µm, the center of which is at a depth of 300 µm fromthe superficial surface of the median nerve. The median nervewas taken to be 2 mm below the skin (data taken from [32]).Each motor axon was assigned a depth relative to the skinsurface, assuming that the axons are evenly distributed withina cylindrical fascicle. Therefore, depths were generated usinga Gaussian distribution, constraining the range between 2.2and 2.4 mm. The 250 motor axons took up about 63% of thecross-sectional area of the fascicle.
In order to determine the stimulation threshold of eachaxon with respect to its depth and diameter, a simplistic axondepolarization model was implemented [33]. For a cylindricalexcitable cell, the relationship between intracellular potential,Vi, and membrane potential, Vm, is given by
Vm = Vr +rm
ra
d2Vi
dz2, (11)
Motor Unit Number
Axo
nT
hres
hold
(mA
)
0.5 0.55 0.6 0.65 0.7 0.75 0.8 0.85 0.9
10
20
30
40
50
60
70
80
90
100
50 100 150 200 250
0.5
0.55
0.6
0.65
0.7
0.75
0.8
0.85
0.9
Axon Threshold (mA)
Twitc
hA
mpl
itude
(arb
itrar
yun
its)
(a) (b)
Depth (Random) ThresholdsDiameter (Depolarization Model) Thresholds
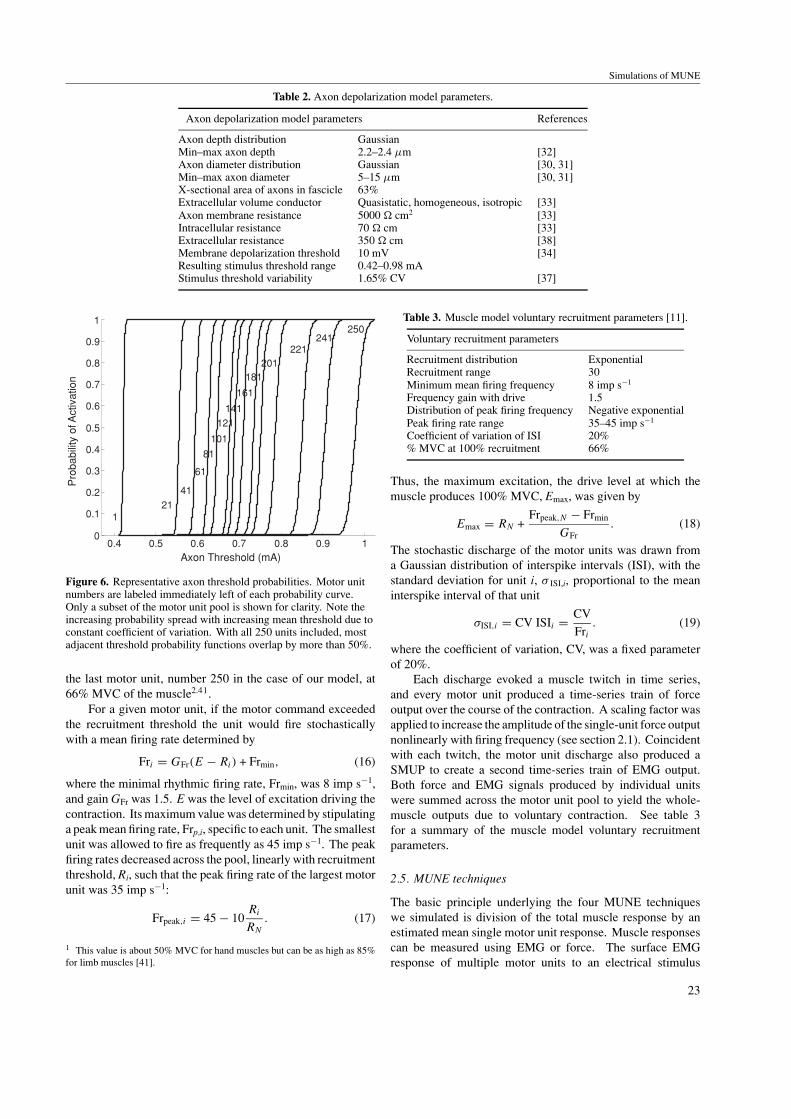
Figure 4. (a) Axon thresholds throughout the motor unit pool as derived by the axon depolarization model and the depth-dependentrelationship. (b) Scatter plot of motor unit response size versus axon thresholds calculated by the axon depolarization model. By thisthreshold model, Incremental Stimulation methods will preferentially activate the largest responses.
where Vr is the resting membrane potential and z is the axialdimension of the axon. rm (� cm) and ra (� cm) are membraneand axial resistances, which depend on axon diameter, d,according to
rm = Rm
πd, (12)
where Rm = 5000 � cm2 is the specific membrane resistance,and
ra = Ra
π(
d2
)2 , (13)
where Ra = 70 � cm is the specific axial resistance. Themembrane potential due to stimulation current, Is, appliedthrough surface electrodes is
Vm = Vi − Isre
4π
(1
dA
− 1
dC
), (14)
where re = 350 � cm is the extracellular resistance of alltissues between the axon and the stimulating electrode, dA isthe distance between the anode and the location of maximumdepolarization on the axon membrane, and dC is the samedistance measured with respect to the cathode. We made theassumption that the minimum stimulation current required toactivate an axon is the value of Is at which the membranepotential is raised 10 mV above its resting value, Vm = Vr +10 mV. Each axon was modeled in isolation, not specificallyaccounting for the shielding effect of other axons within thefascicle, nor the inhomogeneity of the superficial tissue. Also,for the purpose of these threshold calculations, the axons wereassumed to be infinite in length and the anode and cathodepoint sources were separated by 25 mm on the skin surface.
Figure 3 shows that the axon depolarization modelexhibits strong diameter dependence, which dominates overany influence the axon depth has on its threshold. The smallcontribution of axon depth adds jitter to the thresholds asshown by the full circles in figure 4(a). Axon diameter iscorrelated with the amplitude of the corresponding motorunit response size. By this threshold model, IncrementalStimulation methods will preferentially activate the largestresponses (figure 4(b)).
21
L A Major and K E Jones
Alternatively, if the effect of axon depth dominates overthe effect of axon diameter (contrary to the results of our simpleaxon depolarization model), and understanding that axondistribution in a fascicle is independent of axon diameter, axonthresholds may be effectively modeled as a random parameter(figure 4(a), open circles). By this representation, axondiameter is irrelevant to surface stimulation, and IncrementalStimulation methods will not show a bias toward largerresponses. In this way, the random threshold distributionserves as a model offering unbiased sampling of single motorunit responses.
The random threshold model is consistent withexperimental evidence suggesting that recruitment of smalland large motor units to surface stimulation is random [35, 16].We tested the two Incremental Stimulation MUNE methods(IS and RIS) on both the diameter-dependent and randomthreshold versions of the motor unit pool.
It is widely accepted that fluctuations in electricalexcitability are an inherent property of motor axons.Consequently, the activation thresholds of motor axons byartificial electrical stimulation are variable [35]. Thresholdvariability means that a pair of axons with similar excitabilitymay exhibit activation thresholds that overlap as they fluctuate.
Overlap of axon thresholds results in a well-recognizedphenomenon known as alternation; that is, for a given stimuluslevel, some of the lower threshold motor axons in a poolwill always be activated (probability of activation is unity).Others with much higher thresholds will never be activatedby that stimulus (probability of activation is zero). Theremaining axons, whose probability of activation at the givenstimulus intensity is intermediate, may or may not be activated.Thus, repeated stimulation at a set intensity produces variousincremental muscle responses. The number of incrementsobserved over repeated applications of one stimulus intensitydepends on the number of units being activated intermittently.
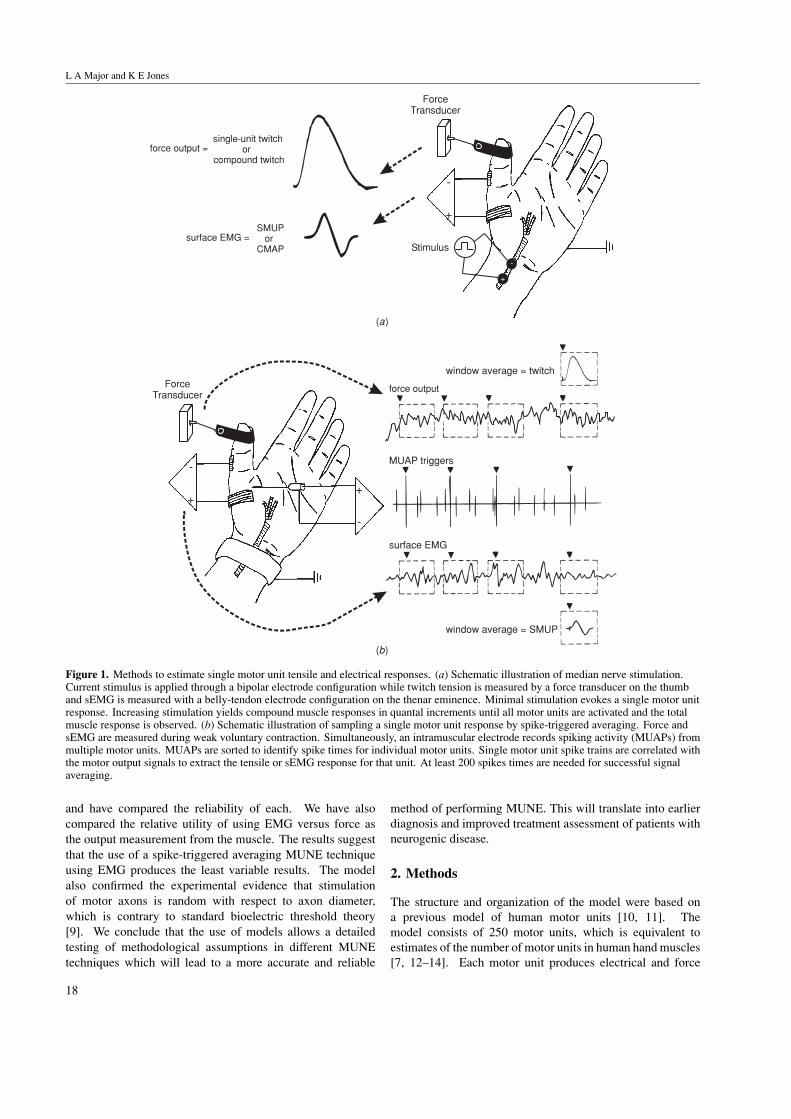
To illustrate this point, imagine a pool of 26 motor unitslabeled A, B, C, . . . , Z, where the mean activation threshold ofaxon A is less than that of B, is less than that of C, and so on,such that unit Z has the highest mean threshold. Suppose thatan electrical stimulation is applied with intensity such that unitsA, B or C might be activated, but the probability of activatingunit D is zero. The response observed at the muscle will be thecompound response of whichever units are activated. There areseven possibilities: A, A+B, A+B+C (these three combinationsare expected regardless of alternation), B, C, A+C and B+C(these four compound responses would not be possible but foraxon threshold variability). Thus, for n units that have someintermediate probability of being activated, 2n−1 compoundmuscle responses could be observed. This is a worst-casescenario, since it is possible, though not probable that each ofthe 2n−1 responses will occur with repeated stimulation (seefigure 5).
The original Incremental Stimulation MUNE methodby McComas [4] did not acknowledge the problem ofalternation. Consequently, many of the response incrementsobserved in this technique are misinterpreted, leading to asevere underestimation of the mean motor unit response,and ultimately a gross overestimation of the number of
Sin
gle-
Uni
t and
Com
poun
d tw
itche
s
A+B+C
A+C
A+B
A
B+C
B
C
Figure 5. Conceptual illustration of motor unit thresholdalternation. Seven possible twitch responses resulting fromalternating activation of 3 motor units: A, B and C.
functional motor units. Milner-Brown and Brown’s revisionof McComas’ method is specifically designed to circumventthis problem [15]. In fact, the Revised IncrementalStimulation method relies on the assumption that underconstant experimental conditions, with enough repeatedstimulations at one intensity, most of the possible responsecombinations will be observed. Furthermore, combinationsof units that follow the order of mean thresholds (i.e. A,A+B, A+B+C) will emerge as predominant responses. It wastherefore predicted that the IS method would overestimate thetrue number of motor units allocated to the muscle model,whereas the RIS method would yield an estimate closer to thetrue number. This prediction assumes that the single motorunit responses sampled are unbiased and representative of themotor unit pool.
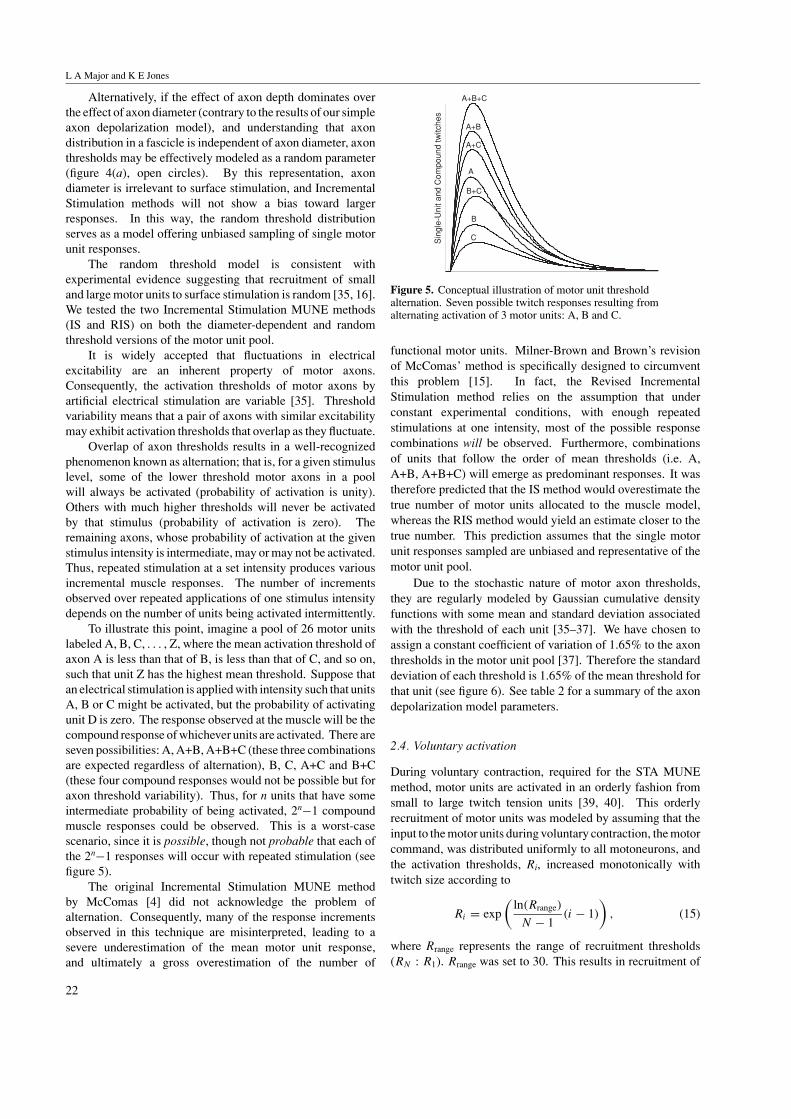
Due to the stochastic nature of motor axon thresholds,they are regularly modeled by Gaussian cumulative densityfunctions with some mean and standard deviation associatedwith the threshold of each unit [35–37]. We have chosen toassign a constant coefficient of variation of 1.65% to the axonthresholds in the motor unit pool [37]. Therefore the standarddeviation of each threshold is 1.65% of the mean threshold forthat unit (see figure 6). See table 2 for a summary of the axondepolarization model parameters.
2.4. Voluntary activation
During voluntary contraction, required for the STA MUNEmethod, motor units are activated in an orderly fashion fromsmall to large twitch tension units [39, 40]. This orderlyrecruitment of motor units was modeled by assuming that theinput to the motor units during voluntary contraction, the motorcommand, was distributed uniformly to all motoneurons, andthe activation thresholds, Ri, increased monotonically withtwitch size according to
Ri = exp
(ln(Rrange)
N − 1(i − 1)
), (15)
where Rrange represents the range of recruitment thresholds(RN : R1). Rrange was set to 30. This results in recruitment of
22
Simulations of MUNE
Table 2. Axon depolarization model parameters.
Axon depolarization model parameters References
Axon depth distribution GaussianMin–max axon depth 2.2–2.4 µm [32]Axon diameter distribution Gaussian [30, 31]Min–max axon diameter 5–15 µm [30, 31]X-sectional area of axons in fascicle 63%Extracellular volume conductor Quasistatic, homogeneous, isotropic [33]Axon membrane resistance 5000 � cm2 [33]Intracellular resistance 70 � cm [33]Extracellular resistance 350 � cm [38]Membrane depolarization threshold 10 mV [34]Resulting stimulus threshold range 0.42–0.98 mAStimulus threshold variability 1.65% CV [37]
Axon Threshold (mA)
Pro
babi
lity
ofA
ctiv
atio
n
0.4 0.5 0.6 0.7 0.8 0.9 10
0.1
0.2
0.3
0.4
0.5
0.6
0.7
0.8
0.9
1
21
250241
221201
161
181
141121
101
81
61
41
1
Figure 6. Representative axon threshold probabilities. Motor unitnumbers are labeled immediately left of each probability curve.Only a subset of the motor unit pool is shown for clarity. Note theincreasing probability spread with increasing mean threshold due toconstant coefficient of variation. With all 250 units included, mostadjacent threshold probability functions overlap by more than 50%.
the last motor unit, number 250 in the case of our model, at66% MVC of the muscle2.41.
For a given motor unit, if the motor command exceededthe recruitment threshold the unit would fire stochasticallywith a mean firing rate determined by
Fri = GFr(E − Ri) + Frmin, (16)
where the minimal rhythmic firing rate, Frmin, was 8 imp s−1,and gain GFr was 1.5. E was the level of excitation driving thecontraction. Its maximum value was determined by stipulatinga peak mean firing rate, Frp,i, specific to each unit. The smallestunit was allowed to fire as frequently as 45 imp s−1. The peakfiring rates decreased across the pool, linearly with recruitmentthreshold, Ri, such that the peak firing rate of the largest motorunit was 35 imp s−1:
Frpeak,i = 45 − 10Ri
RN
. (17)
1 This value is about 50% MVC for hand muscles but can be as high as 85%for limb muscles [41].
Table 3. Muscle model voluntary recruitment parameters [11].
Voluntary recruitment parameters
Recruitment distribution ExponentialRecruitment range 30Minimum mean firing frequency 8 imp s−1
Frequency gain with drive 1.5Distribution of peak firing frequency Negative exponentialPeak firing rate range 35–45 imp s−1
Coefficient of variation of ISI 20%% MVC at 100% recruitment 66%
Thus, the maximum excitation, the drive level at which themuscle produces 100% MVC, Emax, was given by
Emax = RN +Frpeak,N − Frmin
GFr. (18)
The stochastic discharge of the motor units was drawn froma Gaussian distribution of interspike intervals (ISI), with thestandard deviation for unit i, σ ISI,i, proportional to the meaninterspike interval of that unit
σISI,i = CV ISIi = CV
Fri. (19)
where the coefficient of variation, CV, was a fixed parameterof 20%.
Each discharge evoked a muscle twitch in time series,and every motor unit produced a time-series train of forceoutput over the course of the contraction. A scaling factor wasapplied to increase the amplitude of the single-unit force outputnonlinearly with firing frequency (see section 2.1). Coincidentwith each twitch, the motor unit discharge also produced aSMUP to create a second time-series train of EMG output.Both force and EMG signals produced by individual unitswere summed across the motor unit pool to yield the whole-muscle outputs due to voluntary contraction. See table 3for a summary of the muscle model voluntary recruitmentparameters.
2.5. MUNE techniques
The basic principle underlying the four MUNE techniqueswe simulated is division of the total muscle response by anestimated mean single motor unit response. Muscle responsescan be measured using EMG or force. The surface EMGresponse of multiple motor units to an electrical stimulus
23

L A Major and K E Jones
applied to a nerve is known as the compound muscle actionpotential (CMAP). Thus, the estimated number of functionalmotor units in a muscle (or group of muscles) is
N = max CMAP
mean SMUP,
or (20)
N = max muscle twitch
mean motor unit twitch.
In either case, amplitude or area parameters of the electrical ortensile responses can be used as a quantitative measure of thewhole- or partial-muscle response size. We used the amplituderesponse (negative peak, in the case of SMUPs) for our MUNEcalculations.
The differences between the four MUNE techniques towhich we applied the muscle model are the methods by whichthe average single motor unit response (the denominator in(20)) is estimated. In each, single motor unit responses froma subset of the pool are sampled and averaged. The accuracyof any MUNE technique depends on how faithfully the singlemotor unit responses are reproduced, and if the response sizesof the sampled units are unbiased and representative of themotor unit pool.
We simulated the four estimation methods using bothforce and EMG measurement modalities. The temporalresolution of each simulation was 0.1 ms, except for STAwhere time steps of 0.5 ms were used to reduce the amountof time-series data stored after each 25 s contraction. For ISand RIS, 10 motor units were sampled to obtain an estimate ofthe mean motor unit size (twitch or SMUP amplitude) for thepool. In the MPS and STA simulations, 20 motor unit sampleswere acquired. The reason for these choices will be discussedlater.
2.5.1. Incremental Stimulation. The Incremental Stimulationmethod is also known as the McComas method [4], althoughMcComas originally performed the experiment on the extensordigitorum brevis innervated by the deep peroneal nerve, usingEMG recordings only.
Compound muscle responses are elicited by increasingsubmaximal stimulation of the (in this case) median nervesuch that the smallest response observed must be attributed tothe activation of just one motor unit. Subsequent responsesto changing stimulus levels exceed the minimum responseby fixed amplitude steps. Neglecting the notion of thresholdalternation, each quantal increase in muscle output is assumedto be due to activation of one additional motor unit (figure 7).In this way, when n output increments have been observed, it isassumed that the largest response resulted from the activationof exactly n motor units. Therefore, the mean response size ofthose n units is given by
mean SMUP = SMUPn
n. (21)
The simplicity of this approach begs the question ‘Whynot record the quantal response increases across the entireactivation range of the motor unit pool, and count the numberof steps as the total number of functional motor units?’ Aside
Time (ms)
CM
AP
s(a
rbitr
ary
unit s
)
0 2 4 6 8 10-6
-4
-2
0
2
4
6
Figure 7. Compound muscle EMG responses acquired duringIncremental Stimulation. n = 10 CMAPs were recorded (the thirdand fourth smallest traces are very similar).
from the now obvious issue of threshold alternation, it becomesdifficult to distinguish response steps as n becomes large. Thisis because the single motor unit response step size relativeto the combined response of the activated units diminishesas n increases. In other words, at the low level of signalgain required to capture a compound muscle response due toactivation of a large number of motor units, the incrementalresponse of a single unit is not visible. For this reason,McComas, who had not yet acknowledged the problem ofalternation, restricted the number of observed responses to 11.Equivalently, n is the number of units sampled to estimate themean motor unit response. For all our MUNE simulationsn = 10.
In some respects, digital simulation of this rather simpleprotocol is not as simple as the real world experiment.Therefore, the key steps involved in the IS simulation aredescribed by the flowchart in figure 8.
2.5.2. Revised Incremental Stimulation. With the applicationof increasing stimulation intensities, various responseincrements are observed. Many of these variations are dueto alternation, but using the original IS method, they areinterpreted as being due to activation of a new motor unit.The result is that the mean motor unit response isunderestimated, and by equation (20), the number of functionalmotor units is overestimated. The greater the overlap of axonthreshold probabilities (figure 6), the greater the number ofunits that will have an intermediate probability of activationat one stimulus level, the worse the MUNE overestimationbecomes.
Milner-Brown and Brown’s RIS method compensates forthe problem of alternation by applying each stimulus incrementmany times over, taking account of the entire distribution ofresponses to that stimulus intensity [15]. The idea is that underconstant experimental conditions, with enough repetitions,most of the possible response combinations (alternations) willbe observed. For a given stimulus, the most probable outcomeis that every unit with an activation probability of greater than
24

Simulations of MUNE
Response count is 1
Start
Reset stimulus to minimum*
10 responsesstored?
YES
NO
Any responseobserved?
YES
NO
Stimulate and observe response
Randomize thresholds withinprobability distribution
Increment** the stimulus level
Response differentfrom all stored
responses?
Increment response count
YES
NO
Divide maximum incremental responseby 10 to get mean single unit response
Finish
First non-zeroresponse?
YES
NO
Store response
Stimulus level ismaximum ?
YES
NO
MUNE is the numberof stored responses
* Minimum stimulus level is 3standard deviations of theminimum threshold below theminimum mean threshold
** Stimulusincrement is0.01% of thestimulus spanrequired forminimal tomaximalmuscleresponse
Maximumstimuluslevel is 3standarddeviations ofthemaximumthresholdabove themaximummeanthreshold
^
^
Figure 8. Flowchart of Incremental Stimulation algorithm.
0.5 will fire, and all those with an activation probability ofless than 0.5 will not; that is, most probably, only units whosemean threshold is less than the stimulus will produce an output.Therefore, the response that is due to orderly activation willemerge as the predominant response for that stimulus level.
When the stimulus intensity is increased and repeatedapplication reveals a new predominant response, it indicatesthat the mean threshold of the next motor unit has beensurpassed. Therefore, the predominant responses are countedas motor unit increments. The sample set of motorunit responses is obtained by subtracting each predominantresponse from the previous, except the first one obtained,since that is simply the response of the lowest threshold motorunit.
Milner-Brown and Brown incorporated two simplecriteria in their increment-counting paradigm. In order tocount the predominant response arising from some stimulusintensity as a new response increment, (1) it must be a largerresponse than the previous one counted, and (2) the minimumresponse at this stimulus level must be at least as large as themaximum response to the stimulus level at which the previousincrement was counted. For the same reason as in the originalIS method, only about 10 motor unit response samples can beobtained under realistic experimental conditions. An exampleof the responses obtained by the RIS method is shown infigure 9. The key steps involved in the RIS simulation aredescribed by the flowchart in figure 10.
25

L A Major and K E Jones
Time (ms)
CM
AP
s(a
rbitr
ary
unit s
)
0 2 4 6 8 10-150
-100
-50
0
50
100
150
Figure 9. Compound muscle EMG responses acquired duringRevised Incremental Stimulation. Grey traces are the groups of50 sweeps acquired at each stimulus increment that met the criteriafor activation of a new motor unit. The thick black traces are thecorresponding predominant responses.
2.5.3. Multiple Point Stimulation. MPS bypasses theproblem of alternation entirely by recording the response
Start
Reset stimulus to minimum*
Any responsesobserved?
YES
NO
Stimulate and observe response
YES
NO Done 50sweeps?
Randomize thresholds withinprobability distribution
Increment** thestimulus level
Calculate parameters:Minimum predominant responseMaximum responseMinimum non-zero response
Predominantresponse isnon-zero?
YES
NO
* Minimumstimulus levelis the minimummean threshold
** Stimulusincrement is0.01% of thestimulus spanrequired forminimal tomaximalmuscleresponse
Step count is 1
A
Increment step count
YES
Stimulus levelis
maximum^^?
MUNE is the number ofstored responses
Finish
All non-zeroresponses?
YES
Stimulate and observe response
YES
NO Responseobserved?
Randomize thresholds withinprobability distribution
NO
Stimulate and observe response
YES
NO Done 50sweeps?
Randomize thresholds withinprobability distribution
Calculate parameters:Minimum predominant responseMaximum responseMinimum non-zero response
Step criteria^met?
YES NO
10 stepscounted?
NO
Increment** thestimulus level
NO
YES
Average 10 samples toget mean single-unit
response
Subtract consecutivepredominant responses toget single unit response
samples
A
^ Step criteria are:1) predominant response >
predominant responseof previous step
2) minimum response > orequal to maximumresponse of previousstep
^^ Maximumstimulus level is3 standarddeviations ofthe maximumthresholdabove themaximummean threshold
Figure 10. Flowchart of Revised Incremental Stimulation algorithm.
of only one motor unit at a time. Multiple motor unitresponse samples are obtained by changing the site of electricalstimulation on the skin surface [16, 17, 13, 42–44, 14]. Inthe case of performing MUNE on the thenar muscles bystimulation of the median nerve, low-intensity stimulations—just enough to evoke a minimal muscle response—are firstapplied to the wrist. The minimal response is guaranteed byrepeating the stimulation a few times to rule out any largerresponses which may be due to activation of a second motorunit, or due to alternation. After a single motor unit responseis successfully observed and recorded, the location of thestimulating electrodes is adjusted slightly to a position wherethe relative thresholds of the motor axon pool are differentfrom those in the previous stimulus location. This way, thenew minimal muscle response will be due to activation ofa different unit than before, and another single motor unitresponse is obtained.
The adjustment of stimulus location is repeated movingproximally. Stimulation of single motor axons is performedwherever the nerve is sufficiently superficial. Care must betaken to ensure that each recorded response is due to activationof a unique motor unit such that no unit response is sampledmore than once. In clinical practice, this is achieved byvisual inspection and quantification of the response waveform
26
Simulations of MUNE
parameters such as amplitude, shape and latency. When thedesired number of samples are recorded (or no more uniquesingle-unit responses can be identified), the sampled responsesare averaged to estimate the mean motor unit response.Clinical implementations of this method imply that 10 to 30unique motor unit samples can be collected from the thenarmuscles of most healthy subjects [16, 17, 13, 42–44, 14]. Forthe MPS simulation, we chose to acquire 20 response samples.
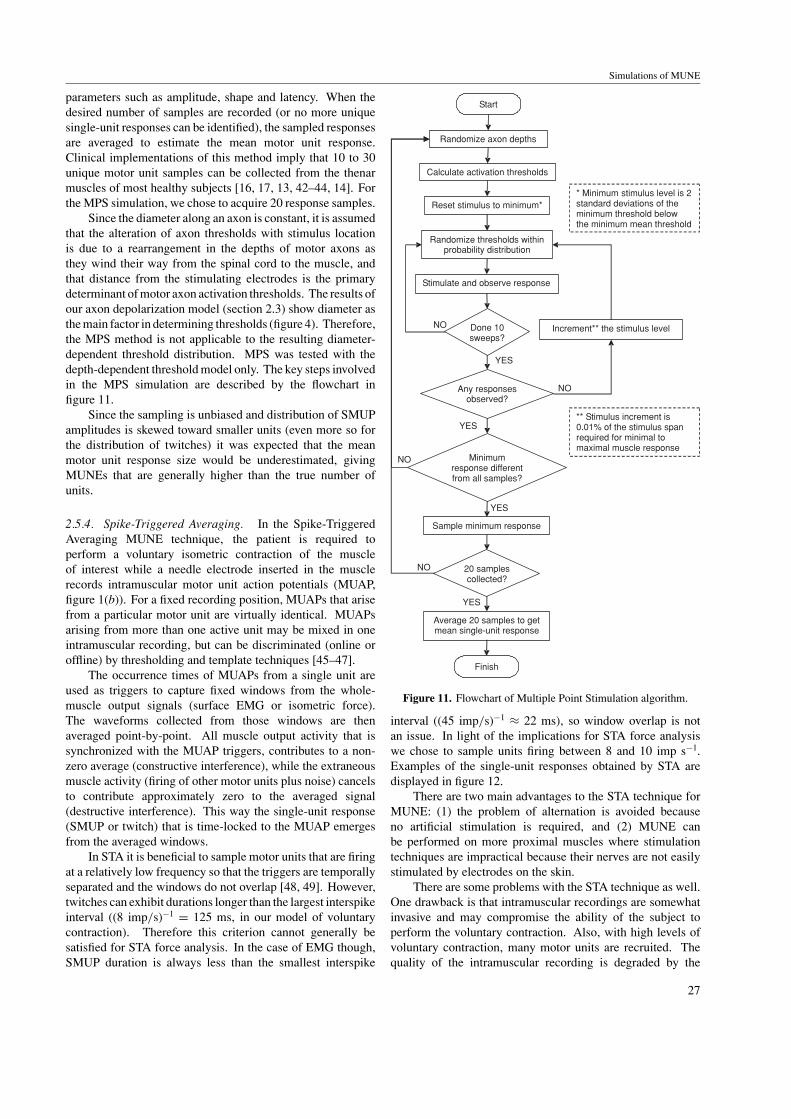
Since the diameter along an axon is constant, it is assumedthat the alteration of axon thresholds with stimulus locationis due to a rearrangement in the depths of motor axons asthey wind their way from the spinal cord to the muscle, andthat distance from the stimulating electrodes is the primarydeterminant of motor axon activation thresholds. The results ofour axon depolarization model (section 2.3) show diameter asthe main factor in determining thresholds (figure 4). Therefore,the MPS method is not applicable to the resulting diameter-dependent threshold distribution. MPS was tested with thedepth-dependent threshold model only. The key steps involvedin the MPS simulation are described by the flowchart infigure 11.
Since the sampling is unbiased and distribution of SMUPamplitudes is skewed toward smaller units (even more so forthe distribution of twitches) it was expected that the meanmotor unit response size would be underestimated, givingMUNEs that are generally higher than the true number ofunits.
2.5.4. Spike-Triggered Averaging. In the Spike-TriggeredAveraging MUNE technique, the patient is required toperform a voluntary isometric contraction of the muscleof interest while a needle electrode inserted in the musclerecords intramuscular motor unit action potentials (MUAP,figure 1(b)). For a fixed recording position, MUAPs that arisefrom a particular motor unit are virtually identical. MUAPsarising from more than one active unit may be mixed in oneintramuscular recording, but can be discriminated (online oroffline) by thresholding and template techniques [45–47].
The occurrence times of MUAPs from a single unit areused as triggers to capture fixed windows from the whole-muscle output signals (surface EMG or isometric force).The waveforms collected from those windows are thenaveraged point-by-point. All muscle output activity that issynchronized with the MUAP triggers, contributes to a non-zero average (constructive interference), while the extraneousmuscle activity (firing of other motor units plus noise) cancelsto contribute approximately zero to the averaged signal(destructive interference). This way the single-unit response(SMUP or twitch) that is time-locked to the MUAP emergesfrom the averaged windows.
In STA it is beneficial to sample motor units that are firingat a relatively low frequency so that the triggers are temporallyseparated and the windows do not overlap [48, 49]. However,twitches can exhibit durations longer than the largest interspikeinterval ((8 imp/s)−1 = 125 ms, in our model of voluntarycontraction). Therefore this criterion cannot generally besatisfied for STA force analysis. In the case of EMG though,SMUP duration is always less than the smallest interspike
Reset stimulus to minimum*
20 samplescollected?
Start
Randomize axon depths
YES
NO
Calculate activation thresholds
Any responsesobserved?
YES
NO
Stimulate and observe response
YES
NO Done 10sweeps?
Randomize thresholds withinprobability distribution
Increment** the stimulus level
Minimumresponse differentfrom all samples?
Sample minimum response
YES
NO
Average 20 samples to getmean single-unit response
Finish
* Minimum stimulus level is 2standard deviations of theminimum threshold belowthe minimum mean threshold
** Stimulus increment is0.01% of the stimulus spanrequired for minimal tomaximal muscle response
Figure 11. Flowchart of Multiple Point Stimulation algorithm.
interval ((45 imp/s)−1 ≈ 22 ms), so window overlap is notan issue. In light of the implications for STA force analysiswe chose to sample units firing between 8 and 10 imp s−1.Examples of the single-unit responses obtained by STA aredisplayed in figure 12.
There are two main advantages to the STA technique forMUNE: (1) the problem of alternation is avoided becauseno artificial stimulation is required, and (2) MUNE canbe performed on more proximal muscles where stimulationtechniques are impractical because their nerves are not easilystimulated by electrodes on the skin.
There are some problems with the STA technique as well.One drawback is that intramuscular recordings are somewhatinvasive and may compromise the ability of the subject toperform the voluntary contraction. Also, with high levels ofvoluntary contraction, many motor units are recruited. Thequality of the intramuscular recording is degraded by the
27

L A Major and K E Jones
0 50 100 150 200 250 300 350 4000
2
4
6
8
10
12
14
Twitc
h(a
rbitr
ary
unit s
)
SM
UP
s(a
rbitr
ary
unit s
)
Time (ms)
(a) (b)
(c) (d)
0 2 4 6 8 10
-0.8
-0.6
-0.4
-0.2
0
0.2
0.4
0.6
0.8
1
0 2 4 6 8 10
-0.8
-0.6
-0.4
-0.2
0
0.2
0.4
0.6
0.8
1
Time (ms)
Twitc
hes
(arb
itrar
y un
its)
Time (ms)
SM
UP
(arb
itrar
yun
it s)
Time (ms)
0 20 40 60 80 100
-6
-4
-2
0
2
4
6
Figure 12. (a) Example single motor unit twitch estimated by STA at 7.4% MVC. The extra lobes are due to autocorrelation of spiketimes for that unit and temporal fusion of its twitches. Dotted trace is the true twitch response. (b) Example SMUP estimated by STA at7.4% MVC. Dotted trace is the true SMUP. (c) Twenty sample twitches estimated by STA of contractions up to 10% MVC. Thick line is themean of the samples—the estimated mean motor unit twitch for the muscle. Note that the time scale is different from panel (a). (d) Twentysample SMUPs estimated by STA of contractions up to 10% MVC. Thick line is the mean of the samples—the estimated mean SMUP forthe muscle.
destructive interference pattern of too many MUAPs. It isoften necessary to restrict the level of voluntary contraction sothat the number and firing frequency of active units are limited,and MUAPs of interest are easily distinguishable within theintramuscular recording2.5.42. We incorporated this practicalaspect into the STA simulations by sampling 20 motor unitsduring a range of voluntary isometric contractions up to 10%MVC (corresponds to 19% excitation, 162 active units), andagain up to 30% MVC (38% excitation, 213 active units) forcomparison. The contractions were held for 25 s each so that200 to 250 windows would be averaged per sampled unit.
The smallest motor units in the pool are preferentiallyrecruited during weak voluntary contractions. Therefore, inSTA the sample of motor unit responses obtained is biasedtoward the smaller motor units, leading to an underestimationof the mean response size, and an overestimate of the motorunit number by equation (20). This provides another goodreason to select slow-firing units (between 8 and 10 imp s−1),because those units will be the largest recruited during a given
2 Sophisticated decomposition techniques are available to discriminateseveral different MUAP templates within a multi-channel (e.g., tetrode)intramuscular interference signal including activity from many motor units[50]. Use of these methods with MUNE would allow for more comprehensivesampling of single motor unit responses, as well as faster experimentalprotocols.
contraction, and sampling these will counteract the small-unitsampling bias to some extent.
STA relies on the assumption that motor units in the poolfire asynchronously so that activity from other units is averagedout of the whole-muscle signal when triggered windows arecombined. Even partial synchrony in the motor unit poolcould lead to an overestimate of the mean twitch response, andan over- or underestimate of mean SMUP (depending on thephase lag between synchronous units). The effects of motorunit synchrony on MUNE by STA were not investigated in thisstudy. However, synchrony with respect to STA in general hasbeen studied [51, 52].
Another potential limitation of the STA method forMUNE is that the whole-muscle response is obtained byelectrical stimulation, whereas the mean motor unit responseis captured during voluntary contraction. It is not wellunderstood how the differences between these contractionmodes affect the nature of the force or electrical muscle output.The discrepancy could confound MUNE results. The key stepsinvolved in the STA simulations are described by the flowchartin figure 13.
2.6. Data analysis
The MUNEs resulting from the different techniques werecompared to the actual number of motor units in the model,
28

Simulations of MUNE
Randomly select one of the candidate MUsand record its firing times (triggers)
Start
Randomly choose an excitation levelbetween minimum and maximum*
Identify candidate MUs:Those firing from 8 - 10 imp/s which havent
been sampled in a previous contraction
YES
NO Any candidateMUs?
Collect the voluntary contraction outputover 25 seconds (force or surface EMG)
FOR FORCE ANALYSIS ONLY: Removetransient force output from recorded signal(about 300 ms - discard associated trigger
times), low-pass filter to remove signaloffset (5th order Butterworth, 0.5 Hz cutoff)
Next trigger at least onewindow time before end
of contraction?
Point-by-point average all windowsextracted from contraction signal to get
single-unit response sample
YES
NO
Extract a window (force: 425 ms, or EMG:10 ms) of contraction signal starting at the
trigger time
Identify first trigger time
20 contractionsrecorded?
NO
YES
Average 20 samples to getmean single unit response
Finish
* Minimum excitation is that whichresults in recruitment of only oneunit at its minimum firing rate.Maximum excitation is that whichresults in specified maximum%MVC (~19% excitation for 10%MVC, ~38% excitation for 30%MVC)
FOR FORCE ANALYSIS ONLY:Subtract baseline offset (value attime zero) single-unit response
Figure 13. Flowchart of Spike-Triggered Averaging algorithm.
N = 250. There are two important measures: How close is theMUNE to the real number of motor units, and how variable isthe MUNE over repeated trials? For each simulation protocol,10 MUNE trials were performed to obtain a mean result ±standard deviation. For IS, RIS and MPS, each trial wasperformed on a ‘different muscle’ such that the random modeldistributions, axon depth and diameter, were rearranged eachtime the MUNE was repeated. For STA, each trial involvedvoluntary contractions at a randomly selected set of contractionintensities, up to the specified limit, 10% or 30% MVC. Theset of contraction levels were re-randomized for each of the10 trials. See tables 4 and 5 for an overview of the simulatedexperimental parameters.
The box and whisker plots in figures 14–16 illustrate thelower and upper quartiles (edges of box) the median (line insidebox) and the range of data values (whiskers). Outliers arerepresented by a symbol outside the range (Matlab, Statisticstoolbox version 5.0.1).
3. Results
In total 70 simulations were done to compare the differentMUNE techniques and their sensitivity to key parametersof the model (10 trials each of 7 method/models). Forceand EMG results were collected simultaneously, for a totalof 140 MUNEs. In MUNE methods involving stimulation,the stimulus was incremented by 0.01% of the stimulus spanrequired for minimal to maximal muscle response.
3.1. Comparing Incremental Versus Revised Incremental
When the thresholds of the axons are modeled as a function ofaxon diameter and distance from the stimulating electrode,the IS method gives moderately accurate results, whereasthe RIS method grossly underestimates the actual number ofmotor units (figure 14). The estimates using IS are 172 ± 40(mean ± standard deviation) and 310 ± 76, using force and
29

L A Major and K E Jones
Table 4. Stimulation-based MUNE simulation parameters.
Name IS diam IS depth RIS diam RIS depth MPS
Threshold model Axon depolarization Axon depth Axon depolarization Axon depth Axon depthNo of samples 10 10 10 10 20Sampling bias Large units None Large units None NoneStimulation site Median at wrist Median at wrist Median at wrist Median at wrist Median at variousSweeps 1 1 50 50 10Stimulus 0.01 0.01 0.01 0.01 0.01increment (% threshold span)Temporal 0.1 0.1 0.1 0.1 0.1resolution (ms)Trials 10 10 10 10 10
Table 5. Spike-Triggered Averaging MUNE simulation parameters.
Name STA10 STA30
Maximum contraction 10% MVC (19% excitation) 30% MVC (38% excitation)No of samples 20 20Sample frequency (imp s−1) 8–10 8–10Contraction duration (s) 25 25STA window (EMG/force) 10 ms/425 ms 10 ms/425 msSampling bias small units small unitsTemporal resolution (ms) 0.5 ms 0.5 msTrials 10 10
MU
NE
IS by Force IS by EMG RIS by Force RIS by EMG
0
50
100
150
200
250
300
350
400
450
500
Figure 14. Box and whisker plots of MUNE results by IncrementalStimulation and Revised Incremental Stimulation methods. Axonthresholds are calculated by the axon depolarization(diameter-dependent) model. Horizontal dotted line is the truenumber of motor units in the pool.
EMG, respectively, as the measured output, compared to the250 motor units in the model. The estimates using the RIStechnique are much lower (force: 15 ± 1.0, EMG: 20 ± 1.8).
These estimates are not in agreement with the expectedoverestimate from experimental MUNE based on the ISmethod [36, 5]. The most probable reason for the discrepancy
between the simulations and the expected results is the axondepolarization model. In this model, axon diameter islinked to motor unit size. Since the largest diameter axonsinvariably have the lowest thresholds, the IS and RIS samplingmethods are strongly biased toward very large single motorunit responses.
With random axon thresholds, simulations of the IStechnique result in drastic overestimation of the number ofmotor units (force: 684 ± 397 [296–1165], EMG: 566 ± 191[384–952]). This is the expected result for a MUNE methodthat does not consider the problem of alternation resultingfrom axon threshold variability. The RIS method attempts toaccount for alternation with an improved stimulation paradigmbut the resulting MUNEs still underestimate the true value(force: 51 ± 5.6, EMG: 49 ± 6.7).
Figure 15 also illustrates the other major differenceevident in these simulations: the variability of the MUNE withthe two techniques. The original IS method produces highlyvariable results and this variability is greatly reduced by theRIS method. The decrease in MUNE variability with RIS isdue to the large number of stimulation sweeps applied at eachstimulus intensity increment.
3.2. Multiple Point Stimulation
The fact that axon threshold variability results in alternation isa well-acknowledged limitation of some MUNE techniques.One technique that successfully circumvents the problem isthe MPS method. In the simulation, motor axon thresholdswere independent of axon diameter, therefore independent ofmotor unit response amplitude. Thus, the MPS simulationconstitutes unbiased sampling of the single-unit responses inthe motor pool. MPS MUNE results were much improvedover the IS and RIS techniques (force: 295 ± 64, EMG:272 ± 36, figure 16).
30

Simulations of MUNE
MU
NE
IS by Force IS by EMG RIS by Force RIS by EMG0
200
400
600
800
1000
1200
Figure 15. Box and whisker plots of MUNE results by IncrementalStimulation, Revised Incremental Stimulation and Multiple PointStimulation methods. Axon thresholds are random (depthdependent). Horizontal dotted line is the true number of motor unitsin the pool.
3.3. Spike-Triggered Averaging
STA is a MUNE technique that is free from the problemof alternation because it does not require artificial electricalstimulation of individual motor units [18]. The majorlimitation of STA, experimentally, is that contractions arelimited to low to moderate levels in order to confidentlydiscriminate single MUAPs via the intramuscular needleelectrode. To explore the effect of contraction level wesimulated isometric contractions up to 10% and 30% MVC(figure 16).
At 10% MVC the MUNEs from both force and EMGwere considerably high (force: 825 ± 117, EMG: 381 ± 25).When STA was performed over a larger range of contractionlevels, 30% MVC, the estimates changed to force: 334 ± 32and EMG: 241 ± 10. Both estimates are more accurate andless variable than using contractions only up to 10% MVC.
4. Discussion
The simulation results of the four different MUNE techniquesprovide unique insight into this important electrodiagnosticmethod. First, the results suggest that axon threshold duringelectrical stimulation of motor nerves is not strongly biasedfor axon diameter. Second, the use of muscle force output forperforming MUNE is not advised as it results in more variableestimates compared to using EMG. Lastly, and perhaps moretentatively, the most accurate estimate with the least variabilityis expected from using Spike-Triggered Averaging of EMGwith voluntary contractions up to 30% maximal.
MU
NE
200
300
400
500
600
700
800
900
1000
MPSForce
MPSEMG
STA10%Force
STA10%EMG
STA30%Force
STA30%EMG
Figure 16. Box and whisker plots of MUNE results by MultiplePoint Stimulation and Spike-Triggered Averaging (up to 10% MVCand 30% MVC) methods. Horizontal dotted line is the true numberof motor units in the pool.
4.1. Axon threshold depends more on depth thanaxon diameter
In the results presented in figures 14 and 15, the simulationof the IS method gave the expected result only in the caseof random axon thresholds. Similarly, the results with theRIS method were improved using random axon thresholds,although still grossly underestimating the true value. Inaddition, based on the data in figure 4(a) and our developmentof the model, the MPS method would have resulted in therecruitment of the same ∼8–10 low threshold motor units(those with the largest diameter, twitch and SMUP) in eachsimulated new stimulation position. The strong dependence onaxon diameter would have prevented collection of 20 uniquemotor units in our MPS simulations. Altogether the resultssuggest that axon diameter is not a major factor in determiningthreshold to electrical stimulation and that the random depthdistribution was a better model of axon threshold.
This conclusion contradicts expectations based on thetheoretical model developed in section 2.3 and [34], butis consistent with previously reported empirical findings ofhuman motor axon thresholds [35, 16, 37]. A theoretical axonthreshold model that incorporated the anisotropic conductivityof the fibrous tissue between the axon and the skin wouldresult in reducing the effect of axon diameter. Such amodel would be expected to produce thresholds that are lessinfluenced by diameter and more dependent on the randomdepth distribution, i.e. corresponding to our random thresholddistribution. It should be noted that the influence of diameteron axon threshold would increase with increased distance from
31

L A Major and K E Jones
the skin; that is, the deeper the nerve the greater the influenceof axon diameter. So the random axon thresholds in the presentstudy are most appropriate for the superficially located mediannerve at the wrist.
Whether the stimulation of human motor axons is entirelyrandom has yet to be determined. There have been someobservations using MPS that the same motor axons exhibitthe lowest threshold at different stimulation sites along themedian nerve [53]. Thus resolution of this issue awaits furtherexperimental data that directly test for correlations betweenstimulus threshold and indirect measures of axon diameteracross the full range of motor unit sizes.
4.2. The RIS method results in underestimated MUNE
Simulations of the RIS method using random axon thresholdsresulted in MUNE of about 50 units compared to the 250motor units in the model. The experimental data for the thenarmuscles resulted in estimates of 261±116 motor units [15].Why were the results from the model so low?
The RIS minimum–maximum criterion described insection 2.5.2 is valid for motor unit pools where the overlapin adjacent threshold probability functions is less than 50%,but the overlap in these simulations was much more than that(figure 6). This caused many incremental motor unit responsesto be missed by the RIS algorithm, thereby overestimatingthe mean response size and underestimating the numberof motor units. By extension, the greater the overlap inthreshold probabilities, the more severely RIS underestimatesthe number of motor units—alternation has the opposite effectas in the IS method.
The results from the RIS simulations serve to highlight theproblem of alternation on accurate MUNE using IncrementalStimulation methods. If alternation is ignored, as in the caseof the original IS method, gross overestimates result. If strictinclusion criteria are invoked to account for alternation, theresult may be an equally inaccurate underestimate, albeit withreduced variability. We conclude that the RIS method is notan appropriate solution to the problem of alternation, giventhe uncertainty in the distribution of mean axon thresholds inhuman motor axons.
4.3. EMG is the preferred output measure for MUNE
The results with all methods studied are less variable whenEMG is used as the output measure compared to muscle force.There are a number of reasons why this is the case, including,the range of amplitudes of the two outputs, the shorter durationof the EMG output, and perhaps the minimalism of the EMGmodel.
The range of twitch amplitudes, Prange, was 100 comparedto a range of 10 for the SMUP amplitudes (Arange, table 1). Thedifference in range is expected from the empirical evidence thatSMUP amplitude varies as the square root of twitch amplitude[28]. Random samples from the narrow SMUP distributionwill therefore be less variable than the more broadly distributedtwitch amplitudes.
Another acknowledged limitation of using force outputduring voluntary contractions, and therefore the STA methods,
is the influence of partial twitch overlap on the average [48, 49].In practice, this drawback is reduced by inclusion criteria thatlimit the interval between consecutive spikes to �100 ms,which is equivalent to a rate of 10 spikes s−1. However, evenwith this inclusion criterion in place, output measures usingforce during STA were more variable than those using EMG(figure 16).
The use of a phenomenological representation of theSMUP (section 2.2) may have biased our results in favorof EMG compared to force. A more realistic model ofEMG would have accounted for the non-uniform shape ofexperimentally recorded SMUPs. However in practice, EMGelectrodes are iteratively positioned to result in electricallyevoked SMUPs with a constant polarity and initial negativephase [53]. Measures are restricted to this initial negativephase using peak amplitude or negative peak area. Therefore,we think that our SMUP model was a suitable approximationto the experimental data generated by the stimulation-basedMUNE methods. The SMUP averaged from the EMGinterference pattern during simulated voluntary contractionswould be more suspect to our minimal model. But decreasedvariability of the MUNE using EMG compared to force is notlimited to our simulations of the STA method; it is true for allmethods (figure 16).
More advanced methods for modeling EMG are availablewhich account for factors that affect the overall shape ofa SMUP. In particular, the spatiotemporal properties of anintracellular muscle action potential (IAP) can be derivedfrom a core conductor model by making assumptions aboutthe conductive and capacitive properties of the muscle fiber.Alternatively, the IAP may be recorded experimentally, ordescribed by an empirical function of time, and related to spaceby an assumed conduction velocity of the muscle fiber [26].Knowing that such an intracellular current source exists withina finite volume conductor (the body) beneath various tissuelayers (muscle, fat, skin) allows for more realistic calculationsof the resulting surface potentials. Existing volume conductormodels use analytic formulae to predict recorded potentialswith respect to arbitrary source/electrode locations, finitelength of muscle fibers, and anisotropic conduction throughtissue layers [54, 55]. One particularly flexible model basedon signal conduction transfer functions can be extended toaccount for other physiological parameters such as musclefiber inclination, capacitive tissue properties, as well as anarbitrary detection system configuration [56, 57]. Certainlya model that incorporated this level of detail into MUNEsimulations would provide additional insights.
4.4. Comparing Multiple Point Stimulation andSpike-Triggered Averaging
Interestingly, the MUNE results from the STA method weremore accurate than the unbiased sampling of 20 units acquiredby MPS (figure 16). Even though experimental considerationspreclude the sampling of the largest motor unit response withSTA (section 2.5.4), sampling of responses during any givencontraction is biased toward the units discharging at the lowestfrequency (i.e. the largest units). Therefore during moderately
32

Simulations of MUNE
large contractions STA has the opportunity to capture theresponses of relatively scarce intermediate-sized motor units.These samples contribute to a larger estimate of the meanresponse, therefore, a smaller MUNE. In this way, the natureof the STA sampling method counteracts the skewed sizedistribution of the motor unit pool.
The advantage of STA over MPS requires unbiasedsampling from the pool by recording and discriminating singlemotor unit spike trains at levels of contraction of about 30%maximum. In the simulations, it is trivial to select motorunits firing at 8–10 imp s−1 from the pool of potentially250 simultaneously active units. In practice, the acquisitionof single-unit spike trains at these levels of contraction isnot trivial. Also, the level of contraction required to get agood sample depends on the range of recruitment thresholds,Rrange (15). For intrinsic hand muscles this range is about50% MVC whereas it can be as high as 85% for limbmuscles [41]. Therefore, to get an unbiased sample from thebiceps brachii muscle may require prolonged contractions atlevels greater than 50% MVC. With traditional intramuscularrecording methods this would be an arduous task, however thedecomposition-enhanced spike-triggered averaging (DE-STA)methodology has been specifically developed to overcomethis limitation [58]. Thus both theoretically and perhapsexperimentally using DE-STA, there is a slight advantage inaccuracy and variability using the STA compared to the MPSMUNE methodology.
5. Conclusions
It is acknowledged among clinical researchers performingMUNE that the electrophysiological and anatomical estimatesof motor units in human muscles are fraught with technical andsampling problems [1]. What is needed to bring consensus andadvance the promise of MUNE as a standard electrodiagnosticmethod, is a quantitative and objective means of comparingresults. The model presented is, to our knowledge, the firstto address the neuromuscular physiology involved in MUNE.The model is intended to serve as a heuristic tool that will aidin the development of more effective methodology and providea quantitative basis for comparison of alternatives.
Modeling the neuromuscular physiology involved invarious MUNE techniques gave new insight into the methodsthat could not be tested experimentally. While it has beenacknowledged for some time that the original IncrementalStimulation method proposed by McComas in 1971 hadsignificant limitations, there have been few quantitative studiesof these limitations (e.g., [36]). The simulations of theRIS method revealed the danger of being too conservativewith inclusion criteria and the strong effect of variable axonthresholds and their relative overlap. The results from themodel support the conclusion that axon thresholds are notbiased to large-diameter motor axons, but instead are morerandom due to the depth within the fascicle. This is essentialfor the validity of results produced with the MPS method.Finally, simulations of the STA method using EMG as theoutput measure produced the most accurate and least variableMUNE. This finding requires sampling single motor unit spike
trains at moderate to high levels of contraction, which isexperimentally offered by the DE-STA method.
Acknowledgments
The authors express their sincere thanks to Dr K Ming Chanfor his valuable advice and helpful comments on themanuscript. KEJ is an AHFMR Medical Scholar andoperating funds for this work were obtained in part byan Independent Establishment Grant from the AHFMR.The Matlab software used in the model will be freelyavailable for download from the ModelDB website,http://senselab.med.yale.edu/senselab/ModelDB/.
References
[1] Bromberg M 2001 Motor Unit Number Estimation (Snowbird,UT: Elsevier)
[2] Liddell E G T and Sherrington C S 1925 Recruitment andsome other factors of reflex inhibition Proc. R. Soc. Lond. B97 488
[3] Sherrington C S 1925 Remarks on some aspects of reflexinhibition Proc. R. Soc. Lond. B 97 519
[4] McComas A J, Fawcett P R, Campbell M J and Sica R E 1971Electrophysiological estimation of the number of motorunits within a human muscle J. Neurol. Neurosurg.Psychiatry 34 121–31
[5] Shefner J M 2001 Motor unit number estimation in humanneurological diseases and animal models Clin.Neurophysiol. 112 955–64
[6] Shefner J M and Gooch C L 2003 Motor unit numberestimation Phys. Med. Rehabil. Clin. N. Am. 14 243–60
[7] Enoka R M 1995 Morphological features and activationpatterns of motor units J. Clin. Neurophysiol. 12 538–59
[8] Neto H S, Filho J M, Passini R Jr and Marques M J 2004Number and size of motor units in thenar muscles Clin.Anat. 17 308–11
[9] McNeal D R 1976 Analysis of a model for excitation ofmyelinated nerve IEEE Trans. Biomed. Eng. 23 329–37
[10] Fuglevand A J, Winter D A, Patla A E and Stashuk D 1992Detection of motor unit action potentials with surfaceelectrodes: influence of electrode size and spacing Biol.Cybern. 67 143–53
[11] Fuglevand A J, Winter D A and Patla A E 1993 Models ofrecruitment and rate coding organization in motor-unitpools J. Neurophysiol. 70 2470–88
[12] Brown W F 1972 A method for estimating the number of motorunits in thenar muscles and the changes in motor unit countwith ageing J. Neurol. Neurosurg. Psychiatry 35 845–52
[13] Doherty T J, Stashuk D W and Brown W F 1993 Determinantsof mean motor unit size: impact on estimates of motor unitnumber Muscle Nerve 16 1326–31
[14] Felice K J 1995 Thenar motor unit number estimates using themultiple point stimulation technique: reproducibility studiesin ALS patients and normal subjects Muscle Nerve 181412–6
[15] Milner-Brown H S and Brown W F 1976 New methods ofestimating the number of motor units in a muscle J. Neurol.Neurosurg. Psychiatry 39 258–65
[16] Doherty T J and Brown W F 1993 The estimated numbers andrelative sizes of thenar motor units as selected by multiplepoint stimulation in young and older adults Muscle Nerve16 355–66
[17] Kadrie H A, Yates S K, Milner-Brown H S and Brown W F1976 Multiple point electrical stimulation of ulnar and
33

L A Major and K E Jones
median nerves J. Neurol. Neurosurg. Psychiatry 39973–85
[18] Stein R B, French A S, Mannard A and Yemm R 1972 Newmethods for analysing motor function in man and animalsBrain Res. 40 187–92
[19] Bigland-Ritchie B, Fuglevand A J and Thomas C K 1998Contractile properties of human motor units: Is man a cat?Neuroscientist 4 240–9
[20] Chan K M, Doherty T J and Brown W F 2001 Contractileproperties of human motor units in health, aging, anddisease Muscle Nerve 24 1113–33
[21] Mannard A and Stein R B 1973 Determination of thefrequency response of isometric soleus muscle in the catusing random nerve stimulation J. Physiol. 229 275–96
[22] Bigland B and Lippold O C 1954 Motor unit activity in thevoluntary contraction of human muscle J. Physiol. 125322–35
[23] Rack P M and Westbury D R 1969 The effects of length andstimulus rate on tension in the isometric cat soleus muscleJ. Physiol. 204 443–60
[24] Merletti R 2001 Surface electromyography Eur. Med. Phys. 3757–68
[25] Stegeman D F and De Weerd J P 1982 Modelling compoundaction potentials of peripheral nerves in situ: I. Modeldescription: evidence for a non-linear relation between fibrediameter and velocity Electroencephalogr. Clin.Neurophysiol. 54 436–48
[26] Andreassen S and Rosenfalck A 1981 Relationship ofintracellular and extracellular action potentials of skeletalmuscle fibers CRC Crit. Rev. Bioeng. 6 267–306
[27] Rosenfalck P 1969 Intra- and extracellular potential fields ofactive nerve and muscle fibres. A physico-mathematicalanalysis of different models Acta Physiol. Scand. Suppl.321 1–168
[28] Milner-Brown H S and Stein R B 1975 The relation betweenthe surface electromyogram and muscular force J. Physiol.246 549–69
[29] Day S J and Hulliger M 2001 Experimental simulation of catelectromyogram: evidence for algebraic summation ofmotor-unit action-potential trains J. Neurophysiol. 862144–58
[30] Lee R G, Ashby P, White D G and Aguayo A J 1975 Analysisof motor conduction velocity in the human median nerve bycomputer simulation of compound muscle action potentialsElectroencephalogr. Clin. Neurophysiol. 39 225–37
[31] Johansson R S and Vallbo A B 1979 Tactile sensibility in thehuman hand: relative and absolute densities of four types ofmechanoreceptive units in glabrous skin J. Physiol. 286283–300
[32] Sunderland S 1978 Nerves and Nerve Injuries 2nd edn(New York: Churchill Livingstone)
[33] Jack J J B, Noble D and Tsien R W 1975 Electric CurrentFlow in Excitable Cells (Oxford: Clarendon)
[34] Malmivuo J and Plonsey R 1995 Bioelectromagnetism:Principles and Applications of Bioelectric and BiomagneticFields (New York: Oxford University Press)
[35] Bergmans J 1970 The physiology of single human nerve fibresThesis Vander
[36] Stein R B and Yang J F 1990 Methods for estimating thenumber of motor units in human muscles Ann. Neurol. 28487–95
[37] Hales J P, Lin C S and Bostock H 2004 Variations inexcitability of single human motor axons, related tostochastic properties of nodal sodium channels J. Physiol.559 953–64
[38] Geddes L A and Baker L E 1967 The specific resistance ofbiological material—a compendium of data for thebiomedical engineer and physiologist Med. Biol. Eng. 5271–93
[39] Milner-Brown H S, Stein R B and Yemm R 1973 The orderlyrecruitment of human motor units during voluntaryisometric contractions J. Physiol. 230 359–70
[40] Calancie B and Bawa P 1989 Motor unit recruitment inhumans The Segmental Motor System ed M D Binder andL M Mendell (New York: Oxford University Press)pp 75–95
[41] Enoka R M and Fuglevand A J 2001 Motor unit physiology:some unresolved issues Muscle Nerve 24 4–17
[42] Lomen-Hoerth C and Olney R K 2000 Comparison of multiplepoint and statistical motor unit number estimation MuscleNerve 23 1525–33
[43] Doherty T J and Brown W F 1994 A method for thelongitudinal study of human thenar motor units MuscleNerve 17 1029–36
[44] Felice K J 1997 A longitudinal study comparing thenar motorunit number estimates to other quantitative tests in patientswith amyotrophic lateral sclerosis Muscle Nerve 20179–85
[45] Bak M J and Schmidt E M 1977 An improved time-amplitudewindow discriminator IEEE Trans. Biomed. Eng. 24486–9
[46] Kreiter A K, Aertsen A M and Gerstein G L 1989 A low-costsingle-board solution for real-time, unsupervised waveformclassification of multineuron recordings J. Neurosci.Methods 30 59–69
[47] Takahashi S, Anzai Y and Sakurai Y 2003 A new approach tospike sorting for multi-neuronal activities recorded with atetrode—how ICA can be practical Neurosci. Res. 46265–72
[48] Calancie B and Bawa P 1986 Limitations of thespike-triggered averaging technique Muscle Nerve 9 78–83
[49] Gossen E R, Ivanova T D and Garland S J 2003 Factorsaffecting the stability of the spike-triggered averaged forcein the human first dorsal interosseus muscle J. Neurosci.Methods 126 155–64
[50] DeLuca C J and Adam A 1999 Decomposition and analysis ofintramuscular electromyographic signals ModernTechniques in Neuroscience Research ed U Windhorst andH Johansson (Berlin: Springer)
[51] Taylor A M, Steege J W and Enoka R M 2002 Motor-unitsynchronization alters spike-triggered average force insimulated contractions J. Neurophysiol. 88 265–76
[52] Keen D A and Fuglevand A J 2004 Distribution of motor unitforce in human extensor digitorum assessed byspike-triggered averaging and intraneural microstimulationJ. Neurophysiol. 91 2515–23
[53] Doherty T, Simmons Z, O’Connell B, Felice K J, Conwit R,Chan K M, Komori T, Brown T, Stashuk D W andBrown W F 1995 Methods for estimating the numbers ofmotor units in human muscles J. Clin. Neurophysiol. 12565–84
[54] Farina D and Rainoldi A 1999 Compensation of the effect ofsub-cutaneous tissue layers on surface EMG: a simulationstudy Med. Eng. Phys. 21 487–97
[55] Gootzen T H, Stegeman D F and Van Oosterom A 1991 Finitelimb dimensions and finite muscle length in a model for thegeneration of electromyographic signalsElectroencephalogr. Clin. Neurophysiol. 81 152–62
[56] Farina D and Merletti R 2001 A novel approach for precisesimulation of the EMG signal detected by surfaceelectrodes IEEE Trans. Biomed. Eng. 48 637–46
[57] Mesin L and Farina D 2004 Simulation of surface EMGsignals generated by muscle tissues with inhomogeneitydue to fiber pinnation IEEE Trans. Biomed. Eng. 51 1521–9
[58] Boe S G, Stashuk D W and Doherty T J 2004 Motor unitnumber estimation by decomposition-enhanced spike-triggered averaging: control data, test-retest reliability, andcontractile level effects Muscle Nerve 29 693–9
34