Embed Size (px)
Citation preview
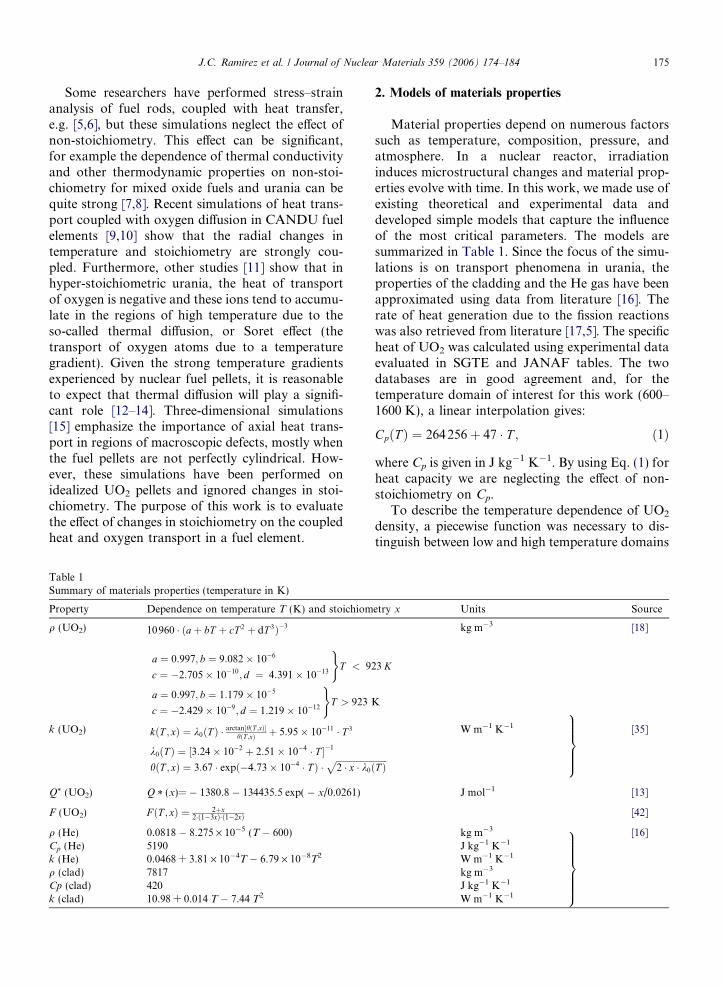
Journal of Nuclear Materials 359 (2006) 174–184
www.elsevier.com/locate/jnucmat
Simulations of heat and oxygen diffusionin UO2 nuclear fuel rods
J.C. Ramirez *, M. Stan, P. Cristea
Los Alamos National Laboratory, P.O. Box 1663, MS G755, Los Alamos, NM 87544, USA
Received 15 May 2006; accepted 18 August 2006
Abstract
We present finite-element simulations of coupled heat and oxygen atom diffusion for UO2 fuel pellets. The expressionsfor thermal conductivity, specific heat and oxygen diffusivity for the fuel element are obtained directly from previouslypublished correlations, or from analysis of previously published data. We examine the temperature and non-stoichiometrydistributions for a varying range of conditions. Simulations are performed for steady-state and transient regime inone-dimensional (purely radial) configurations. For steady-state conditions we perform parametric studies that determinethe maximum temperature in the fuel rod as a function of non-stoichiometry and heat generation rate intensity. For tran-sient simulations, we examine the time lag in the response of the temperature and non-stoichiometry distributions withrespect to sudden changes in heat generation rate intensity and oxygen removal rate. All simulations are performed withthe commercial code COMSOL MultiphysicsTM.� 2006 Elsevier B.V. All rights reserved.
PACS: 28.41.Ak; 44.10.+i; 66.10.Cb
1. Introduction
Mixed oxide fuels (of which UO2 can be consid-ered a special case) are very popular choices for lightwater reactors and have been recently considered asfuel for fast breeder reactors [1]. A review of fuelperformance codes [2] shows that the most challeng-ing issues are materials properties and modelextrapolations to high burnup values. The ceramicnuclear fuel rods operate at high temperatures(�1500 K), and under strong temperature gradients(the order of 4 · 105 Km�1). The basic transport
0022-3115/$ - see front matter � 2006 Elsevier B.V. All rights reserved
doi:10.1016/j.jnucmat.2006.08.018
* Corresponding author.E-mail address: [email protected] (J.C. Ramirez).
phenomena governing the fuel behavior are thediffusion of chemical species and heat transport.The diffusion is characterized by the diffusivityand the transport of heat by the thermal diffusivity.These two important fuel parameters are related in acomplex manner and depend on temperature andfuel composition (non-stoichiometry, for instance).To predict the evolution of fuel performance, thesedependencies must be accurately known. In thisstudy we demonstrate that coupling heat and masstransport with changes in stoichiometry is alsoimportant for an accurate simulation of fuel beha-vior. This is a complex computational task thatinvolves a detailed knowledge of UO2 thermochem-istry [3,4].
.
J.C. Ramirez et al. / Journal of Nuclear Materials 359 (2006) 174–184 175
Some researchers have performed stress–strainanalysis of fuel rods, coupled with heat transfer,e.g. [5,6], but these simulations neglect the effect ofnon-stoichiometry. This effect can be significant,for example the dependence of thermal conductivityand other thermodynamic properties on non-stoi-chiometry for mixed oxide fuels and urania can bequite strong [7,8]. Recent simulations of heat trans-port coupled with oxygen diffusion in CANDU fuelelements [9,10] show that the radial changes intemperature and stoichiometry are strongly cou-pled. Furthermore, other studies [11] show that inhyper-stoichiometric urania, the heat of transportof oxygen is negative and these ions tend to accumu-late in the regions of high temperature due to theso-called thermal diffusion, or Soret effect (thetransport of oxygen atoms due to a temperaturegradient). Given the strong temperature gradientsexperienced by nuclear fuel pellets, it is reasonableto expect that thermal diffusion will play a signifi-cant role [12–14]. Three-dimensional simulations[15] emphasize the importance of axial heat trans-port in regions of macroscopic defects, mostly whenthe fuel pellets are not perfectly cylindrical. How-ever, these simulations have been performed onidealized UO2 pellets and ignored changes in stoi-chiometry. The purpose of this work is to evaluatethe effect of changes in stoichiometry on the coupledheat and oxygen transport in a fuel element.
Table 1Summary of materials properties (temperature in K)
Property Dependence on temperature T (K) and stoichiom
q (UO2) 10960 � ðaþ bT þ cT 2 þ dT 3Þ�3
a ¼ 0:997; b ¼ 9:082� 10�6
c ¼ �2:705� 10�10; d ¼ 4:391� 10�13
)T < 9
a ¼ 0:997; b ¼ 1:179� 10�5
c ¼ �2:429� 10�9; d ¼ 1:219� 10�12
)T > 923
k (UO2) kðT ; xÞ ¼ k0ðT Þ � arctan½hðT ;xÞ�hðT ;xÞ þ 5:95� 10�11 � T 3
k0ðT Þ ¼ ½3:24� 10�2 þ 2:51� 10�4 � T ��1
hðT ; xÞ ¼ 3:67 � expð�4:73� 10�4 � T Þ �ffiffiffiffiffiffiffiffiffiffiffiffiffiffiffiffi2 � x � k0ð
pQ* (UO2) Q * (x)= � 1380.8 � 134435.5 exp( � x/0.0261)
F (UO2) F ðT ; xÞ ¼ 2þx2�ð1�3xÞ�ð1�2xÞ
q (He) 0.0818 � 8.275 · 10�5 (T � 600)Cp (He) 5190k (He) 0.0468 + 3.81 · 10�4T � 6.79 · 10�8T2
q (clad) 7817Cp (clad) 420k (clad) 10.98 + 0.014 T � 7.44 T2
2. Models of materials properties
Material properties depend on numerous factorssuch as temperature, composition, pressure, andatmosphere. In a nuclear reactor, irradiationinduces microstructural changes and material prop-erties evolve with time. In this work, we made use ofexisting theoretical and experimental data anddeveloped simple models that capture the influenceof the most critical parameters. The models aresummarized in Table 1. Since the focus of the simu-lations is on transport phenomena in urania, theproperties of the cladding and the He gas have beenapproximated using data from literature [16]. Therate of heat generation due to the fission reactionswas also retrieved from literature [17,5]. The specificheat of UO2 was calculated using experimental dataevaluated in SGTE and JANAF tables. The twodatabases are in good agreement and, for thetemperature domain of interest for this work (600–1600 K), a linear interpolation gives:
CpðT Þ ¼ 264256þ 47 � T ; ð1Þ
where Cp is given in J kg�1 K�1. By using Eq. (1) forheat capacity we are neglecting the effect of non-stoichiometry on Cp.
To describe the temperature dependence of UO2
density, a piecewise function was necessary to dis-tinguish between low and high temperature domains
etry x Units Source
kg m�3 [18]
23 K
K
ffiffiffiffiffiffiffiT Þ
W m�1 K�1
9>>>>=>>>>;
[35]
J mol�1 [13]
[42]
kg m�3 9>>>>>>=>>>>>>;
[16]J kg�1 K�1
W m�1 K�1
kg m�3
J kg�1 K�1
W m�1 K�1
176 J.C. Ramirez et al. / Journal of Nuclear Materials 359 (2006) 174–184
[18]. The function is described in Table 1. Theexpression for density shown in Table 1 is derivedin Ref. [18] from data for stoichiometric urania.Nevertheless, the work of Martin [19] suggests thatthere is little difference for this property betweenstoichiometric and hyper-stoichiometric fuel. Twoother properties of non-stoichiometric uraniarequire more complex models and are discussedbelow.
2.1. Thermal conductivity of UO2
The thermal conductivity of UO2 was extensivelystudied using experimental methods [20,21] andseveral recommendations for thermal conductivityhave been issued [18,22–24]. The methods are basedon laser flash measurements of thermal diffusivitycombined with measurements of density and specificheat. The experimental studies show that thermalconductivity of UO2 decreases with temperatureand is strongly influenced by microstructure anddefects, especially porosity [25]. Recent studies showthat burnup plays a major role in UO2 transportproperties and there are significant differencesbetween thermal conductivity at low and high bur-nup [26].
Thermal properties of UO2 have been also inves-tigated using atomistic models based on variousinter-atomic potentials. In particular, thermal con-ductivity was calculated using either equilibrium[27–30], or non-equilibrium [31] molecular dynamics(MD) simulations in a large interval of temperature,from 300 to 2000 K. In these techniques, thermalconductivity is often calculated using the Green–Kubo statistical method.
The conclusion of the atomistic studies is that themain contributions to heat conduction in UO2 aredue to lattice vibrations and electrons. The contri-bution of point defects, such as oxygen vacancies,interstitials, and small polarons originating fromconduction electrons [18], was also included [27].The experimental observation that thermal conduc-tivity of UO2 decreases with temperature (up to2000 K) was confirmed by the MD calculationsand attributed to the phonon–phonon interactions.Due to the large atomic weight of UO2, isotopiceffects can be safely neglected, but the influence ofgrain boundaries and porosity [32–34] is important.That makes the thermal conductivity of polycrystal-line samples lower than that of single crystals.
In this work we used the model developed byAmaya et al. [35]. This model is consistent with
experimental data of thermal conductivity inUO2+x over a wide range of temperature (300–1400 K) and stoichiometry (x < 0.2). All modelparameters are given in Table 1.
2.2. Oxygen diffusivity in UO2
Studies of the mobility of electrons and holes[36,37] as well as diffusion of defects in UO2 usingmeasurements of electric properties in controlledatmosphere [38] have been performed in isothermalconditions. Although new thermochemical modelsof defects and oxygen mobility have been recentlydeveloped for PuO2�x [39], a comprehensive modelof defect formation and oxygen diffusion in UO2+x
is still lacking. The evaluation of oxygen diffusivityin UO2+x [40] shows that several mechanisms con-tribute to oxygen diffusion and the chemical diffu-sion coefficient decreases with non-stoichiometry, x.
For the purpose of this work, a model that cap-tures the main properties of oxygen diffusivity overa large temperature and stoichiometry interval isdesirable. Using a set of experimental values from[40], we have optimized the parameters of the fol-lowing function describing the chemical diffusivityD(T,x) of oxygen in hyper-stoichiometric urania:
log DðT ; xÞ½ � ¼ �9:386� 4:26� 103
Tþ 1:2� 10�3
� T � xþ 7:5� 10�4 � T � log2þ x
x
� �;
ð2Þ
where D(T,x) is in m2 s�1 and temperature T is mea-sured in K.
This rather simple expression provides values ingood agreement with experiments in the tempera-ture interval (300–1800 K) and for non-stoichiome-tries 0 < x < 0.2. It is also consistent with the recentmodel [40], especially in the low non-stoichiometryregime, x < 0.03.
As the models of thermo-mechanical propertiesof fuel materials evolve and become more accurate,we will include them in the simulation capability.
3. Heat and oxygen diffusion simulation
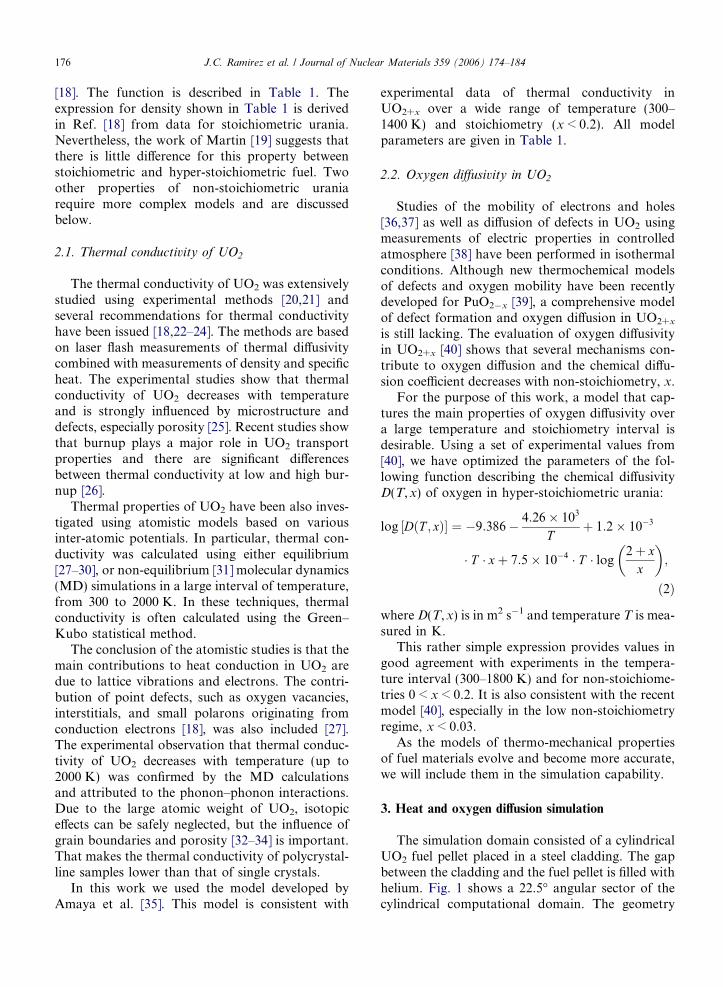
The simulation domain consisted of a cylindricalUO2 fuel pellet placed in a steel cladding. The gapbetween the cladding and the fuel pellet is filled withhelium. Fig. 1 shows a 22.5� angular sector of thecylindrical computational domain. The geometry
fuel rod
He gap( 0ˆ =∇⋅ T )kn ;
0ˆ =⋅− Jn
BTT =Bxx =
cladding
Fig. 1. Representative ‘slice’ for purely radial simulations show-ing the main components of the assembly: fuel rod, helium gapand steel cladding. Additionally, we show the analytical expres-sions representing the boundary conditions. Here, n̂ is a unitvector normal to the boundary pointing outwards, T is thetemperature, k is the thermal conductivity and J is the oxygenatom flux.
J.C. Ramirez et al. / Journal of Nuclear Materials 359 (2006) 174–184 177
and the mesh have been generated with COMSOLMultiphysicsTM. The domain shown in Fig. 1 is azi-muthally symmetric; hence all simulations are essen-tially one-dimensional in space (all gradient occur inthe radial direction only). Nevertheless, we adoptthe two-dimensional domain shown for clarity,and to use this model with little modification in fur-ther studies which will include multiple-dimensionaleffects. For all simulations in this paper, the pelletradius is 4.3 mm, the helium gap width is0.03 mm, and the cladding width (outer radiusminus inner radius) is 0.5 mm. Assuming fissionreactions that generate heat at a uniformly distrib-uted constant rate, the heat transfer equation inthe fuel pellet is
qCpoTot¼ r � krTð Þ þ _Q; ð3Þ
where q, Cp and k are the density, specific heat atconstant pressure, and thermal conductivity, respec-tively, and t is time.
Since UO2+x is non-stoichiometric, and themodel used for thermal conductivity includes adependence on x, Eq. (3) must be coupled with anequation for oxygen diffusion in the hyper-stoichi-ometric case [41,13]
J ¼ � 1
2� n � D T ; xð Þ � rxþ x
F ðT ; xÞQ�
RT 2rT
� �; ð4Þ
where n is the concentration of regular oxygen sitesin UO2, F(T,x) is the thermodynamic factor ofoxygen, Q* is the heat of transport of oxygen, andR is the universal gas constant. The expression forQ* we used in this study is listed in Table 1 andcomes from a fit of the experimental data reportedby Sari and Schumacher [13]. We should point outthat despite the fact that the data of reference [13]
is for mixed oxides, Fig. 1 in that paper shows onlya weak dependence of Q* on plutonium content,hence our expression for Q* listed in Table 1 isappropriate for UO2+x . The thermodynamic factoris given by:
F ðT ; xÞ ¼ 1þ o ln cO
o ln X O
¼ o ln P O
o ln X O
¼ 1
2� o ln P O2
o ln X O2
; ð5Þ
where c is the activity coefficient of oxygen, and PO
is the partial pressure of oxygen in UO2+x, and XO
is the oxygen concentration. In this work, an analy-tical expression of F(T,x) was derived using a modelof oxygen partial pressure from literature [42] andlisted in Table 1.
The oxygen flux J satisfies the equation of conti-nuity expressing the oxygen atoms conservation:
1
2� n � ox
ot¼ �r � J : ð6Þ
In the parenthesis of Eq. (4), the gradient of non-stoichiometry is associated with the conventionalFickian diffusion. The term involving a gradient intemperature represents the Soret effect [43,44], andit is a cross-transport effect: a flux of oxygen appearsunder a temperature gradient.
The counterbalancing effects of the Soret andFickian fluxes are responsible for a variation of oxy-gen concentration through the fuel pellet even understeady-state conditions. Due to the Soret effect, thegradients in temperature experienced by the fuel rodcause a current of oxygen atoms to flow through thepellet, which in turn triggers the conventionalFickian diffusion. Conversely, the temperature vari-ation with position through the pellet in a steady-state is preserved because of the heat generation,which manifests itself as a source term in the heatequation. Sari and Schumacher [13] observed thisphenomenon of oxygen redistribution, but did notperform a quantitative evaluation of the change instoichiometry.
For all simulations reported here, we solve fortemperature within the fuel, gap and cladding, andfor non-stoichiometry within the fuel pellet only.We use symmetry boundary conditions for T andJ along the straight edges of the pellet-claddingassembly (see Fig. 1). We assume perfect thermalcontact between the pellet outer surface and thehelium gap, as well as between the gap and the steelcladding inner surface. We use a Dirichlet type(fixed value) boundary condition for the tempera-ture at the cladding outer surface, as well as forthe non-stoichiometry at the pellet outer surface.
0.000 0.001 0.002 0.003 0.004 0.005700
800
900
1000
1100
1200
0.015
0.020
0.025
0.030
0.035
0.040
0.045
0.050
0.055
0.060
0.065
T (
K)
r (m)
x
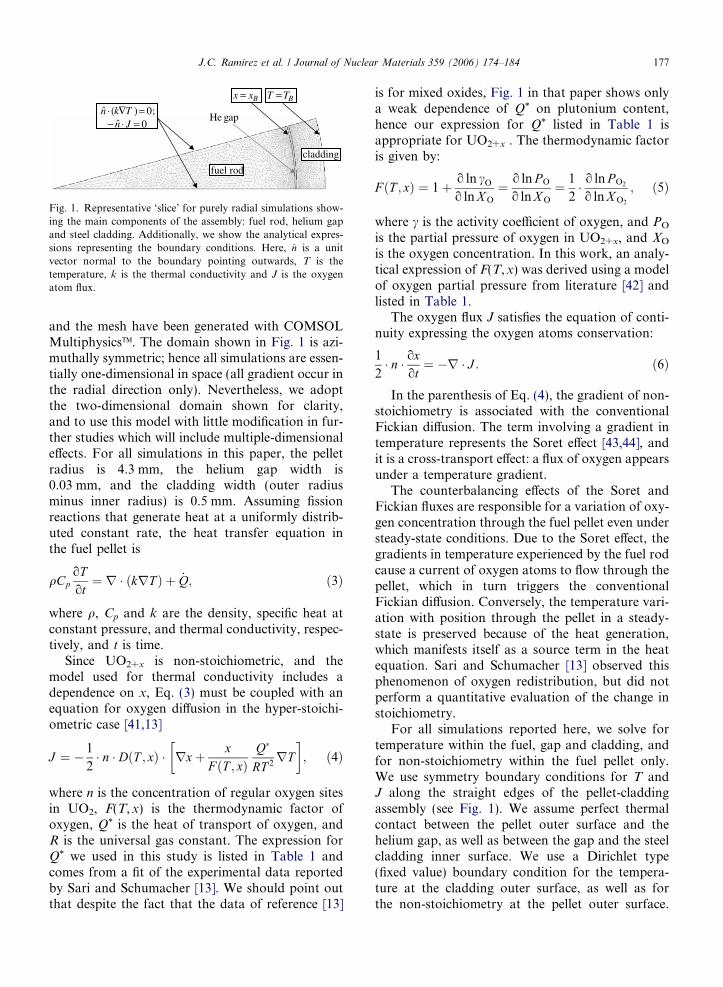
Fig. 2. Steady-state temperature (solid line) and non-stoichiom-etry (dashed line) distribution in radial direction for a UO2 fuelrod.
0.000 0.001 0.002 0.003 0.004 0.005700
800
900
1000
1100
1200
0.020
0.025
0.030
0.035
0.040
0.045
0.050
0.055
0.060
0.065
calculated with k(T,x)
T(K
)
r (m)
calculated with k(T,x=0)
x
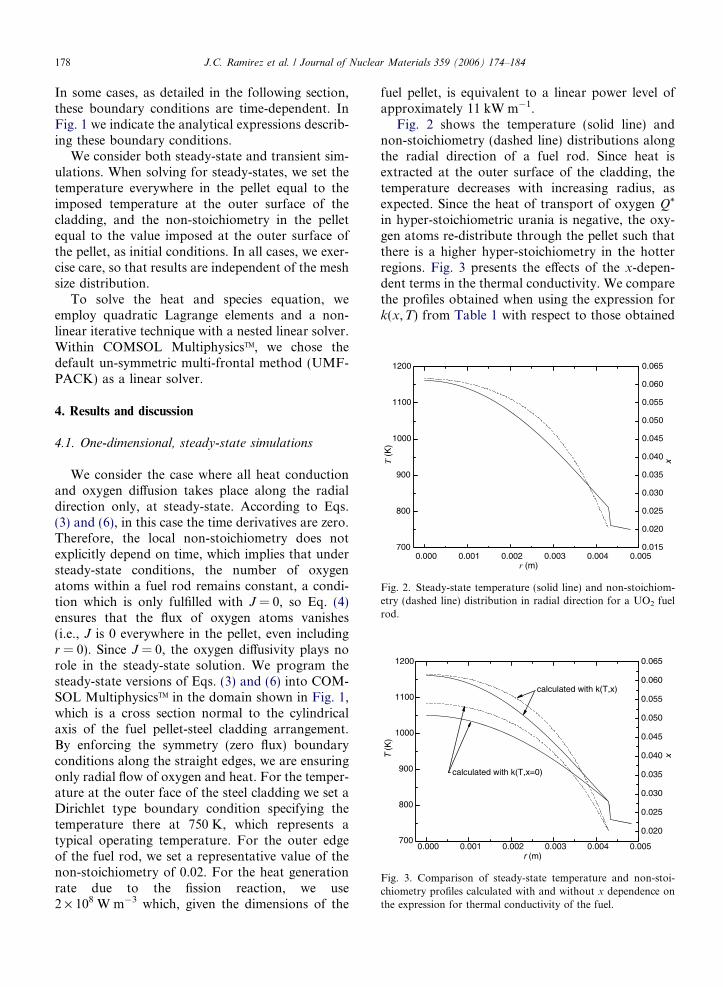
Fig. 3. Comparison of steady-state temperature and non-stoi-chiometry profiles calculated with and without x dependence onthe expression for thermal conductivity of the fuel.
178 J.C. Ramirez et al. / Journal of Nuclear Materials 359 (2006) 174–184
In some cases, as detailed in the following section,these boundary conditions are time-dependent. InFig. 1 we indicate the analytical expressions describ-ing these boundary conditions.
We consider both steady-state and transient sim-ulations. When solving for steady-states, we set thetemperature everywhere in the pellet equal to theimposed temperature at the outer surface of thecladding, and the non-stoichiometry in the pelletequal to the value imposed at the outer surface ofthe pellet, as initial conditions. In all cases, we exer-cise care, so that results are independent of the meshsize distribution.
To solve the heat and species equation, weemploy quadratic Lagrange elements and a non-linear iterative technique with a nested linear solver.Within COMSOL MultiphysicsTM, we chose thedefault un-symmetric multi-frontal method (UMF-PACK) as a linear solver.
4. Results and discussion
4.1. One-dimensional, steady-state simulations
We consider the case where all heat conductionand oxygen diffusion takes place along the radialdirection only, at steady-state. According to Eqs.(3) and (6), in this case the time derivatives are zero.Therefore, the local non-stoichiometry does notexplicitly depend on time, which implies that understeady-state conditions, the number of oxygenatoms within a fuel rod remains constant, a condi-tion which is only fulfilled with J = 0, so Eq. (4)ensures that the flux of oxygen atoms vanishes(i.e., J is 0 everywhere in the pellet, even includingr = 0). Since J = 0, the oxygen diffusivity plays norole in the steady-state solution. We program thesteady-state versions of Eqs. (3) and (6) into COM-SOL MultiphysicsTM in the domain shown in Fig. 1,which is a cross section normal to the cylindricalaxis of the fuel pellet-steel cladding arrangement.By enforcing the symmetry (zero flux) boundaryconditions along the straight edges, we are ensuringonly radial flow of oxygen and heat. For the temper-ature at the outer face of the steel cladding we set aDirichlet type boundary condition specifying thetemperature there at 750 K, which represents atypical operating temperature. For the outer edgeof the fuel rod, we set a representative value of thenon-stoichiometry of 0.02. For the heat generationrate due to the fission reaction, we use2 · 108 W m�3 which, given the dimensions of the
fuel pellet, is equivalent to a linear power level ofapproximately 11 kW m�1.
Fig. 2 shows the temperature (solid line) andnon-stoichiometry (dashed line) distributions alongthe radial direction of a fuel rod. Since heat isextracted at the outer surface of the cladding, thetemperature decreases with increasing radius, asexpected. Since the heat of transport of oxygen Q*
in hyper-stoichiometric urania is negative, the oxy-gen atoms re-distribute through the pellet such thatthere is a higher hyper-stoichiometry in the hotterregions. Fig. 3 presents the effects of the x-depen-dent terms in the thermal conductivity. We comparethe profiles obtained when using the expression fork(x,T) from Table 1 with respect to those obtained
J.C. Ramirez et al. / Journal of Nuclear Materials 359 (2006) 174–184 179
by omitting the effect of non-stoichiometry in thethermal conductivity. To obtain an x-independentexpression for k, we set x = 0 in the expressionfor k(x,T) of Table 1. The expression atan(h)/h !0 as x! 0, so we used this limiting value. Fromthe expression for k(x,T) from Table 1, the thermalconductivity decreases with increasing non-stoichi-ometry. For the same heat flux, according to Fou-rier’s law, a lower thermal conductivity implies ahigher temperature gradient. Since the wall temper-ature is the same, the case where we corrected theconductivity for non-stoichiometry should presenta higher core temperature, as is shown in Fig. 3.We observe that not including the x-dependenceon thermal conductivity in causes an underestima-tion of the temperature of almost 100 K for the con-ditions considered in this particular case. This 100 Kdifference, however, can be greatly affected by theheat generation rate intensity and the boundaryconditions. Fig. 3 also shows that the non-stoichi-ometry near the rod center is underestimated whenthe thermal conductivity is not corrected forx-dependency.
The heat generation rate can vary widely depend-ing on reactor operating conditions. Fig. 4 showsthe temperature at the pellet center, Tmax, as a func-tion of the non-stoichiometry at the outer face ofthe fuel pellet, xB, for several values of _Q. We con-sider the values of the heat generation rate ranging
1E-3 0.01 0.1
800
900
1000
1100
1200
1300
1400
.
Tm
ax
xB
Q =107 W/m3..Q =107 W/m3
.Q =5 107 W/m3
.Q =108 W/m3
..
Q =2 108 W/m3
..
Q =5 107 W/m3
..
Q =3 108 W/m3×
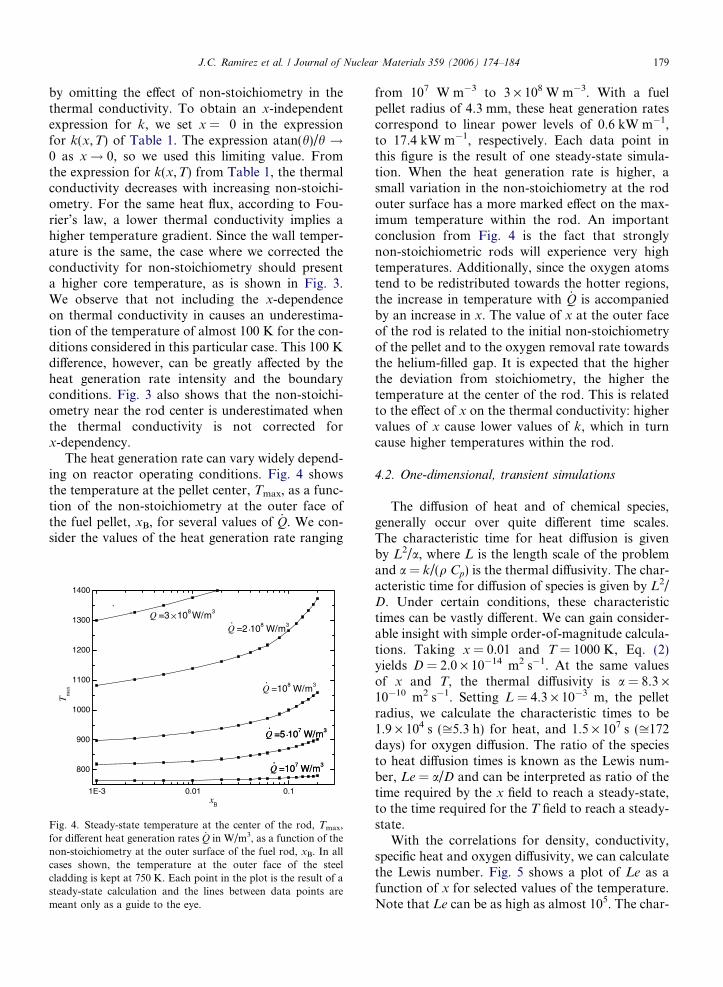
Fig. 4. Steady-state temperature at the center of the rod, Tmax,for different heat generation rates _Q in W/m3, as a function of thenon-stoichiometry at the outer surface of the fuel rod, xB. In allcases shown, the temperature at the outer face of the steelcladding is kept at 750 K. Each point in the plot is the result of asteady-state calculation and the lines between data points aremeant only as a guide to the eye.
from 107 W m�3 to 3 · 108 W m�3. With a fuelpellet radius of 4.3 mm, these heat generation ratescorrespond to linear power levels of 0.6 kW m�1,to 17.4 kW m�1, respectively. Each data point inthis figure is the result of one steady-state simula-tion. When the heat generation rate is higher, asmall variation in the non-stoichiometry at the rodouter surface has a more marked effect on the max-imum temperature within the rod. An importantconclusion from Fig. 4 is the fact that stronglynon-stoichiometric rods will experience very hightemperatures. Additionally, since the oxygen atomstend to be redistributed towards the hotter regions,the increase in temperature with _Q is accompaniedby an increase in x. The value of x at the outer faceof the rod is related to the initial non-stoichiometryof the pellet and to the oxygen removal rate towardsthe helium-filled gap. It is expected that the higherthe deviation from stoichiometry, the higher thetemperature at the center of the rod. This is relatedto the effect of x on the thermal conductivity: highervalues of x cause lower values of k, which in turncause higher temperatures within the rod.
4.2. One-dimensional, transient simulations
The diffusion of heat and of chemical species,generally occur over quite different time scales.The characteristic time for heat diffusion is givenby L2/a, where L is the length scale of the problemand a = k/(q Cp) is the thermal diffusivity. The char-acteristic time for diffusion of species is given by L2/D. Under certain conditions, these characteristictimes can be vastly different. We can gain consider-able insight with simple order-of-magnitude calcula-tions. Taking x = 0.01 and T = 1000 K, Eq. (2)yields D = 2.0 · 10�14 m2 s�1. At the same valuesof x and T, the thermal diffusivity is a = 8.3 ·10�10 m2 s�1. Setting L = 4.3 · 10�3 m, the pelletradius, we calculate the characteristic times to be1.9 · 104 s (ffi5.3 h) for heat, and 1.5 · 107 s (ffi172days) for oxygen diffusion. The ratio of the speciesto heat diffusion times is known as the Lewis num-ber, Le = a/D and can be interpreted as ratio of thetime required by the x field to reach a steady-state,to the time required for the T field to reach a steady-state.
With the correlations for density, conductivity,specific heat and oxygen diffusivity, we can calculatethe Lewis number. Fig. 5 shows a plot of Le as afunction of x for selected values of the temperature.Note that Le can be as high as almost 105. The char-

1E-3 0.01 0.110-1
100
101
102
103
104
105
T = 800 K
T = 1400 K
Le
x
T = 1100 K
Fig. 5. Plot of the Lewis number (Le = a/D), where a is thethermal diffusivity as a function of non-stoichiometry, forselected values of temperature. The Lewis number representsthe ratio of characteristic times for species diffusion time to thatof heat diffusion. For strongly non-stoichiometric fuel pellets atlow temperatures, Le can be up to almost 105, which implies thatchanges in the temperature distribution can occur with negligiblechanges in the non-stoichiometry distribution.
100
101
102
103
104
105
106
107
108
109
0.0
0.5
1.0
1.5
2.0
0
5
10
15
20
25
30
T max
/T0, 1
0-8Q
(W/m
3 )
t (s)
x
0
0
0
= 0.001
x = 0.1
x = 0.01
x0=0.1
x max
/x0
Q.
Fig. 6. Transient response for start-up of reactor from ambientconditions. The initial condition is a uniform non-stoichiometry,x0, and a uniform temperature T0. The heat generation rate isincreased from 0 to 2 · 108 W/m3 in the course of approximately10 min, as shown by the dotted line, while keeping the outer faceof the fuel pellet at x0 and the outer face of the cladding atT0 = 750 K. We show results for three values of x0. The presenceof a quasi-steady-state for the temperature after after t � 5 · 104 swhile x is still varying is a consequence of the large values of theLewis number.
180 J.C. Ramirez et al. / Journal of Nuclear Materials 359 (2006) 174–184
acteristic times of heat and oxygen diffusion are use-ful in estimating how long the reactor will take toadjust to a change in operating conditions, or todetermine how long the reactor will take to achievea steady-state after initial startup. Fig. 5 shows thatfor x > 0.05, the Lewis number becomes practicallyindependent of x, especially at low temperatures.For strongly non-stoichiometric fuel pellets at lowtemperatures, Le can be up to almost 105, whichimplies that changes in the temperature distributioncan occur with negligible changes in the non-stoichi-ometry distribution. Conversely, for almost stoichi-ometric pellets (x < 0.001) at sufficiently hightemperatures, Le can be smaller than 1, thus indicat-ing that oxygen atoms diffuse faster than heat. Thisdisparity in the characteristic diffusion times playsan important role in the transient behavior of thefuel under sudden changes in the operating condi-tions. We examine in more detail this transientbehavior in the following.
4.2.1. Start-up of reactors
We examine the transient behavior of the temper-ature and non-stoichiometry distributions when thereactor is started from ambient conditions. Weassume that the pellet possesses a spatially uniformx distribution, x = x0 and the temperature isT0 = 750 K everywhere. At time t = 0, the heat gen-eration rate starts to vary from an initial value
_Q0 ¼ 0 W m�3, and quickly (within 10 min) reachesa value of _Qmax ¼ 2� 108 W m�3, according to
_Q tð Þ ¼ _Q0 þ_Qmax � _Q0
1þ 10 � exp � �10þ t=sð Þ½ � ; ð7Þ
where s = 45 s is a time constant. We should pointout that Eq. (7) is not an attempt to accurately mod-el the dynamics of the nuclear reaction, but must beinterpreted simply as an ad-hoc model of a quicklyvarying power source, convenient for the purposesof this study.
We examined three cases: weak, moderate, andstrong non-stoichiometry corresponding to x0 =0.001, 0.01, and 0.1, respectively, and the resultsare shown in Fig. 6. The solid lines are the ratioof the temperature at the center of the pellet, Tmax
to the initial uniform temperature T0. A quasi-steady temperature is reached and maintained aftert � 5 · 104 s (14 h), regardless of the value of x0.Although there are some temperature variationsbeyond this point, these are insignificant. The ratiox/x0 at the center is shown in dashed lines. Notethat the weaker the non-stoichiometry, the largestthe variation in the non-stoichiometry profile withrespect to the initial condition. For instance, theweakly non-stoichiometric pellet (x0 = 0.001)attains a value of x at the pellet center almost 30
J.C. Ramirez et al. / Journal of Nuclear Materials 359 (2006) 174–184 181
times larger than x0. On the other hand, the stronglynon-stoichiometric pellet sees an increase of only11% (almost non-appreciable in Fig. 6) in the non-stoichiometry at r = 0. These changes in the non-stoichiometry at the center become significant afterabout t � 107 s, or about 115 days. The non-stoichi-ometry distribution does not reach a true steady-state until t � 108 s, or a little over 3 years. This isexpected given our previous discussion on the Lewisnumber and its physical significance. With theseextremely long characteristic times for oxygen diffu-sion it is not uncommon to neglect the effects ofoxygen redistribution on the temperature profile.
4.2.2. Time-dependent heat generation rate
We consider now the behavior of the pellet whensubjected to a change in the heat generation rateintensity. As initial condition, we use the x and T
distributions obtained from a steady-state simula-tion in which the steel cladding had a surface tem-perature of 750 K and the outer face of the fuelrod has a non-stoichiometry of 0.001. The simula-tion started with the steady-state situation and theheat generation rate is _Q ¼ 107 W m�3. Then _Qwas increased up to 2 · 108 W m�3over the courseof about 10 min according to Eq. (7), with _Q0 ¼107 W m�3 as the heat generation rate at the begin-ning of the transition, _Qmax ¼ 2� 108 W m�3 as thenew heat generation rate and s = 45 s. Fig. 7 showsthat this change corresponds to going along thex = 0.001 vertical from the _Q ¼ 107 W m�3 curveto the _Q ¼ 2� 108 W m�3 curve.
10-1 100 101 102 103 104 10700
750
800
850
900
950
1000
1050
1100
Tmax
Tm
ax (
K)
t (s)
.Q
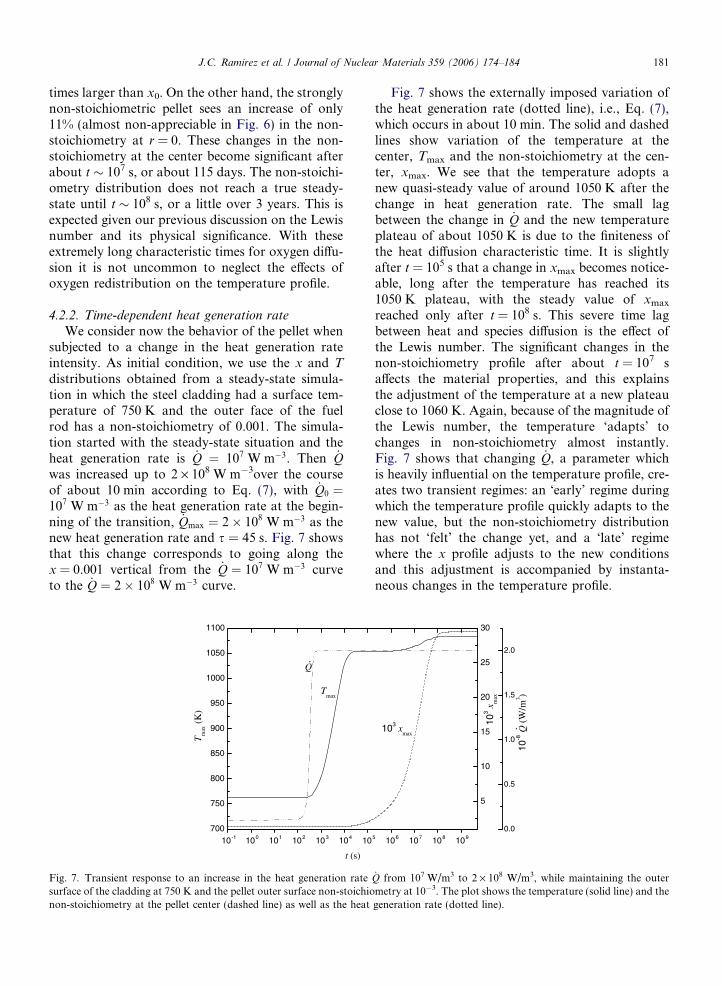
Fig. 7. Transient response to an increase in the heat generation ratesurface of the cladding at 750 K and the pellet outer surface non-stoichionon-stoichiometry at the pellet center (dashed line) as well as the heat
Fig. 7 shows the externally imposed variation ofthe heat generation rate (dotted line), i.e., Eq. (7),which occurs in about 10 min. The solid and dashedlines show variation of the temperature at thecenter, Tmax and the non-stoichiometry at the cen-ter, xmax. We see that the temperature adopts anew quasi-steady value of around 1050 K after thechange in heat generation rate. The small lagbetween the change in _Q and the new temperatureplateau of about 1050 K is due to the finiteness ofthe heat diffusion characteristic time. It is slightlyafter t = 105 s that a change in xmax becomes notice-able, long after the temperature has reached its1050 K plateau, with the steady value of xmax
reached only after t = 108 s. This severe time lagbetween heat and species diffusion is the effect ofthe Lewis number. The significant changes in thenon-stoichiometry profile after about t = 107 saffects the material properties, and this explainsthe adjustment of the temperature at a new plateauclose to 1060 K. Again, because of the magnitude ofthe Lewis number, the temperature ‘adapts’ tochanges in non-stoichiometry almost instantly.Fig. 7 shows that changing _Q, a parameter whichis heavily influential on the temperature profile, cre-ates two transient regimes: an ‘early’ regime duringwhich the temperature profile quickly adapts to thenew value, but the non-stoichiometry distributionhas not ‘felt’ the change yet, and a ‘late’ regimewhere the x profile adjusts to the new conditionsand this adjustment is accompanied by instanta-neous changes in the temperature profile.
5 106 107 108 109
0.0
0.5
1.0
1.5
2.0
5
10
15
20
25
30
10-8
Q(W
/m3 )
.103 xmax
103
x max
_Q from 107 W/m3 to 2 · 108 W/m3, while maintaining the outermetry at 10�3. The plot shows the temperature (solid line) and thegeneration rate (dotted line).
0.000 0.001 0.002 0.003 0.0040.000
0.005
0.010
0.015
0.020
0.025
0.030
t =100 s
t =105 s
t =106 s
t =107 s
x
r (m)
t =108 s
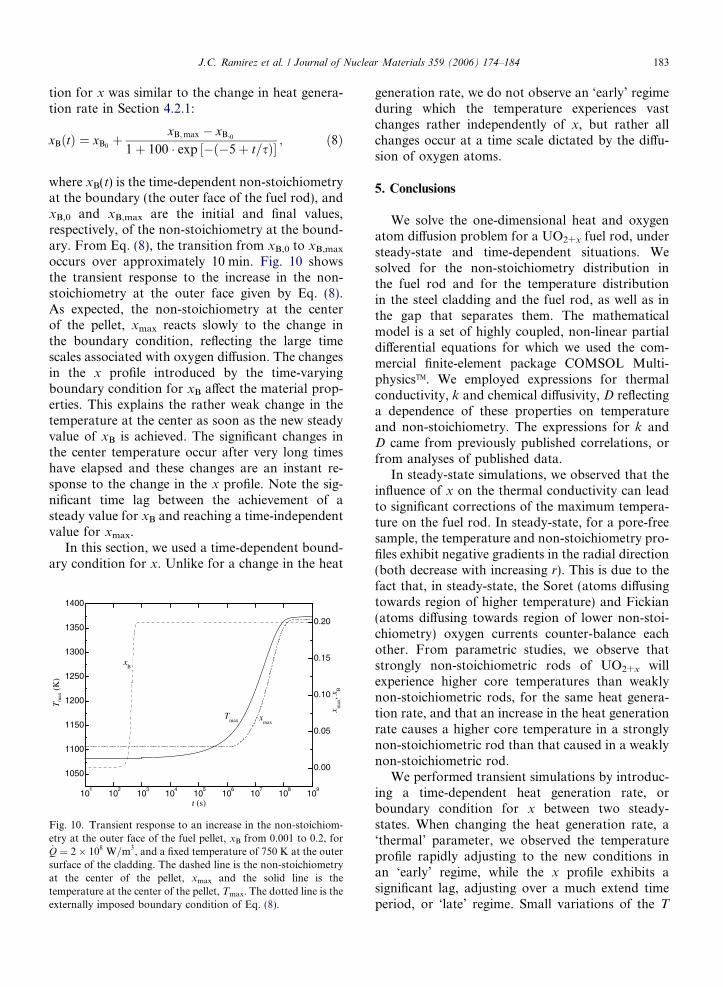
Fig. 9. Profiles of non-stoichiometry at selected times during thechange of heat generation rate, _Q from 107 W/m3 to 2 · 108 W/m3. We maintained the outer surface of the cladding at 750 K andthe pellet outer surface non-stoichiometry at 10�3. At some timesduring transient behavior (e.g., t = 105 s and 106 s), we observe apositive x gradient near the surface of the pellet.
182 J.C. Ramirez et al. / Journal of Nuclear Materials 359 (2006) 174–184
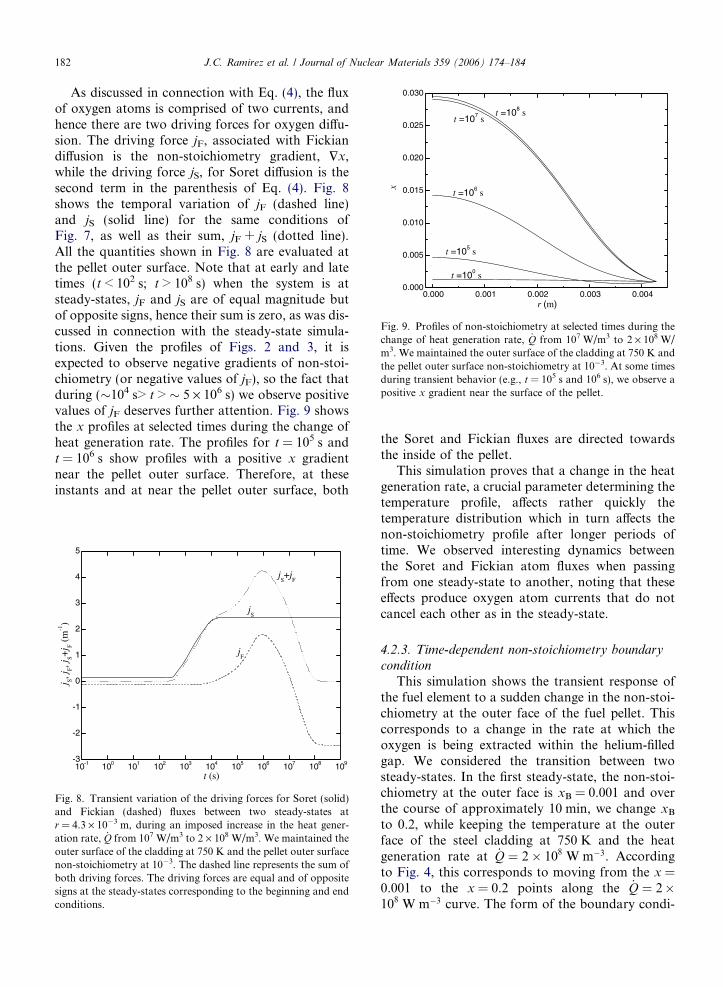
As discussed in connection with Eq. (4), the fluxof oxygen atoms is comprised of two currents, andhence there are two driving forces for oxygen diffu-sion. The driving force jF, associated with Fickiandiffusion is the non-stoichiometry gradient, $x,while the driving force jS, for Soret diffusion is thesecond term in the parenthesis of Eq. (4). Fig. 8shows the temporal variation of jF (dashed line)and jS (solid line) for the same conditions ofFig. 7, as well as their sum, jF + jS (dotted line).All the quantities shown in Fig. 8 are evaluated atthe pellet outer surface. Note that at early and latetimes (t < 102 s; t > 108 s) when the system is atsteady-states, jF and jS are of equal magnitude butof opposite signs, hence their sum is zero, as was dis-cussed in connection with the steady-state simula-tions. Given the profiles of Figs. 2 and 3, it isexpected to observe negative gradients of non-stoi-chiometry (or negative values of jF), so the fact thatduring (�104 s> t > � 5 · 106 s) we observe positivevalues of jF deserves further attention. Fig. 9 showsthe x profiles at selected times during the change ofheat generation rate. The profiles for t = 105 s andt = 106 s show profiles with a positive x gradientnear the pellet outer surface. Therefore, at theseinstants and at near the pellet outer surface, both
10-1 100 101 102 103 104 105 106 107 108 109-3
-2
-1
0
1
2
3
4
5
jS+j
F
jF
jS
j S,jF,j
S+j F (
m-1)
t (s)
Fig. 8. Transient variation of the driving forces for Soret (solid)and Fickian (dashed) fluxes between two steady-states atr = 4.3 · 10�3 m, during an imposed increase in the heat gener-ation rate, _Q from 107 W/m3 to 2 · 108 W/m3. We maintained theouter surface of the cladding at 750 K and the pellet outer surfacenon-stoichiometry at 10�3. The dashed line represents the sum ofboth driving forces. The driving forces are equal and of oppositesigns at the steady-states corresponding to the beginning and endconditions.
the Soret and Fickian fluxes are directed towardsthe inside of the pellet.
This simulation proves that a change in the heatgeneration rate, a crucial parameter determining thetemperature profile, affects rather quickly thetemperature distribution which in turn affects thenon-stoichiometry profile after longer periods oftime. We observed interesting dynamics betweenthe Soret and Fickian atom fluxes when passingfrom one steady-state to another, noting that theseeffects produce oxygen atom currents that do notcancel each other as in the steady-state.
4.2.3. Time-dependent non-stoichiometry boundarycondition
This simulation shows the transient response ofthe fuel element to a sudden change in the non-stoi-chiometry at the outer face of the fuel pellet. Thiscorresponds to a change in the rate at which theoxygen is being extracted within the helium-filledgap. We considered the transition between twosteady-states. In the first steady-state, the non-stoi-chiometry at the outer face is xB = 0.001 and overthe course of approximately 10 min, we change xB
to 0.2, while keeping the temperature at the outerface of the steel cladding at 750 K and the heatgeneration rate at _Q ¼ 2� 108 W m�3. Accordingto Fig. 4, this corresponds to moving from the x =0.001 to the x = 0.2 points along the _Q ¼ 2�108 W m�3 curve. The form of the boundary condi-
J.C. Ramirez et al. / Journal of Nuclear Materials 359 (2006) 174–184 183
tion for x was similar to the change in heat genera-tion rate in Section 4.2.1:
xBðtÞ ¼ xB0þ xB;max � xB;0
1þ 100 � exp � �5þ t=sð Þ½ � ; ð8Þ
where xB(t) is the time-dependent non-stoichiometryat the boundary (the outer face of the fuel rod), andxB,0 and xB,max are the initial and final values,respectively, of the non-stoichiometry at the bound-ary. From Eq. (8), the transition from xB,0 to xB,max
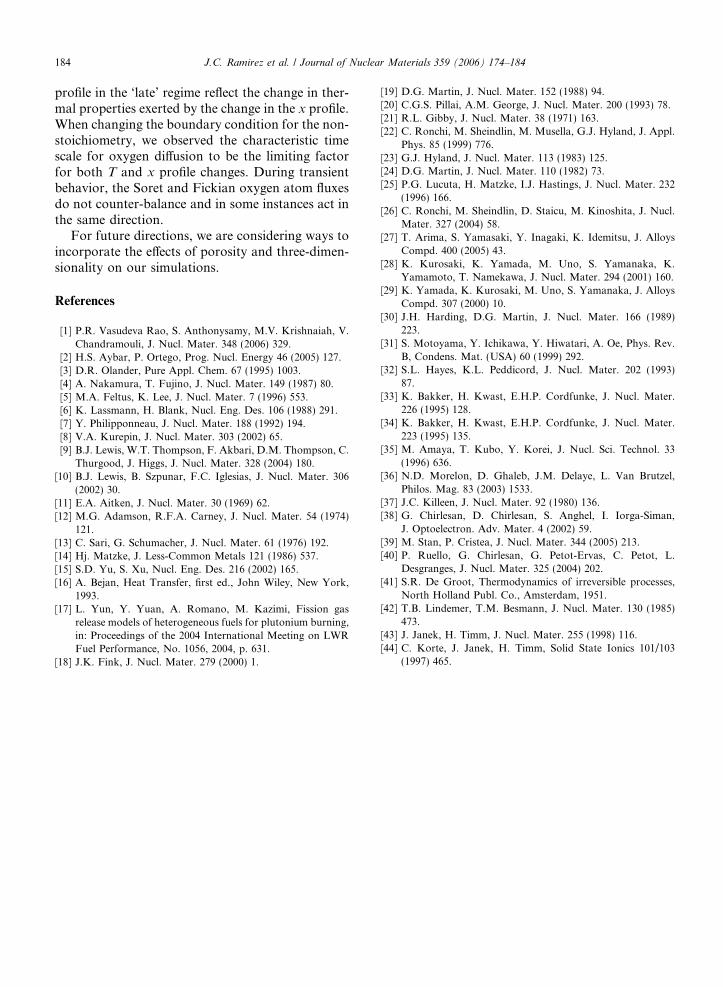
occurs over approximately 10 min. Fig. 10 showsthe transient response to the increase in the non-stoichiometry at the outer face given by Eq. (8).As expected, the non-stoichiometry at the centerof the pellet, xmax reacts slowly to the change inthe boundary condition, reflecting the large timescales associated with oxygen diffusion. The changesin the x profile introduced by the time-varyingboundary condition for xB affect the material prop-erties. This explains the rather weak change in thetemperature at the center as soon as the new steadyvalue of xB is achieved. The significant changes inthe center temperature occur after very long timeshave elapsed and these changes are an instant re-sponse to the change in the x profile. Note the sig-nificant time lag between the achievement of asteady value for xB and reaching a time-independentvalue for xmax.
In this section, we used a time-dependent bound-ary condition for x. Unlike for a change in the heat
101
102
103
104
105
106
107
108
109
1050
1100
1150
1200
1250
1300
1350
1400
0.00
0.05
0.10
0.15
0.20
Tm
ax (
K)
t (s)
xB
xmax
Tmax
x max
,xB
Fig. 10. Transient response to an increase in the non-stoichiom-etry at the outer face of the fuel pellet, xB from 0.001 to 0.2, for_Q ¼ 2� 108 W=m3, and a fixed temperature of 750 K at the outersurface of the cladding. The dashed line is the non-stoichiometryat the center of the pellet, xmax and the solid line is thetemperature at the center of the pellet, Tmax. The dotted line is theexternally imposed boundary condition of Eq. (8).
generation rate, we do not observe an ‘early’ regimeduring which the temperature experiences vastchanges rather independently of x, but rather allchanges occur at a time scale dictated by the diffu-sion of oxygen atoms.
5. Conclusions
We solve the one-dimensional heat and oxygenatom diffusion problem for a UO2+x fuel rod, understeady-state and time-dependent situations. Wesolved for the non-stoichiometry distribution inthe fuel rod and for the temperature distributionin the steel cladding and the fuel rod, as well as inthe gap that separates them. The mathematicalmodel is a set of highly coupled, non-linear partialdifferential equations for which we used the com-mercial finite-element package COMSOL Multi-physicsTM. We employed expressions for thermalconductivity, k and chemical diffusivity, D reflectinga dependence of these properties on temperatureand non-stoichiometry. The expressions for k andD came from previously published correlations, orfrom analyses of published data.
In steady-state simulations, we observed that theinfluence of x on the thermal conductivity can leadto significant corrections of the maximum tempera-ture on the fuel rod. In steady-state, for a pore-freesample, the temperature and non-stoichiometry pro-files exhibit negative gradients in the radial direction(both decrease with increasing r). This is due to thefact that, in steady-state, the Soret (atoms diffusingtowards region of higher temperature) and Fickian(atoms diffusing towards region of lower non-stoi-chiometry) oxygen currents counter-balance eachother. From parametric studies, we observe thatstrongly non-stoichiometric rods of UO2+x willexperience higher core temperatures than weaklynon-stoichiometric rods, for the same heat genera-tion rate, and that an increase in the heat generationrate causes a higher core temperature in a stronglynon-stoichiometric rod than that caused in a weaklynon-stoichiometric rod.
We performed transient simulations by introduc-ing a time-dependent heat generation rate, orboundary condition for x between two steady-states. When changing the heat generation rate, a‘thermal’ parameter, we observed the temperatureprofile rapidly adjusting to the new conditions inan ‘early’ regime, while the x profile exhibits asignificant lag, adjusting over a much extend timeperiod, or ‘late’ regime. Small variations of the T
184 J.C. Ramirez et al. / Journal of Nuclear Materials 359 (2006) 174–184
profile in the ‘late’ regime reflect the change in ther-mal properties exerted by the change in the x profile.When changing the boundary condition for the non-stoichiometry, we observed the characteristic timescale for oxygen diffusion to be the limiting factorfor both T and x profile changes. During transientbehavior, the Soret and Fickian oxygen atom fluxesdo not counter-balance and in some instances act inthe same direction.
For future directions, we are considering ways toincorporate the effects of porosity and three-dimen-sionality on our simulations.
References
[1] P.R. Vasudeva Rao, S. Anthonysamy, M.V. Krishnaiah, V.Chandramouli, J. Nucl. Mater. 348 (2006) 329.
[2] H.S. Aybar, P. Ortego, Prog. Nucl. Energy 46 (2005) 127.[3] D.R. Olander, Pure Appl. Chem. 67 (1995) 1003.[4] A. Nakamura, T. Fujino, J. Nucl. Mater. 149 (1987) 80.[5] M.A. Feltus, K. Lee, J. Nucl. Mater. 7 (1996) 553.[6] K. Lassmann, H. Blank, Nucl. Eng. Des. 106 (1988) 291.[7] Y. Philipponneau, J. Nucl. Mater. 188 (1992) 194.[8] V.A. Kurepin, J. Nucl. Mater. 303 (2002) 65.[9] B.J. Lewis, W.T. Thompson, F. Akbari, D.M. Thompson, C.
Thurgood, J. Higgs, J. Nucl. Mater. 328 (2004) 180.[10] B.J. Lewis, B. Szpunar, F.C. Iglesias, J. Nucl. Mater. 306
(2002) 30.[11] E.A. Aitken, J. Nucl. Mater. 30 (1969) 62.[12] M.G. Adamson, R.F.A. Carney, J. Nucl. Mater. 54 (1974)
121.[13] C. Sari, G. Schumacher, J. Nucl. Mater. 61 (1976) 192.[14] Hj. Matzke, J. Less-Common Metals 121 (1986) 537.[15] S.D. Yu, S. Xu, Nucl. Eng. Des. 216 (2002) 165.[16] A. Bejan, Heat Transfer, first ed., John Wiley, New York,
1993.[17] L. Yun, Y. Yuan, A. Romano, M. Kazimi, Fission gas
release models of heterogeneous fuels for plutonium burning,in: Proceedings of the 2004 International Meeting on LWRFuel Performance, No. 1056, 2004, p. 631.
[18] J.K. Fink, J. Nucl. Mater. 279 (2000) 1.
[19] D.G. Martin, J. Nucl. Mater. 152 (1988) 94.[20] C.G.S. Pillai, A.M. George, J. Nucl. Mater. 200 (1993) 78.[21] R.L. Gibby, J. Nucl. Mater. 38 (1971) 163.[22] C. Ronchi, M. Sheindlin, M. Musella, G.J. Hyland, J. Appl.
Phys. 85 (1999) 776.[23] G.J. Hyland, J. Nucl. Mater. 113 (1983) 125.[24] D.G. Martin, J. Nucl. Mater. 110 (1982) 73.[25] P.G. Lucuta, H. Matzke, I.J. Hastings, J. Nucl. Mater. 232
(1996) 166.[26] C. Ronchi, M. Sheindlin, D. Staicu, M. Kinoshita, J. Nucl.
Mater. 327 (2004) 58.[27] T. Arima, S. Yamasaki, Y. Inagaki, K. Idemitsu, J. Alloys
Compd. 400 (2005) 43.[28] K. Kurosaki, K. Yamada, M. Uno, S. Yamanaka, K.
Yamamoto, T. Namekawa, J. Nucl. Mater. 294 (2001) 160.[29] K. Yamada, K. Kurosaki, M. Uno, S. Yamanaka, J. Alloys
Compd. 307 (2000) 10.[30] J.H. Harding, D.G. Martin, J. Nucl. Mater. 166 (1989)
223.[31] S. Motoyama, Y. Ichikawa, Y. Hiwatari, A. Oe, Phys. Rev.
B, Condens. Mat. (USA) 60 (1999) 292.[32] S.L. Hayes, K.L. Peddicord, J. Nucl. Mater. 202 (1993)
87.[33] K. Bakker, H. Kwast, E.H.P. Cordfunke, J. Nucl. Mater.
226 (1995) 128.[34] K. Bakker, H. Kwast, E.H.P. Cordfunke, J. Nucl. Mater.
223 (1995) 135.[35] M. Amaya, T. Kubo, Y. Korei, J. Nucl. Sci. Technol. 33
(1996) 636.[36] N.D. Morelon, D. Ghaleb, J.M. Delaye, L. Van Brutzel,
Philos. Mag. 83 (2003) 1533.[37] J.C. Killeen, J. Nucl. Mater. 92 (1980) 136.[38] G. Chirlesan, D. Chirlesan, S. Anghel, I. Iorga-Siman,
J. Optoelectron. Adv. Mater. 4 (2002) 59.[39] M. Stan, P. Cristea, J. Nucl. Mater. 344 (2005) 213.[40] P. Ruello, G. Chirlesan, G. Petot-Ervas, C. Petot, L.
Desgranges, J. Nucl. Mater. 325 (2004) 202.[41] S.R. De Groot, Thermodynamics of irreversible processes,
North Holland Publ. Co., Amsterdam, 1951.[42] T.B. Lindemer, T.M. Besmann, J. Nucl. Mater. 130 (1985)
473.[43] J. Janek, H. Timm, J. Nucl. Mater. 255 (1998) 116.[44] C. Korte, J. Janek, H. Timm, Solid State Ionics 101/103
(1997) 465.