Embed Size (px)
Citation preview

Simulation techniques for design of overhead conductor rail lines for speeds over 140 km/h J.A. Chover, B. Suarez andP. Rodríguez
In overhead conductor rail lines, aluminium beams are usually mounted with support spacing between 8 and 12 meters, to limit the máximum vertical deflection in the center of the span. This small support spacing limits the use of overhead conductor rail to tunnels, therefore it has been used almost exclusively in metropolitan networks, with operation speeds below 110 km/h. Nevertheless, due to the lower cost of maintenance required for this electrification system, some railway administrations are beginning to install it in some tunnels on long-distance lines, requesting higher operation speeds [1]. Some examples are the Barcelona and Madrid suburban networks (Spain), and recent lines in Turkey and Malaysia. In order to adapt the design of the overhead conductor for higher speeds (V > 160 km/h), particular attention must be paid to the geometry of the conductor rail in critical zones as overlaps, crossings and, especially, transitions between conductor rail and conventional catenary, since the use of overhead conductor rail is limited to tunnels, as already mentioned. This paper describes simulation techniques developed in order to take into account these critical zones. Furthermore, some specific simulations results are presented that have been used to analyze and optimizes the geometry of this special zones to get a better current collection quality, in a real suburban network. This paper presents the work undertaken by the Railways Technology Research Centre (CITEF), having over 10 years of experience in railways research [1-4].

SIMULATION TECHNIQUES FOR DESIGN OF OVERHEAD CONDUCTOR RAIL LINES FOR
SPEEDS OVER 140 KM/H José A. Chover, Berta Suarez and Pablo Rodríguez Research Centre on Railway Technologies (CITEF)
Universidad Politécnica de Madrid C/José Gutiérrez Abascal, n° 2, 28006,
Madrid, SPAIN e-mail:[email protected]
1. INTRODUCTION In overhead conductor rail lines, aluminium beams are usually mounted with support spacing
between 8 and 12 meters, to limit the máximum vertical deflection in the center of the span. This small support spacing limits the use of overhead conductor rail to tunnels, therefore it has been used almost exclusively in metropolitan networks, with operation speeds below 110 km/h
Nevertheless, due to the lower cost of maintenance required for this electrification system, some railway administrations are beginning to install it in some tunnels on long-distance lines, requesting higher operation speeds [1]. Some examples are the Barcelona and Madrid suburban networks (Spain), and recent lines in Turkey and Malaysia.
In order to adapt the design of the overhead conductor for higher speeds (V > 160 km/h), particular attention must be paid to the geometry of the conductor rail in critical zones as overlaps, crossings and, especially, transitions between conductor rail and conventional catenary, since the use of overhead conductor rail is limited to tunnels, as already mentioned.
This paper describes simulation techniques developed in order to take into account these critical zones. Furthermore, some specific simulations results are presented that have been used to analyze and optimizes the geometry of this special zones to get a better current collection quality, in a real suburban network. This paper presents the work undertaken by the Railways Technology Research Centre (CITEF), having over 10 years of experience in railways research [1-4].
2. MODELING CHARACTERISTICS Simulation models were defined combining finite element calculation and multibody systems
dynamic simulation techniques. As explained in [1], for every model, the modelization process mainly consists on:
• First of all, a finite element model of every section of catenary is made using ANSYS software, taking into account the material elastic properties, geometry, etc. During this step, the stiffness matrix, nodes position, and frequency modes are obtained for every stretch
• With this information and using the correct software tool, the matrices are introduced into a multibody simulation software SIMPACK model. In this multibody model, different bodies represent the different sections or stretch of catenary and the displacements of every node are solved by modal superposition of the frequency modes of the corresponding section.
• Finally, the model of the pantograph is added to the main model and the contact elements are created between the catenary and the pantograph.
Some specific characteristics of the modeling process are described in the next paragraphs.
2.1. Overhead conductor rail
For the whole simulations carried out, the overhead conductor rail cross section has been the standard one (110 mm height). The contact wire cross section has an área of 150 mm2.
In the finite elements model, mainly three kind of elements have been considered:
• Conductor rail and contact wire: The conductor rail grips the contact wire with such forcé that all the forces are shared between both, which means that the wire contributes with its entire section to the rigidity of the set. This set has been modelled as a single body, for which the geometric properties (área, centroid, geometric moments) associated with an equivalent aluminium section, have been calculated.

• Conductor rail, contact wire and bridle: The geometric parameters for these sections are determined by adding the previous parameters to the ones for the bridle connector.
• Elastic supports: modelized as a vertical stiffness.
The specific modeling characteristics for the singular zones are explained in the next paragraphs:
a) Overlapping geometry For the simulations made in this work, an overhead conductor rail model was used considering
two straight sections. A section contains a nominal support spacing zone, a parameterized support spacing zone near the overlap, and a overlapping span. The next figure shows a section containing one staggering wave in the nominal spacing zone.
parameterised support spacing Nominal support spacing
overlapping span parametensea support spacing
Figure 1
The overlapping geometry can be seen in the next figure and it was simulated according to the project design. It has a length of 2 m.
Figure 2: Plant and lateral views ofthe overlapping span
In particular, in the overlapping zone, support spacing and radius of curvature of the conductor rail in the vertical plañe were optimized, in order to prevent contact losses between pantograph and contact wire, so ensuring a good current collection quality. For this purpose, distances Ll, L2 and L3 (figure 3) have been parameterized in order to find and óptima! geometry.
Overlap geometry
Figure 3: Overlapping zone geometry
b) Crossings geometry In the case of the crossing model, an overhead conductor rail model was created considering four
stretches. as can be observed in the next figure. In the overlaps between the stretches the same modeling techniques have been used as in the overlapping zones, taking into account the specific geometry of the crossing.

Straight track 1
Diverging track 1
Diverging track 2
Straight track 2
Figure 4: Crossing geometry outline
For the dynamic simulations carried out with this model, specific crossing data have been used, being the aim of the study, the analysis of the current collection quality for same circulation speeds
c) Transition modeling The transition model has two straight sections too. The first section considers the overhead
conductor rail with the a nominal spacing between supports. The second one, contains a transition piece (variable elasticity) and some conventional catenary spans.
Overtiead conductor rail T . \ Conventional catenary — Transición pjece
Figure 5: transition between overhead conductor rail and conventional catenary
Regarding the transition model, the next steps and simplifications have been considered:
• For this model staggering is not included. (2D model)
• The transition piece and the conventional catenary have been modeled using beam elements with variable section properties.
• A longitudinal forcé has been applied at the end of the stretch in order to consider the correct geometric stiffness of the conventional catenary stretch.
2.2. Pantographs modeling
Three pantographs types have been considered: metropolitan, suburban and high-speed. The modeling process is different for every model depending on the data. In some cases, a three lumped mass model has been used and in other cases a 3D model has been created starting from the components of the pantograph, as can be observed in the next figure.
The 3D model have 4 degree of freedom, including the roll and pitch of the pantograph head.
"U-—
Figure 6: Two pantograph models: a)3D model, b) equivalent three lumped mass model

2.3. Pantograph-catenary interaction
Finally the overhead conductor rail modeled in ANSYS, are exported into the pantograph model in SIMPACK. Afierwards, contact elements between pantograph and conductor rail have been created.
3. CRITERIA FOR ASSESSING CURRENT COLLECTION QUALITY
European railway administrations agreed to assess current collection quality by statistically processing the contact forcé between the catenary and the pantograph [5] and [6], while taking the following parameters into account:
Mean valué of the contact forcé, Fm; Standard deviation of the contact forcé, a; Statistical minimum, (Fm - 3 a); Statistical máximum, (Fm + 3 a), which must not exceed a certain safety limit; Number of contact losses lasting more than 0.01 s; Total accumulated contact loss time.
Therefore, the main parameter used to assess current collection quality in this work is pantograph-catenary contact forcé.
4. RESULTS AT OVERLAPS Three pantographs types were considered: metropolitan, suburban and high-speed. As the worst
results were obtained for the suburban pantograph (see figure 7, red curve), this pantograph model was chosen to optimize the conductor rail geometry.
300n
_. . — — ¿0*J-
y i ra-£ 1 5 < H
3 1 u t >
S ^
" •
™-
»
)
IfWVW "V\.-'' **
rJ 3
'.".."V-
1
' V "o -:W%' VMrlr'
t I 3 IQ 11 ¡0
n YvV v-V-V'
2i
rWl í''/"' 'j
io
Suburban Pantograph
i [m]
Figure 7: Contact forcé for different pantograph models
With the chosen pantograph, several simulation were performed modifying the overlap geometry. From the simulation results an optimal simulation was found, this being finally used in a real suburban network, with proven satisfactory behavior. As an example, table 1 compares two of the different overlapping geometries analyzed, A and B.
Overlapping geometry A B
* Cmean \_^ J
115 115.25
" ^Standard deviation [N]
22.7 27.25
Fcmax [N] 183.1 197
Fcmm [N] 46.9 33.5
Table 1: Contact forcé results for two different overlap geometries
For the best solution, several simulations were performed withboth 10 and 8 m nominal support spacing, for speeds up to 100 km/h and over 120 km/h respectively. Figure 3 shows the contact forcé obtained for 10 m support spacing.
start/end S1 start/end S2 supports S1 supports S2
100 150 s [m]
Figure 8: Total contact forcé in both sections considering the overlap zone

Table 2 shows the results obtained for other higher speeds, and 10 m supports spacing.
Speed [km/h] 100 120 140
Overlap geometry A A A
r cmean L-̂ J 115 115
115.7
-^^ Standard deviation [N] |
22.7 20.8
27.05
Table 2: Contad forcé results at different speeds and 10 m supports spacing
Table 3 contains the results obtained 8 m supports spacing and for the best overlapping geometry found, A.
Speed [km/h] 100 120 140
Overlap geometry A A A
* Cmean |_^ J
115.7 115.7
" ^ Standard deviation [N] |
21.19 27.05
Table 3: Contad forcé results at different speeds and 8 m supports spacing
Inboth cases, valúes are lower than limits proposed by the standards used as criteria.
5. RESULTS AT CROSSINGS Apart from overlap sections, different geometries of crossings were also considered in this study.
As an example, figure 9 and 10 shows the results obtained of an specific crossing simulated using real data.
This graphs correspond to a simulation with the suburban pantograph, at 60 km/h circulating by the diverging track and circulating by the straight track at 100 km/h in the inverse direction.
straigth track
diverging trackj^
Figure 9: Contad forcé running through the diverging track at 60 km/h and dired direction ORQ-, i i i i i i straigth track
£. 200- —k— I diverging track2
s[m]
Figure 10: Contad forcé running through the straight track at 100 km/h and inverse direction
The standard deviation valúes for every track and direction are presented in the next table. The valúes for every scenery are below the limits, in correspondence with the standards.
Speed [km/h] 100 100 60 60
Track Straight Straight
Diverging Diverging
Direction Direct
Inverse Direct
Inverse
-F C Standard deviation [N] |
38.4 34.2 16.6 16.6
Table 4: Contad forcé results at crossing
6. RESULTS AT TRANSITIONS Also simulations including transitions between overhead conductor rail and conventional
catenary have been made. In this example, several simulations with a real transition were made in order to
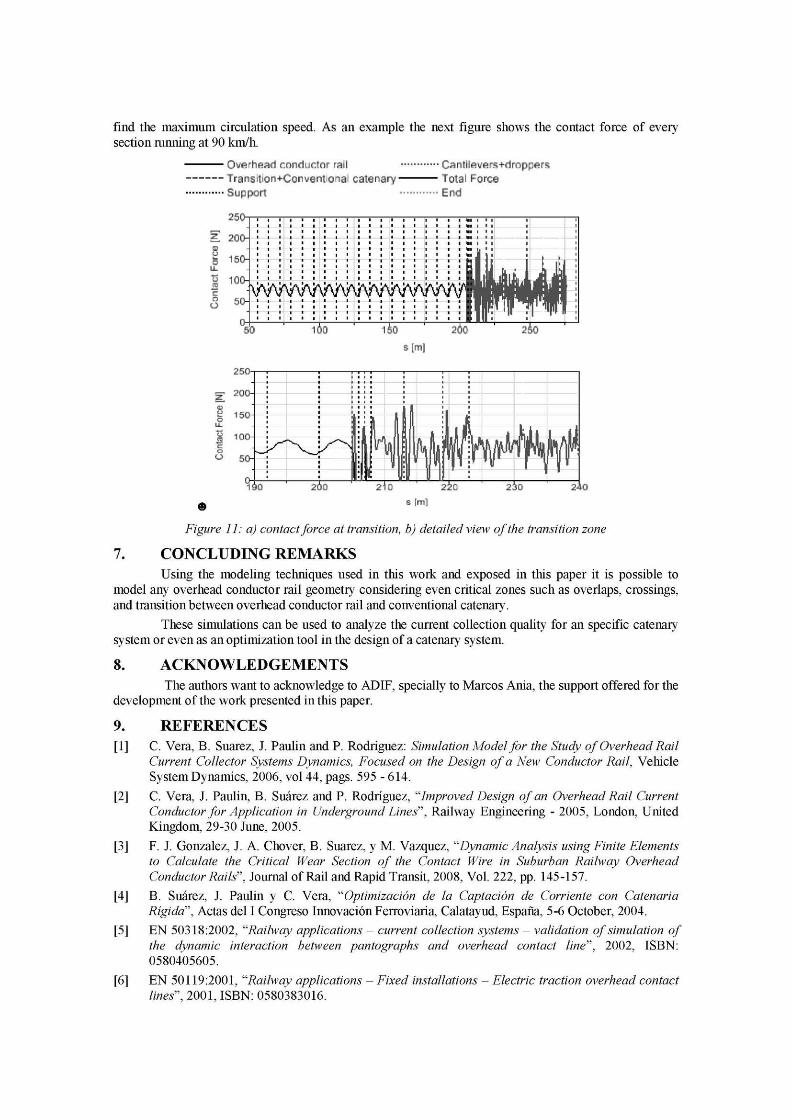
find the máximum circulation speed. As an example the next figure shows the contact forcé of every section running at 90 km/h.
• Overhead conductor rail • Transition+Corwentlonal catenary -• Support
• Cantileve re tdroppers Total Forcé End
• o
2fl0n
20O
150-
100-
5
, . . • • •
• • •
i • •
! i • 1 • '
. , . • 1 1
• 1 •
• 1 1
! ! 1 • ' !
I • • • ! ! ! I ! ! i |! ! ! | i ! i
0 1Ó0 . , .
iéo
' ' ' ' 1 Tur i lili i
2Ó0
ir • i pi i
2¿0
s[m]
J5ü-
2-'J
[m]
Figure 11: a) contact forcé at transition, b) detailed view ofthe transition zone
7. CONCLUDING REMARKS Using the modeling techniques used in this work and exposed in this paper it is possible to
model any overhead conductor rail geometry considering even critical zones such as overlaps, crossings, and transition between overhead conductor rail and conventional catenary.
These simulations can be used to analyze the current collection quality for an specific catenary system or even as an optimization tool in the design of a catenary system.
8. ACKNOWLEDGEMENTS The authors want to acknowledge to ADIF, specially to Marcos Arda, the support offered for the
development ofthe work presented inthis paper.
9. REFERENCES [1] C. Vera, B. Suarez, J. Paulin and P. Rodríguez: Simulation Model for the Study of Overhead Rail
Current Collector Systems Dynamics, Focused on the Design of a New Conductor Rail, Vehicle System Dynamics, 2006, vol 44, pags. 595 - 614.
[2] C. Vera, J. Paulin, B. Suarez and P. Rodríguez, "Improved Design of an Overhead Rail Current Conductor for Application in Underground Lines", Railway Engineering - 2005, London, United Kingdom, 29-30 June, 2005.
[3] F. J. González, J. A. Chover, B. Suarez, y M. Vázquez, "Dynamic Analysis using Finite Elements to Calcúlate the Critical Wear Section of the Contact Wire in Suburban Railway Overhead Conductor Rails", Journal of Rail and Rapid Transit, 2008, Vol. 222, pp. 145-157.
[4] B. Suarez, J. Paulin y C. Vera, "' Optimización de la Captación de Corriente con Catenaria Rígida", Actas del I Congreso Innovación Ferroviaria, Calatayud, España, 5-6 October, 2004.
[5] EN 50318:2002, "Railway applications - current collection systems - validation of simulation of the dynamic interaction between pantographs and overhead contact Une", 2002, ISBN: 0580405605.
[6] EN 50119:2001, "Railway applications Unes", 2001, ISBN: 0580383016.
Fixed installations - Electric traction overhead contact