Embed Size (px)
Citation preview

Page 1 of 10 Pages
Simulation of Wind-Power Plants combining
ATP/ATPDesigner and Simplorer
Michael Igel, Stefan Winternheimer
Hochschule für Technik und Wirtschaft
des Saarlandes, Germany
Abstract - Today wind-power plants are important infeeding energy in MV-networks and to
substitute existing power plants. Power electronic circuits connect wind-power plants to
power networks. The number of wind-power plants is permanently increasing and therefore
their system perturbation.
The CAE-tool Simplorer
was developed to simulate power electronic circuits, but not power
networks. Just the combination of ATP/ATPDesigner and Simplorer
offers interesting
possibilities simulating wind-power plants: Simplorer - power electronic circuits,
ATP/ATPDesigner - power networks. The contribution shows an example how to use their
specific strength simulating harmonic and non-harmonic frequencies generated from power
electronic devices. Data interfaces, Simplorer
and ATP/ATPDesigner based models are also
presented.
Keywords: Wind-power plants, Power electronic circuits, Power Networks, Simulating wind-
power plants, Simplorer, ATP/ATPDesigner, Harmonic frequencies, Fourier Transformation
1 Introduction
Transport and distribution of electrical energy from power plants to consumers of electrical
energy need large power networks, which consists of electrical equipment e.g. transformers,
overhead lines, cables, circuit-breakers, etc. The electrical energy is generated by different
types of power plants.
In Germany the number of wind-power plants is permanently increasing in the last years with
the expected aim to substitute especially nuclear power plants, which shall be disconnected
from the German power network up to year 2020. Therefore the impact of the technology of
wind-power plants on the German power network is permanently increasing. From this point
of view it will be more and more important to study the behaviour of wind-power plants using
software based simulation systems.
The strength of the network simulation program ATP [1] is to model and simulate electrical
power networks and their electrical equipment. The modeling and simulating of power
electronic circuits is still not the main goal of ATP. Especially the modeling and simulation of
power electronic circuits and the required control characteristic can often be not realised.
Therefore the combination of ATP/ATPDesigner and the simulation system Simplorer®
[2],
whose strength is on the field of simulating power electronic circuits, offers a wide range of
new possibilities in modeling and simulating wind-power plants in electrical power networks.
This contribution presents some advantages of this combination.
Department of Electric Power Engineering
Hochschule für Technik und Wirtschaft
des Saarlandes
University of Applied Science
Goebenstraße 40
66117 Saarbrücken
Germany
Page 2 of 10 Pages
2 Simplorer® - Simulation of Power Electronic Circuits
Wind-power plants consist of one or more power converter to generate a symmetrical,
3-phase system of voltages and currents, which can be connected to electrical power
networks. Various PWM-techniques can be used to control the power converter in order to
generate sinusoidal waveforms of the fundamental frequency of the power network.
Nevertheless all these technologies generate not only the fundamental frequency but also
higher frequencies, which depend on the technology of the power converter and its control.
The CAE-tool Simplorer®
was developped to model and simulate power electronic circuits as
well as the required control characteristics. A lot of different electronic components, control
blocks and simulation functions are available. The calculated currents and voltages can be
presented in diagrams. In addition the frequency spectrum of voltages and currents can be
calculated using the Fast Fourier Transformation module of Simplorer®
. The frequency
spectrum can be written into a text file and processed by other tools.
Figure 1 shows a snapshot of the graphical user interface of Simplorer®
. The background
screen shows the schematic of the power converter: three-phase voltage source inverter fed by
a constant DC voltage, devices to meter voltages and currents, the short-circuit impedances
Zk = R + jωL of the power transformer. The AC voltage sources representing the power
network is not visible in the schematic. The three phase currents presented in the diagram in
the bottom right corner, are simulated by Simplorer®
. These phase currents are infeeded into
the electrical power network via the power transformer like current sources.
Figure 1: Simulating a Power Converter using Simplorer®
Page 3 of 10 Pages
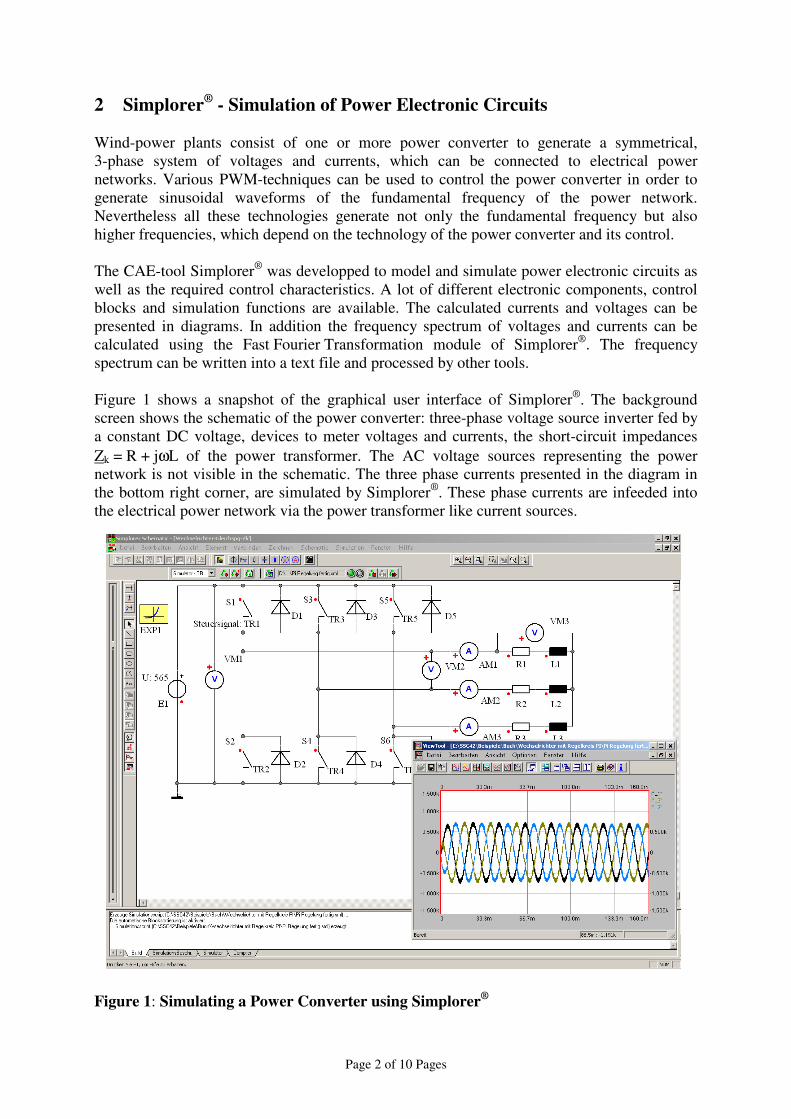
3 Phase Currents – Output Signals of the Power Converter
In Figure 1 one can see that the phase currents are symmetrical with the same amount and a
phase shift ϕ = 120°. The phase currents consist of the fundamental frequency and harmonics
generated by the PWM process (PWM: pulse width modulation). Figure 2 shows one cycle of
the phase current iA(t) and the PWM control signal of the suitable phase leg of the inverter:
� PWM signal to control the rectifiers of the power converter
� Phase current iA(t) measured at the LV-winding of the power transformer
Figure 2: Control signal of the power converter, phase current iA(t)
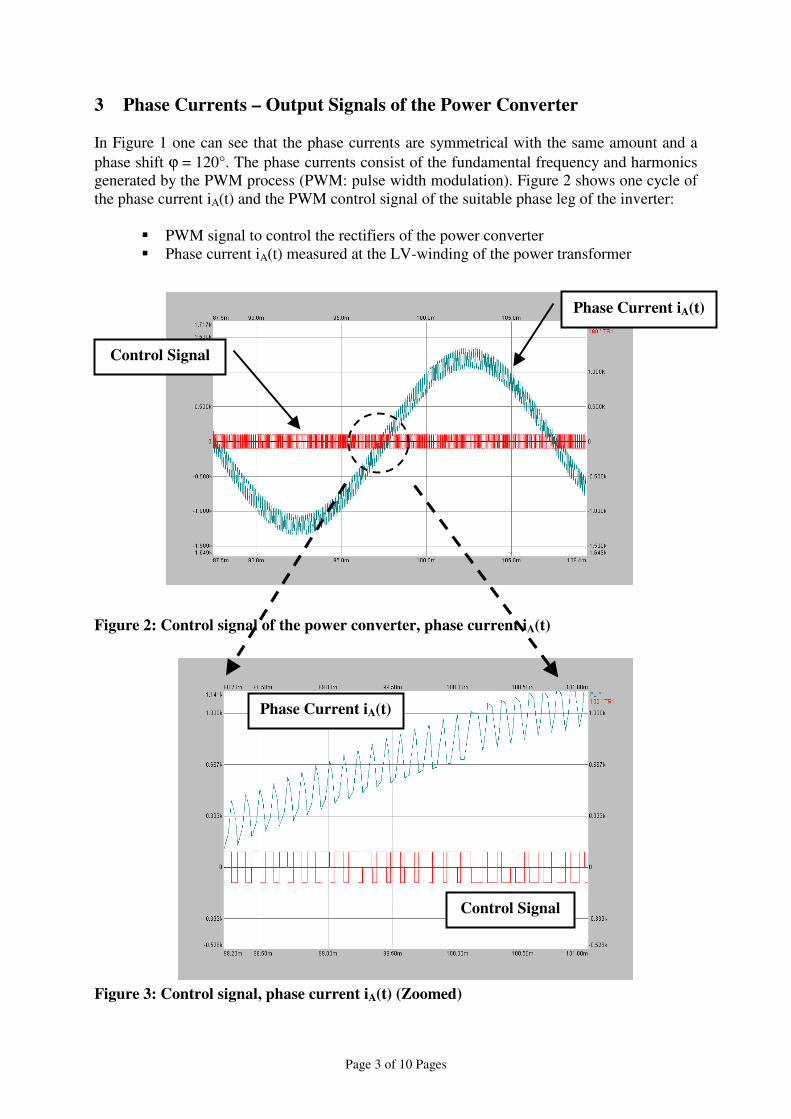
Figure 3: Control signal, phase current iA(t) (Zoomed)
Control Signal
Phase Current iA(t)
Control Signal
Phase Current iA(t)
Page 4 of 10 Pages
4 Calculating the Spectrum of the Phase Currents
Figure 3 shows the magnified diagram of phase current iA(t) and the corresponding PWM
control signal. The time axis takes only about 3ms. Three control signals, one for each phase
leg are used to generate sinusoidal waveforms of the phase currents. Figure 3 shows that the
phase current iA(t) is rising if the PWM control signal is positive and is falling if it is negative.
This PWM characteristic produces harmonics in the phase currents which are multiples of the
switching frequency. The spectrum of the phase currents can be calculated using the
Fast Fourier Transformation module of Simplorer®
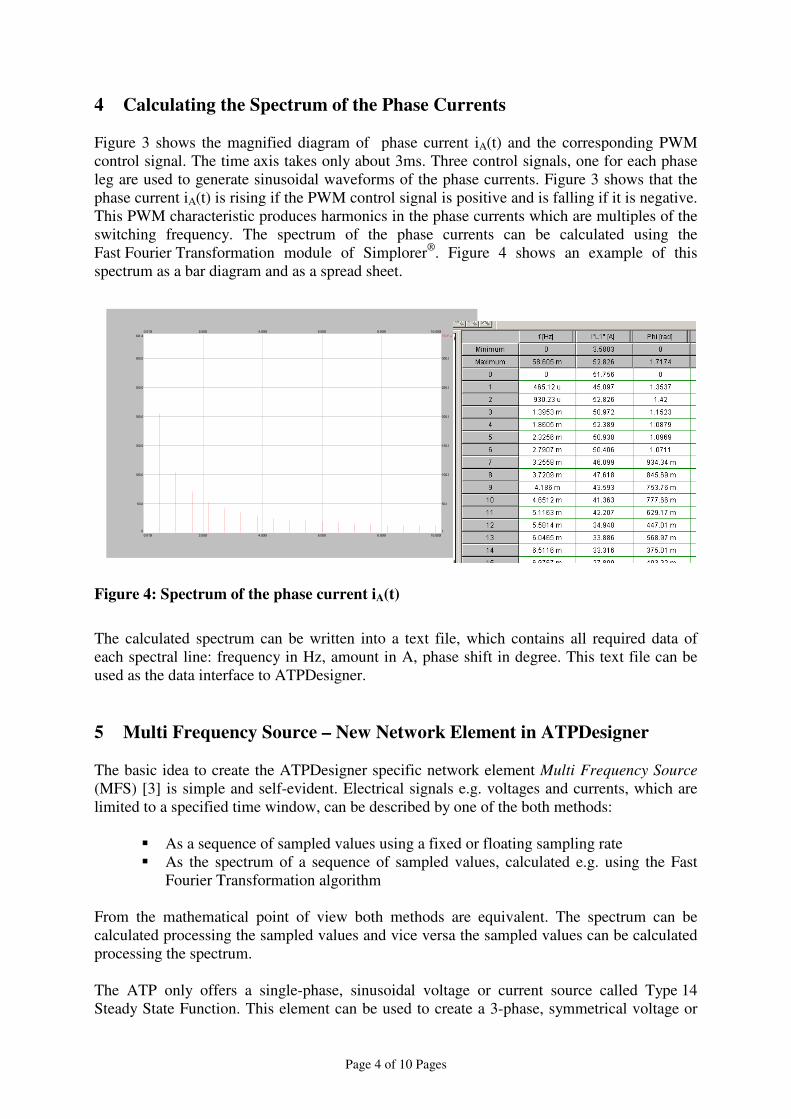
. Figure 4 shows an example of this
spectrum as a bar diagram and as a spread sheet.
Figure 4: Spectrum of the phase current iA(t)
The calculated spectrum can be written into a text file, which contains all required data of
each spectral line: frequency in Hz, amount in A, phase shift in degree. This text file can be
used as the data interface to ATPDesigner.
5 Multi Frequency Source – New Network Element in ATPDesigner
The basic idea to create the ATPDesigner specific network element Multi Frequency Source
(MFS) [3] is simple and self-evident. Electrical signals e.g. voltages and currents, which are
limited to a specified time window, can be described by one of the both methods:
� As a sequence of sampled values using a fixed or floating sampling rate
� As the spectrum of a sequence of sampled values, calculated e.g. using the Fast
Fourier Transformation algorithm
From the mathematical point of view both methods are equivalent. The spectrum can be
calculated processing the sampled values and vice versa the sampled values can be calculated
processing the spectrum.
The ATP only offers a single-phase, sinusoidal voltage or current source called Type 14
Steady State Function. This element can be used to create a 3-phase, symmetrical voltage or
I"L1" = f(f, F...
0.010k
0.010k
10.000k
10.000k
2.000k
2.000k
4.000k
4.000k
6.000k
6.000k
8.000k
8.000k
0 0
341.4
50.0 50.0
100.0 100.0
150.0 150.0
200.0 200.0
250.0 250.0
300.0 300.0

Page 5 of 10 Pages
current source. Frequency and a phase shift of the source are user specific. Figure 5 shows an
example for a voltage source: Vnom = 110kV, fnom = 50Hz, phase shift = 120°.
14R00001 8.981462E45.000000E12.700000E2 -1
14S00001 8.981462E45.000000E11.500000E2 -1
14T00001 8.981462E45.000000E13.000000E1 -1
Figure 5: 3-Phase Voltage Source based on Type 14 Steady State Function
The Multi Frequency Source combines both: the frequency spectrum of a voltage or current
signal and the 3-phase, symmetrical voltage or current source based on the Type 14 Steady
State Function of the ATP.
Figure 6: Settings dialog of the Multi Frequency Source
Figure 6 shows the settings dialog of the Multi Frequency Source, which is implemented in
ATPDesigner. The spread sheet can be filled by hand or automatically using the button “Read
Simplorer FFT Data”. ATPDesigner “knows” the structure of the text file, which contains the
frequency spectrum calculated by Simplorer®
. ATPDesigner imports the text file, analyses the
data and displays these data in the spread sheet. The data will be completely stored in the
.NET-file of the power network.
The network element Multi Frequency Source provides up to 200 spectral lines. Each of the
spectral lines is specified by the frequency in Hz, the amplitude in V or A and the phase angle
in degree. ATPDesigner uses one symmetrical, 3-phase voltage or current source for each
spectral line and writes the control sequence of this single-frequency source into the .ATP-
file. In addition each single-frequency source can be switched on (Time ON) and switched off
(Time OFF) separately. The single-frequency sources are connected to the same node of the
Page 6 of 10 Pages
power network, where the sampling values are added. The model of the Multi Frequency
Source consists of a compilation of single-frequency sources connected to the same node of
the power network.
From the mathematical point of view the Multi Frequency Source is an implementation of the
Reverse Fourier Transformation based on ATP’s Type 14 Steady State Function. The Multi
Frequency Source can be used to simulate the beheaviour of any electrical equipment, which
can be specified based on its frequency spectrum. Therefore the Multi Frequency Source can
be also used to simulate the behaviour of wind-power plants and their system perturbations.
6 System Perturbations of the Wind-Power Plant
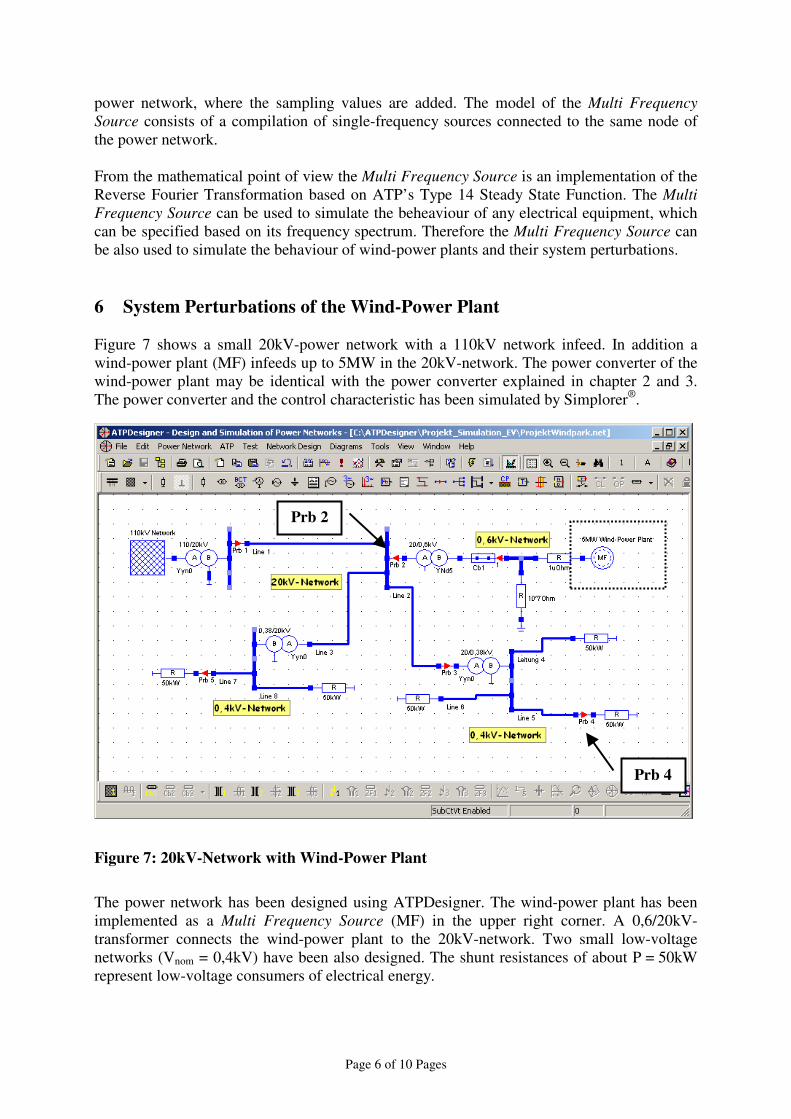
Figure 7 shows a small 20kV-power network with a 110kV network infeed. In addition a
wind-power plant (MF) infeeds up to 5MW in the 20kV-network. The power converter of the
wind-power plant may be identical with the power converter explained in chapter 2 and 3.
The power converter and the control characteristic has been simulated by Simplorer®
.
Figure 7: 20kV-Network with Wind-Power Plant
The power network has been designed using ATPDesigner. The wind-power plant has been
implemented as a Multi Frequency Source (MF) in the upper right corner. A 0,6/20kV-
transformer connects the wind-power plant to the 20kV-network. Two small low-voltage
networks (Vnom = 0,4kV) have been also designed. The shunt resistances of about P = 50kW
represent low-voltage consumers of electrical energy.
Prb 2
Prb 4
Page 7 of 10 Pages
Voltages and currents are measured at different measuring locations using the ATPDesigner
specific measuring device Probe (Prb 1..5). The measuring device Probe consists of the a
MEASURING SWITCH [1], which is internally assigned to the TACS [1] section. Each
MEASURING SWITCH corresponds to one unique TACS output signals. Only the TACS
output signals are available to create diagrams. Therefore the names of the output signals of
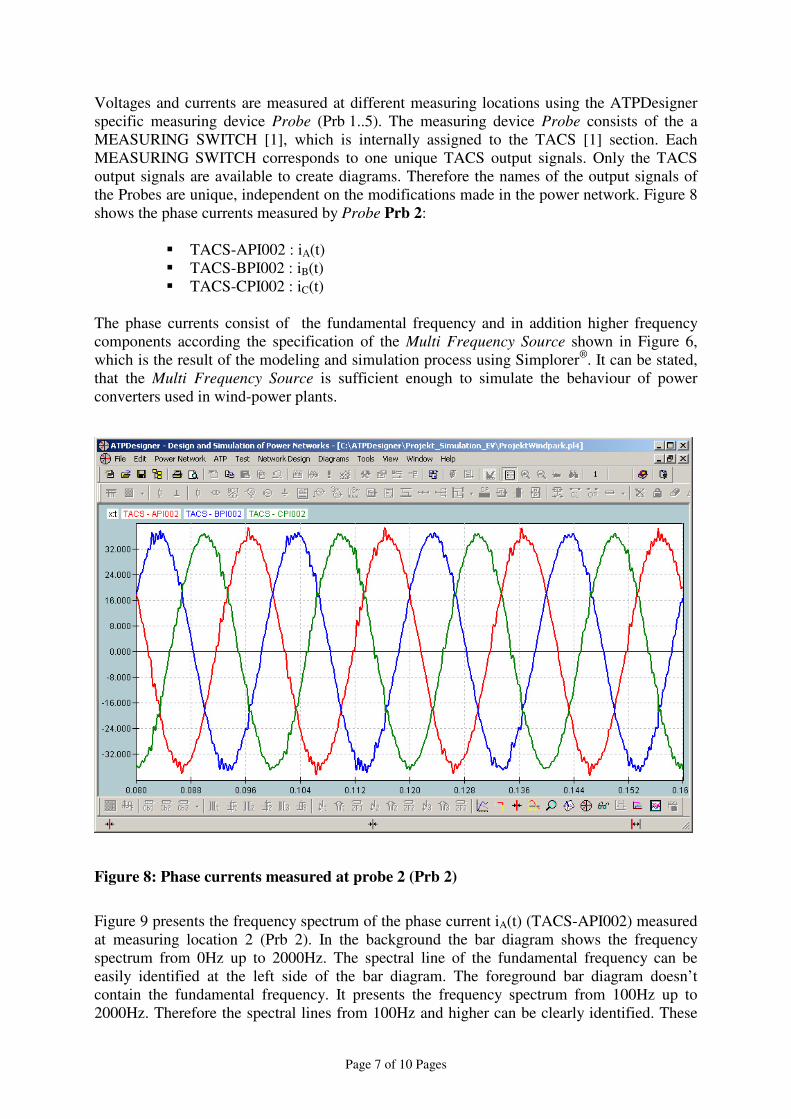
the Probes are unique, independent on the modifications made in the power network. Figure 8
shows the phase currents measured by Probe Prb 2:
� TACS-API002 : iA(t)
� TACS-BPI002 : iB(t)
� TACS-CPI002 : iC(t)
The phase currents consist of the fundamental frequency and in addition higher frequency
components according the specification of the Multi Frequency Source shown in Figure 6,
which is the result of the modeling and simulation process using Simplorer®
. It can be stated,
that the Multi Frequency Source is sufficient enough to simulate the behaviour of power
converters used in wind-power plants.
Figure 8: Phase currents measured at probe 2 (Prb 2)
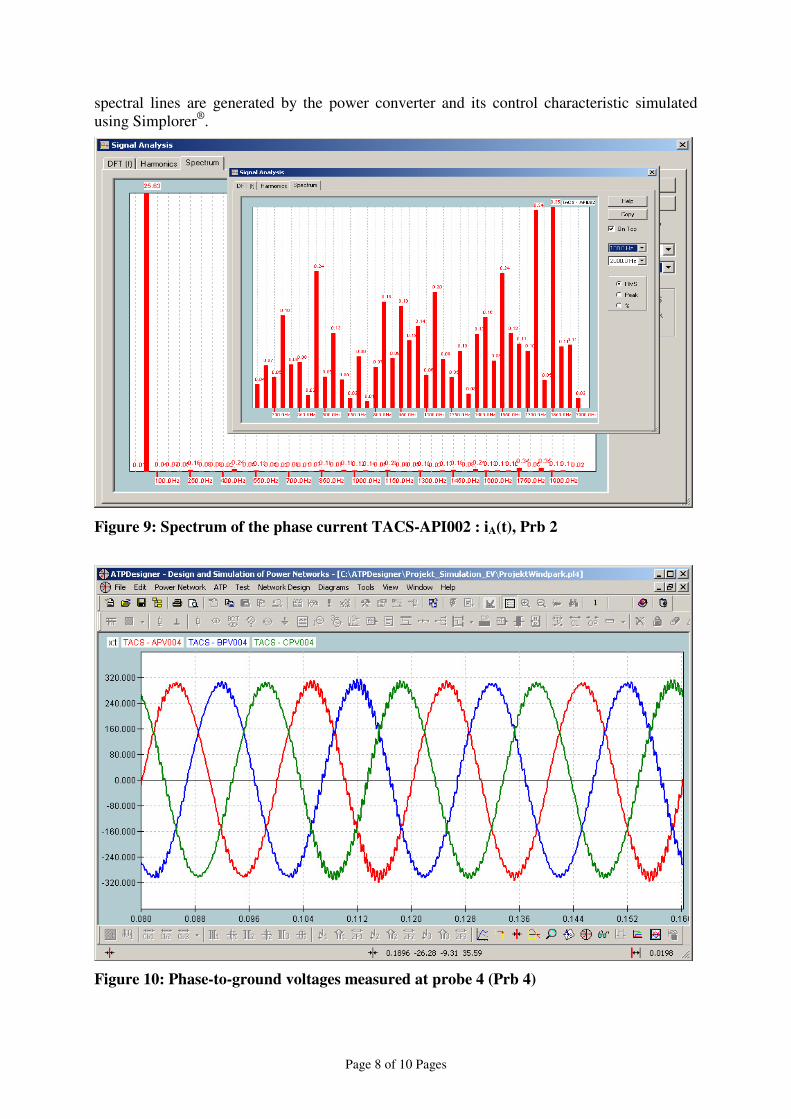
Figure 9 presents the frequency spectrum of the phase current iA(t) (TACS-API002) measured
at measuring location 2 (Prb 2). In the background the bar diagram shows the frequency
spectrum from 0Hz up to 2000Hz. The spectral line of the fundamental frequency can be
easily identified at the left side of the bar diagram. The foreground bar diagram doesn’t
contain the fundamental frequency. It presents the frequency spectrum from 100Hz up to
2000Hz. Therefore the spectral lines from 100Hz and higher can be clearly identified. These
Page 8 of 10 Pages
spectral lines are generated by the power converter and its control characteristic simulated
using Simplorer®
.
Figure 9: Spectrum of the phase current TACS-API002 : iA(t), Prb 2
Figure 10: Phase-to-ground voltages measured at probe 4 (Prb 4)
Page 9 of 10 Pages
The combination of Simplorer®
and ATPDesigner / ATP offers now a lot of possibilities to
study the system perturbations of wind-power plants. The technology of the power converter
can be easily modified in Simplorer®
, improved control characteristics can be simulated
independent on the simulation of the power network. The system perturbations of wind-power
plants can be easily studied using the Multi Frequency Source. Based on the signal analysis
methods, which are implemented in ATPDesigner, the frequency spectrum can be easily
calculated for each measuring location in the power network and displayed as a bar diagram.
Diagrams and all other drawings can be copied in any document using Copy & Paste.
As an other example the phase-to-ground voltages of 0,4kV-network, which can eb measured
closed to the consumers in the low-voltage network, will be analysed now. Figure 10 shows
the phase-to-ground voltages measured at measuring location 4 using Probe Prb 4:
� TACS-APV004 : vAG(t)
� TACS-BPV004 : vBG(t)
� TACS-CPV004 : vCG(t)
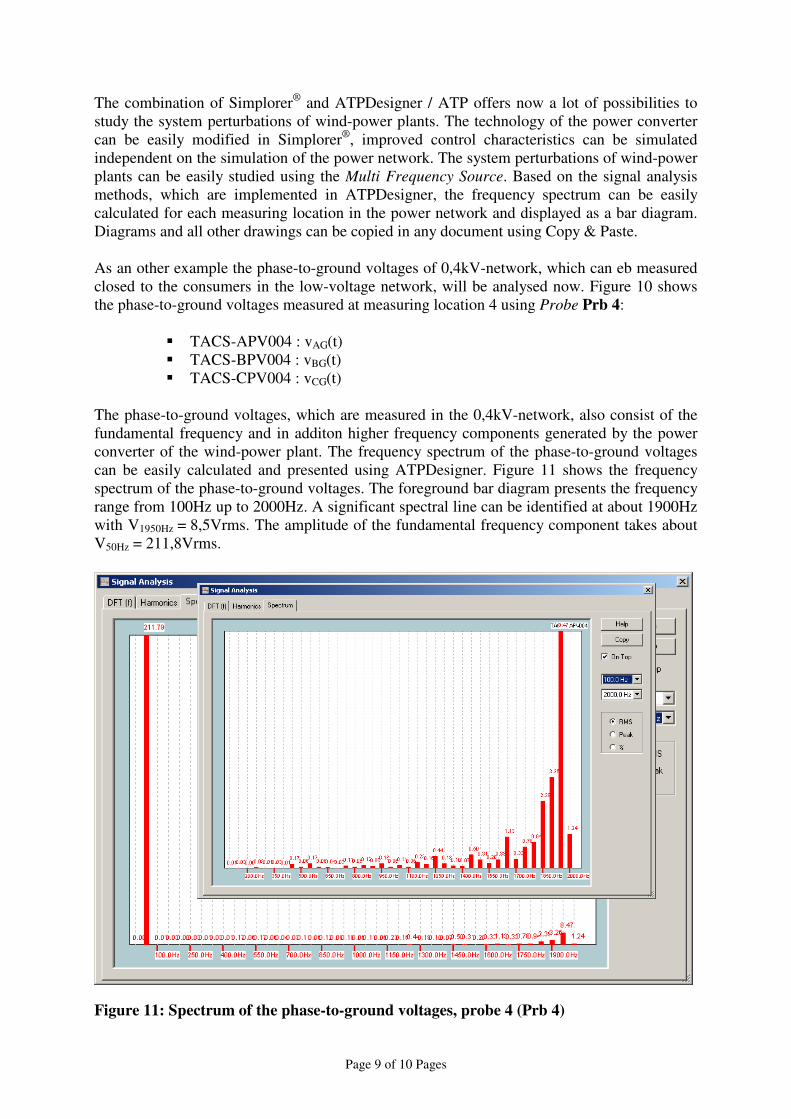
The phase-to-ground voltages, which are measured in the 0,4kV-network, also consist of the
fundamental frequency and in additon higher frequency components generated by the power
converter of the wind-power plant. The frequency spectrum of the phase-to-ground voltages
can be easily calculated and presented using ATPDesigner. Figure 11 shows the frequency
spectrum of the phase-to-ground voltages. The foreground bar diagram presents the frequency
range from 100Hz up to 2000Hz. A significant spectral line can be identified at about 1900Hz
with V1950Hz = 8,5Vrms. The amplitude of the fundamental frequency component takes about
V50Hz = 211,8Vrms.
Figure 11: Spectrum of the phase-to-ground voltages, probe 4 (Prb 4)
Page 10 of 10 Pages
7 Conclusions
The CAE-tool Simplorer®
was developped to model and simulate power electronic circuits as
well as the required control characteristics, but not to model and simulate electrical power
networks. This strength can be efficiently used to simulate various power electronic circuits
and control characteristics to analyse the existing technology of wind-power plants.
Modifications can be made using the graphical user interface of Simplorer®
, improvements
can be easily simulated and further analysed. The frequency spectrum of all signals e.g.
currents and voltages can be calculated using the integrated Fast Fourier Transformation
modul. The frequency spectrum can be written into a text file and easily processed by other
software tools e.g. ATPDesigner.
ATPDesigner is a graphical user interface to the ATP and offers a wide range of functions for
an interactive design of electrical power networks. Voltages and currents can be presented in
diagrams processing ATP specific PL4-files or COMTRADE-files. Several signal analysis
methods are also implemented e.g. to calculate and display the frequency spectrum of
voltages and currents in bar diagrams. ATPDesigner uses the ATP as a background task to
process the network simulation. The strength of the network simulation program ATP is
mainly the field of modeling and simulating electrical power networks and their electrical
equipment, but not the field of modeling and simulating power electronic circuits and the
required control characteristic.
ATPDesigner also offers network elements, which are not specified in the ATP rule book, but
which are designed using ATP specific elements. The Multi Frequency Source has been
designed to define a symmetrical, 3-phase voltage or current source only based on frequency
spectrum. In addition the network element Multi Frequency Source also offers the possibility
to process the results of the Fast Fourier Transformation modul of Simplorer®
. ATPDesigner
is able to read and process the text file written by Simplorer®
, which contains the frequency
spectrum of the interesting voltage or current.
Simplorer®
, ATPDesigner and ATP are a powerful compilation to study the system
perturbations of wind-power plants in electrical power networks. The specific strength of the
tools can be added to a common simulation system. ATPDesigner offers the required
interfaces to Simplorer®
and ATP and works as the glue between the tools.
[1] Alternativ Transients Program (ATP) Rule Book
European EMTP-ATP Users Group e.V.
Internet: www.eeug.org
[2] Simplorer(R)
Ansoft Cooperation, Pittsburgh, USA
Internet: www.ansoft.com
[3] Igel, M.: ATPDesigner Help File, Germany, 2006
Internet: people.freenet.de/atpdesigner/