Embed Size (px)
Citation preview

"SIMULATION OF URBAN SYSTEM EVOLUTION IN A SYNERGETIC
MODELLING FRAMEWORK. THE CASE OF ATTICA, GREECE."*
Panos Manetos
PhD candidate, University of Thessaly
Dept of Planning and Regional Development
Pedion Areos, Volos 38334, Greece
Tel.: 2421074426 Fax: 2421074382
e-mail: [email protected]
Yorgos N. Photis
Assistant Professor, University of Thessaly
Dept of Planning and Regional Development
Pedion Areos, Volos 38334, Greece
Tel.: 2421074426 Fax: 2421074382
e-mail: [email protected]
*(Paper submitted the 43rd European Congress of the RSA in Jyväskylä, Finland 2003)

1
Abstract
Spatial analysis and evolution simulation of complex and dynamic systems such
as modern urban areas are could greatly benefit from the synergy of methods and
techniques that constitute the core of the fields of Information Technology and Artificial
Intelligence. Additionally, if during the decision making process, a consistent
methodology is applied and assisted by a user-friendly interface, premium and
pragmatic solution strategies can be applied.
Within such framework, this paper presents both a prototype Decision Support
System and a consorting spatio-temporal methodology for modelling urban growth. Its
main focus is the analysis of current trends, the detection of the factors that mostly
affect the evolution process and the examination of user-defined hypothesis regarding
future states of the problem environment.
According to the approach, a neural network model is formulated for specific
time intervals and each group of spatial units, mainly based to the degree of their
contiguity and spatial interaction. At this stage, fuzzy logic provides a precise image of
spatial entities, further exploited in a twofold way. Firstly, for the analysis and
interpretation of up-to-date urban evolution and second, for the formulation of a robust
spatial simulation model. It should be stressed, however, that the neural network model
is not solely used to define future urban images, but also to evaluate the degree of
influence that each variable, as a significant of problem parameter, contributes to the
final result. Thus, formulation and analysis of alternative planning scenarios are
assisted.
Both the proposed methodological framework and the prototype Decision
Support System are utilized during the study of Attica, Greece’s principal prefecture
and the definition of a twenty-year forecast. The variables considered and projected
refer to population data derived from the 1961-1991 censuses and building uses
aggregated in ten different categories. The final results are visualised through thematic
maps in a GIS environment. Finally, the performance of the methodology is evaluated
as well as directions for further improvements and enhancements are outlined.
Keywords: Computational Geography, Spatial Modelling, Neural Network Models,
Fuzzy Logic.
2
Introduction
During the last years there exists an increased awareness of the value of spatial
referenced information and its role in the decision-making process, both in public and
private sector. More specifically the cities because of their consistent growth and
change in morphology, are continuously in the epicentre of a wider scientific interest, as
the contemporary urban problems are complex and exceed the pure urban aspect. The
quantitative and spatial demographic change in the urban regions is accompanied by
perpetual changes, which are expressed mainly via the urban sprawl and the land uses
changes. These ever during and rapid changes, make the diagnosis and the solution of
problems difficult in the urban regions, and all the more difficult the immediate optimal
decision-making. For these reasons it appears an increased implementation and
development of Spatial Decision Support Systems (SDSS) in this direction. However,
the vital question remains, if the current techniques and capabilities of analysis that are
integrated in SDSSs, correspond at the contemporary and future needs of decision-
making that will lead into successful future development of urban regions.
In the present paper, a prototype methodology is proposed for the development
of an urban model under a Geodemographic perspective. Methods and techniques of
Artificial Intelligence are recruited for the spatiotemporal analysis and forecast of future
trends and development of urban regions. These methods exploit the increased volume
and the variety of available data, and with the help of a suitable theoretical framework,
can locate the cross-correlations of individual factors in the planning process and
contribute in model formulation, in order to forecast the urban development. It
constitutes of four chapters: The first focuses on the complexity and the particularities
of the evolution of urban regions as well as on the contemporary approaches. The
methods and techniques that were used for the model formulation are also presented
briefly. The second presents the theoretical framework of the model and the proposed
methodological approach referring to the individual steps that it constitutes of. In the
next chapter, according to the proposed methodological framework, a model is
formulated for the simulation of geodemographic characteristics of the prefecture of
Attica, Greece. Finally, the paper closes with the chapter of conclusions, where the
approach is evaluated and the prospects of further research are outlined in the
framework of confrontation of similar problems.

3
1. Urban Evolution Models
The urban planning process presupposes plethora of information and a variety of
analysis tools, so the technological and functional environment, in which it will be
developed, should be characterized by flexibility and adaptability of a breadth of needs
and requirements (Visvalingam 1991). Planning includes the stages of analysis and
composition with final aim the determination of strategies, including objectives and
criteria, which will lead to the desirable result. The interrelations of individual
parameters that shape the environment of each problem play an important role, as the
variables (under examination) of urban space are interdependent. In this meaning
growth is not random; When a spatial entity is developed in a given place then the
probability of development for the adjoin regions is increased (Makse 1998). The
geographic contiguity has repercussions in every social phenomenon and this because
there are no pure spatial processes, but specific social processes that function in space
(Jones 1990).
The comprehension and interpretation of the urban growth process and
development are important so for practical reasons, as for the challenge that it
constitutes for the theoretical framework. As contemporary cities are polycentric and
abstain from the classic monocentric model of the past, understanding their evolution is
becoming constantly more complicated. Since the first post war decades, several
theories were developed for the analysis and simulation of the evolution of cities and the
mathematic equations that resulted, led to the creation of models of partial interpretation
of urban phenomena. The liaison between theories and models was not always powerful
and in combination with the initially limited technological possibilities did not lead to
widely known and applicable tools.
1.1 Alternative approaches
In each action framework, the existing condition in space is one of the more
powerful factors, such as the demographic features, the existing structures as well as the
land uses that have prevailed (Aravantinos 1997). The inquiry of individual
interrelations designates the fact that spatial units and their development, influence and
are influenced by the features and the corresponding development of their neighbouring
4
units. It is remarked in this sense an interaction that reinforces the theory about
simultaneous and interdependent development of two or more neighbouring regions. In
the international literature there are recorded several mathematic expressions for the
interpretation and the rendering of the previous arguments. In the particular reports, the
demographic changes and the land uses are presented closely connected, and the models
of urban growth that were formulated in order to describe and foreshow them, provide
the essential background to analyze the correlation between them.
There also exist several efforts of multifaceted confrontation of the question of
determination of the way the urban space changes, which proves the interest of
examining the cause of these changes. As the general requirements in planning and
more specifically in urban planning are continuously augmenting, since more
parameters, variables (e.g. environmental repercussions) should be taken under
consideration (Rocky Mountain Institute 1998). Consequently, there exists apparent
interest for the conduct of such researches and the quest of suitable methods to support
the formulation of urban models. Indicatively the following examples are reported:
a) Urban Dynamics Research is a research program for the recording and
analysis of land use changes in urban spaces. Its objective is to recognize the spatial
links between geographic and socio-economic factors that contribute in the urban
growth. The formulation of the derivative models is based on the use of simple
parameters such as the degree of urban extension, the topography of the region and the
road network. For the forecast of the probability of urbanisation of regions, statistical
methods are primarily used (USGS 2002).
b) UrbanSim (Urban Simulator) is created and developed in the
University of Washington. It is a model based on the growth of software that is designed
in order to be used in the planning and the analysis of urban growth, by integrating the
interactions between land uses, transports and public policies (Waddell 2002).
c) In the Greek reality, such studies do not exist with the exception of the project
of Attico Metro on the forecast of population in the prefecture of Attica, part of a
greater study on the Athens subway system. Having accepted certain concessions, there
were creates two "alternative scenarios" with the most likely developments in primary
factors of the country (GNP, incensement rate of population, rate of employment). The
assembled data were analyzed and their comparative advantages were determined
flowingly. Finally with the aid of the Delphi method, a table of weights was created and
two final estimates were determined, which constituted also the final output of the

5
project (Attico Metro 1997). In this paper, an alternative proposal is presented for an
urban model of development, which is supported by methods of artificial intelligence,
which in contradiction to what was presented previously, they process and solve the
individual sub problems, without following or presupposing the predetermination of
specific mathematical equations.
1.2 Methods and techniques
Until the beginning of the nineties, simple statistical methods (for example
simple regression) were applied the study and analysis of problems, in the data process
and estimations. Ever since, there is a big accumulation of data in all fields of modern
society (scientific, administrative, enterprising etc). And apart from the increased
volume of data, so in quantity as in variety, the parameter of time was also added in the
process of analysis and utilization of results. Henceforth, the problems are considered
through time and not statically, as the need for immediate and most optimal solutions
exist in parallel. The need for optimal exploitation of huge databases, led to a new
research area that concerns the extraction of useful information from data, in which is
called Data Mining (DM) (Gunzel et al. 1999). Technologies of DM aim, via automated
processes, in the detection of hidden correlations and interdependences within the data.
One of DM categories is cluster analysis, that is to say, the effort of recognition of a
finite set of groups for the description of data objects.
From the series of methods and techniques that are used for data analysis, Neural
Nets and Fuzzy Logic were selected to be applied. Their practicality and efficiency lies
in the fact that they do not presuppose necessarily specialised mathematical knowledge
or other theories, in order to be applied effectively. Some distinguished examples of
their applications in the literature are the forecast of the spread of AIDS cases in the
state of Ohio and the socio-economic classifications of population (South Africa) based
on census data (Hewitson 1994). A short presentation of these techniques follows,
focusing on their main characteristics and the way of integrating them in the presented
methodology.
Fuzzy Logic (FL): The theory of FL was developed in order to handle problems
that do not have strict limits or situations in which events are vaguely determined, as it
actually happens in the real world. FC has been proven especially useful in multivariate
object clustering. The first objective of clustering is the detection of common structures

6
in the data, clusters, in which each object is attributed. The result of the clustering
process is used as classifier, with which objects that have not been attributed yet to any
group, are attributed to clusters. Thus, the advantage of fuzzy clustering is that the
objects are attributed with different degree in different clusters, while in the common
clustering each object corresponds in one cluster precisely.
Openshaw has already expressed the idea of applying FL in Geodemography
(Openshaw 1989). The more basic reason is that usually in Geodemography exist two
kinds of fuzziness that are encountered in the uncertainties that emerge from the
inaccuracy. The first concerns the descriptive characteristics of spatial units, where for
example if clustering of neighbouring entities is implemented by the binary logic, the
fact that enough entities even if they have similar, are classified differently. The second,
concerns the effect of contiguity in the configuration of individual characteristic regions
and more specifically in the geographic phenomenon where while neighbouring
populations tend to share certain common characteristics in their behaviour despite the
other differences, are classified in wrong groups. One reason for these is that the borders
of spatial entities are not natural in demographic and economic-social terms (Feng
1998). The proposed methodology in this paper faces both kinds of fuzziness and
moreover exploits the effect of contiguity for the configuration of initial clusters, and
for the forecast of their future development.
Neural Networks (NN): The use of NN for data processing provides the ability
of detection of relationships between theoretically independent variables for each
object. This fact can boost the research in new paths and approach the under
examination problem from different aspects. NN contain several free parameters and for
this reason they require many more training data in order to achieve better performance.
The aim of a NN is to determine future situations or values, for which temporal data are
available, or to group features, after been previously successfully trained.
Justifiable possibilities emerge by the use of NN in various spatial problems,
which up to today had been characterized as of increased complexity. Such a thing, does
not mean in any case that the classic methods should be suppressed, but should function
additionally and in combination with NN, so as to comprehend and solve similar
problems through integrated approaches.
In the proposed approach, Fuzzy C-Means (FCM) algorithm is used, which
analyzes the elements of entry and seeks relations between them and attributes them in
classes after they are processed. Each class has a central value (cluster centre) which
7
describes the value of a characteristic feature of this class. These percentages are related
to how close to the centres of a cluster each object approximates. Thus, if the percentage
of an object belonging to a group is 95%, this means that the data that characterize it,
coincide with the cluster centre of this particular group and consequently it is classified
in this. Reversely, if the object belongs by 5% in a group, then the data that compose it,
have minimal relation with the characteristics of this group.
2. Methodological Framework
For the determination of geodemographic evolution of urban regions, a
spatiotemporal approach was adopted, under the sense that the observation, the
interpretation and the forecast of the under study phenomenon, are accomplished in the
flow of time, analyzing and formulating a thorough perception of its progressive
formation. It is designated in this sense the importance of the time variable in each
decision-making process.
Fundamental axis of the proposed methodology comprises the ascertainment that
the development of a spatial entity does not depend only on its own exclusive features
that it constitutes of, but also from the way in which the neighbouring entities develop,
as the frontier contact creates bidirectional relations of assimilation of characteristics
and interaction of activities. Often, for the observation of a phenomenon spatial entities
are grouped based on common features, in order for the changes to be distinct,
particularly when the number of spatial entities is augmented. The formulation of
groups that are characterized by a particular breadth of values in the corresponding
variables, constitute the constant diachronic reference, based on which each entity is
classified and described. This acknowledgement, involves the secession of entities in
different groups diachronically, which means that on one hand its stage of development
is changed and on the other hand its developmental prospect. In this way, for each time
interval, a correspondence between region and spatial unit is formulated and its
common encounter, formulates the diachronic image.
Data Pre-processing: Starting to analyze the individual stages of the
methodology, it is initially determined the phenomenon that will be examined and the
Spatial Reference Unit (SRU), which depends on the aim of the study. Data is collected
based on the SRU, and in the framework of the preliminary process, suitable indicators
are determined by the combined exploitation of individual variables, (primary or
8
secondary data, such as population density, percentage proportions etc). The next stage,
in which the experience of researcher plays important role, concerns the selection and
the segregation of the variables that will be used for clustering and these that will be
used for the model.
Determination of geodemographic groups: It concerns the FL procedure which
constitutes of the creation of a table that includes the complete set of temporal data that
will be used for the determination of groups. The calibration of the parameters follows,
which includes the selection of the desired number of clusters. As the clustering process
completes, the changes in the percentages (of each SRU) lead to individual changes
from group to group for each object. Each group that is determined is characterized by
certain values in data (cluster centres) and represents a particular kind of growth and
development. When the process is completed, the final results are registered in a geo-
database base and are visualized with the aid of GIS software.
Forecast Model: Having created an explicit image of each SRU until a specific
moment in time (until when the data are available), it is feasible to project this image
into the future, after it is examined in combination with other dependent variables.
Hence, independent variables can be selected for the formulation of the model.
However, it is of decisive importance the structure of the data table (inputs-outputs) that
will be imported in the NN. It must be structured in such a way that a time
concatenation exists, whose step would be steady and suitably selected. Contiguity is
integrated in the data table with the following steps: a) each SRU borders partially, with
another SRU of the same or another evolution group, b) with the aid of GIS software the
length of the common borders of the SRUs are calculated, c) each SRU is characterized
by all groups partially by percentage. This percentage is multiplied with the percentage
that each SRU borders with another adjacent. In this way, a new percentage value is
created for each SRU with the percentages of groups that it borders. When the final data
table is created, and then follows the calibration of the NN. The determination of
parameters in the NN is critical for the final output, for this a lot of trials are required
and experience from the user so that it leads to the most optimal type of network. There
are various criteria for terminating the training, but the best way in order to achieve the
optimal output (minimum errors), is the termination by the user. It allows better
calculations of the final weights, but at the same time it requires considerable
experience (Haykin 1999). When the results of forecast are evaluated (with use of

9
Figure 1: Methodology flowchart
NN
ProblemDefinition
Data Collection
Data Selection
Spatial Database creation
Clustering
NN Model calibration parameters
NN Training
Validation &Acceptance
of model
METHODOLOGY
Prediction
Evaluation - Interpretation of results
Output Matrices & Maps
Output Matrices & Maps
FCM CLUSTERING
NEURAL NET MODEL
FL
Yes
No
Source: Authors
statistical indicators) and are considered acceptable, then the final maps of forecast are
created. For the easier comprehension of the methodology, a flowchart is created,
presenting the rbasic steps (Figure 1). Many times it is important the beforehand
estimation of the effect of each input variable in the final result, so for this reason,
sensitivity analysis is used. Thus the user is given the possibility to erase the least
important variables and so to decrease the size of network, its complexity but also the
number of repetitions, during training. Moreover in this way, smaller error is achieved
in the final result and in shorter time.
There is no determined number of variables that can be used by the previously
discussed methods. Thus, the flexibility of the methods reflects the flexibility of the
methodology as for the ways of exploitation of data, while at the same time it ensures

10
the same effectiveness for different scales of application. It can be applied for every
group of spatial entities, e.g. in a system of urban centres, or even on the level of city
blocks.
3. Application of Geodemographic model of evolution for the prefecture of Attica
The proposed methodology was applied in the prefecture Attica, which includes
the capital of Greece, Athens. Because of its particular characteristics, as is the
concentration of the highest percentage of a) urban population, b) productive activities,
c) services and specialised workforce, it constitutes a case study with particular interest.
These characteristics, in combination with the public works that are being carried out
(mainly because of the 2004 Olympic Games), alter with intense rates the morphology
of the greater city area. However, an urban centre influences a much wider region and
of course determines the development of the territories around, therefore the wider
region round Athens played an integral role in the study. The groups were created with
the data of years 1961-71-81-91 and the forecast for the years 2001 and 2011.
3.1 Preprocessing of Data
Because of the techniques nature, successively temporal data as much as
possible are required, for reliable results. Thus, the SRU used was the municipality, as
data for minor spatial units were not available. Data were derived from the NSSG
(National Statistical Service of Greece) censuses about population and building uses
from 1961 until 1991. Clustering was performed for the total number of municipalities
by selecting the following 4 (of 18 available) buildings uses: a) Exclusive use:
residences (A2), factories-laboratories (A5), other uses (primary and secondary sector)
(A10), b) Mixed use: residences (B2). The choice was made with the criterion of the
crispier clustering of municipalities and the attribution of their main characteristics. The
table that was constructed included all temporal data from 1961 until 1991. This means
that an image was created for the condition of the region of application, for each year
(1961, 1971, 1981, and 1991) which firstly made possible the observation of the
evolution of each municipality. The mapping of each municipality's condition, in each
of these time intervals, represents the evolution during the previous decade.

11
One additional data that was used (for the corresponding time interval) in
clustering was the Location Quotient (LQ) of population density. Its advantage lies in its
facility in mapping, which designates geographic homogeneity or spatial differentiation.
In the application the LQ of density reflects the degree in which a municipality is over-
populated compared with the average of the prefecture. In this way it becomes obvious
the opposition between the municipalities that constitute the capital and the others
surrounding it.
3.2 Analysis and determination of geodemographic groups
For the selection of the optimal number of groups, reliability criteria of fuzzy
clustering were used, according to contemporary literature (MIT 1997b). They include
the crispiness of clustering, by determining a value proportional with the number of data
that are close to the cluster centres. The crispier the clustering is, the higher is the
particular value. In the present application the best number of clusters was four.
Table 1: Location Quotient of Population Density per cluster. Cluster LQ Population Dens.
A 0,7B 0,4C 11,6D 5,7
Source: Calculated by authors

12
Figure 2: Column Chart - Cluster center percentages
0%
10%
20%
30%
40%
50%
60%
70%
80%
90%
100%
A5 0,9% 2,2% 2,0% 1,9%
A10 5,7% 16,9% 2,8% 4,0%
B2 3,3% 4,7% 18,4% 10,7%
A2 85,5% 70,4% 71,8% 78,9%
A B C D
Source: Calculated by authors
3.2.1 Interpretation and cartographic rendering of groups
Based on- the previous data, clustering attributed to the each municipality
separately the percentages that belong to each of the four groups that were determined.
For the interpretation of these results a bar chart was created (Figure 2) that illustrates
the percentage composition of the cluster centres, which is supplemented by Table 1
with the LQ of population density. With the help of the above, the emerged groups are
described:
Group A: It constitutes of municipalities with population density that approaches
the average. They have the biggest percentage of residence as main use (and the
smallest percentage of residence as a mixed use) and the smallest percentage of shops-

13
offices uses. Spatially referring, they are coastal municipalities in their majority, with
main characteristic the seasonal residence use. They are municipalities with particular
dynamics, as they increase steadily through time.
Group B: Municipalities with the smallest of population density, the smaller
percentage of residence as main use, the biggest percentage of other uses (mainly
primary and secondary sector) and the biggest percentage of factory-plant uses.
Municipalities that diachronically are decreased numerically and tend to evolve in
municipalities of A group.
Group C: In this group, municipalities have the biggest population density. They
constitute the biggest part the capital, as they have the biggest percentage of residence
as a mixed use, the smaller percentage of other uses, as well as the biggest percentage of
shops-offices comparing with the rest of the groups. Residence as mixed use implies the
intense urban nature. It is the final group in which municipalities evolve to.
Group D: Municipalities in their majority perimetrically of the capital, with
population density considerably bigger than the average and percentages of building
uses with values in between (intermediate) of other groups. It is the municipalities that
are found in dynamic development and period of transition and change of their
characteristics. These municipalities evolve in group C in their majority .
With the appropriate digital map and the use of a GIS the groups were rendered
in maps 1, 2, 3, and 4 for years 1961, 1971, 1981 and 1991 respectively. One of the
problems of choropleth maps is that the depiction of distinguishable colours between
regions implies abrupt changes between them, while the transition is not usually so
abrupt (Tyner, 1992). The colour depiction of the FL groups constitutes a modern field
of experimentations and research (Nakakiji 1998; Jiang 1997; Bastin et al. 1997), as
until today there has not yet been established a common way of depiction. For the
depiction of the municipalities, the basic colours of characteristic groups were initially
determined and then the suitable colour that results from the gradual escalation of these
colours was attributed in each municipality.
The following conclusions per decade derive from analyzing and comparing
diachronically the results:
Map 1 (1961): The majority of municipalities approximates in groups A, B,
whiles the municipalities mainly characterized by groups C and D, are aggregated round
the centre of city. It is the period when the massive urbanisation has begun in Athens
(decade 1950) and is also continued during the 60's.

14
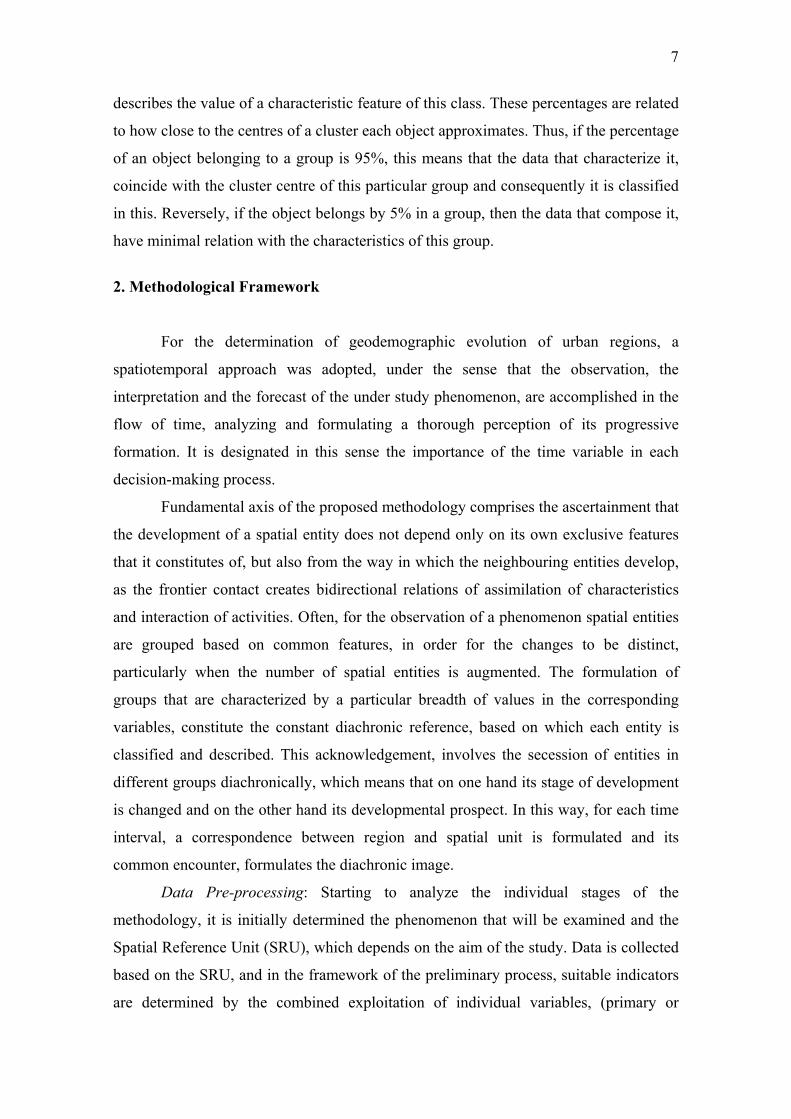
Map 2 (1971): The status round the centre of the prefecture is altered with the
more important differentiations to the western and in south of the capital, where the
increase of the population during the period 1961-71 is remarkable. The municipalities
which evolved into another group are found mainly perimetrically the centre of the city,
while the population density remaining constant in most of them.
Map 3 (1981): The number of municipalities that approximates group C is
increased characteristically, with reduction of all other groups. Since the middle 70s and
up to the beginning of 80s, the suburbanization began, that is to say the choice of
residence far from the city centre mainly to seek a better quality of life.
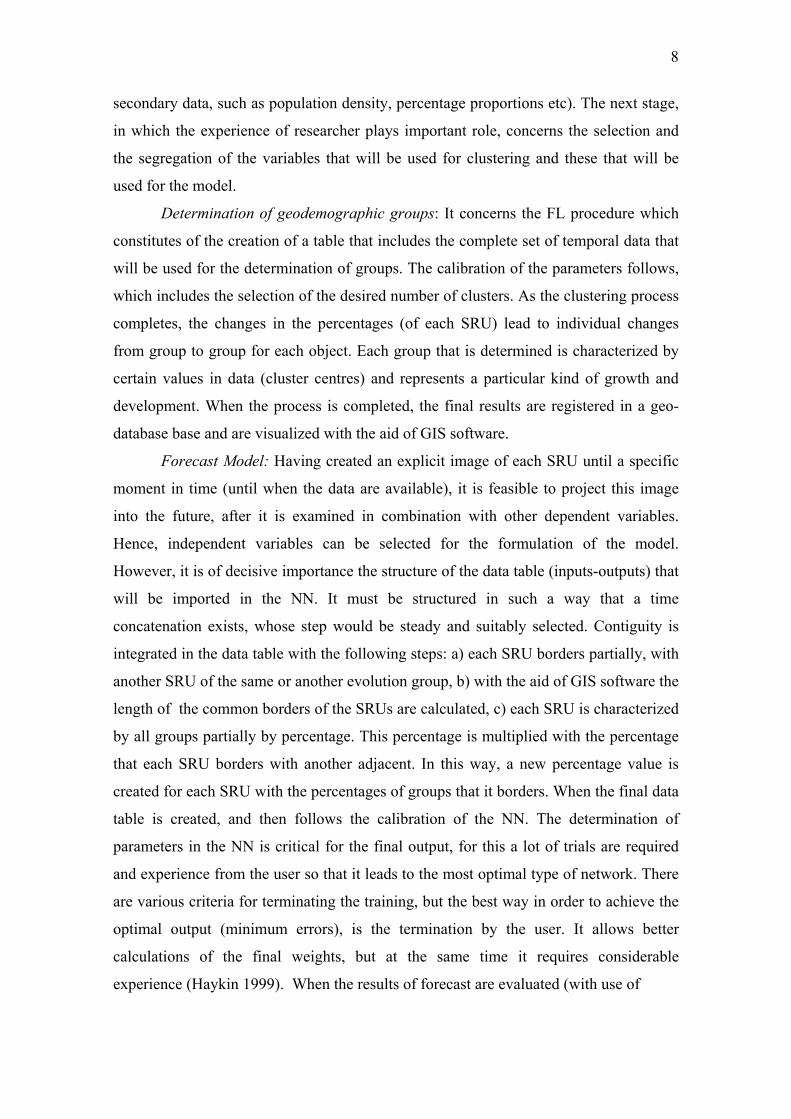
Map 4 (1991): Most municipalities that in 1961 were characterized by group
B, have altered their geodemographic profile and have evolved towards group A, while
enough municipalities approximating group D, have derived from municipalities of
group A. During the previous decade the total population increase was practically null,
but there were internal population movements. Changes are also observed in coastal
municipalities (seasonal residences).
Map 1: Geodemographic evolution of municipalities in the year 1961
UNIVERSITY OF THESSALYDEPARTMENT OF PLANNING & REGIONAL DEVELOPMENT LABORATORY OF SPATIAL ANALYSIS & THEMATIC CARTOGRAPHY
Source: Mapped by the authors
M1
MOUNTAIN
COASTAL LINE
PREFECTURE BOUNDARIES 0 10 205
KM
±
MUNICIPALITYBOUNDARIES
GEODEMOGRAPHIC EVOLUTION OF MUNICIPALITIES
GROUP - COLOUR CORRESPODENCE
C D A B
PREFECTURE OF ATTICA 1961
15
Map 2: Geodemographic evolution of municipalities in the year 1971
±
UNIVERSITY OF THESSALYDEPARTMENT OF PLANNING & REGIONAL DEVELOPMENT LABORATORY OF SPATIAL ANALYSIS & THEMATIC CARTOGRAPHY
Source: Mapped by the authors
M2
MOUNTAIN
COASTAL LINE
PREFECTURE BOUNDARIES
MUNICIPALITYBOUNDARIES
GEODEMOGRAPHIC EVOLUTION OF MUNICIPALITIES
GROUP - COLOUR CORRESPODENCE
C D A B
PREFECTURE OF ATTICA 1971
Map 3: Geodemographic evolution of municipalities in the year 1981
±
UNIVERSITY OF THESSALYDEPARTMENT OF PLANNING & REGIONAL DEVELOPMENT LABORATORY OF SPATIAL ANALYSIS & THEMATIC CARTOGRAPHY
Source: Mapped by the authors
M3
MOUNTAIN
COASTAL LINE
PREFECTURE BOUNDARIES
MUNICIPALITYBOUNDARIES
GEODEMOGRAPHIC EVOLUTION OF MUNICIPALITIES
GROUP - COLOUR CORRESPODENCE
C D A B
PREFECTURE OF ATTICA 1981
16
Map 4: Geodemographic evolution of municipalities in the year 1991
±
0 10 205KM
UNIVERSITY OF THESSALYDEPARTMENT OF PLANNING & REGIONAL DEVELOPMENT LABORATORY OF SPATIAL ANALYSIS & THEMATIC CARTOGRAPHY
Source: Mapped by the authors
M4
MOUNTAIN
COASTAL LINE
PREFECTURE BOUNDARIES
MUNICIPALITYBOUNDARIES
GEODEMOGRAPHIC EVOLUTION OF MUNICIPALITIES
GROUP - COLOUR CORRESPODENCE
C D A B
PREFECTURE OF ATTICA 1991
The above remarks coincide to a great extent with corresponding researches,
which are referred to relative, with the urban geography of Attica, literature (Maloutas
2000; Leontidou 1996). Generally the more important changes of groups are noted
perimetrically the centre of the city and along the coastal zone. The analysis of situation
of municipalities from 1961 until 1991 revealed that group transition follows a specific
pattern. Thus municipalities of group B evolve in group A, then in group D and finally
in group C. This constitute an important observation, for further and extensive
observation and investigation of each period of development and each municipality
separately.
3.3 Geodemographic evolution Forecast – NN model application
As it was earlier quoted outlined, the first step before the NN selection and
calibration is the creation of an appropriate data table for training. Following the
directions of the proposed methodology, the length of common borders of
municipalities was calculated with the aid of a GIS. As a next step, for each

17
municipality was calculated the percentage that it borders with each of the groups A, B,
C and D. In these features the percentages of adjacency with sea and mountain were
added, as well as the percentage of the area of each municipality on the total area of the
prefecture. The selection of the appropriate NN was made possible after successive
trials at the duration of which there were determined the most optimal parameters. The
network was trained and it was tested so that the smallest errors were ensured. Then
with the application of the NN the forecast of geodemographic groups of municipalities
for the 2001 was accomplished. Then followed the 2011 forecast of municipalities
where, the data that resulted from 2001 data output were used. The mean value of the
linear correlation coefficient for the 4 columns that were forecasted was r = 96.3 %.
Considering the small number of training data that were available, the 4 columns (one
for each group) that were forecasted have relatively small errors, something which
ensures a reliable forecast. The results of forecast are illustrated in maps 5 and 6, for
2001 and 2011 respectively. By observing the forecast maps the following remarks are
made:
Map 5 (2001): The municipalities that approximate group C increase, while
they of group B, continue decreasing and evolve into group A. Noteworthy is the
tendency in increase of population density to eastern. Generally the situation that is
illustrated in this forecast map is representative of the current reality in the prefecture
Attica, while the development processes of the wider region are in progress and are
expected to cause new changes in the next years.
Map 6 (2011): A polarity situation is shaped in the prefecture, between
municipalities of urban character (groups C,D), and municipalities with the residence as
main use (mainly seasonal, group A).

18
Map 5: Geodemographic evolution of municipalities in the year 2001
58
0 10 205KM
±
UNIVERSITY OF THESSALYDEPARTMENT OF PLANNING & REGIONAL DEVELOPMENT LABORATORY OF SPATIAL ANALYSIS & THEMATIC CARTOGRAPHY
Source: Mapped by the authors
M5
MOUNTAIN
COASTAL LINE
PREFECTURE BOUNDARIES
MUNICIPALITYBOUNDARIES
GEODEMOGRAPHIC EVOLUTION OF MUNICIPALITIES
GROUP - COLOUR CORRESPODENCE
C D A B
PREFECTURE OF ATTICA 2001
Map 6: Geodemographic evolution of municipalities in the year 2011
0 10 205KM
±
UNIVERSITY OF THESSALYDEPARTMENT OF PLANNING & REGIONAL DEVELOPMENT LABORATORY OF SPATIAL ANALYSIS & THEMATIC CARTOGRAPHY
Source: Mapped by the authors
M6
MOUNTAIN
COASTAL LINE
PREFECTURE BOUNDARIES
MUNICIPALITYBOUNDARIES
GEODEMOGRAPHIC EVOLUTION OF MUNICIPALITIES
GROUP - COLOUR CORRESPODENCE
C D A B
PREFECTURE OF ATTICA 2011
19
Summarising the overall evolution progress from 1961 until 2011, it is clear the
trend of further increase of groups C, D and the reduction of group B. Group C has
regularly augmentative trends until 1991, where henceforth it reaches in high levels
which it tends to maintain in the next years. The continuing diminishing number of
municipalities of group B and the increasing number of municipalities that approaches
group A, show that the prefecture obtains a bipolar character, with the sovereignty of
urban uses and exclusive residence uses in the coastal municipalities. The quantitave
stability of group D, which constitute municipalities that are found mainly regionally
the city centre, shows that there exists a number of municipalities that represent
corresponding dynamics. They are the municipalities that probably in the future will
evolve in group C and practically define the city limits per decade. The capital
maintains the dynamics and it cause changes not only in its limits, but also in the entire
prefecture. Population density remains constant in the municipalities round Athens,
while in the rest of the prefecture the densities tend to reach the average, designating a
relatively balanced spatiotemporal distribution.
Even if the results of fuzzy classification and subsequently the forecast are
offered for the deduction of multiple conclusions, further analysis and annotation of
maps escapes from the framework of this present paper, as it could constitute a separate
study.
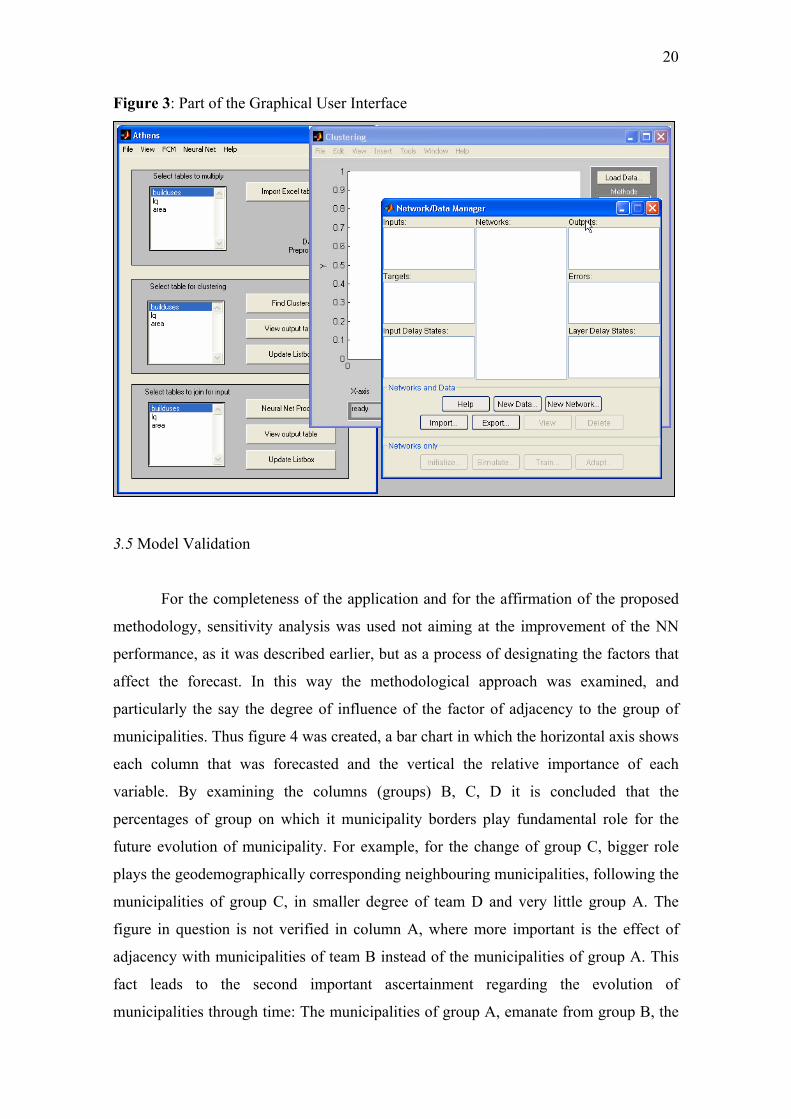
3.4 User interface
For facilitation of the process of applying the methodology, an interface (Figure
3) was developed, with the help of which the process of treatment given and the export
of final results are easier. The interface incorporates three individual processes of the
methodology: a) the pre-processing of data, and the configuration of suitable tables for
clustering, b) the clustering process with use of the FCM algorithm, and the
configuration of input-output tables of the NN and c) the import of data in the model,
the choice of suitable parameters and the application in the new data. Thus with the help
interface are exported the final results for the illustration in a GIS environment.
20
Figure 3: Part of the Graphical User Interface
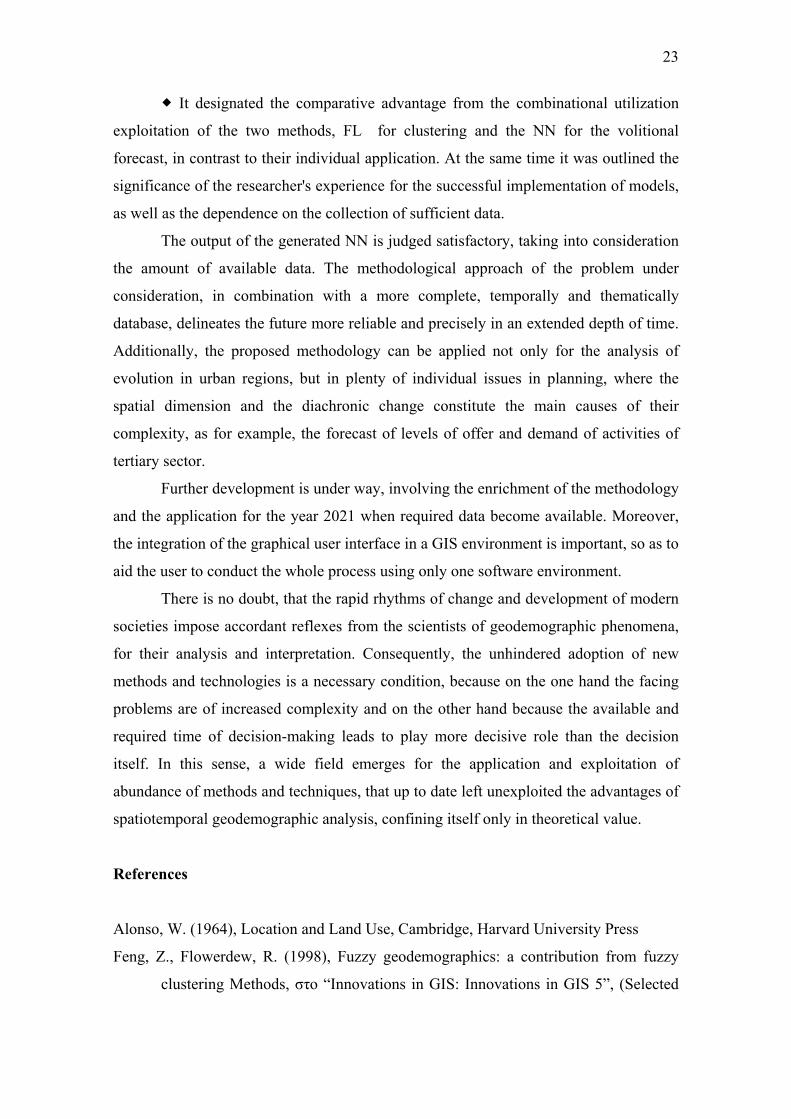
3.5 Model Validation
For the completeness of the application and for the affirmation of the proposed
methodology, sensitivity analysis was used not aiming at the improvement of the NN
performance, as it was described earlier, but as a process of designating the factors that
affect the forecast. In this way the methodological approach was examined, and
particularly the say the degree of influence of the factor of adjacency to the group of
municipalities. Thus figure 4 was created, a bar chart in which the horizontal axis shows
each column that was forecasted and the vertical the relative importance of each
variable. By examining the columns (groups) B, C, D it is concluded that the
percentages of group on which it municipality borders play fundamental role for the
future evolution of municipality. For example, for the change of group C, bigger role
plays the geodemographically corresponding neighbouring municipalities, following the
municipalities of group C, in smaller degree of team D and very little group A. The
figure in question is not verified in column A, where more important is the effect of
adjacency with municipalities of team B instead of the municipalities of group A. This
fact leads to the second important ascertainment regarding the evolution of
municipalities through time: The municipalities of group A, emanate from group B, the

21
municipalities of group D, from the A and C from the D, as it was also recorded at the
annotation of maps, designating a geodemographic concatenation in the framework of
diachronic development of a municipality.
Figure 4: Sensitivity analysis examining the contiguity factor
0,0
0,1
0,1
0,2
0,2
0,3
0,3
0,4
0,4
0,5
0,5
A B C D
Border A Border B Border C Border D
Source: Calculated by authors
As it was underlined earlier, the advantage of determination of geodemographic
groups with the help of FL is that each municipality does not belong exclusively in one
group only, but belongs with a percentage in each group. Having forecasted the group in
which each municipality belong, important information is acquired on the tendency of
population trends and on the dynamics of building uses in the next decades.
4. Summit
The future development of urban regions traditionally constitutes a challenge
for the planning process and regional growth. In this sense SDSS are required that will
be characterized by increased capabilities of analysis, and will combine classic and
contemporary approaches and will lead to effective and thorough strategies of defining
solutions for each problem.

22
The proposed methodological framework is characterized by its simple and
simultaneously dynamic structure, not only as far as it concerns the model, but also for
easy data manipulation of. It can be adapted in a variety of spatial phenomena, and
depending on the problem and each objective, it can incorporate an important number of
variables, with the condition of the existence of a sufficient number of elements for the
training procedure. FL proved particularly effective for clustering, since each SRU had
its own separate profile for each moment in time. Thus, not only a complete picture of
the prefecture for each interval was shaped, but also the diachronic change in percentage
revealed the future trends for each municipality separately. In equivalence, the added
value of NN is not limited exclusively in the simulation of complex and combinational
phenomena, but designates the importance and the degree of influence of all parameters
in the final result.
The conclusions of this paper have a twofold importance. As far as the
application is concerned, they have a direct practical and explanatory value for the
prefecture of Attica itself, regarding to the trends that will prevail in the municipalities,
for their demographic development and the building use changes in the next decades.
On the other hand the significance, the friendliness and the effectiveness of
contemporary methods and methodologies are outlined, supported by information
technology in the approach and analysis of spatial phenomena. Having in mind these
observations, the individual conclusions of this research are summarised as follows:
Contemporary methods were applied for the analysis of geodemographic
evolution through a spatiotemporal process, utilizing techniques that have been
developed during the last years and can be turned into an important advantage in
problems where the big volume of data of and the complicated mathematic calculations
had them placed in the research margin.
It was outlined that as long as the databases of geodemographic data are
enriched quantitatively and qualitatively, so much more the aid of contemporary
methods and techniques is required for the extensive and unhindered exploitation of
information that they comprise.
Within the framework of the proposed methodological approach, concessions
and compromises, that are often encountered in models formulated using methods of
statistical analysis are avoided. On the contrary, the real interaction of data is revealed
during the process of training by the corresponding features.
23
It designated the comparative advantage from the combinational utilization
exploitation of the two methods, FL for clustering and the NN for the volitional
forecast, in contrast to their individual application. At the same time it was outlined the
significance of the researcher's experience for the successful implementation of models,
as well as the dependence on the collection of sufficient data.
The output of the generated NN is judged satisfactory, taking into consideration
the amount of available data. The methodological approach of the problem under
consideration, in combination with a more complete, temporally and thematically
database, delineates the future more reliable and precisely in an extended depth of time.
Additionally, the proposed methodology can be applied not only for the analysis of
evolution in urban regions, but in plenty of individual issues in planning, where the
spatial dimension and the diachronic change constitute the main causes of their
complexity, as for example, the forecast of levels of offer and demand of activities of
tertiary sector.
Further development is under way, involving the enrichment of the methodology
and the application for the year 2021 when required data become available. Moreover,
the integration of the graphical user interface in a GIS environment is important, so as to
aid the user to conduct the whole process using only one software environment.
There is no doubt, that the rapid rhythms of change and development of modern
societies impose accordant reflexes from the scientists of geodemographic phenomena,
for their analysis and interpretation. Consequently, the unhindered adoption of new
methods and technologies is a necessary condition, because on the one hand the facing
problems are of increased complexity and on the other hand because the available and
required time of decision-making leads to play more decisive role than the decision
itself. In this sense, a wide field emerges for the application and exploitation of
abundance of methods and techniques, that up to date left unexploited the advantages of
spatiotemporal geodemographic analysis, confining itself only in theoretical value.
References
Alonso, W. (1964), Location and Land Use, Cambridge, Harvard University Press
Feng, Ζ., Flowerdew, R. (1998), Fuzzy geodemographics: a contribution from fuzzy
clustering Methods, στο “Innovations in GIS: Innovations in GIS 5”, (Selected

24
Papers from the fifth National conference on GIS Research UK),
Taylor&Francis, UK.
Feng, S., Xu L. (1999), "An Intelligent Decision Support System for Fuzzy
Comprehensive Evaluation of Urban Development", Expert systems with a
pplications, 16 (1999) 21-32, Elsevier Science
Haykin, S. (1999), Neural Networks: A comprehensive foundation, Prentice-Hall, New
Jersey.
Hewitson, B.-Crane, R. (1994), Neural Nets: Application in Geography, Kluwer
Academic Publishers, Netherlands.
Jones, R. H. (1990), Population Geography, Guilford Press, Ν. Υόρκη
Kosko, B. (1997), Fuzzy Logic Η Νέα Επιστήµη, Εκδόσεις Σύναλµα, Αθήνα
Kropp, J. (1998), "A Neural Network Approach to the Analysis of City Systems",
Applied Geography, Vol. 18, No 1, pp. 83-96, Elsevier Science Ltd.
Leontidou, L. (1996), ‘‘Alternatives to modernism in (southern) urban theory:
Exploring in-between spaces’’, International Journal of Urban and Regional
Research, 20/2, 178-195.
Makse, A., Andrade, S., Batty, M., Havlin, S., Stanley, E. (1998), "Modelling Urban
Growth Patterns with Correlated Percolation", Phys. Rev. E 58, 7054-7062.
ΜΙT (1997a), Data Engine: Overview and user Manual, Management Intelligenter
Technologien, Germany.
ΜΙT (1997b), Data Engine: Τutorials and Theory manual, Management Intelligenter
Technologien Germany.
Openshaw, S. (1989), “Making Geodemographics more sophisticated”, Journal Market
Research Society, 31.
Openshaw, S. (1997), Artificial Intelligence in Geography, John Wiley & Son Ltd,
London.
Principe, J.C., Euliano, N.R., Lefebvre, W.C. (2000), Neural and Adaptive Systems:
Fundamentals Through Simulations, John Wiley & Sons, Inc.
Rocky Mountain Institute (1998), Green development: integrating ecology and real
estate, John Wiley and Sons, New York
USGS (2002), "Urban Dynamics Research Program. Analysis of Land Use Change in
Urban Environments", http://landcover.usgs.gov/urban/intro.html

25
Visvalingam, M. (1991), Areal units and the linking of data: some conceptual issues, in
Worrall Les “Spatial Analysis and Spatial Policy using Geographic Information
Systems”, Belhaven Press, London.
Waddell, P. (2002), "Urban Simulation Project", http://www.urbansim.org/