Embed Size (px)
Citation preview
S
TSa
b
c
d
e
f
g
h
a
ARRA
KSGBSSY
1
gtpcfshry
U
0d
Field Crops Research 119 (2010) 161–174
Contents lists available at ScienceDirect
Field Crops Research
journa l homepage: www.e lsev ier .com/ locate / fc r
imulation of soybean growth and yield in near-optimal growth conditions
.D. Setiyonoa, K.G. Cassmana,∗, J.E. Spechta, A. Dobermannb, A. Weissc, H. Yangd,
.P. Conleye, A.P. Robinsonf, P. Pederseng,1, J.L. De Bruinh
Department of Agronomy and Horticulture, University of Nebraska-Lincoln, P.O. Box 830915, Lincoln, NE 68583-0915, USAInternational Rice Research Institute, DAPO Box 7777, Metro Manila, PhilippinesSchool of Natural Resources, University of Nebraska-Lincoln, P.O. Box 830728, Lincoln, NE 68583-0728, USAMonsanto Company, 800 N. Lindbergh Blvd., St. Louis, MO 6316, USADepartment of Agronomy, University of Wisconsin, 1575 Linden Drive, Madison, WI 53706, USADepartment of Agronomy, Purdue University, 915 West State St., West Lafayette, IN 47907-2054, USADepartment of Agronomy, Iowa State University, 2104 Agronomy Hall, Ames, IA 50011, USAPioneer Hi-Bred International, Inc., 21888 N 950th Rd., Adair, IL 61411, USA
r t i c l e i n f o
rticle history:eceived 13 May 2010eceived in revised form 19 June 2010ccepted 5 July 2010
eywords:oybeanlycine maxiomass yieldeed yieldimulation model
a b s t r a c t
SoySim is a new soybean (Glycine max, L. Merr) simulation model that combines existing approaches forthe simulation of photosynthesis, biomass accumulation and partitioning with several new components:(i) flowering based on floral induction and post-induction processes, (ii) leaf area index based on logisticexpansion and senescence functions, (iii) integration of canopy photosynthesis using a beta function, and(iv) yield simulation based on assimilate supply and seed number. Simulation of above ground dry matter(ADM) and seed yield by SoySim were validated against data from field studies at Lincoln (NE), Mead (NE),Whiting (IA), and West Lafayette (IN) that included 147 site-year-cultivar-planting date-plant-plant pop-ulation combinations. In each of the four field studies, agronomic management other than planting dateand plant population was optimized to achieve growth with minimal limitation from pests, nutrients, orother controllable factors. SoySim requires just two genotype-specific and two crop management-specific
ield potential input parameters and yet provides reasonable accuracy in simulating growth and yield under optimumgrowth conditions across a wide range of sowing dates, plant population, and yield (2.5–6.4 Mg ha−1) inthe North-Central U.S. Corn Belt. Simulated seed yield had a RMSE of 0.46 Mg ha−1. Few cultivar-specificparameter input requirements, lack of requirements for specification of key developmental stages, andmechanistic treatment of phenological development, canopy photosynthesis, and seed dry matter accu-
antaop ma
mulation give several advevaluate the impact of cr
. Introduction
Yield potential is defined as the yield obtained when a crop isrown under field conditions with management practices that seeko eliminate growth reductions from nutrient deficiencies, insectests, diseases, weeds, and moisture deficits or excess throughoutrop growth—from planting to maturity (Evans, 1993). Under theseavorable conditions, crop growth and yield are limited only by
olar radiation and temperature. Soybean yields of 5.0–6.6 t ha−1ave been reported from a few replicated field studies in whichesearchers used crop and soil management practices to achieveields near the yield potential ceiling, and yields at the high end of
∗ Corresponding author. Tel.: +1 402 472 5554; fax: +1 402 472 7904.E-mail address: [email protected] (K.G. Cassman).
1 Current address: Syngenta Crop Protection, 2415 Clayton Drive, Ames, IA 50010,SA.
378-4290/$ – see front matter © 2010 Elsevier B.V. All rights reserved.oi:10.1016/j.fcr.2010.07.007
ges to SoySim for use in research and for use as a decision-support tool tonagement options on yield potential in favorable environments.
© 2010 Elsevier B.V. All rights reserved.
this range have been reported in sanctioned on-farm yield contests(Cooper, 2003; Specht et al., 1999). At issue is whether soybeangrowth simulation models have the ability to simulate soybeanyields when the crop is grown in a manner that allows full expres-sion of its yield potential.
A process-based soybean model must simulate phenology,biomass partitioning among organs, and yield formation. Accu-racy in simulating biomass and grain yields across a wide range ofenvironments requires an understanding of the biophysical deter-minants of these ecophysiological processes and incorporatingsuch knowledge in mathematical formulations that constitute themodel. To ensure that a model is credible in simulating yields overthe full environmental range of possible yields, it is important to
evaluate model performance under high-yield conditions whereyields approach the yield potential ceiling, as well as in more stress-ful environments that produce lower yield levels.Yet, relatively few publications documenting high-yield soy-bean environments (defined as yield at >4.5 Mg ha−1 range) can
162T.D
.Setiyonoet
al./FieldCrops
Research
119(2010)
161–174
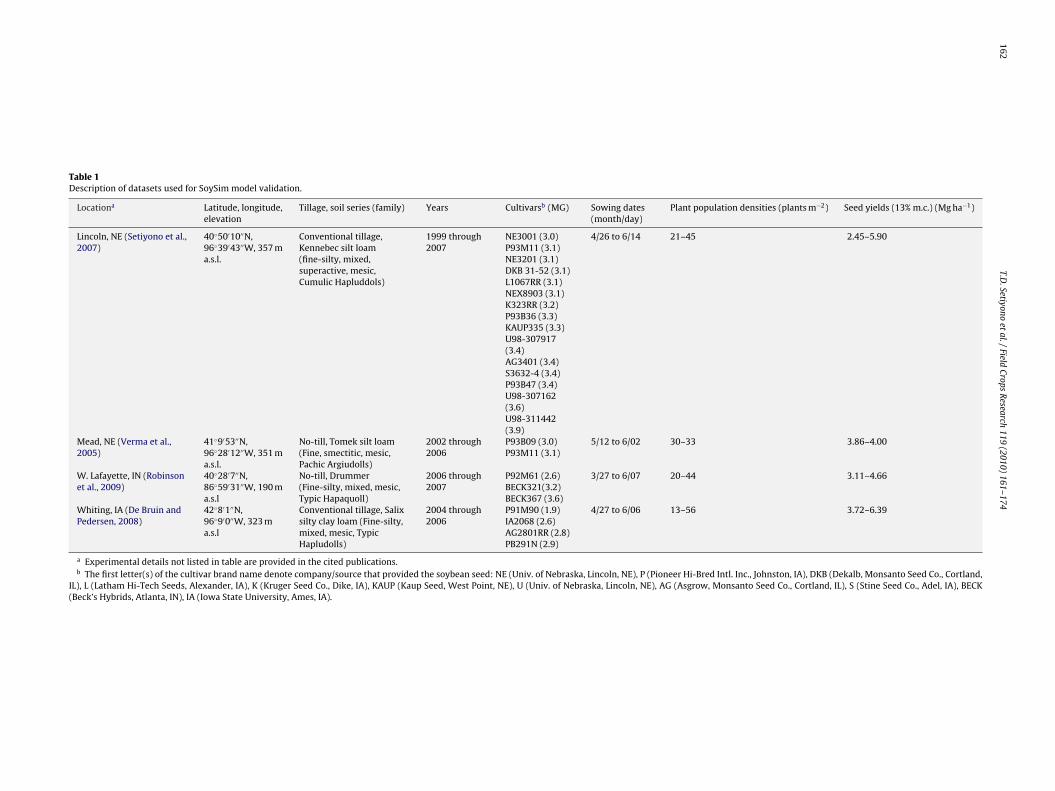
Table 1Description of datasets used for SoySim model validation.
Locationa Latitude, longitude,elevation
Tillage, soil series (family) Years Cultivarsb (MG) Sowing dates(month/day)
Plant population densities (plants m−2) Seed yields (13% m.c.) (Mg ha−1)
Lincoln, NE (Setiyono et al.,2007)
40◦50′10′′N,96◦39′43′′W, 357 ma.s.l.
Conventional tillage,Kennebec silt loam(fine-silty, mixed,superactive, mesic,Cumulic Hapluddols)
1999 through2007
NE3001 (3.0)P93M11 (3.1)NE3201 (3.1)DKB 31-52 (3.1)L1067RR (3.1)NEX8903 (3.1)K323RR (3.2)P93B36 (3.3)KAUP335 (3.3)U98-307917(3.4)AG3401 (3.4)S3632-4 (3.4)P93B47 (3.4)U98-307162(3.6)U98-311442(3.9)
4/26 to 6/14 21–45 2.45–5.90
Mead, NE (Verma et al.,2005)
41◦9′53′′N,96◦28′12′′W, 351 ma.s.l.
No-till, Tomek silt loam(Fine, smectitic, mesic,Pachic Argiudolls)
2002 through2006
P93B09 (3.0)P93M11 (3.1)
5/12 to 6/02 30–33 3.86–4.00
W. Lafayette, IN (Robinsonet al., 2009)
40◦28′7′′N,86◦59′31′′W, 190 ma.s.l
No-till, Drummer(Fine-silty, mixed, mesic,Typic Hapaquoll)
2006 through2007
P92M61 (2.6)BECK321(3.2)BECK367 (3.6)
3/27 to 6/07 20–44 3.11–4.66
Whiting, IA (De Bruin andPedersen, 2008)
42◦8′1′′N,96◦9′0′′W, 323 ma.s.l
Conventional tillage, Salixsilty clay loam (Fine-silty,mixed, mesic, TypicHapludolls)
2004 through2006
P91M90 (1.9)IA2068 (2.6)AG2801RR (2.8)PB291N (2.9)
4/27 to 6/06 13–56 3.72–6.39
a Experimental details not listed in table are provided in the cited publications.b The first letter(s) of the cultivar brand name denote company/source that provided the soybean seed: NE (Univ. of Nebraska, Lincoln, NE), P (Pioneer Hi-Bred Intl. Inc., Johnston, IA), DKB (Dekalb, Monsanto Seed Co., Cortland,
IL), L (Latham Hi-Tech Seeds, Alexander, IA), K (Kruger Seed Co., Dike, IA), KAUP (Kaup Seed, West Point, NE), U (Univ. of Nebraska, Lincoln, NE), AG (Asgrow, Monsanto Seed Co., Cortland, IL), S (Stine Seed Co., Adel, IA), BECK(Beck’s Hybrids, Atlanta, IN), IA (Iowa State University, Ames, IA).
ops Re
btwfiSatni(aAict
ppU(eestyrmtcsittcLair
gySmaSghiamtmfivrudo
nSaniet
T.D. Setiyono et al. / Field Cr
e found in the scientific literature (Salvagiotti et al., 2008). Givenhe limited availability of data, it is not surprisingly that the mostidely used soybean models have not been validated againsteld observations from high-yield environments. Models such asinclair-Soybean (Sinclair, 1986) and CROPGRO-Soybean (Boote etl., 1998a) have, of course, been used to evaluate soybean produc-ion in many lower yield environments (1–3 Mg ha−1), involvingow-obsolete soybean cultivars (i.e. Williams and Bragg, released
n the 1980s) grown at a limited number of sites, cultivars, and yearsBoote et al., 1997; Carbone et al., 2003; Irmak et al., 2000; Jagtapnd Jones, 2002; Muchow and Sinclair, 1986; Wang et al., 2003).nd though Spaeth et al. (1987) did use high yield environments
n their evaluation of Sinclair-Soybean, their experiments involvedrop rotations, management practices and cultivars not typical ofhose widely used in the U.S. Corn Belt.
The U.S. Corn Belt region is a particularly important soybean-roducing region because it accounts for about 75% of U.S. soybeanroduction (2007–2009 National Agricultural Statistics Service,SDA, http://www.nass.usda.gov) and 30% of global production
2007 FAOSTAT, FAO, Rome, Italy, http://faostat.fao.org). Pedersent al. (2004) used CROPGRO-Soybean to simulate the effect ofnvironment and management on soybean yield under irrigatedystems in north-central U.S. Corn Belt, and the authors notedhe relatively poor agreement between observed and simulatedields (Fig. 3, Pedersen et al., 2004). Moreover, CROPGRO-Soybeanequires a large number of cultivar-specific inputs to initiate theodel, and gaining access to these parameters is difficult due
o difficulties in measuring them. For example, while most seedompanies provide information about the maturity group for eachoybean cultivar they sell, they do not routinely provide, and mayn fact not even have, information on cultivar-specific parame-ers required for CROPGRO-Soybean. Moreover, soybean cultivarurn-over in the North Central USA is rapid, which can render aultivar-specific coefficient only transiently useful for model use.ack of easy access to input parameters required by a crop model issignificant problem in that it limits the usefulness of that model
n decision support for crop producers, industry professionals, andesearchers.
Seed dry matter accumulation (hereafter referred to as seedrowth) is particularly crucial for accurate simulation in highield environments. This domain of relevance – a term used byinclair and Seligman (2000) in their discussion of new cropodels – and the need to have a soybean model that more
ccurately simulate seed growth, motivated development of theoySim model described in the present paper. When soybeans arerown with minimal limitation from biotic and abiotic stresses, weypothesized that seed growth is no longer source-limited, but
nstead becomes sink-limited. Seed growth processes, however,re dynamic and influenced by reproductive duration and environ-ental factors such as solar radiation and temperature which, in
urn, are influenced by sowing date (Bastidas et al., 2008). Existingodels rely on a fixed rate of increase in harvest index during seed-
lling (Sinclair-Soybean), a fixed partitioning coefficient (WOFOST,an Diepen et al., 1989), or a temperature-sensitive seed growthate (CROPGRO-Soybean). At issue, then, is whether the approachessed in these three models are sufficiently robust for accurate pre-iction of soybean yields in high yield systems across a wide rangef production environments in the North Central USA.
And while Sinclair-Soybean and WOFOST do not require a largeumber of cultivar-specific input parameters, vis-a-vis CROPGRO-oybean, they do require specification of initiation of flowering
nd physiological maturity for the cultivar being simulated. Hence,either model predicts phenological stages ex ante, which meansn-season decision-support is not possible with either model. Forxample, some fungicides are the most effective when applied athe R3 stage (beginning pod stage, Fehr and Caviness, 1977), but
search 119 (2010) 161–174 163
not so effective earlier or later (Blaine et al., 2005; Trybom andJeschke, 2008). Ability to project the calendar date of occurrenceof this stage, including in-season continuous updating of that dateusing a combination of real-time and historical weather data wouldgreatly facilitate the timely scheduling of labor and equipment forthis field operation.
Given the lack of soybean model validation in high-yield envi-ronments, and the motivation to create a soybean model requiringonly easily accessible cultivar-specific parameters, yet still pro-viding in-season projections of soybean crop phenology based onreal-time and historical weather data, our objectives were to (1)develop and validate a new soybean model – SoySim – designedwith new formulations for key processes such as phenology, LAI,and seed growth while minimizing the need for cultivar-specificparameters, (2) compare the new model with the existing soybeanmodels of CROPGRO-Soybean (representing a sophisticated cropmodel with extensive requirements for genotype-specific inputs),Sinclair-Soybean (representing a simpler model with few cultivar-specific inputs), and WOFOST (a generic crop model). As previouslynoted, the domain of relevance, for which SoySim was designedto accurately simulate, is a high-yield soybean environment. Suchenvironments are common in many locations across the U.S. CornBelt in most years, and particularly so in irrigated production sys-tems used in western areas. The emphasis in the present studywas to determine if SoySim, or any existing soybean model, couldreliably simulate growth and yield response with varied geno-type × environment × management practices. We speculate thatimproved formulations incorporated into SoySim for phenology,LAI, and seed growth would improve the simulation of soybean per-formance in these high-yield environments, even with relativelyfew cultivar-specific input parameters.
2. Materials and methods
2.1. Field experiments and photosynthesis measurements
Development and validation of SoySim relied on high qualitydata generated from well-managed field experiments super-vised by agronomists who were attempting to use crop and soilmanagement practices to minimize abiotic and biotic stresses.Such data were obtained from field experiments in Lincoln,NE (40◦50′10′′N, 96◦39′43′′W, 357 m above sea level), Mead, NE(41◦9′53′′N, 96◦28′12′′W, 351 m above sea level), W. Lafayette, IN(40◦28′7′′N, 86◦59′31′′W, 190 m above sea level), and Whiting, IA(42◦8′1′′N, 96◦9′0′′W, 323 m above sea level). Soybean (Glycine maxL. Merr) seed yield (at 13% moisture) in these experiments rangedfrom 2.4 to 6.4 Mg ha−1, with the lower yields associated with latesowing dates (Table 1). Experimental sites included both conserva-tion tillage and no-till residue management. The soybean cultivarsranged in maturity group (MG) from 1.9 to 3.9, which are typi-cal cultivar MGs used across the U.S. Corn Belt. Plant populationdensities at emergence varied from 13 to 56 plants m−2 (Table 1).Additional details about management of these field experimentswere described in Setiyono et al. (2007), Verma et al. (2005),Robinson et al. (2009), and De Bruin and Pedersen (2008).
Relationships between net photosynthesis and intercepted pho-tosynthetically active radiation (PAR) were evaluated in the 2004Lincoln field experiment with cultivar NE3001. Leaf photosynthe-sis was measured with a portable photosynthesis system LI6400(LI-COR, Lincoln, NE) on the uppermost fully expanded trifoliolate
leaf at 43 and 71 days after emergence. Measurements were madebetween 11:00 and 14:00. Mean relative humidity was 55% and57% on 43 and 71 days after emergence, respectively. On each day,measurements were taken on four representative plants from atreatment with optimal management (Setiyono et al., 2007). Mean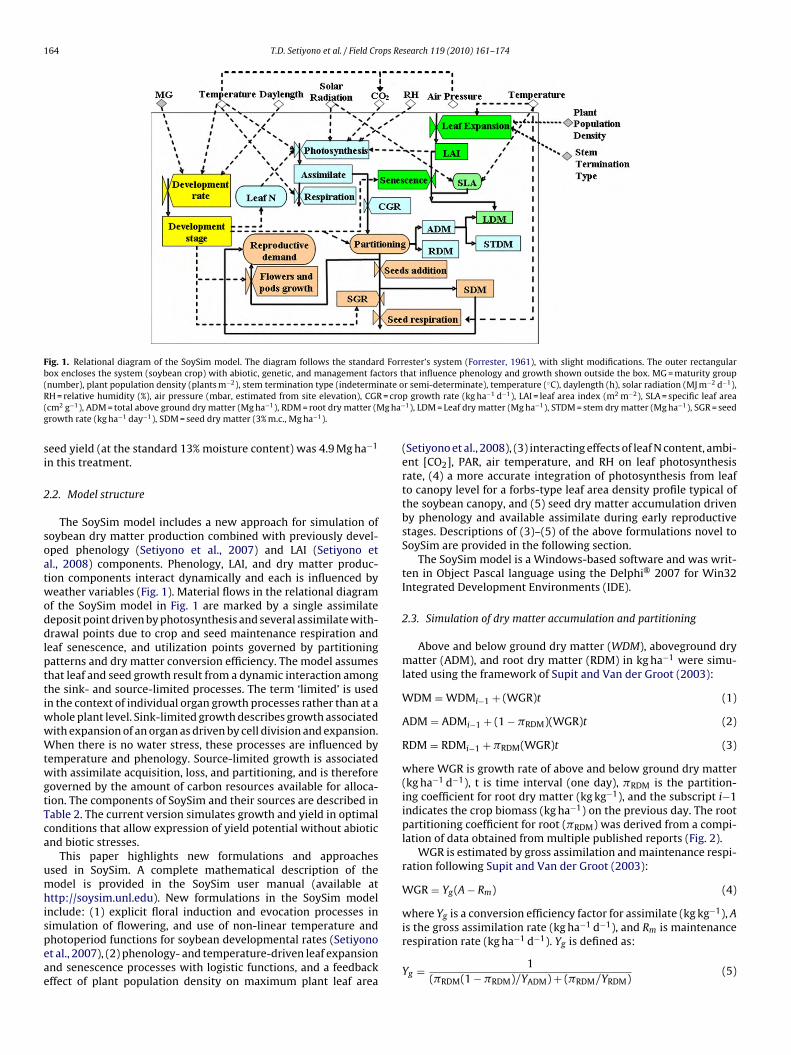
164 T.D. Setiyono et al. / Field Crops Research 119 (2010) 161–174
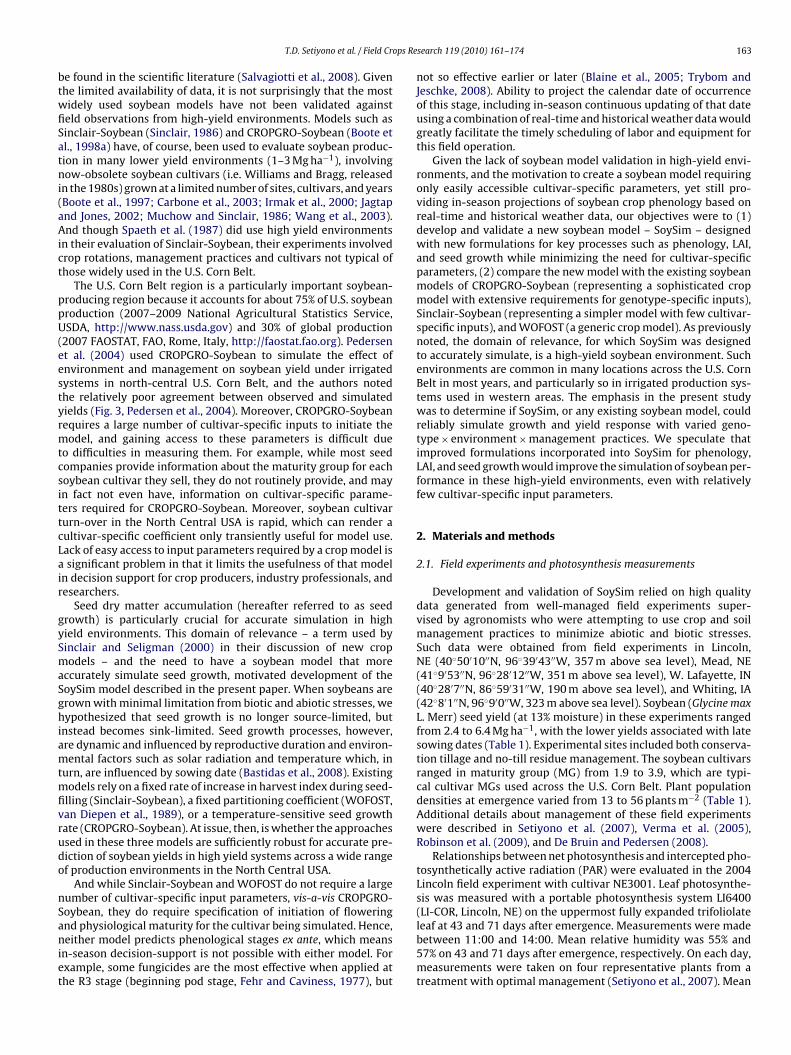
Fig. 1. Relational diagram of the SoySim model. The diagram follows the standard Forrester’s system (Forrester, 1961), with slight modifications. The outer rectangularbox encloses the system (soybean crop) with abiotic, genetic, and management factors that influence phenology and growth shown outside the box. MG = maturity group( nate oR = cro( g ha−
g
si
2
soatwoddlpttiwwWtwgtTca
umhispeae
number), plant population density (plants m−2), stem termination type (indetermiH = relative humidity (%), air pressure (mbar, estimated from site elevation), CGRcm2 g−1), ADM = total above ground dry matter (Mg ha−1), RDM = root dry matter (Mrowth rate (kg ha−1 day−1), SDM = seed dry matter (3% m.c., Mg ha−1).
eed yield (at the standard 13% moisture content) was 4.9 Mg ha−1
n this treatment.
.2. Model structure
The SoySim model includes a new approach for simulation ofoybean dry matter production combined with previously devel-ped phenology (Setiyono et al., 2007) and LAI (Setiyono etl., 2008) components. Phenology, LAI, and dry matter produc-ion components interact dynamically and each is influenced byeather variables (Fig. 1). Material flows in the relational diagram
f the SoySim model in Fig. 1 are marked by a single assimilateeposit point driven by photosynthesis and several assimilate with-rawal points due to crop and seed maintenance respiration and
eaf senescence, and utilization points governed by partitioningatterns and dry matter conversion efficiency. The model assumeshat leaf and seed growth result from a dynamic interaction amonghe sink- and source-limited processes. The term ‘limited’ is usedn the context of individual organ growth processes rather than at a
hole plant level. Sink-limited growth describes growth associatedith expansion of an organ as driven by cell division and expansion.hen there is no water stress, these processes are influenced by
emperature and phenology. Source-limited growth is associatedith assimilate acquisition, loss, and partitioning, and is therefore
overned by the amount of carbon resources available for alloca-ion. The components of SoySim and their sources are described inable 2. The current version simulates growth and yield in optimalonditions that allow expression of yield potential without abioticnd biotic stresses.
This paper highlights new formulations and approachessed in SoySim. A complete mathematical description of theodel is provided in the SoySim user manual (available at
ttp://soysim.unl.edu). New formulations in the SoySim modelnclude: (1) explicit floral induction and evocation processes in
imulation of flowering, and use of non-linear temperature andhotoperiod functions for soybean developmental rates (Setiyonot al., 2007), (2) phenology- and temperature-driven leaf expansionnd senescence processes with logistic functions, and a feedbackffect of plant population density on maximum plant leaf arear semi-determinate), temperature (◦C), daylength (h), solar radiation (MJ m−2 d−1),p growth rate (kg ha−1 d−1), LAI = leaf area index (m2 m−2), SLA = specific leaf area1), LDM = Leaf dry matter (Mg ha−1), STDM = stem dry matter (Mg ha−1), SGR = seed
(Setiyono et al., 2008), (3) interacting effects of leaf N content, ambi-ent [CO2], PAR, air temperature, and RH on leaf photosynthesisrate, (4) a more accurate integration of photosynthesis from leafto canopy level for a forbs-type leaf area density profile typical ofthe soybean canopy, and (5) seed dry matter accumulation drivenby phenology and available assimilate during early reproductivestages. Descriptions of (3)–(5) of the above formulations novel toSoySim are provided in the following section.
The SoySim model is a Windows-based software and was writ-ten in Object Pascal language using the Delphi® 2007 for Win32Integrated Development Environments (IDE).
2.3. Simulation of dry matter accumulation and partitioning
Above and below ground dry matter (WDM), aboveground drymatter (ADM), and root dry matter (RDM) in kg ha−1 were simu-lated using the framework of Supit and Van der Groot (2003):
WDM = WDMi−1 + (WGR)t (1)
ADM = ADMi−1 + (1 − �RDM)(WGR)t (2)
RDM = RDMi−1 + �RDM(WGR)t (3)
where WGR is growth rate of above and below ground dry matter(kg ha−1 d−1), t is time interval (one day), �RDM is the partition-ing coefficient for root dry matter (kg kg−1), and the subscript i−1indicates the crop biomass (kg ha−1) on the previous day. The rootpartitioning coefficient for root (�RDM) was derived from a compi-lation of data obtained from multiple published reports (Fig. 2).
WGR is estimated by gross assimilation and maintenance respi-ration following Supit and Van der Groot (2003):
WGR = Yg(A − Rm) (4)
where Yg is a conversion efficiency factor for assimilate (kg kg−1), A
is the gross assimilation rate (kg ha−1 d−1), and Rm is maintenancerespiration rate (kg ha−1 d−1). Yg is defined as:Yg = 1(�RDM(1 − �RDM)/YADM) + (�RDM/YRDM)
(5)
T.D. Setiyono et al. / Field Crops Research 119 (2010) 161–174 165
Table 2Description and source (if not new) of major SoySim components.
Component Source/Approach Step Driving variables
1. Vegetative developmental stages (V) STICSa, SOYDEVb Daily Tmean , P, MG, ST, R2. Reproductive developmental stages (R) SOYDEVb Daily Tmean , P, MG, ST, V3. Leaf area index (LAI) Logistic approachc Daily Phenology, Tmean
4.Dry matter accumulationa. Photosynthesis rate (Ps) Farquhard, Harleye, Yinf, WOFOSTg, Newh Hourly Rs , Phenology, RH, T, [CO2], [O2]b. Respiration rate (Rs) Farquhar, Harleye, Yinf, WOFOSTg Hourly T, ADM, RDM, Phenologyd. Partitioning (below and above ground dry matter) WOFOSTg, Newh,i Daily Phenologyc. Crop growth rates (CGR) WOFOSTg Daily Ps , Rs , ADMf. Yield formation
i. Sink size determination Newh Daily Phenology, Tmean , CGRii. Seed growth rate (SGR) Newh Hourly Phenology, Tmean
5. Weather data input (conversion of dailyto hourly weather data)
i. Temperature (T) WAVEj Daily Tmax , Tmin , Pii. Solar radiation (Rs) Michalskyk, KASM-KCl Daily B, ATMTR, Piii. Relative humidity (RH) Newh Daily Daily RH, Tmax , T
MG = maturity group (number). ST = stem termination type. ATMTR = atmospheric transmission. B = solar elevation angle (◦), P = daylength (h), Tmax = maximum daily temper-ature (◦C), Tmin = minimum daily temperature (◦C), Tmean = average daily temperature (◦C), [CO2] = ambient CO2 concentration (375 �l l−1), [O2] = ambient CO2 concentration(210 ml l−1). ADM = above ground dry matter (Mg ha−1). RDM = below ground (root) dry matter (Mg ha−1).
a Brisson et al. (2003).b Setiyono et al. (2007).c Setiyono et al. (2008).d Farquhar et al. (1980).e Harley et al. (1985).f Yin and van Laar (2005).g Boogard et al. (1998).h Setiyono et al. (this study).i Mayaki et al. (1976), Cassman et al. (1980), Roder et al. (1989), Watt and Evans (2003j de Wit et al. (1978).k Michalsky (1988).l Badescu (1997).
Fig. 2. Soybean root dry matter fraction of whole plant dry matter during thegrowing season based on Setiyono (2009, unpublished data, field experiment) andpublished data from experiments conducted in the field (Mayaki et al., 1976; Roderet al., 1989), greenhouse (Bozsa and Oliver, 1990; Cassman et al., 1980; Cheng et al.,2003; Watt and Evans, 2003), and growth chamber (Caba et al., 1999; Vessey andLayzell, 1990; Williams et al., 1981). Above-ground vegetative (V) and reproductive(R) developmental stages (Fehr and Caviness, 1977) are shown at top of the graph.The solid line is a composite mean of all reports, and represents the root dry matterfraction values used in SoySim.
), and Cheng et al. (2003).
where YADM and YRDM are conversion efficiency factors for assimi-late to ADM and RDM, respectively (kg kg−1), which were estimatedusing values from WOFOST and the calibration dataset (Section 2.4).Eq. (5) is a simplified version of the function described in Supit andVan der Groot (2003) in that Eq. (5) does not account for biomasspartitioning among structures such as stems, leaves, and storageorgans. Rm was sensitive to temperature as follows:
Rm = RmrQ10(T−Tr )/10 (6)
where Rmr is maintenance respiration (kg ha−1 d−1) at a referencetemperature (Tr) of 25 ◦C, Q10 is the fractional increase or decreasein respiration rate per 10 ◦C change in temperature, and T is tem-perature (◦C). Rmr was simulated as a function of biomass andmaintenance respiration coefficients for ADM and RDM:
Rmr = rADMADM + rRDMRDM (7)
where rADM and rRDM are maintenance respiration coefficients(kg kg−1 d−1) for ADM and RDM, respectively. These coefficientswere also estimated using values from WOFOST and the calibrationdataset (Section 2.4).
Photosynthesis converts six moles of CO2 into one mole of car-bohydrate:
6CO2 + 6H2Olight−→C6H12O6 + 6O2 (8)
thus the gross assimilation rate is calculated based on the carbonexchange rate as:
A = Pn
(180264
)(9)
where Pn is daily canopy photosynthesis rate (kg CO2 ha−1 d−1) andthe term 180/264 represents the molecular weight ratio of onemole of carbohydrate to 6 moles of CO2. The conversion term iscommonly simplified to 30/44 kg carbohydrate kg−1 CO2.
1 ops Re
siml(Sdtaea(atftOoesS
a
S
wwtao1
tcE
S
�
w(catrsgEf
�
wgxpevro
A
wg
66 T.D. Setiyono et al. / Field Cr
Pn is calculated by integrating the hourly net canopy photo-ynthesis (Pc) rate over the day. Pc is simulated by integration ofndividual leaf photosynthesis rates over the whole canopy using a
ulti-layer approach that distinguishes between sunlit and shadedeaves, and separation of PAR into direct and diffuse componentsGoudriaan, 1986; Kropff and van Laar, 1993; Spitters et al., 1986;upit and Van der Groot, 2003). Sunlit leaves receive both direct andiffuse components while shaded leaves receive only diffuse radia-ion (Supit and Van der Groot, 2003). Photosynthesis rate for sunlitnd shaded leaves is simulated as function of absorbed PAR, ambi-nt CO2 concentration ([CO2]), temperature, relative humidity (RH)nd leaf N (g m−2) using a modified C3 plants photosynthesis modelFarquhar et al., 1980). Relationships between net photosynthesisnd intercepted PAR or ambient [CO2], derived from measurementsaken in this study (as mentioned earlier), were used in theseunctions, whereas the relationship between light-saturated pho-osynthesis and temperature was taken from Harley et al. (1985).ptimal leaf N (not limited by soil nutrient availability or symbi-tic N fixation in root nodules) at different phenological stages wasstimated from the data of Boote et al. (1998b), and the relation-hip between leaf photosynthetic rate and leaf [N] was taken frominclair and Horie (1989).
Seed dry matter is simulated by estimating the number of seedsnd the mean individual seed growth rate:
DM = SW Sct 0.01 (10)
here SDM is seed dry matter (kg ha−1), SW is mean individual seedeight (mg seed−1), Sct is number of seeds (seeds m−2) and the
erm 0.01 represents the unit conversion factor. Seeds still containbout 3% residual moisture when dried to constant weight in anven at 70 ◦C, so for simulation purposes, seed yield at the standard3% moisture content was calculated as: seed yield = (97/87)SDM.
The number of seeds per square meter is simulated as a func-ion of assimilate availability, assimilate demand, and a partitioningoefficient using a modified Charles-Edwards model (Charles-dwards et al., 1986):
ct = Scti−1 + (�Sct)t (11)
Sct = �S ∇F − Rms
asctAds(12)
here �Sct is the rate of change in the number of seedsseeds m−2 d−1), t is time interval (one day), �S is the partitioningoefficient for seeds (kg seed kg−1 aboveground biomass), �F is thessimilate available for growth (kg ha−1 d−1). Rms is the seed main-enance respiration (kg ha−1 d−1), AdS is the assimilate demandsequired for continuing growth of an individual seed (kg ha−1
eed−1 d−1), asct is a proportional constant (m2 d−1). Above-groundrowth rate is used as an estimate�F (Charles-Edwards et al., 1986;gli and Zhen-wen, 1991), and �S was simulated using a Gaussianunction of developmental stage:
S = a�s exp
(−(b�s − xd)2
2(c�s)2
)(13)
here xd is a developmental progress variable for reproductiverowth stage, a�s, b�s, c�s are Gaussian coefficients for �S. Variabled is calculated as the cumulative rate from R1 to R7 based on tem-erature and daylength (value of zero at R1 and 1.0 at R7, Setiyonot al., 2007). From R7 to R8, the cumulative rate is continued to aalue of 2.0 at R8. AdS is estimated from the reproductive growthate, which is the sum of growth rates for seed and maternal tissue
f the reproductive organs (flowers, pod walls, and seed coats):dS = MGR + SGR (14)
here MGR is maternal tissue (flowers, pod walls, and seed coats)rowth rate (kg ha−1 d−1) and SGR is seed growth rate (kg ha−1 d−1).
search 119 (2010) 161–174
The inclusion of maternal tissue for assimilate demand is based onSheldrake’s (1979) hypothesis that pods require a small but criticalamount of assimilate during initial pod growth (during which thechange in seed weight is negligible), followed by a much greaterassimilate demand for seed growth. As a result, the availabilityof assimilate to support both sinks (maternal tissue and seeds)determines the daily number of seeds in the cohort that surviveto contribute to the final seed number. SGR in Eq. (14) is calculatedas the difference between the current and previous day SDM, whileMGR is simulated using the first derivative of a logistic function anddevelopmental stages:
MGR = (amgr/bmgr) exp(−(cmgr − xd)/bmgr)
(1 + exp(−(cmgr − xd)/bmgr))2(15)
where xd is developmental progress from R1 to R7 and R8 (also usedin Eq. (13)), and amgr, bmgr, cmgr are logistic function coefficientsfor MGR. These coefficients and those in Eqs. (17) and (18), wereestimated from the calibration dataset (Section 2.4).
Individual seed weight, SW in Eq. (10), is estimated by the rela-tionship:
SW = SWi−1 +(
�SW −(
Rms102
Sct
))t (16)
where �SW is gross rate of change in mean individual seed weight(mg seed−1 d−1), the term i−1 represents the value of SW from theprevious day, Rms is seed maintenance respiration (kg ha−1), Sctis number of seeds (seeds m−2), the term 102 represents the unitcorrection factor ([mg m−2][ha kg−1]), t is time interval (one day).�SW is simulated using the first derivative of a logistic functionand developmental stages:
�SW = (a�SW /b�SW ) exp(−(c�SW − xd)/b�SW ))(1 + exp(−(c�SW − xd)/b�SW )
)2(17)
where xd is developmental progress from R1 to R7 and R8 (also usedin Eqs. (13) and (15)), a�SW, b�SW, and c�SW are logistic functioncoefficients for �SW.
Rms in Eqs. (12) and (16) is simulated as a function of tempera-ture, seed maintenance respiration coefficient, and SDM as follows:
Rms = (RmsCref Q10(T−Trefrms)/10Rms
)SDM (18)
where RmsCref is seed maintenance respiration coefficient at ref-erence temperature (kg kg−1 d−1), Q10rms is fractional change inrespiration rate with a 10 ◦C increase or decrease in temperature,Trefrms is reference temperature for seed maintenance respiration(25 ◦C), SDM is seed dry matter (kg ha−1).
2.4. Model evaluation
The SoySim model was first calibrated against data from fieldexperiments conducted in 2004 and 2005 at Lincoln, NE and in2002 at Mead, NE. The calibration involved parameters governingrelationships between maturity group and optimum developmen-tal rates (Setiyono et al., 2007), plant population density andleaf expansion rates (Setiyono et al., 2008), and key biomassaccumulation parameters that included maintenance respirationcoefficients, conversion efficiency factor for assimilate, and parti-tioning coefficient for seed dry matter (this study). The revised finalSoySim model was validated against data collected from field siteslocated in Lincoln NE (1999 through 2007), Mead NE (2002–2006),W. Lafayette IN (2006 and 2007), and Whiting IA (2004–2006)
(Table 1).For comparative purposes, soybean growth and yield at the val-idation sites were also simulated using CROPGRO-Soybean in theDSSAT version 4.0.2.0 software (Jones et al., 2003), Sinclair-Soybean(Sinclair, 1986; source code is available upon request), and WOFOST
T.D. Setiyono et al. / Field Crops Research 119 (2010) 161–174 167
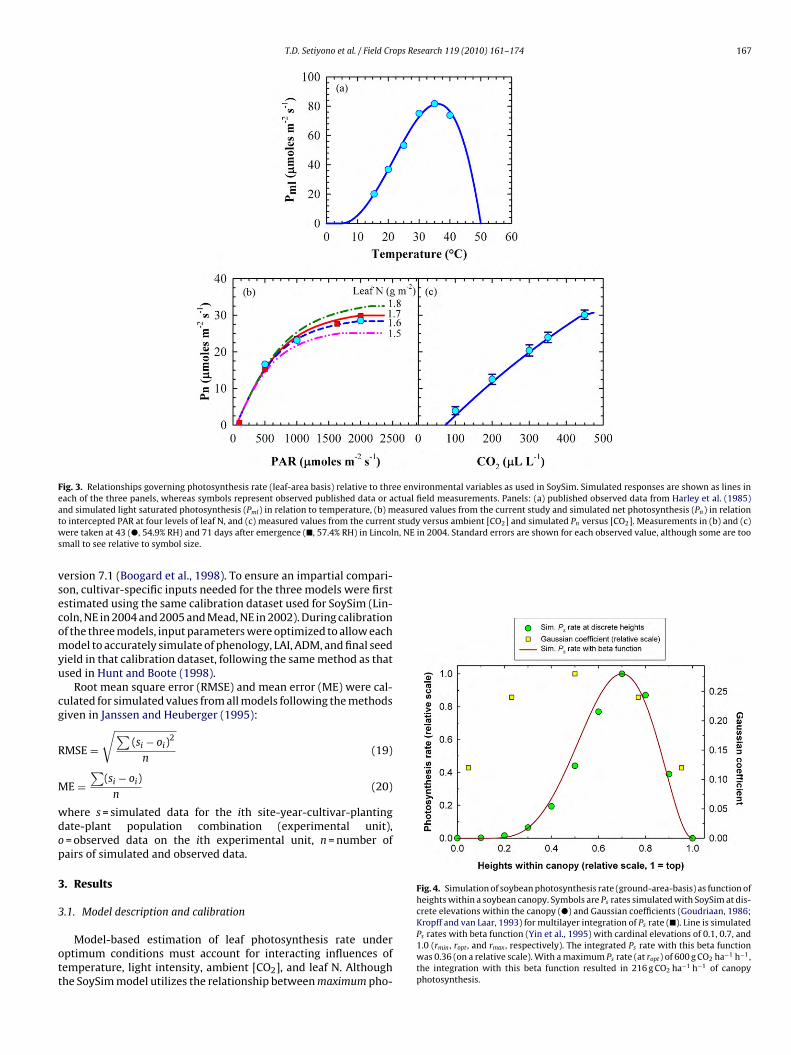
Fig. 3. Relationships governing photosynthesis rate (leaf-area basis) relative to three environmental variables as used in SoySim. Simulated responses are shown as lines ineach of the three panels, whereas symbols represent observed published data or actual field measurements. Panels: (a) published observed data from Harley et al. (1985)a easured values from the current study and simulated net photosynthesis (Pn) in relationt study versus ambient [CO2] and simulated Pn versus [CO2]. Measurements in (b) and (c)w n, NE in 2004. Standard errors are shown for each observed value, although some are toos
vsecomyu
cg
R
M
wdop
3
3
ott
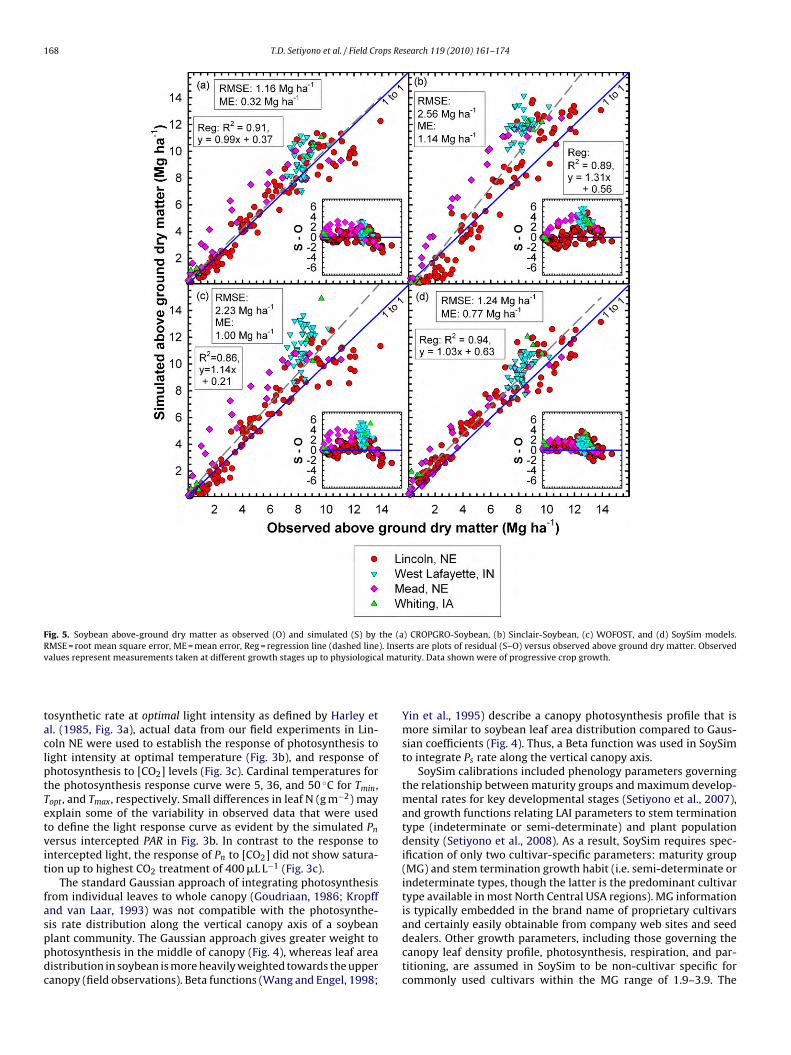
Fig. 4. Simulation of soybean photosynthesis rate (ground-area-basis) as function ofheights within a soybean canopy. Symbols are Ps rates simulated with SoySim at dis-crete elevations within the canopy (�) and Gaussian coefficients (Goudriaan, 1986;
nd simulated light saturated photosynthesis (Pml) in relation to temperature, (b) mo intercepted PAR at four levels of leaf N, and (c) measured values from the currentere taken at 43 (�, 54.9% RH) and 71 days after emergence (�, 57.4% RH) in Lincol
mall to see relative to symbol size.
ersion 7.1 (Boogard et al., 1998). To ensure an impartial compari-on, cultivar-specific inputs needed for the three models were firststimated using the same calibration dataset used for SoySim (Lin-oln, NE in 2004 and 2005 and Mead, NE in 2002). During calibrationf the three models, input parameters were optimized to allow eachodel to accurately simulate of phenology, LAI, ADM, and final seed
ield in that calibration dataset, following the same method as thatsed in Hunt and Boote (1998).
Root mean square error (RMSE) and mean error (ME) were cal-ulated for simulated values from all models following the methodsiven in Janssen and Heuberger (1995):
MSE =√∑
(si − oi)2
n(19)
E =∑
(si − oi)n
(20)
here s = simulated data for the ith site-year-cultivar-plantingate-plant population combination (experimental unit),= observed data on the ith experimental unit, n = number ofairs of simulated and observed data.
. Results
.1. Model description and calibration
Model-based estimation of leaf photosynthesis rate underptimum conditions must account for interacting influences ofemperature, light intensity, ambient [CO2], and leaf N. Althoughhe SoySim model utilizes the relationship between maximum pho-
Kropff and van Laar, 1993) for multilayer integration of Ps rate (�). Line is simulatedPs rates with beta function (Yin et al., 1995) with cardinal elevations of 0.1, 0.7, and1.0 (rmin , ropt , and rmax , respectively). The integrated Ps rate with this beta functionwas 0.36 (on a relative scale). With a maximum Ps rate (at ropt) of 600 g CO2 ha−1 h−1,the integration with this beta function resulted in 216 g CO2 ha−1 h−1 of canopyphotosynthesis.
168 T.D. Setiyono et al. / Field Crops Research 119 (2010) 161–174
Fig. 5. Soybean above-ground dry matter as observed (O) and simulated (S) by the (a) CROPGRO-Soybean, (b) Sinclair-Soybean, (c) WOFOST, and (d) SoySim models.RMSE = root mean square error, ME = mean error, Reg = regression line (dashed line). Inserts are plots of residual (S–O) versus observed above ground dry matter. Observedv l mat
taclptTetvit
fasppdc
alues represent measurements taken at different growth stages up to physiologica
osynthetic rate at optimal light intensity as defined by Harley etl. (1985, Fig. 3a), actual data from our field experiments in Lin-oln NE were used to establish the response of photosynthesis toight intensity at optimal temperature (Fig. 3b), and response ofhotosynthesis to [CO2] levels (Fig. 3c). Cardinal temperatures forhe photosynthesis response curve were 5, 36, and 50 ◦C for Tmin,opt, and Tmax, respectively. Small differences in leaf N (g m−2) mayxplain some of the variability in observed data that were usedo define the light response curve as evident by the simulated Pn
ersus intercepted PAR in Fig. 3b. In contrast to the response tontercepted light, the response of Pn to [CO2] did not show satura-ion up to highest CO2 treatment of 400 �L L−1 (Fig. 3c).
The standard Gaussian approach of integrating photosynthesisrom individual leaves to whole canopy (Goudriaan, 1986; Kropffnd van Laar, 1993) was not compatible with the photosynthe-
is rate distribution along the vertical canopy axis of a soybeanlant community. The Gaussian approach gives greater weight tohotosynthesis in the middle of canopy (Fig. 4), whereas leaf areaistribution in soybean is more heavily weighted towards the upperanopy (field observations). Beta functions (Wang and Engel, 1998;urity. Data shown were of progressive crop growth.
Yin et al., 1995) describe a canopy photosynthesis profile that ismore similar to soybean leaf area distribution compared to Gaus-sian coefficients (Fig. 4). Thus, a Beta function was used in SoySimto integrate Ps rate along the vertical canopy axis.
SoySim calibrations included phenology parameters governingthe relationship between maturity groups and maximum develop-mental rates for key developmental stages (Setiyono et al., 2007),and growth functions relating LAI parameters to stem terminationtype (indeterminate or semi-determinate) and plant populationdensity (Setiyono et al., 2008). As a result, SoySim requires spec-ification of only two cultivar-specific parameters: maturity group(MG) and stem termination growth habit (i.e. semi-determinate orindeterminate types, though the latter is the predominant cultivartype available in most North Central USA regions). MG informationis typically embedded in the brand name of proprietary cultivars
and certainly easily obtainable from company web sites and seeddealers. Other growth parameters, including those governing thecanopy leaf density profile, photosynthesis, respiration, and par-titioning, are assumed in SoySim to be non-cultivar specific forcommonly used cultivars within the MG range of 1.9–3.9. The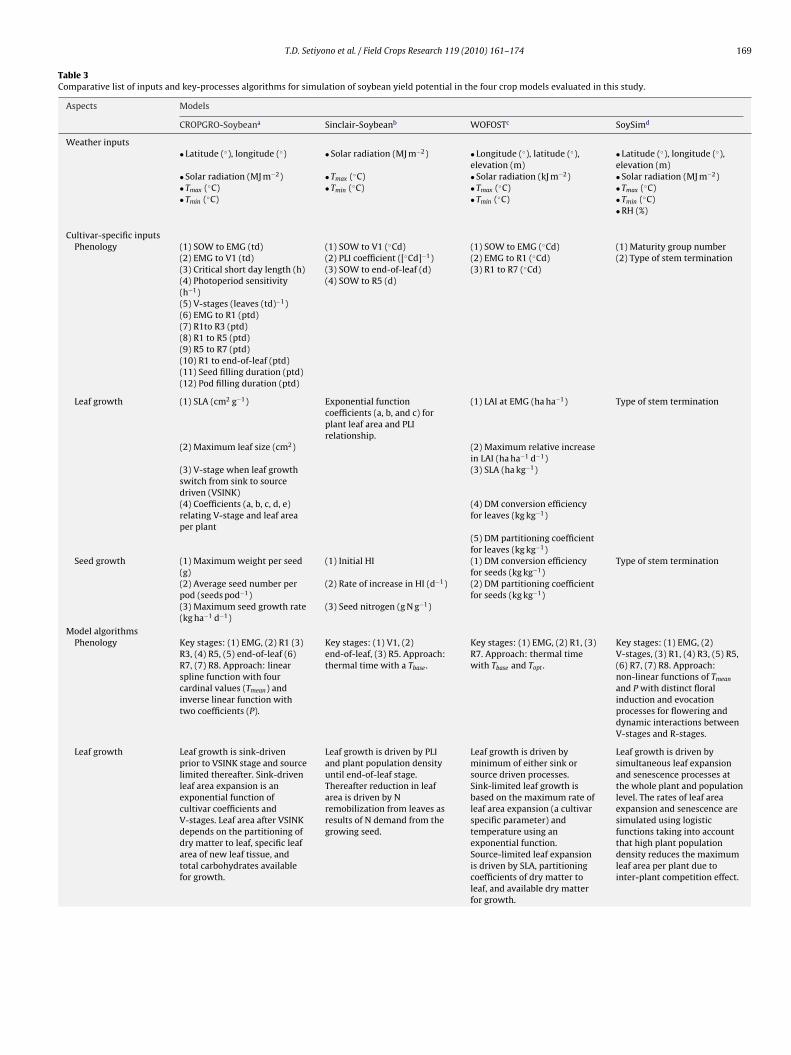
T.D. Setiyono et al. / Field Crops Research 119 (2010) 161–174 169
Table 3Comparative list of inputs and key-processes algorithms for simulation of soybean yield potential in the four crop models evaluated in this study.
Aspects Models
CROPGRO-Soybeana Sinclair-Soybeanb WOFOSTc SoySimd
Weather inputs• Latitude (◦), longitude (◦) • Solar radiation (MJ m−2) • Longitude (◦), latitude (◦),
elevation (m)• Latitude (◦), longitude (◦),elevation (m)
• Solar radiation (MJ m−2) • Tmax (◦C) • Solar radiation (kJ m−2) • Solar radiation (MJ m−2)• Tmax (◦C) • Tmin (◦C) • Tmax (◦C) • Tmax (◦C)• Tmin (◦C) • Tmin (◦C) • Tmin (◦C)
• RH (%)
Cultivar-specific inputsPhenology (1) SOW to EMG (td) (1) SOW to V1 (◦Cd) (1) SOW to EMG (◦Cd) (1) Maturity group number
(2) EMG to V1 (td) (2) PLI coefficient ([◦Cd]−1) (2) EMG to R1 (◦Cd) (2) Type of stem termination(3) Critical short day length (h) (3) SOW to end-of-leaf (d) (3) R1 to R7 (◦Cd)(4) Photoperiod sensitivity(h−1)
(4) SOW to R5 (d)
(5) V-stages (leaves (td)−1)(6) EMG to R1 (ptd)(7) R1to R3 (ptd)(8) R1 to R5 (ptd)(9) R5 to R7 (ptd)(10) R1 to end-of-leaf (ptd)(11) Seed filling duration (ptd)(12) Pod filling duration (ptd)
Leaf growth (1) SLA (cm2 g−1) Exponential functioncoefficients (a, b, and c) forplant leaf area and PLIrelationship.
(1) LAI at EMG (ha ha−1) Type of stem termination
(2) Maximum leaf size (cm2) (2) Maximum relative increasein LAI (ha ha−1 d−1)
(3) V-stage when leaf growthswitch from sink to sourcedriven (VSINK)
(3) SLA (ha kg−1)
(4) Coefficients (a, b, c, d, e)relating V-stage and leaf areaper plant
(4) DM conversion efficiencyfor leaves (kg kg−1)
(5) DM partitioning coefficientfor leaves (kg kg−1)
Seed growth (1) Maximum weight per seed(g)
(1) Initial HI (1) DM conversion efficiencyfor seeds (kg kg−1)
Type of stem termination
(2) Average seed number perpod (seeds pod−1)
(2) Rate of increase in HI (d−1) (2) DM partitioning coefficientfor seeds (kg kg−1)
(3) Maximum seed growth rate(kg ha−1 d−1)
(3) Seed nitrogen (g N g−1)
Model algorithmsPhenology Key stages: (1) EMG, (2) R1 (3)
R3, (4) R5, (5) end-of-leaf (6)R7, (7) R8. Approach: linearspline function with fourcardinal values (Tmean) andinverse linear function withtwo coefficients (P).
Key stages: (1) V1, (2)end-of-leaf, (3) R5. Approach:thermal time with a Tbase .
Key stages: (1) EMG, (2) R1, (3)R7. Approach: thermal timewith Tbase and Topt .
Key stages: (1) EMG, (2)V-stages, (3) R1, (4) R3, (5) R5,(6) R7, (7) R8. Approach:non-linear functions of Tmean
and P with distinct floralinduction and evocationprocesses for flowering anddynamic interactions betweenV-stages and R-stages.
Leaf growth Leaf growth is sink-drivenprior to VSINK stage and sourcelimited thereafter. Sink-drivenleaf area expansion is anexponential function ofcultivar coefficients andV-stages. Leaf area after VSINKdepends on the partitioning ofdry matter to leaf, specific leafarea of new leaf tissue, andtotal carbohydrates availablefor growth.
Leaf growth is driven by PLIand plant population densityuntil end-of-leaf stage.Thereafter reduction in leafarea is driven by Nremobilization from leaves asresults of N demand from thegrowing seed.
Leaf growth is driven byminimum of either sink orsource driven processes.Sink-limited leaf growth isbased on the maximum rate ofleaf area expansion (a cultivarspecific parameter) andtemperature using anexponential function.Source-limited leaf expansionis driven by SLA, partitioningcoefficients of dry matter toleaf, and available dry matterfor growth.
Leaf growth is driven bysimultaneous leaf expansionand senescence processes atthe whole plant and populationlevel. The rates of leaf areaexpansion and senescence aresimulated using logisticfunctions taking into accountthat high plant populationdensity reduces the maximumleaf area per plant due tointer-plant competition effect.
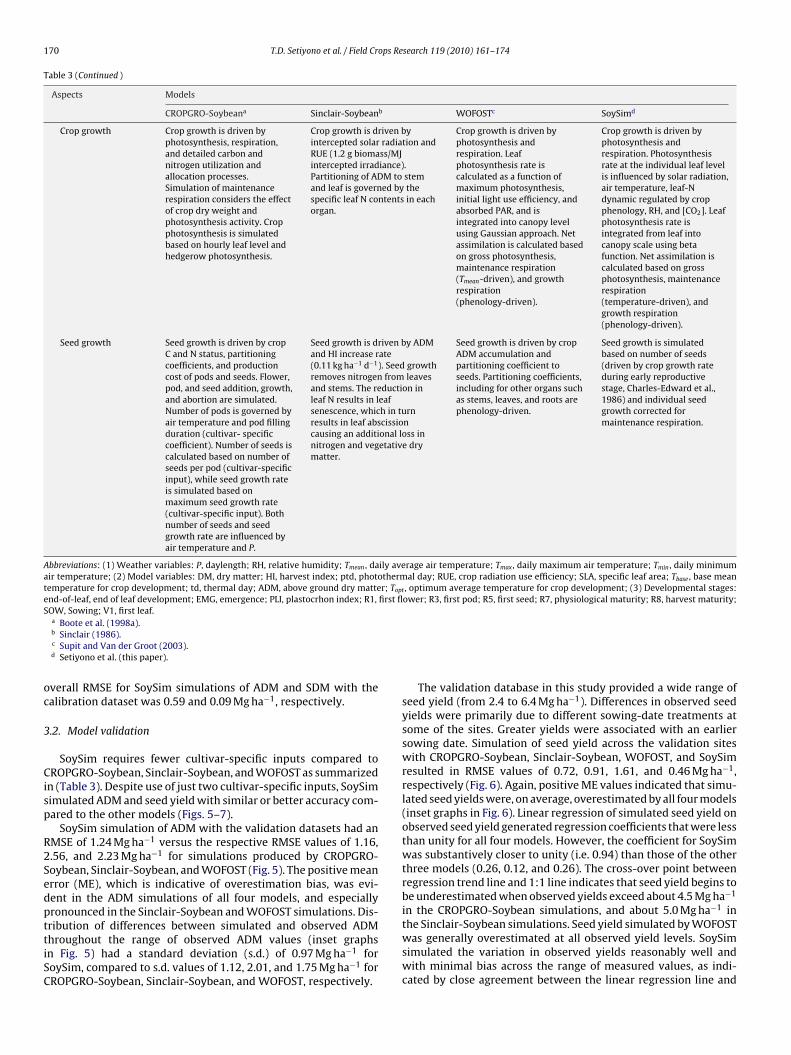
170 T.D. Setiyono et al. / Field Crops Research 119 (2010) 161–174
Table 3 (Continued )
Aspects Models
CROPGRO-Soybeana Sinclair-Soybeanb WOFOSTc SoySimd
Crop growth Crop growth is driven byphotosynthesis, respiration,and detailed carbon andnitrogen utilization andallocation processes.Simulation of maintenancerespiration considers the effectof crop dry weight andphotosynthesis activity. Cropphotosynthesis is simulatedbased on hourly leaf level andhedgerow photosynthesis.
Crop growth is driven byintercepted solar radiation andRUE (1.2 g biomass/MJintercepted irradiance).Partitioning of ADM to stemand leaf is governed by thespecific leaf N contents in eachorgan.
Crop growth is driven byphotosynthesis andrespiration. Leafphotosynthesis rate iscalculated as a function ofmaximum photosynthesis,initial light use efficiency, andabsorbed PAR, and isintegrated into canopy levelusing Gaussian approach. Netassimilation is calculated basedon gross photosynthesis,maintenance respiration(Tmean-driven), and growthrespiration(phenology-driven).
Crop growth is driven byphotosynthesis andrespiration. Photosynthesisrate at the individual leaf levelis influenced by solar radiation,air temperature, leaf-Ndynamic regulated by cropphenology, RH, and [CO2]. Leafphotosynthesis rate isintegrated from leaf intocanopy scale using betafunction. Net assimilation iscalculated based on grossphotosynthesis, maintenancerespiration(temperature-driven), andgrowth respiration(phenology-driven).
Seed growth Seed growth is driven by cropC and N status, partitioningcoefficients, and productioncost of pods and seeds. Flower,pod, and seed addition, growth,and abortion are simulated.Number of pods is governed byair temperature and pod fillingduration (cultivar- specificcoefficient). Number of seeds iscalculated based on number ofseeds per pod (cultivar-specificinput), while seed growth rateis simulated based onmaximum seed growth rate(cultivar-specific input). Bothnumber of seeds and seedgrowth rate are influenced byair temperature and P.
Seed growth is driven by ADMand HI increase rate(0.11 kg ha−1 d−1). Seed growthremoves nitrogen from leavesand stems. The reduction inleaf N results in leafsenescence, which in turnresults in leaf abscissioncausing an additional loss innitrogen and vegetative drymatter.
Seed growth is driven by cropADM accumulation andpartitioning coefficient toseeds. Partitioning coefficients,including for other organs suchas stems, leaves, and roots arephenology-driven.
Seed growth is simulatedbased on number of seeds(driven by crop growth rateduring early reproductivestage, Charles-Edward et al.,1986) and individual seedgrowth corrected formaintenance respiration.
Abbreviations: (1) Weather variables: P, daylength; RH, relative humidity; Tmean , daily average air temperature; Tmax , daily maximum air temperature; Tmin , daily minimumair temperature; (2) Model variables: DM, dry matter; HI, harvest index; ptd, photothermal day; RUE, crop radiation use efficiency; SLA, specific leaf area; Tbase , base meantemperature for crop development; td, thermal day; ADM, above ground dry matter; Topt , optimum average temperature for crop development; (3) Developmental stages:end-of-leaf, end of leaf development; EMG, emergence; PLI, plastocrhon index; R1, first flower; R3, first pod; R5, first seed; R7, physiological maturity; R8, harvest maturity;SOW, Sowing; V1, first leaf.
oc
3
Cisp
R2SedpttiSC
a Boote et al. (1998a).b Sinclair (1986).c Supit and Van der Groot (2003).d Setiyono et al. (this paper).
verall RMSE for SoySim simulations of ADM and SDM with thealibration dataset was 0.59 and 0.09 Mg ha−1, respectively.
.2. Model validation
SoySim requires fewer cultivar-specific inputs compared toROPGRO-Soybean, Sinclair-Soybean, and WOFOST as summarized
n (Table 3). Despite use of just two cultivar-specific inputs, SoySimimulated ADM and seed yield with similar or better accuracy com-ared to the other models (Figs. 5–7).
SoySim simulation of ADM with the validation datasets had anMSE of 1.24 Mg ha−1 versus the respective RMSE values of 1.16,.56, and 2.23 Mg ha−1 for simulations produced by CROPGRO-oybean, Sinclair-Soybean, and WOFOST (Fig. 5). The positive meanrror (ME), which is indicative of overestimation bias, was evi-ent in the ADM simulations of all four models, and especiallyronounced in the Sinclair-Soybean and WOFOST simulations. Dis-
ribution of differences between simulated and observed ADMhroughout the range of observed ADM values (inset graphsn Fig. 5) had a standard deviation (s.d.) of 0.97 Mg ha−1 foroySim, compared to s.d. values of 1.12, 2.01, and 1.75 Mg ha−1 forROPGRO-Soybean, Sinclair-Soybean, and WOFOST, respectively.The validation database in this study provided a wide range ofseed yield (from 2.4 to 6.4 Mg ha−1). Differences in observed seedyields were primarily due to different sowing-date treatments atsome of the sites. Greater yields were associated with an earliersowing date. Simulation of seed yield across the validation siteswith CROPGRO-Soybean, Sinclair-Soybean, WOFOST, and SoySimresulted in RMSE values of 0.72, 0.91, 1.61, and 0.46 Mg ha−1,respectively (Fig. 6). Again, positive ME values indicated that simu-lated seed yields were, on average, overestimated by all four models(inset graphs in Fig. 6). Linear regression of simulated seed yield onobserved seed yield generated regression coefficients that were lessthan unity for all four models. However, the coefficient for SoySimwas substantively closer to unity (i.e. 0.94) than those of the otherthree models (0.26, 0.12, and 0.26). The cross-over point betweenregression trend line and 1:1 line indicates that seed yield begins tobe underestimated when observed yields exceed about 4.5 Mg ha−1
in the CROPGRO-Soybean simulations, and about 5.0 Mg ha−1 in
the Sinclair-Soybean simulations. Seed yield simulated by WOFOSTwas generally overestimated at all observed yield levels. SoySimsimulated the variation in observed yields reasonably well andwith minimal bias across the range of measured values, as indi-cated by close agreement between the linear regression line and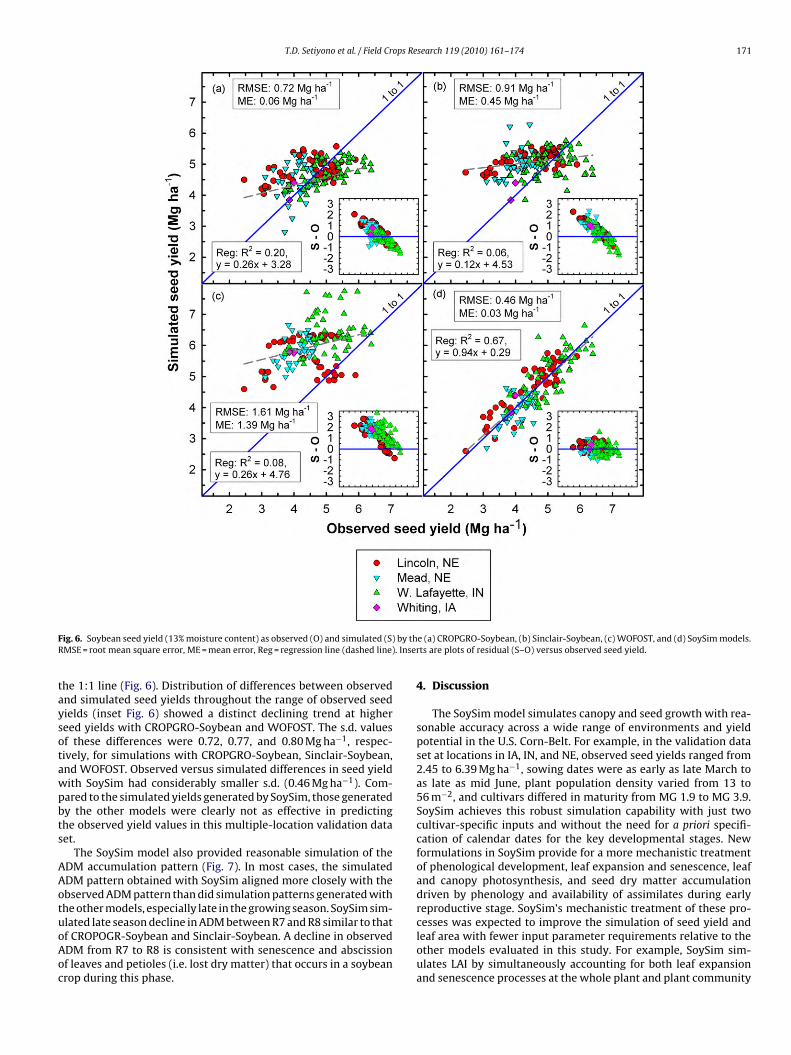
T.D. Setiyono et al. / Field Crops Research 119 (2010) 161–174 171
F by thR . Inser
taysotawpbts
AAotuoAoc
ig. 6. Soybean seed yield (13% moisture content) as observed (O) and simulated (S)MSE = root mean square error, ME = mean error, Reg = regression line (dashed line)
he 1:1 line (Fig. 6). Distribution of differences between observednd simulated seed yields throughout the range of observed seedields (inset Fig. 6) showed a distinct declining trend at highereed yields with CROPGRO-Soybean and WOFOST. The s.d. valuesf these differences were 0.72, 0.77, and 0.80 Mg ha−1, respec-ively, for simulations with CROPGRO-Soybean, Sinclair-Soybean,nd WOFOST. Observed versus simulated differences in seed yieldith SoySim had considerably smaller s.d. (0.46 Mg ha−1). Com-ared to the simulated yields generated by SoySim, those generatedy the other models were clearly not as effective in predictinghe observed yield values in this multiple-location validation dataet.
The SoySim model also provided reasonable simulation of theDM accumulation pattern (Fig. 7). In most cases, the simulatedDM pattern obtained with SoySim aligned more closely with thebserved ADM pattern than did simulation patterns generated withhe other models, especially late in the growing season. SoySim sim-
lated late season decline in ADM between R7 and R8 similar to thatf CROPOGR-Soybean and Sinclair-Soybean. A decline in observedDM from R7 to R8 is consistent with senescence and abscissionf leaves and petioles (i.e. lost dry matter) that occurs in a soybeanrop during this phase.e (a) CROPGRO-Soybean, (b) Sinclair-Soybean, (c) WOFOST, and (d) SoySim models.ts are plots of residual (S–O) versus observed seed yield.
4. Discussion
The SoySim model simulates canopy and seed growth with rea-sonable accuracy across a wide range of environments and yieldpotential in the U.S. Corn-Belt. For example, in the validation dataset at locations in IA, IN, and NE, observed seed yields ranged from2.45 to 6.39 Mg ha−1, sowing dates were as early as late March toas late as mid June, plant population density varied from 13 to56 m−2, and cultivars differed in maturity from MG 1.9 to MG 3.9.SoySim achieves this robust simulation capability with just twocultivar-specific inputs and without the need for a priori specifi-cation of calendar dates for the key developmental stages. Newformulations in SoySim provide for a more mechanistic treatmentof phenological development, leaf expansion and senescence, leafand canopy photosynthesis, and seed dry matter accumulationdriven by phenology and availability of assimilates during earlyreproductive stage. SoySim’s mechanistic treatment of these pro-
cesses was expected to improve the simulation of seed yield andleaf area with fewer input parameter requirements relative to theother models evaluated in this study. For example, SoySim sim-ulates LAI by simultaneously accounting for both leaf expansionand senescence processes at the whole plant and plant community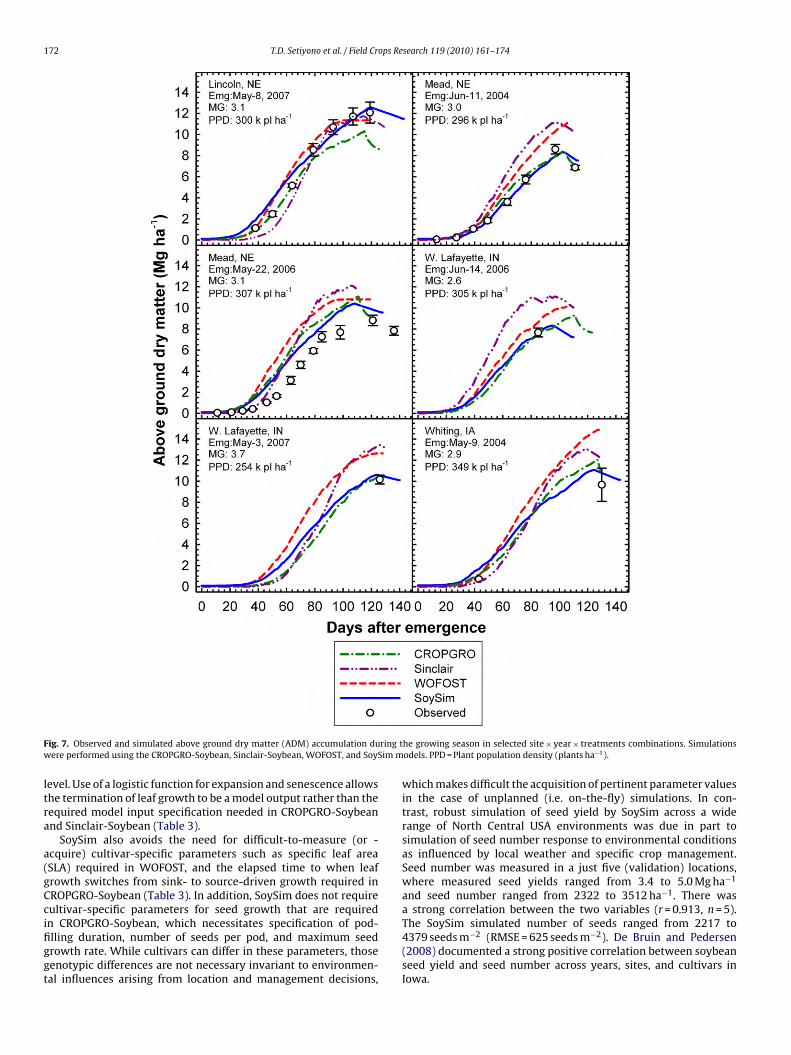
172 T.D. Setiyono et al. / Field Crops Research 119 (2010) 161–174
F ring tw Sim m
ltra
a(gCcifiggt
ig. 7. Observed and simulated above ground dry matter (ADM) accumulation duere performed using the CROPGRO-Soybean, Sinclair-Soybean, WOFOST, and Soy
evel. Use of a logistic function for expansion and senescence allowshe termination of leaf growth to be a model output rather than theequired model input specification needed in CROPGRO-Soybeannd Sinclair-Soybean (Table 3).
SoySim also avoids the need for difficult-to-measure (or -cquire) cultivar-specific parameters such as specific leaf areaSLA) required in WOFOST, and the elapsed time to when leafrowth switches from sink- to source-driven growth required inROPGRO-Soybean (Table 3). In addition, SoySim does not requireultivar-specific parameters for seed growth that are required
n CROPGRO-Soybean, which necessitates specification of pod-lling duration, number of seeds per pod, and maximum seedrowth rate. While cultivars can differ in these parameters, thoseenotypic differences are not necessary invariant to environmen-al influences arising from location and management decisions,he growing season in selected site × year × treatments combinations. Simulationsodels. PPD = Plant population density (plants ha−1).
which makes difficult the acquisition of pertinent parameter valuesin the case of unplanned (i.e. on-the-fly) simulations. In con-trast, robust simulation of seed yield by SoySim across a widerange of North Central USA environments was due in part tosimulation of seed number response to environmental conditionsas influenced by local weather and specific crop management.Seed number was measured in a just five (validation) locations,where measured seed yields ranged from 3.4 to 5.0 Mg ha−1
and seed number ranged from 2322 to 3512 ha−1. There wasa strong correlation between the two variables (r = 0.913, n = 5).
The SoySim simulated number of seeds ranged from 2217 to4379 seeds m−2 (RMSE = 625 seeds m−2). De Bruin and Pedersen(2008) documented a strong positive correlation between soybeanseed yield and seed number across years, sites, and cultivars inIowa.
ops Re
crtra1ots(rtntctmop
2atUmiraiSaocip
5
mldfhimsjsfba
A
bfIoaFDa
T.D. Setiyono et al. / Field Cr
The seed yield component of SoySim is not based on empiri-al relationships between environmental factors and seed growthates. Instead, seed growth is simulated as an integrated sink withinhe plant (Farrar, 1996) that, in turn, has a minimum growthequirement to sustain pod viability (Sheldrake, 1979), and a mech-nistically determined final seed number (Charles-Edwards et al.,986). This more fundamental approach captures the influencef environmental factors on seed growth in a dynamic fashion,hereby providing SoySim user with an opportunity to perform sen-itivity analysis of pod development and seed abortion to identifyand thus seed genetic or agronomic mitigation of) the possible bar-iers to higher soybean yield potential (Cooper, 2003), or to evaluatehe benefit of early sowing for optimizing number of main stemodes for high yield (Bastidas et al., 2008). In SoySim, the simula-ion formulations for seed number determination are sensitive torop growth rate during early reproductive stage (R1–R4)—a sensi-ivity documented by Egli and Zhen-wen (1991). Indeed, in the rice
odel ORYZA2000, accurate yield simulation relies on the numberf spikelets, which is based on crop growth rate in the period fromanicle initiation to first flowering (Bouman et al., 2001).
With access to historical weather data of adequate duration (e.g.0–30 years) near the field site, output from the SoySim modelllows the user to evaluate soybean yield potential at a given loca-ion with respect to any choice of planting date, North CentralSA cultivar maturity group, and plant population. Because theodel utilizes dynamic relationships for control of photosynthesis
n relation to [CO2], temperature, leaf nitrogen, solar radiation, andelative humidity (Farquhar et al., 1980; Harley et al., 1985; Sinclairnd Horie, 1989; Yin and van Laar, 2005), and employs a multilayerntegration of canopy photosynthesis (Kropff and van Laar, 1993;upit and Van der Groot, 2003), it could be used to examine inter-ctive effects of planting date, plant population and cultivar MGn yield potential in favorable environments, explore the impact oflimate change on yield potential, and to assist breeders in identify-ng optimal canopy architecture and growth habit for higher yieldotential.
. Conclusions
Results from the present study document that the SoySim modelet the criteria proposed by Sinclair and Seligman (2000) for pub-
ishing a new crop model. The new model has a well-definedomain of relevance (high yield environments), a mechanisticramework for simulation of crop growth and yield, and our analysiserein included an evaluation of scientific innovations embodied
n a new model. In contrast to existing models, SoySim uses newechanistic formulations to simulate phenology, canopy photo-
ynthesis, and dry matter accumulation. Because SoySim requiresust two readily available cultivar-specific inputs and no a prioripecification of key developmental stages, the model has potentialor a broad range of uses as a decision-support tool to improve soy-ean producer crop management and to support production-basedgronomic and cultivar development research.
cknowledgements
Funding for this research was provided by the Nebraska Soy-ean Board, the Fluid Fertilizer Foundation (FFF), the Foundationor Agronomic Research (FAR), the International Plant Nutrientnstitute (IPNI), and the Agricultural Research Division, Institute
f Agriculture and Natural Resources, University of Nebraska. Theuthors express their appreciation to Tim Arkebauer, David Scoby,ernando Salvagiotti, Angela Bastisdas, Joe Mitchell, Travis Wegner,arren Binder, and Tanvir Shah for their help with field operationsnd measurements, to John Linquist for creative suggestions onsearch 119 (2010) 161–174 173
model development, and to Daniel Ginting and Haishun Yang fortheir help in computer programming. The authors also thank thereviewers for their careful and thorough examination of this paperand for their constructive comments and insights.
References
Badescu, V., 1997. Verification of some very simple clear and cloudy sky models toevaluate global solar irradiance. Solar Energy 61, 251–264.
Bastidas, A.M., Setiyono, T.D., Dobermann, A., Cassman, K.G., Elmore, R.W., Graef,G.L., 2008. Soybean sowing date: the vegetative, reproductive, and agronomicimpacts. Crop Sci. 48, 727–740.
Blaine, A., Fulton, H., Graves, B., Henn, A., Ingram, D., McDaniel, T., Moore, W.F.,Poston, D., Sciumbato, G., Spinks, B., Ward, B., Wardlaw, M., Zhang, L., 2005.Suggested Guidelines for Using Fungicides to Manage Soybean Rust. MississippiState University Extension Service.
Boogard, H.L., van Diepen, C.A., Rötter, R.P., Cabrera, J.M.C.A., van Laar, H.H.,1998. User’s guide for the WOFOST 7.1 crop growth simulation model andWOFOST Control Center 1.5. Technical Document 52. DLO Winand Staring Cen-tre, Wageningen, The Netherlands.
Boote, K.J., Jones, J.W., Hoogenboom, G., 1998a. Simulation of crop growth: CROP-GRO model. In: Peart, R.M., Curry, R.B. (Eds.), Agricultural Systems Modeling andSimulation. Marcel Dekker, Inc., New York, USA, pp. 651–692.
Boote, K.J., Jones, J.W., Hoogenboom, G., Pickering, N.B., 1998b. The CROPGRO modelfor grain legumes. In: Tsuji, G.Y., Hoogenboom, G., Thornton, P.K. (Eds.), Under-standing Options for Agricultural Production. Kluwer Academic Publishers,Norwell, MA, pp. 99–128.
Boote, K.J., Jones, J.W., Hoogenboom, G., Wilkerson, G.G., 1997. Evaluation of theCROPGRO-Soybean model over a wide range of experiments. In: Kropff, M.J.,Teng, P.S., Aggarwal, P.K., Bouma, J., Bouman, B.A.M., van Laar, H.H. (Eds.), Appli-cations of Systems Approaches at the Field Level. Kluwer Academic Publishers,Dordrecht, The Netherlands, pp. 113–133.
Bouman, B.A.M., Kropff, M.J., Toung, T.P., Wopereis, M.C.S., ten Berge, H.F.M., van Laar,H.H., 2001. ORYZA2000: Modeling Lowland Rice. International Rice ResearchInstitute, Los Banos, Philippines.
Bozsa, R.C., Oliver, L.R., 1990. Competitive mechanism of common cocklebur (Xan-thium strumarium) and soybean (Glycine max) during seedling growth. Weed Sci.38, 344–350.
Brisson, N., Gary, C., Justes, E., Roche, R., Mary, B., Ripoche, D., Zimmer, D., Sierra,J., Bertuzzi, P., Burger, P., Bussiere, F., Cabidoche, Y.M., Cellier, P., Debaeke, P.,Gaudillere, J.P., Henault, C., Maraux, F., Seguin, B., Sinoquet, H., 2003. An overviewof the crop model STICS. Eur. J. Agron. 18, 309–332.
Caba, J.M., Poveda, J.L., Gresshoff, P.M., Ligero, F., 1999. Differential sensitivity ofnodulation to ethylene in soybean cv. Bragg and a supernodulating mutant. NewPhytol. 142, 233–242.
Carbone, G.J., Mearns, L.O., Mavromatis, T., Sadler, E.J., Stooksbury, D., 2003. Evalu-ating CROPGRO-soybean performance for use in climate impact studies. Agron.J. 95, 537–544.
Cassman, K.G., Whitney, K.R., Stockinger, K.R., 1980. Root growth and dry matter dis-tribution of soybean as affected by phosphorus stress, nodulation, and nitrogensource. Crop Sci. 73, 17–22.
Charles-Edwards, D.A., Doley, D., Rimmington, G.M., 1986. Modelling Plant Growthand Development. Academic Press, North Ryde, NSW.
Cheng, W., Johnson, D.W., Fu, S., 2003. Rhizosphere effects on decomposition:controls of plant species, phenology, and fertilization. Soil Sci. Soc. Am. J. 67,1418–1427.
Cooper, R.L., 2003. A delayed flowering barrier to higher soybean yields. Field CropRes. 82, 27–35.
De Bruin, J.L., Pedersen, P., 2008. Soybean seed yield response to planting date andseeding rate in the Upper Midwest. Agron. J. 100, 696–703.
de Wit, C.T., Goudriaan, J., Laar, H.H.V., 1978. Simulation of Assimilation, Respirationand Transpiration of Crops. Wageningen, The Netherlands.
Egli, D.B., Zhen-wen, Y., 1991. Crop growth rate and seeds per unit area in soybean.Crop Sci. 31, 439–442.
Evans, L.T., 1993. Crop evolution, Adaptation and Yield. Cambridge University Press,Cambridge.
Farquhar, G.D., von Caemmerer, S., Berry, J.A., 1980. A biochemical model of photo-synthetic CO2 assimilation in leaves of C3 species. Planta 149, 78–90.
Farrar, J.F., 1996. Sinks-integral parts of a whole plant. J. Exp. Bot. 47,1273–1279.
Fehr, W.R., Caviness, C.E., 1977. Stages of Soybean Development. Iowa State Univer-sity, Special Report 80, Ames, Iowa.
Forrester, J.W., 1961. Industrial Dynamics. MIT Press, Massachusetts Institute ofTechnology, and John Wiley and Sons, Inc., New York.
Goudriaan, J., 1986. A simple and fast numerical method for the computation of dailytotals of crop photosynthesis. Agric. Forest Meteorol. 38, 249–254.
Harley, P.C., Weber, J.A., Gates, D.M., 1985. Interactive effects of light, leaf tempera-ture, CO2 and O2 on photosynthesis in soybeans. Planta 165, 249–263.
Hunt, L.A., Boote, K.J., 1998. Data for model operation, calibration, and evaluation. In:
Tsuji, G.Y., Thornton, P., Hoogenboom, G. (Eds.), Understanding Options for Agri-cultural Production. Kluwer Academic Publishers, Dordrecht, The Netherlands,pp. 9–39.Irmak, A., Jones, J.W., Mavromatis, T., Welch, S.M., 2000. Evaluating methods forsimulating soybean cultivar responses using cross validation. Agron. J. 92,1140–1149.
1 ops Re
J
J
J
K
M
M
M
P
R
R
S
S
S
S
S
S
74 T.D. Setiyono et al. / Field Cr
agtap, S., Jones, J.W., 2002. Adaptation and evaluation of the CROPGRO-soybeanmodel to predict regional yield and production. Agric. Ecosyst. Environ. 93,73–85.
anssen, P.H.M., Heuberger, P.S.C., 1995. Calibration of process-oriented models.Ecol. Model. 83, 55–66.
ones, J.W., Hoogenboom, G., Wilkens, P.W., Porter, C.H., Tsuji, G.Y.E., 2003. DecisionSupport System for Agrotechnology Transfer Version 4.0: vol. 4. DSSAT v4: CropModel Documentation. University of Hawaii, Honolulu, HI.
ropff, M.J., van Laar, H.H., 1993. Modelling Crop–Weed Interactions. CAB Interna-tional and International Rice Research Institute, Wallingford, Great Britain.
ayaki, W.C., Teare, I.D., Stone, L.R., 1976. Top and root growth of irrigated andnonirrigated soybeans. Crop Sci. 16, 92–94.
ichalsky, J.J., 1988. The astronomical almanac’s algorithm for approximate solarposition (1950–2050). Solar Energy 40, 227–235.
uchow, R.C., Sinclair, T.R., 1986. Water and nitrogen limitations in soybean grainproduction. II. Field and model analysis. Field Crop Res. 15, 143–156.
edersen, P., Boote, K.J., Jones, J.W., Lauer, J.G., 2004. Modifying the CROPGRO-Soybean model to improve predictions for the upper midwest. Agron. J. 96,556–564.
obinson, A.P., Conley, S.P., Volenec, J.J., Santini, J.B., 2009. Analysis of high yielding,early-planted soybean in Indiana. Agron. J. 101, 131–139.
oder, W., Mason, S.C., Clegg, M.D., Kniep, K.R., 1989. Crop root distribution as influ-enced by grain sorghum-soybean rotation and fertilization. Soil Sci. Soc. Am. J.52, 1337–1342.
alvagiotti, F., Cassman, K.G., Specht, J.E., Walters, D.T., Weiss, A., Dobermann, A.,2008. Nitrogen uptake, fixation and response to fertilizer N in soybeans: areview. Field Crop Res. 108, 1–13.
etiyono, T.D., Weiss, A., Specht, J., Bastidas, A.M., Cassman, K.G., Dobermann, A.,2007. Understanding and modeling the effect of temperature and daylengthon soybean phenology under high-yield conditions. Field Crop Res. 100, 257–271.
etiyono, T.D., Weiss, A., Specht, J.E., Cassman, K.G., Dobermann, A., 2008. Leaf areaindex simulation in soybean grown under near-optimal conditions. Field CropRes. 108, 82–92.
heldrake, A.R., 1979. A hydrodynamical model of pod-set in pigeon pea (Cajanuscajan). Indian J. Plant Physiol. 22, 137–143.
inclair, T.R., 1986. Water and nitrogen limitation in soybean grain production. I.Model development. Field Crop Res. 15, 125–141.
inclair, T.R., Horie, T., 1989. Leaf nitrogen, photosynthesis, and crop radiation useefficiency: a review. Crop Sci. 29, 90–98.
search 119 (2010) 161–174
Sinclair, T.R., Seligman, N., 2000. Criteria for publishing papers on crop modeling.Field Crop Res. 68, 165–172.
Spaeth, S.C., Sinclair, T.R., Ohnuma, T., Konno, S., 1987. Temperature, radiation, andduration dependence of high soybean yields: measurement and simulation.Field Crop Res. 16, 297–307.
Specht, J., Hume, D.J., Kumudini, S.V., 1999. Soybean yield potential. A genetic andphysiological perspective. Crop Sci. 39, 1560–1570.
Spitters, C.J.T., Toussaint, H.A.J.M., Goudriaan, J., 1986. Separating the diffuse anddirect component of global radiation and its implications for modeling canopyphotosynthesis. Part I. Components of incoming radiation. Agric. Forest Meteo-rol. 38, 217–229.
Supit, I., Van der Groot, E., 2003. Updated System Description of the WOFOST CropGrowth Simulation Model as Implemented in the Crop Growth Monitoring Sys-tem, CGMS, Applied by the European Commission. Treemail Publisher, Heelsum,The Netherlands.
Trybom, J., Jeschke, M., 2008. Foliar fungicide effect on soybean yield. Crop Insights18, 1–4.
van Diepen, C.A., Wolf, J., van Keulen, H., Rappoldt, C., 1989. WOFOST: a simulationmodel of crop production. Soil Use Manage. 5, 16–24.
Verma, S.B., Dobermann, A., Cassman, K.G., Walters, D.T., Knops, J.M.H., Arkebauer,T.J., Suyker, A.E., Burba, G.G., Amos, B., Yang, H.S., Ginting, D., Hubbard, K.G., Gitel-son, A.A., Walter-Shea, E.A., 2005. Annual carbon dioxide exchange in irrigatedand rainfed maize-based agroecosystems. Agric. Forest Meteorol. 131, 77–96.
Vessey, J.K., Layzell, D.B., 1990. Regulation of assimilate partitioning in soybean.Plant Physiol. 83, 341–348.
Wang, E., Engel, T., 1998. Simulation of phenological development of wheat crops.Agric. Syst. 58, 1–24.
Wang, F., Fraisse, C.W., Kitchen, N.R., Sudduth, K.A., 2003. Site specific evalua-tion of the CROPGRO-soybean model on Missouri claypan soils. Agric. Syst. 76,985–1005.
Watt, M., Evans, J.R., 2003. Phosphorus acquisition from soil by white lupin (Lupinusalbus L.) and soybean (Glycine max L.), species with contrasting root develop-ment. Plant Soil 248, 271–283.
Williams, L.E., DeJong, T.M., Phillips, D.A., 1981. Carbon and nitrogen limitations on
soybean seedling development. Plant Physiol. 68, 1206–1209.Yin, X., Kropff, M.J., McLaren, G., Visperas, R.M., 1995. A nonlinear model for cropdevelopment as a function of temperature. Agric. Forest Meteorol. 77, 1–16.
Yin, X., van Laar, H.H., 2005. Crop System Dynamics. An Ecophysiological Simula-tion Model for Genotype-by-environment Interactions. Wageningen AcademicPublishers, Wageningen, The Netherlands.