Embed Size (px)
Citation preview

SIMULATION OF POWER DISTRIBUTION MANAGEMENT SYSTEM USING OMACS
METAMODEL
by
JAIDEV MANGHAT
B.Tech., University of Calicut, 2004
A REPORT
submitted in partial fulfillment of the requirements for the degree
MASTER OF SCIENCE
Department of Computing and Information Sciences College of Engineering
KANSAS STATE UNIVERSITY Manhattan, Kansas
2008
Approved by:
Major Professor Dr.Scott A. DeLoach

Abstract
Designing and implementing large, complex and distributed systems using semi-
autonomous agents that can reorganize and adapt themselves by cooperating with one another
represents the future of software systems. This project concentrates on analyzing, designing and
simulating such a system using the Organization Model for Adaptive Computational Systems
(OMACS) metamodel. OMACS provides a framework for developing multiagent based systems
that can adapt themselves to changes in the environment. Design of OMACS ensures the system
will be highly robust and adaptive. In this project, we implement a simulator that models the
adaptability of agents in a Power Distribution Management (PDM) system.
The project specifies a top-down approach to break down the goals of the PDM system
and to design the functional role of each agent involved in the system. It defines the different
roles in the organization and the various capabilities possessed by the agents. All the assignments
in PDM system are based on these factors. The project gives two different approaches for
assigning the agents to the goals they are capable of achieving. It also analyzes the time
complexity and the efficiency of agent assignments in various scenarios to understand the
effectiveness of agent reorganization.

Table of Contents
List of Figures ................................................................................................................................. v
List of Tables ................................................................................................................................. vi
Acknowledgements ....................................................................................................................... vii
CHAPTER 1 - Introduction ............................................................................................................ 1
1.1 Problem and Approach ......................................................................................................... 1
1.2 Scope and Objectives ............................................................................................................ 3
1.2 Document Overview ............................................................................................................. 4
CHAPTER 2 - Background ............................................................................................................ 5
2.1 Organization Model for Adaptive Computational Systems .................................................. 5
2.1.1 Organization ................................................................................................................... 6
2.1.2 Goals .............................................................................................................................. 7
2.1.3 Precedes ......................................................................................................................... 8
2.1.4 Trigger ............................................................................................................................ 8
2.1.5 Roles .............................................................................................................................. 9
2.1.6 Agents .......................................................................................................................... 10
2.1.7 Capabilities .................................................................................................................. 10
2.1.8 Policies ......................................................................................................................... 11
2.2 Related Work ...................................................................................................................... 11
2.2.1 Cooperating Intelligent Systems for Distribution System Management ..................... 11
2.2.2 Other Works ................................................................................................................. 12
CHAPTER 3 - PDM System Analysis and Design ...................................................................... 13
3.1 System Description ............................................................................................................. 13
3.2 Requirements Analysis ....................................................................................................... 15
3.3 Modeling of PDM Simulator .............................................................................................. 16
3.3.1 Model Goal .................................................................................................................. 17
3.3.2 Model Role ................................................................................................................... 19
3.3.3 Model Agents ............................................................................................................... 22
3.4 PDM System Architecture .................................................................................................. 24
iii
3.5 Class Diagram ..................................................................................................................... 26
3.6 State Diagram ..................................................................................................................... 28
3.7 Summary ............................................................................................................................. 30
CHAPTER 4 - Implementation ..................................................................................................... 31
4.1 Reorganization Algorithm .................................................................................................. 31
4.2 Database .............................................................................................................................. 34
4.3 Implementation Details ....................................................................................................... 36
4.4 Summary ............................................................................................................................. 38
CHAPTER 5 - Results .................................................................................................................. 40
5.1 Result Analysis ................................................................................................................... 40
5.2 Conclusion .......................................................................................................................... 42
5.3 Limitations .......................................................................................................................... 43
5.4 Future Work ........................................................................................................................ 43
Bibliography ................................................................................................................................. 44
Appendix A - Configuration File .................................................................................................. 46
Appendix B - Scenario File........................................................................................................... 47
Appendix C - User Manual ........................................................................................................... 48
iv

List of Figures
Figure 2.1 Organization Model [8] ................................................................................................. 6
Figure 3.1 Power Distribution Network ........................................................................................ 14
Figure 3.2 Goal Model .................................................................................................................. 17
Figure 3.3 Role Model .................................................................................................................. 20
Figure 3.4 Agent Model ................................................................................................................ 23
Figure 3.5 PDM High Level Architecture .................................................................................... 25
Figure 3.6 Class Diagram ............................................................................................................. 27
Figure 3.7 State Diagram .............................................................................................................. 29
Figure 4.1 First Fit Algorithm based Reorganization Pseudo Code ............................................. 31
Figure 4.2 Best-Fit Reorganization Pseudo Code ......................................................................... 33
Figure 4.3 PDM Simulator ............................................................................................................ 37
Figure 5.1 Number of Agents – Time Graph ................................................................................ 41
Figure 5.2 Agents - rcf Chart ........................................................................................................ 42
Figure A.1 Sample Configuration File .......................................................................................... 46
Figure B.1 Sample Scenario File .................................................................................................. 47
v

List of Tables
Table 4.1 Substation_Details ........................................................................................................ 35
Table 4.2 Customer_SS_Mapping ................................................................................................ 35
Table 4.3 Transmission_Station.................................................................................................... 35
vi

vii
Acknowledgements
I would like to take this opportunity to express my gratitude to some important people
who have inspired and guided me to complete this project.
First, I would like to thank Dr. Scott A. DeLoach, my major professor, for his continued
support throughout this project. I thank you for all the guidance, for always being willing to point
me in the right direction.
Second, I would like to thank Dr. Gurdip Singh and Dr. Mitchell L. Neilsen for serving in
my committee.
I would also like to thank the members of MACR research team, Scott J. Harmon, Jorge
Valenzuela, Chris Zhong and Matt Miller for their invaluable inputs and ideas. Thank you, Scott,
for taking time to review the project. Thank you, Jorge and Chris, for all the ideas and
suggestions on this project. Thank you, Matt for helping me to learn more about GMoDS.
Finally, I would like to thank my family and friends for their unrelenting support and
encouragement, and for raising my spirits whenever I needed it.

CHAPTER 1 - Introduction
Power Distribution Management (PDM) or Electricity Distribution Management is a
system responsible for ensuring that the consumers have undisrupted power supply.
Implementing a simulator for PDM system can aid in understanding the behavioral aspects of
multiagent approach in distributed applications. This chapter gives an overview of the existing
system of Power Distribution Management.
1.1 Problem and Approach The main purpose of the PDM system is to supply electricity from the generating stations
to the consumer locations via transmission stations. To improve transmission efficiency and to
comply with consumer needs, the voltage may be stepped-up or stepped-down during
transmission. The distribution and supply of electricity uses [3] a whole network of routers,
circuit breakers, switches, alarms, load-reading meters and telemetry.
The network of PDM system includes various companies sharing National Grids for
power distribution and supply. National Grid is the electricity transmission network that connects
the major power stations and substations to distribute the electricity generated elsewhere. The
current system makes use of a centralized architecture in which the Control Engineers (CE) with
the assistance of Field Engineers (FE) does the management of these power distribution
networks. The Control Engineer has to ensure that losses in the electricity transmission is kept
minimal and all consumers are supplied an undisrupted power supply by maintaining an optimal
power grid configuration [6].
The extent to which the CE controls the operations involved in ensuring the above
priorities varies between substations. However, most of the time they have to rely on incomplete
information obtained from a variety of sources. The decisions taken by them have to be both
timely and secure, which include delegating responsibility to Field Engineers for network
switching operations.
1

In order to make the system more robust and work asynchronously, we introduced a
multiagent approach. The project involves analyzing the various components in the PDM system
and designing the components as agents that can interact and cooperate with each other to
achieve the goals of the system. Following the OMACS metamodel for designing the system
ensures robustness and flexibility of the components. In addition, agents that can reorganize
themselves divide and distribute the complex tasks between them, according to the changes in
environment.
The main purpose of a simulator is to model an application before its real time
implementation so that we can test our design and analyze the working of the system without the
physical repercussions. This can help developers understand the behavior of current design under
various conditions. Simulating the system like this will help in constantly improving the design
and in refining the frameworks used for implementing the system.
The first step in this project was to study the existing PDM system. This included the
various components that already exist in the system. We needed to understand “what is the main
purpose of the system?”, “how the tasks are met?”, “how the objectives are achieved?” etc. For
this, we analyzed the interaction and working of every module in the existing system. This
enabled in identifying various system level goals of the system.
The next step was to apply a multiagent approach for the system design. This approach
had several advantages over other centralized architectures. Dividing the tasks between various
agents reduced the complexity of computation among them. Various tasks in the system were
determined and a Goal Model was created to map the hierarchy of these goals. The tasks that
require little interaction were divided into separate, fully independent goals so that a single agent
could solve them. The subsequent step was to identify the agents in such a way that they can play
their roles independently while cooperating with other agents in order to achieve the goal of the
system.
All the agents possess a set of different capabilities. This helps to assign agents to roles
that it can play the best. This also aid in distinguishing the agents between them. Each agent in
the system has a different score for the capabilities they possess. This will help in determining
the ability of an agent to play a role better than others do. In addition, this will aid in studying the
reorganization patterns within the organization.
2

The final step was to determine the organizational activities that need to be monitored in
the simulation. This was decided based upon the entities involved in the OMACS metamodel. An
additional functionality to step through the simulation solves the problem of user not being able
to review the assignments during run time.
Thus, the project analyzes the problems associated with the Power Distribution
Management system. We have applied a multiagent system based approach with OMACS
metamodel as the supporting framework. The project also overlook into the reassignment of
agent tasks due to the changes in environment.
1.2 Scope and Objectives The primary objective of the project was to study the behavior of PDM system
implemented using the multiagent approach. OMACS provide a framework to develop complex,
distributed systems that can autonomously adapt to their environment [9]. The ability of the
agents to reorganize themselves according to their capabilities makes it adaptive to the changes
in environment.
A large number of complex systems are conceptualized using multiagent system design.
Distributed Vehicle Monitoring, Air Traffic Control, Power Distribution Management, Supply
Chains, Network Management and Routing are some of them. We selected Power Distribution
Management system for the study because of its complex, distributed nature. In addition, it very
well associates into real-world problem domains that require distributed decision-making.
The aim of the project was to design the classic problem of Power Distribution
Management using the multiagent systems concept. This project focuses on implementing a
PDM simulator that conforms to the OMACS metamodel. The PDM simulator can replicate the
system behavior according to various input scenarios. It also allows changes in number of agents
available in the system and variations in the capability scores possessed by these agents.
The scope of this project limits to the implementation of a simulator for the PDM system.
This simulator will enable us to study the working of PDM system under changing
environments. This includes loading a configuration file, which specifies the various agents in
the system and their capabilities and capability scores. The simulator will dynamically create the
agents with those capabilities and uses two different algorithms for assignment of agents to
goals. The simulator also enables us to step through the process and analyze the various
3

assignments and agent reorganizations. Finally, it creates a log file, which records all the
organization level activities and reorganizations in the system.
1.2 Document Overview The structure of this report is as follows: Chapter 2 briefly outlines the background
information about the OMACS metamodel. It contains literature review about the various
research works on power distribution management system designed with the multiagent
approach. Chapter 3 describes the analysis and design of the application including the various
models created for system design. It explains the integration of agents into a cooperative problem
solving community. Chapter 4 gives the implementation details of the PDM simulator and the
two different reorganization algorithms used for organizational assignments. Chapter 5 explains
the time and efficiency analysis of the two reorganization algorithms and the running time results
of the simulator. It also explains briefly the limitations of the system and future works that can
improve the usefulness of simulator.
4

CHAPTER 2 - Background
Organization Model for Adaptive Computational Systems provides a framework to
develop complex, distributed systems that can autonomously adapt to their environment. This
chapter explains the metamodel used in this project. It also provides a literature review of related
work on power distribution management systems designed with the multiagent system approach.
2.1 Organization Model for Adaptive Computational Systems In this report, OMACS refers to the Organization Model for Adaptive Computational
Systems. The term Organization can be defined in many ways. In a multiagent system context,
we can define an Organization as a complex, adaptive and distributed system in which a set of
agents playing roles within the structure in order to satisfy a set of goals [8].
The main objective of the OMACS metamodel is to provide a framework that help in
developing a stable multiagent system that is robust and reliable in unpredictable application
environments. It makes sure that the configuration and dynamic nature of the application does
not restrict the capabilities of the system. This is particularly relevant in complex and distributed
applications like PDM as they involve much dynamic reorganization within the system.
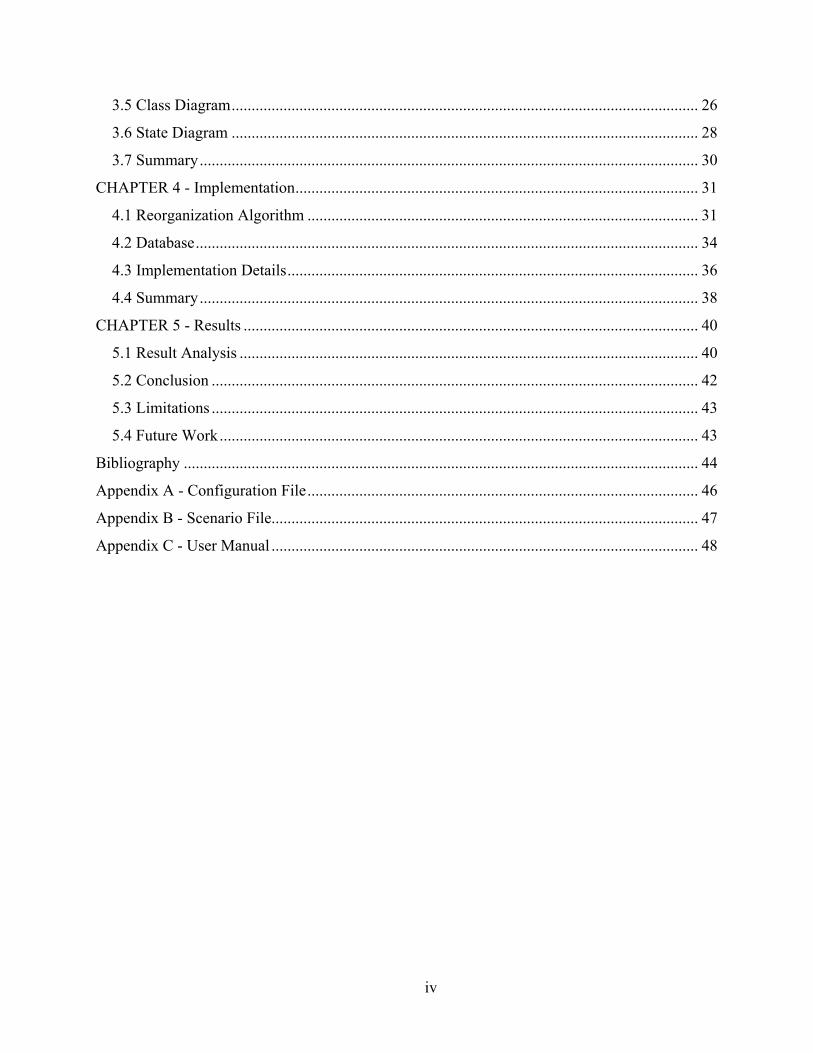
Figure 2.1 shows the UML depiction of OMACS model. OMACS defines three standard
entities of an organization: goals (G), roles (R) and agents (A). It also defines three additional
entities: capabilities (C), assignments (Φ) and policies (P). These entities form the foundation for
the OMACS model, and they are encapsulated in an overall entity called Organization.
OMACS defines a set of goals within the system that can be achieved only by playing the
roles defined. In addition, there are agents defined within the organization that possess a set of
capabilities. For an agent to play a role, it must possess the capabilities required by that role. The
capability score measures the ability of an agent to play a role. A tuple of an agent assigned to
achieve a goal by playing a role defines an Assignment at organization level. The policies
defined can control the assignment of agents within the organization. The policies can also
restrict the association of entities within the system.
5
The relationships between various entities in the organization model are as shown in
Figure 2.1. The relationship between goals, roles and capabilities are assumed static.
Nevertheless, the set of agents and their assignments are dynamic in nature and may change with
the changes in environment. This is the key reason for using the OMACS metamodel for
designing PDM system. The components of PDM application are distributed in nature and need
to cooperate and communicate dynamically to achieve the system goals.
Figure 2.1 Organization Model [8]
The following section explains the definition of each of the entities in OMACS model
and their relationships with each other.
2.1.1 Organization
Organization is a high-level entity that comprises of an aggregation of five other entities:
Goals, Roles, Agents, Capabilities and Policies [9]. The organization entity in OMACS consists
of a set of goals that the organization is trying to achieve. It also contains a function called oaf or
organization assignment function. It calculates an organizational score for every assignment in
6
the organization. This score determines the quality of assignments in an organization. In order to
match the requirements of specific application we can override this function.
Another component in the organization entity is the assignment set (Φ). This set contains
a set of assignments made within the organization that assigns an agent to achieve a goal playing
respective role.
2.1.2 Goals
Every organization has an objective or goal that it wants to achieve. In OMACS
metamodel, this root goal is sub-divided into a set of goals. Once all these goals are achieved, the
root goal of the organization is achieved. This again depends on whether the goal is AND-refined
or OR-refined. The goal refinements are explained in the later part of this section. The ordering
of goals gives an opportunity to divide the root task of the application into separate goals, which
may or may not dependent on other goals. In other words, the top-level organizational goal is
decomposed into sub goals in order to specify the finer details of how the root goal can be
achieved.
This is particularly relevant for the power distribution management application as the root
goal of the application is to ensure uninterrupted power supply to all the customers. But this
include a lot of distributed components in the whole process like electricity generation,
transmission, supply, circuit breakers, switches etc. which has to be defined in finer detail in
order to achieve the root goal.
The best way to depict the goals in an organization model is by using a goal tree structure
called GMoDS or Goal Model for Dynamic Systems [11]. It uses UML class notations to
represent the goals. The sub goals will be either conjunctive or disjunctive in nature. This depicts
the decomposition of goals based on AND-refinement and OR-refinement. An AND-refined goal
can be achieved if and only if all of its children are achieved while an OR-refined goal is
achieved if any of its children is achieved.
For the goal tree to be compatible with the structure defined in GMoDS, it needs to
satisfy three properties [11]: there must be exactly one root goal, all goals except root goal must
have exactly one parent goal and there must not be any cycles in the tree. This AND/OR goal
tree structure also allows to include attributes within a goal. Any attribute possessed by a goal is
7

visible to all of its children. In addition, the goals in the goal model can have precedes and
triggers relationship which are explained in coming sections.
Thus, the root goal defines the overall function of the organization. It is divided into sub
goals in accordance with the definitions specified in GMoDS. This task of transforming the
system requirements into goals and/or sub-goals [12] is termed as Model Goals.
2.1.3 Precedes
The precedes is a relation between two goals in the goal tree. It specifies a sequence,
which has to be followed while achieving the goals. If a goal g1 precedes goal g2, then goal g1
has to be achieved before goal g2 becomes active. If a goal is in active state, then that goal is
available to agents for processing. Once the processing of the goal is complete, it moves to the
achieved state. The precedence relationships make sure that the dependency between the goals is
preserved while multiple goals are active. All the sub-goals inherit the precedes relationship. For
example, if a goal g1 precedes goal g2, then all the sub-goals of g1 must be achieved before any
of the sub-goals of g2 becomes active.
In the PDM application, some goals should not be processed before certain goals are
achieved. For instance, the system is not supposed to coordinate with the Field Engineer before
trying to fix the fault by automatic operation of circuit breaker and remote switching operations.
In this scenario, the precedes relationship will help in defining the sequence of operation while
achieving the goals in the organization.
2.1.4 Trigger
During the processing of a goal tree, an Initial Trigger is required in order to create the
initial set of goal instances. This will create an instance of all goals that do not have a precede or
trigger relationship. These goals are then moved to the set of active goals. The organization will
then start processing the goals in active set. Once a goal in active set is achieved, it is moved to
the set of achieved goals. This will result in creating instances of goals that are preceded by that
goal. They are added to the set of active goals.
If the goals are OR-refined, then achievement of any one of the sub-goals causes that goal
to be moved to the set of achieved goals. As the parent goal is achieved, there is no need to work
on its sibling goals. Those sibling goals are moved to a set of obviated goals. A set of obviated
8

goals contain all the goals than do not need any more processing as their parent goal was
achieved. This condition arises only in the case of OR-refined goals.
The trigger relation prevents the goals to be moved to the set of active goals until a
specific event occurs. Once the event occurs, the triggered goals are moved to the set of active
goals. The triggers relationship is inherited by its sub-goals. If a goal g1 triggers goal g2, all the
sub-goals of g2 are moved to the set of active goals unless they have separate triggers defined.
The event that caused the trigger to occur may happen anytime during the achievement of the
goal, g1. The occurrence of an event allows a goal to pass attributes in the trigger to the goal
created. Thus, the triggered goals are parameterized based on the attributes and any additional
information provided by the event that triggers the goal.
2.1.5 Roles
Role is the entity in OMACS that has an achieves relationship with goal entity. Every
goal in the set of active goals is achieved by playing one of the roles defined. An agent achieves
a goal by playing the role that can achieve that goal. The role entity has a requires relationship
with the capabilities entity in organization model. In order to play a role, there is a set of
capabilities defined for that role, which need to be possessed. The achieves() function in
OMACS returns a score which determines how well the role can achieve the goal. A role may be
capable of achieving more than one goal. However, this function helps to determine which role
can achieve the goal best.
For an agent in OMACS to play a role, it must possess the set of capabilities that are
required by the role. OMACS defines role capability function or rcf (), which helps to determine
the ability of an agent to play a role. If and only if the agent possesses the capabilities required
by the role, it can play that role. Calling the rcf () function on a role by passing the agent and
goal as parameters will help us to determine if the agent can play that role. The function returns a
score between 0.0 and 1.0. The higher the score returned by rcf () function, the better the agent
can play that role to achieve the goal.
In the PDM application, each of the leaf goals is achieved by a different role. In addition,
each of these roles requires a different set of capabilities. This will relate well to the real world
application requirements.
9

2.1.6 Agents
According to Panait and Luke [6], an agent is a “computational mechanism that exhibits
high degree of autonomy, performing actions in its environment based on information received
from the environment”. This is a generic definition for an agent in multiagent based systems.
OMACS defines an agent as “computational system instances that inhabit a complex dynamic
environment, sense and act autonomously in this environment, and by doing so realize a set of
goals” [12].
Agents have a possesses relationship with the capabilities entity in OMACS. It gives the
list of capabilities that an agent possesses. We can define a score for each of the capabilities in
this set. The value of score typically varies between 0.0 and 1.0. The higher the value, the better
the capability will be. The role capability function uses this capability score to determine how
well the agent can play a role.
The agents in an organization are mostly designed to be heterogeneous. This will result in
agents differing in their ability to play the same role. This is mainly due to the difference in
capabilities possessed by the agents and the variations in capability scores. The agents in PDM
simulator are heterogeneous in nature as there are agents with different set of capabilities. We
can also specify the capability scores for each agent by changing the configuration file used for
loading the agents in the simulation.
2.1.7 Capabilities
Capabilities is the entity defined in the OMACS model, which helps in assigning agents
to play a role defined. They define a set of skills that an agent may possess. These skills will
enable the agent to perform various actions in the environment. All the roles in OMACS define a
set of capabilities that are required in order to play that role. The agents will possess a set of
capabilities, which will help them to perceive and perform in the environment [12].
There is a score associated with each of the capabilities that an agent possesses. This will
enable the organization to assign an agent to play a role using the role capability function. The
agents in PDM application requires various capabilities like connecting to database, accessing
network information, receiving weather updates etc. These capabilities will enable the agents to
perform various tasks like monitoring network data and finding location of fault.
10

2.1.8 Policies
OMACS defines a set of policies for every organization. Policies are a set of formally
specified rules to restrict the behavior of the organization in a particular situation [8]. They
mainly limit the activities within the organization level. These restrictions can be on various
levels and are classified as Assignment Policies, Behavioral Policies and Reorganization
Policies. Mainly they impose constraints on organizational level entities like goals, roles and
agents. They can impose restrictions on assignment of agents to play roles. The Reorganization
Policies defines how the reorganizations within the organization must happen. The policies can
also aid in managing the dynamic nature of organization.
2.2 Related Work The multiagent system approach tends to influence a very large number of problem
domains like embodied agents, game-theoretic environments and applications to real world
problems [6]. Some specific examples are Cooperative Navigation, Cooperative Target
Observation, Coordination Games, Distributed Vehicle Monitoring, Electricity Distribution
Management, and Models of Social Interaction. Researchers follow different methodologies and
metamodels to design these applications. This section reviews some of the interesting works on
Power Distribution Management problems.
2.2.1 Cooperating Intelligent Systems for Distribution System Management
Varga, Jennings and Cockburn use a general-purpose framework called ARCHON
(Architecture for Cooperative Heterogeneous ON-line systems) in order to design a management
system for electricity distribution. They developed the application Cooperating Intelligent
systems for Distribution system Management or CIDIM [1] using the ARCHON multiagent
framework, to design the whole agent community.
One of the important factors that one will observe while analyzing the power distribution
management system is that there are many pre-existing components in the system. So designing
the system from scratch does not make a lot of sense. This is where the ARCHON framework
has an edge over other frameworks. It allows the developer to incorporate the existing systems
along with the newly designed components. This is extremely important for the majority of
existing industrial applications. Even though this is an advantage for the ARCHON framework,
if we compare it with the OMACS, the ARCHON framework does not aid much in assisting the
11

developers for making the application to be dynamic in changing environments. The
organization metamodel that we have used for the PDM system defines agent assignments and
reorganizations in any highly adapting environment. Integrating the existing systems to the PDM
system designed based on OMACS model concepts like agents, roles, goals and capabilities can
deliver a very high order of efficiency for the application.
In CIDIM application, Varga, Jennings and Cockburn use a two-sided approach for
integration. They use a hybrid top-down and bottom-up approach to incorporate the existing
systems and to analyze the problem from a multiagent perspective. The paper details a
specification of the CIDIM application in which the already existing functionalities as well as
those newly required were described. In addition, the paper defines the agent instantiation
approach and some of the common problem solving activities in electricity distribution
management. These works have influenced the design of some of the functionalities and agent
entities in the PDM simulator.
2.2.2 Other Works
Researchers have approached the problem of power distribution management from a
number of different angles. Other than the CIDIM application, some of the notable works in this
area are by Wittig and Mamdani [5] on use of Distributed Artificial Intelligence for industrial
applications and by Li, Poulton and James on Agent based optimizations for Electrical Load
Management. They mainly focus on the implementation of the system and the difference in
performance of the system from the classical approach.
Most of the works on multiagent system design concentrate on simple environments and
a restricted number of agents. The PDM simulator project using the OMACS framework tries to
focus more on some of the more realistic areas like multiple agents, heterogeneity of agents and
different scenarios. The PDM simulator also concentrates on the dynamic behavior of agents in
different scenarios.
12
CHAPTER 3 - PDM System Analysis and Design
This chapter gives the application requirement specification for the power distribution
management system. It explains the modeling of the PDM system and the high-level architecture
for the simulator. The final section has the UML diagrams depicting the relationship between the
various classes created for the implementation of the simulator.
3.1 System Description Figure 3.1 shows the pictorial representation of a part of Power Distribution Network.
The real network will have more number of generating stations interconnected in a similar
fashion. Electricity is generated at the generating station and is transmitted to the customers via
transmission stations. High voltage network grids are used to transmit electricity from generating
station to transmission stations at a range of 132 kV (kilo Volt). Very large industries that may
require high voltage for their machinery will be directly connected to these generating stations.
The voltage is stepped down at the transmission stations and is transmitted to other sub stations
through high voltage lines. The voltage in those lines is typically 33 kV. Commercial and small
industrial buildings are directly connected to them. The domestic consumers require power at a
range of 110 to 220 volt. The electricity from transmission stations is stepped down to the
required voltage using local transformers, from which connections to the domestic and
household consumers are made via low voltage lines. This gives a brief overview of power
distribution networks.
The Control Engineers (CE) monitoring the network has to ensure minimal losses in the
electricity transmission. They make sure that all consumers are supplied an undisrupted power
supply by maintaining an optimal power grid configuration [6]. This optimal configuration is
maintained by reducing the transmission losses, preventing overloads and by proper switching of
networks.
One of the important requirements in order to achieve the above goal is to respond
promptly to the emergencies that may arise due to system faults and to carry out the maintenance
work in a planned fashion. CE must be able to monitor the whole system and information must
13

be available from all the events, and external systems associated with the network [1]. The
customers may be high voltage consumers like industries or low voltage consumers like
independent households. Irrespective of the consumer types, PDM must be able to satisfy their
needs and should be able to deliver an uninterrupted power supply. The simulation helps CE to
achieve this goal by monitoring the network, simulating the electricity transmission and showing
the location and type of fault in the network [5]. It will also suggest the fix for the fault occurred
in the network.
Figure 3.1 Power Distribution Network
Generating Station
Transmission Station
TransmissionStation
Transmission Station
Transmission Station
132kv
33kv
11kv 11kv
110/220v
Commercial and Industrial buildings
Commercial and Industrial buildings
Domestic Consumers Domestic Consumers
Large Industries
The whole PDM system and the simulation act as an aid to the control engineers to
maintain and carry out the electricity distribution system requirements. The system also focuses
on improving the effectiveness of power distribution and on suggesting the network fault fixes.
This is achieved by applying the multiagent approach for designing the system.
14

3.2 Requirements Analysis A simulator for power distribution management must consider all the factors in the
transmission network that can make the work of CE easier. This should integrate the existing
systems as well as the new systems that may improve the overall system management and
information sharing. The important requirements [1, 2, 4] that has to be considered while
designing a simulator for PDM are given below:
1. Monitor Network for faults:
• Monitor data from Telemetry: Telemetry readings contain the following details:
Name of substation, Time stamp, Circuit Breaker State (Open/Close), Alarm State
(Open/Close), Severity (Nil, Low/Medium/High) and any additional information in
String Format.
• Monitor Customer Calls: It has the following details: - Customer Name, Customer
No., Time of Call, Severity (Nil, Low/Medium/High) and any additional information
in String format.
• Monitor Circuit Breaker and Alarms: Circuit Breaker State (NA/Open/Close), Alarm
State (NA/Open/Close).
• Monitor Weather: Weather update messages will contain the severity of
lightning/weather condition and affected Location.
2. Identifying faults on network and Find Fix: Faults will be due to following reasons:
• Overloading: The load connected to a substation grid must not exceed its maximum
load capacity. Anything more the specified maximum load will cause overloading.
• Switching failure: Switch is being operated to restore power to an area by providing
an alternate route. Malfunction in this causes switching failure. It is determined by the
status of the switch (On/Off).
• Third party damage: Any Equipment failure or industrial actions cause disruption in
power supply. The details are obtained from customer calls/telemetry messages.
• Disasters or Lightening: Natural calamity and Lightening will cause disruption in
power supply in the affected area. The disaster/lightening area obtained from Weather
Watch Agent. Information includes name of Substation, Location, Date and Time,
Severity (Nil, Low/Medium/High).
15

3. Analyze faulty network
• Log load readings and database: It will help to analyze if there was any switching
failure or overload in faulty network as described in 2.1 and 2.2.
• Collect information about lightning strikes and weather conditions by implementing a
Weather Watch Agent (WWA)
• Implement a Network Agent that has static information about connectivity of pieces
of plant, and dynamic information like state of circuit breakers, switches and alarms.
The states of them will be in the format given in section 2.
• Implementing a Telemetry Agent (TA) to receive telemetry, convert it to standard
format and to send data to different agents on request. Telemetry data is only present
at the point where there is a join between low voltage and high voltage network.
Substations sent messages to update the status. Message format is as specified in 1.1.
4. Determine the type of fault
• A Network Voltage Expert System (NVES) and a Network Voltage Diagnosis Agent
(NVDA) to diagnose the location, time and type of network fault on the electricity
network.
5. Find Fix for the fault
• Automatic operation of circuit breakers
• Remote switching operation in response to faults
• Coordinate with FE in locations where remote operation is not available
6. Simulate the dynamic information obtained through telemetry, customer calls and
transmission station information.
7. A control system interface view of the organizational level activities and the results of
network monitoring.
3.3 Modeling of PDM Simulator The requirements specified above were used for the modeling of the Power Distribution
Management simulator. It required modeling all the dynamic information necessary for
simulating the environment. The first step was to decide what all data are to be monitored. The
network details were classified based on a top down perspective. From the specification available
for PDM system, the functionalities were refined. This includes monitoring the system and
16

analyzing the monitored data. The analyzed data helps to establish the location and type of fault.
From this, a fix for the network fault has to be determined. Finally, the Control Engineers must
have a simulation of these processes to analyze them and fix the fault.
The initial task was to design a Goal Model that captures the various tasks in the PDM
system. This involved deciding the system level goals, the goal precedence and the events that
can occur while achieving a goal. From this, a Role Model was designed to depict which role an
agent has to play in order to achieve a leaf goal. It also defines the capabilities required for
playing a role. Once this is completed, the agents in the PDM system were decided by analyzing
the Role Model and the Goal Model. The Agent Model was created to show the capabilities
possessed by the agents and the roles that an agent can play.
Each of the above models was created using the agentTool. This helped in getting the
models in XML format, which was used for directly loading the goal specification tree from the
model.
3.3.1 Model Goal
The root goal of the PDM is to Monitor Network for Fault and Find Fix. This goal is
divided into two sub-goals of Monitor Network and Identify Fault & Find Fix based on AND-
refinement. Figure 3.2 shows the Goal Model for PDM simulator. The Monitor Network goal is
subdivided into Monitor Telemetry, Monitor Customer Calls, Monitor CB & Alarm and Monitor
Weather goals by AND decomposition. They are maintenance goals and take care of simulating
the dynamic data in the power distribution network by monitoring the telemetry messages from
the substations, the failures reported by the telephone calls from consumers and the state of
circuit breakers and alarms in transmission stations. The Monitor Weather goal monitors any
severe weather or lightning reported in substation locations. Once any of these activities occur, a
Fault event triggers the Identify Fault & Find Fix goal.
The Monitor Network goals are maintenance goals and hence they are never achieved.
They continue to monitor the network for incoming network messages. Whenever there is an
update, they trigger the Identify Fault & Find Fix goal.
Figure 3.2 Goal Model
17

18 18

The Identify Fault & Find Fix goal is achieved when all the three sub goals Analyze
Fault, Determine Type of Fault and Find Fix goals are achieved. On receiving a Fault trigger
from one of the maintenance goals, an instance of Analyze Fault goal is created. This goal
analyzes the data received while monitoring the network and determines which child of
Determine Type of Fault goal is to be instantiated. On analyzing the monitored data, the
corresponding leaf goal will be triggered on occurrence of any of the events: inspectCB (),
evaluateCC (), inspectTele () and inspectWeather ().
The Determine Type of Fault goal is AND-refined into Inspect CB & Alarm State,
Evaluate Customer Calls, Inspect Telemetry Info, and Evaluate Lightning Info goals. The Inspect
Telemetry Info goal evaluates the data received from substations via the telemetry messages. The
Evaluate Customer Calls goal investigates the complaint details from the customer telephone
calls. Similarly, the Inspect CB & Alarm State goal evaluates the telecontrol messages received
from the transmission stations. They contain information about the state of alarms and circuit
breakers located at transmission stations. Any bad weather updates reported is verified by
achieving the Evaluate Lightning Info goal. These leaf goals play a key role in determining the
location and type of fault.
Once the type of fault is determined, the isFault event is triggered with the fault
information. This event will trigger only the Auto Operation of CB and Remote Switching goals.
The leaf goal Coordinate with Engr is not triggered because the other two goals precede this
goal. These goals determine if a fix can be obtained by automatic operation of the circuit breaker
and by remote switching. Once these goals are achieved, an instance of Coordinate with Engr is
instantiated to determine whether the control engineer should contact the field engineer to fix the
fault.
When the maintenance goal finds more data input while monitoring the network, it results
in other goals being instantiated in the same fashion as explained above. This will help to
determine the location and type of fault, and to find fix for the network problem.
3.3.2 Model Role
The Role Model depicts the various roles in the PDM simulator that an agent can play in
order to achieve the goals. Figure 3.3 shows the Role Model for PDM.
19

Figure 3.3 Role Model
20

Every leaf goal in the Goal model is achieved by playing a different role. Role model also
depicts the capabilities required for playing the role. The four leaf goals of the Monitor Network
goal namely Monitor Telemetry, Monitor Customer Calls, CB & Alarm Monitor and Monitor
Weather are achieved by playing TelemetryMonitor, CustCallMonitor, CBAlarmMonitor and
WeatherMonitor roles respectively. Also for an agent to play any of the first three roles, they
must possess the InfoSharingCapability. This is a capability equivalent to communication
capability, which enables the agents to pass and share the monitored data to other agents in the
model. The TelemetryMonitor role requires a TeleMessageCapability to enable them receive and
process telemetry messages. The CustCallMonitor role requires CallCenterCapability to receive
and monitor telephone calls and complaints from the consumers. Similarly, CB & Alarm Monitor
and Monitor Weather roles require statusCapability and WeatherStnCapability respectively to
process and monitor data.
The Analyze Fault goal is achieved only by playing the role of NWAnalyzer. This role
requires LogCheckCapability, InfoSharingCapability and NWErrDetectorCapability in order to
achieve the goal. Possessing these capabilities by an agent will enable it to analyze the monitored
data for error in network.
The CBAlarmInspector role can achieve the leaf goal of Inspect CB & Alarm. The role
requires the CBMapCapability and InfoSharingCapability for achieving this goal. Similarly, the
WeatherNotifier role achieves the Evaluate lightening Info goal and this role requires the
DBConnectionCapability. This capability inspects if there is a substation at the location where
severe weather is reported. For checking this, it needs to have the WeatherDetector capability, to
obtain the location of known substations from the database. The role TelemetryInspector can
achieve the goal of Inspect Telemetry Log. Any issues in the substation are determined by
inspecting the telemetry messages from the corresponding station. For an agent to play this role,
it must possess the InfoSharingCapability and the teleDBCapability. The Evaluate Customer
Calls goal is achieved by playing CallNotifier role and requires InfoSharingCapability and
DBConnectionCapability to access the database.
Finally, CBOperator, SwitchInspector and Coordinator roles achieve the leaf goals of the
Find Fix goal. They achieve Auto Operation of CB, Remote Switching and Coordinate with Engr
goals, and require the InfoSharingCapability in common to communicate with each other about
21

the actions taken while achieving those goals. In addition, they require cbFixCapability,
switchingCapability and commCapability respectively to achieve the goals.
3.3.3 Model Agents
Figure 3.4 models all the agent types in the PDM Simulator. The agent classes capable of
performing different roles specified in the Role Model were identified in this model. Initially the
Monitor Agent plays the role of TelemetryMonitor, CBAlarmMonitor, CustCallMonitor and
WeatherMonitor. It monitors the network for analyzing the incoming messages in order to come
up with the current network statistics. This agent is designed to possess all the capabilities
required to play the above roles. Therefore, it can play any of those monitoring roles. These
network statistics are sent to the Analyzer Agent.
The capabilities possessed by Analyzer Agent are InfoSharingCapability,
LogCheckCapability and NWErrDetectorCapability. This will enable it to play the role of
NWAnalyzer. This is the only role that the agent can play. Similarly, the agents Telemetry Agent,
CallCenter Agent, CBAlarmCheck Agent and WeatherWatch Agent can play only one role due to
the limited capabilities possessed by them. These agents can achieve the corresponding goals
mapped to the roles by playing the role that they are capable of playing. However, it will become
interesting if there is more than one of any of these agents. For instance, if there is more than one
Analyzer Agent, then the ability to play the role best depends on the score of capabilities
possessed by each of these Analyzer agents.
AutoOp Agent in PDM simulator can achieve the leaf goal Auto Operation of CB. This is
achieved by playing the role CBOperator, as the agent possesses both cbFixCapability and
InfoSharingCapability. Switching Agent possesses switchingCapability along with
InfoSharingCapability, which enables it to play the role of SwitchInspector. Coordinator Agent
is responsible for achieving the Coordinate with Engr goal. This goal allows the control engineer
to coordinate with the field engineer when he fails to fix the fault in the network by automatic
operation of circuit breaker and by remote switching.
PDM simulator allows the user to specify the different agents in the system. A
configuration file is used for this purpose. Appendix A shows a sample configuration file that
specifies the agents in the system along with the capabilities they possess. Configuration file has
the specifications for dynamically loading the agents into the PDM system.
22

Figure 3.4 Agent Model
23
The scenario file in the PDM simulator specifies the network messages that need to be
processed by the system. These files will help in testing different scenarios within the PDM
application. The implementation also allows the user to specify the capability score possessed by
every agent in the system. Appendix B shows the format of scenario file.
3.4 PDM System Architecture Figure 3.5 shows the high-level architecture of the PDM simulator. The OMACS models
for the PDM simulator are created using the agentTool. This gives an xml file for each of the
models. The Goal Model created in this way can be directly parsed to generate a goal instance
factory in the memory. The GMoDS module is used for this purpose. This module reads the Goal
Model file given as input. It parses the xml file to create a goal tree structure in the memory. This
goal specification will have all the relationships specified in the model like the precedes and the
triggers. We can make use of the different method calls specified in GMoDS project to
instantiate the goal tree instance. These calls also help to keep track of the state of various goals.
The Goal Tree Controller handles these functionalities in the PDM application.
The Construct Agent module creates the different agents in the application. It creates
agent objects with different capability scores from the specification given in the configuration
file. The configuration file is nothing but a file in which we list all the agents that are to be
loaded for simulating the system. It also lets the user specify the score of various capabilities
possessed by each of these agents. The capabilities possessed by the agents are mapped using the
Agent Model. The Role and Capability Controller module creates the different roles, and the
capabilities required by them as specified in the Role Model for the PDM system. The Goal Tree
Controller, Construct Agent and Role & Capability Controller modules are linked with the
application layer of the simulator as shown in Figure 3.5.
The Monitoring Module is where all the interactions with the external entities take place.
The telemetry messages sent from the generating stations and the telecontrol messages sent from
transmission stations are received in this module. It handles the information received from the
customers about network complaints and power outages. This module decodes the messages and
passes them to the application layer for processing. The application layer is where the processing
logic is coded. It also helps in sharing information between different modules. The core
24

functionality of the Weather Watch Module is to receive the messages and updates about severe
weather conditions and lightning information.
The Analyzer Module analyzes all the data received about various network updates. The
various agents in this module are responsible for carrying out the analysis. The agents in the
Analyzer Module access the network database for more information about the location of
substations and the default state of circuit breakers and alarms. The Event Handler Module
generates the system level events that cause the goals to be triggered for continuing network
investigation.
Figure 3.5 PDM High Level Architecture
Finally, the Decision Making module in the PDM application evaluates the result of
analysis and takes appropriate action to find fix for the issues reported in the network. The agents
25

in this module are AutoOp Agent, Switching Agent and Coordinator Agent. The Simulator
Interface is the UI module for the PDM simulator where all the actions in the organization and
the network fault reports are displayed. This module receives this information from the
application layer of the simulator.
3.5 Class Diagram Figure 3.6 shows the class diagram for PDM simulator. It represents the important classes
used in the application, their hierarchy and interaction between them. SimpleAgentImpl is the
base class for all the application specific agent implementations. It contains a unique identifier
for representing the agent. It also defines a static list of agents called uniqueAgents. Every time
an object that extends this class is created, the identifier of that agent is added into this map. It
has a method that returns the identifying name of the agent. The AgentImpl class extends this
class. It mainly contains a map to store the list of capabilities possessed by the agent. The
getPossesses () method returns the capabilities possessed by the agent.
All the agents created for the PDM application extends the AgentImpl class. The
MonitorAgent class has methods to observe the incoming network data from various sources like
telemetry, customer calls, telecontrol messages and weather station updates. The capabilities
possessed by the agent are also defined within this class. The AnalyzerAgent has a doAnalyzing ()
method, which inspects the monitored data and decides which agent, can process it for
diagnosing the fault. The class also defines the capabilities possessed by that agent.
The NetworkAgent is the abstract representation of the four agent classes in PDM
application that mainly determine the type and location of fault in network from the analyzed
data. It consists of TelemetryAgent, CallAgent, CbAlarmAgent and WeatherWatchAgent. Each of
them has their own methods implemented to achieve the tasks they are assigned. The FixAgent
shown in Figure 3.6 represents the three agent classes in PDM application: AutoOpAgent,
RemoteSwitch and Coordinator. They have the capabilities defined within them and the methods
that enable them to find a fix for the network fault from the data available.
The structural hierarchy of Role and Capability class implementations is similar to that of
the Agent class. SimpleRoleImpl and SimpleCapabilityImpl are the respective base classes for
them. Both these classes have a variable defined to identify the name of the implemented class
26

uniquely. They also have a static list variable to store the object identifiers and a method to
return the unique identifying name of the extended class.
Figure 3.6 Class Diagram
WeatherNotifier and CallNotifier represent the roles defined for the application. The class
diagram in Figure 3.6 shows only two roles in the PDM simulator. The actual application
27

implements all the roles specified in the Role Model. As the hierarchy of other role classes is
similar to them, they were omitted from the diagram. The GoalSpecificationTree class represents
a goal tree in memory, which has a method to return the goals currently active in the
organization. It also has the list of active goals in the system. The WeatherNotifier and
CallNotifier roles have a composite relationship with the GoalSpecificationTree class. This is
because every role achieves one and only one goal in the organization. Similarly, every goal is
achieved by one and only one role in the organization.
DBConnectionCape and WeatherDetectorCape represent the capabilities defined for the
application. The class diagram shows only two capabilities in the PDM simulator. The actual
application implements all the capabilities specified in the Role Model and Agent Model. As the
hierarchy of all capability classes is similar, they were omitted from the diagram. Every role in
PDM requires one or more capability while every capability is mapped to zero or more roles.
3.6 State Diagram Figure 3.7 shows the state diagram for the power distribution management simulator. The
state diagram depicts the various states of the system during its execution. The first state for
PDM simulator is the initialization phase. It parses the goal model and creates a goal
specification tree in system memory. It also initializes the roles and capabilities in the system.
Then it reads the configuration file to load the agents and assign the capability scores. In the next
state, the scenario file is loaded. The first network message is read. If it is the end of file, then the
simulator is halted. Otherwise, it does new assignments and the simulator will be in running
state. It displays in the UI the output of organizational activities. Once the processing is done, the
simulator goes to the wait state until the next message is read.
Due to the difficulties to create live network messages and weather updates, we use a
scenario file to simulate this. This file contains a list of messages from various sources like
telemetry, transmission stations, call centers and weather stations. Appendix B shows the format
of these messages. The Monitor module processes the messages from this file. There is also an
option to specify the wait time between the messages. This helps to simulate the time difference
between the messages received.
28

Figure 3.7 State Diagram
When there is a wait specified in the scenario file, it simulates the state of no network
data available. The system goes to the wait state. There it waits for the specified time before
processing the succeeding messages. Once it receives a new message, it goes back to monitor
29

state. This loop continues to execute. Once the process is finished, the simulator comes to halt
which is the final state. Any exception during the initialization state will also result in halting the
simulator. The system undergoes these states when we run the PDM simulator.
3.7 Summary The modeling done for the PDM system is explained in this chapter, which eventually led
to the simulation of the system. The Goal Model shown in Figure 3.2 helps to understand the
different tasks within the system. The Agent Model explains the heterogeneous nature of the
system. It shows how the nine different agents designed for the PDM application cooperate and
communicate with each other to achieve the goals in the organization. Following that, the
architecture of the simulator is described. It gives an overview of the functional modules that
need to be implemented for simulating the system. The UML diagrams shown in Figure 3.6 and
3.7 support this. The next chapter focuses on the two different approaches for assignments within
the organization. In addition, the complexity and running time of the two algorithms are
analyzed.
30
CHAPTER 4 - Implementation
This chapter describes the two different approaches used for assignments in the
organization. It also gives a brief overview of the database used in the project. The last section in
this chapter explains the different steps involved in implementing the PDM simulator.
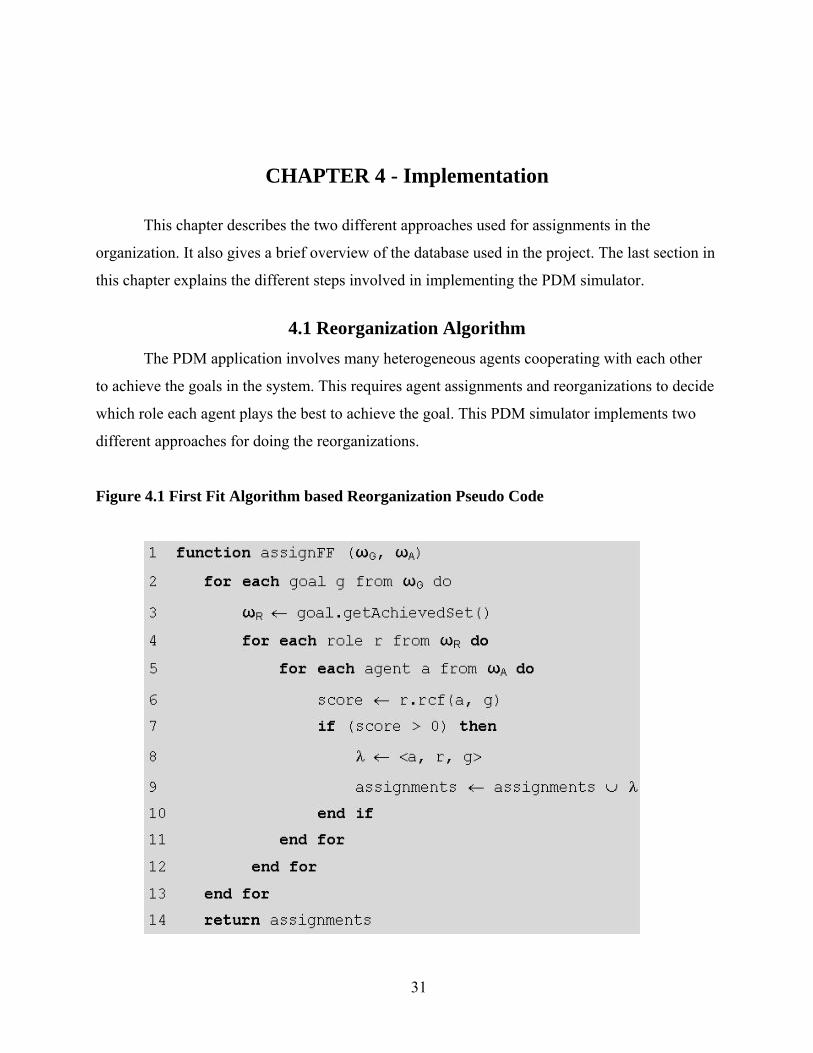
4.1 Reorganization Algorithm The PDM application involves many heterogeneous agents cooperating with each other
to achieve the goals in the system. This requires agent assignments and reorganizations to decide
which role each agent plays the best to achieve the goal. This PDM simulator implements two
different approaches for doing the reorganizations.
Figure 4.1 First Fit Algorithm based Reorganization Pseudo Code
31

Figure 4.1 gives the pseudo code for first fit algorithm based agent reorganization. In
lines 1-3, we iterate through the active goals in the system and makes use of the getAchievedSet()
method to get the list of all roles that are capable of achieving each goal. Lines 4-6 iterate the list
of available agents over the list of roles in order to find out the score returned by the role
capability function (rcf). The rcf () function calculates the effectiveness of the given agent to
play the role. If the method returns zero as the score, then the agent cannot play that role. As we
use a first fit strategy, whenever the score is greater than zero we assign the agent to play that
role and adds to the list of assignments. Lines 7-10 do this. This strategy ensures faster
assignment processing. However, it does not always assign an agent to the role that it can play
the best.
The next step is to analyze the complexity of the algorithm shown in Figure 4.1. The for
loop in line 3 executes ng times where ng is the number of goals in the active set. Similarly, the
for loop in line 4 and 5 executes nr and na times, where nr is the number of roles and na is the
number of agents in the organization. Everything else runs in constant time. The worst-case
running time of the first fit algorithm will be O (ng.nr.na). In the PDM application, every leaf goal
is achieved by a separate role defined in the organization. Hence the for loop in line 4 runs in
constant time reducing the overall complexity to θ (ng.na). If we assume the number of active
goals to be same as the number of agents in the system, then ng will be equal to na. In that case,
the running time of the algorithm will be θ (n2), which is quadratic time.
The second algorithm used is the best-fit algorithm. Figure 4.2 gives the pseudo code for
this. It is a modified version of brute force algorithm. In this, we consider all the possible
assignments for an agent, and assigns only the one in which it has the maximum score for role
capability function. This will ensure that the agent is always assigned the role that it can play the
best.
In lines 3-7, we iterate through the list of active goals and roles in the organization to
check if a role can achieve the goal. Whenever we find a role that can achieve the goal, we add it
to the power set P. Now set P will consist of all the valid role-goal mappings. The refine () will
filter this set in accordance with the testing requirements. The requirement may be that, we do
not want a specific role to achieve any of the goals. These filtering are done within this method.
Once this mapping is refined, Lines 8-16 iterates through the refined set and the list of
agents available in the organization. It calculates the ability of each agent to play a role by using
32

the role capability function. The next step is to makes sure that this is the best available
assignment based on rcf score. The best () method call in line 13 takes care of this. This method
iterates through the set of assignments to check if the new assignment is better than the
assignments in the set. If the new assignment has a better rcf value, then the set of assignments is
updated. Line 17 returns the set of assignments to the called function.
Figure 4.2 Best-Fit Reorganization Pseudo Code
If we analyze the time complexity of best-fit algorithm, we can see that it runs in cubic
time. The first two for loops given in line 2 - 6 takes quadratic time in the worst case. In our
application there is a separate role defined to achieve every goal in the organization. Therefore,
the complexity will be reduced to θ (ng), which is in linear time. The method refine () also runs in
33

linear time as it requires just one loop to iterate through the power set, P. From the above
analysis, we can conclude that for PDM application, the nested for loop in line 8-9 also run in
quadratic time. However, the method best () needs iterating the assignment set to verify the
maximum score of assignments. Hence the running time for that function call is θ (n), where n is
the number of elements in the assignments set. Everything else in the algorithm runs in constant
time. From this, we can see that the best-case running time is θ (ng + n + ng.na.n). Whenever we
have a polynomial run time for an algorithm, we simplify it by throwing out all but the highest-
order term. In the worst case, ng and na will be equal to n and hence the complexity of the
algorithm will be θ (n3), which is in cubic time.
The algorithm ensures that the agents are assigned based on the capabilities possessed by
them. As it relies on the brute force algorithm, it has to consider all the possible combinations to
delegate the most effective assignment. This is the reason why it has higher running time.
The running time analysis of the two algorithm implementations is provided in the next
chapter. The time and efficiency of agent assignments during reorganization was tested for a
given scenario. The graphical analysis is shown in the results section of the last chapter.
4.2 Database The control center in a real world power distribution management system receives
various types of messages from different sources. They receive weather update messages from
weather stations, network complaints from domestic consumers by telephone etc. If weather
station reports a severe weather or lightning info at a certain location, it will not have any detail
about the generating stations located at near that place. Therefore, there must be a database
where the location of all the generating stations is listed. Similarly, the details about the
transmission stations to which consumers at different locations are connected come from the
database. These data are required in order to analyze the messages received.
To serve this purpose, we have created a MySQL database. The database mainly
contains three tables, which has information about various network details. The first table is
Substation_Details table. The structure of the database is shown in table 4.1. It mainly contains
the details of generating stations including their name, city where station is located and
maximum load allowed. Every generating station has a code name, which is used in the
telemetry messages. For example, the generating station at Wichita is known as Murray Gill
34

Energy Center [13] and the name used in messages is MGEC. When a telemetry message is
received with this name, the location and load details are obtained from the Substation_Details
table.
Table 4.1 Substation_Details
Column Name Data Type
Name_of_Substation varchar
Max_Load int
Location varchar
The next table in PDM database is Cust_SS_Mapping table. This table has mapping of
substation to customer location. Electricity to customers at a location is supplied from the
substation nearest to that location. If a customer complaints about power outage, the only detail
they report is their location. In order to know the substation to which the customer is connected,
we need to fetch data from this table. Table 4.2 shows the structure of this database.
Table 4.2 Customer_SS_Mapping
Column Name Data Type
Name_of_Substation varchar
Customer_Location varchar
The third table in PDM simulator is called Transmission_Station. This table contains the
location of transmission stations and the default status of circuit breaker and alarm in these
stations. The structure of Transmission_Station is as shown in Table 4.3.
Table 4.3 Transmission_Station
Column Name Data Type
Transmission_Station varchar
CB_Status int
Alarm_Status int
The default status of alarm and circuit breaker can be one, two or three. A status value of
one represents they are On/Open by default. Similarly, a status value of two denotes they are
Off/Close by default. Any value other than these two shows the absence of the respective
35
equipment in the transmission station. The data from this table is required to analyze the
messages received from transmission stations through telecontrol messages.
The weather update messages will not contain any details of nearby substation location.
So the network database is used to find out if severe weather was reported near any of the
generating station locations. The main purpose of this database is to support the analysis done
during the simulation for determining the location and type of fault. This is not a very important
entity in the PDM architecture as we are more interested in the behavior of agents in the
organization and their reassignments.
4.3 Implementation Details The first step in implementing the PDM simulator was to generate the Goal Specification
Tree from the Goal Model shown in Figure 3.2. The GoalModel project was used to parse the
Goal Model and create the specification tree in memory. This also creates all precedes and
triggers relationship specified in the model. In the next step, the roles for achieving goals were
created conforming to the Role Model specifications in Figure 3.3. All the roles extend the
RoleImpl class of the OrganizationModel project. The role to goal mappings was made in the
application layer of the simulator project.
Once the goal and role structure were developed, the capabilities were implemented. The
agents and capabilities extend their base implementation from the OrganizationModel project.
The capabilities that an agent must possess were defined and added. The Initial Trigger creates
instances of Monitor goals. All the agent assignments are done within the assignment () method.
The main objective of Monitor goals is to watch the network for different messages and
updates in the power distribution management system. We use static input in order to simulate
this. Scenarios file specifying the various incoming messages are used for the PDM simulator. In
order to mock a real world application, there is an option to specify wait time between the
messages in the scenario file. This will make sure that the simulation runs for a particular amount
of time. See Appendix B for the format and specification of scenario file. It can have data from
the telemetry messages coming from the substations, details of customer complaints by
telephone call, state updates of circuit breakers and alarms in various transmission stations and
the weather condition of any location. We can also leave message data empty to simulate
corrupted messages.
36

Figure 4.3 PDM Simulator
37

The implementation follows the design and every time an organizational activity
happens, the updates are displayed in the simulation screen shown in Figure 4.3. The
maintenance goals for monitoring the network are never achieved. They continuously monitor
for network data as specified in the scenario file. The PDMEventHandler class takes care of the
events that occur while achieving goals, thereby triggering new instance of goals.
The top row of the simulator screen shows the list of all the goals in the Goal
Specification Tree and all the agents acting in the PDM application as specified in the
configuration file. In addition, it shows the list of capabilities the agent can possess and roles that
the agent must play in order to achieve the goals. The second row in Figure 4.3 shows the agent-
role assignments for the active goals in PDM. It also shows the score of role capability function
returned for each of these assignments. This score indicates how effectively an agent can play a
role to achieve the goal. The higher the score returned, the better the quality of assignment.
Once a goal is achieved, it is moved to the achieved goals list shown next to that. The
third row in the PDM simulator displays the result of network analysis along with failure
location and fix for the network fault. It also displays all the organizational level activities like
agent assignments, reorganizations, event occurrence etc.
There are two ways to run the simulation. Clicking the Simulate button will do all the
analysis continuously without any pause and the results will be displayed. The other method is to
step through the process. In this, every time the Step button is clicked, it will show the active
goals and the agent that achieves it, in the assignments box. It also shows on the simulator screen
the roles played by the agent and the rcf score for assignment. This will allow stepping through
the simulation in order to track the organizational activities. Appendix C gives the procedure for
running the simulator.
The PDM simulator also creates a log file in which it logs all the activities taken place in
the organization. This will help to compare the reorganizations and activities between various
scenarios simulated.
4.4 Summary This chapter explains the two different algorithms used for the implementation of
reorganization within the PDM simulator. In addition, the complexity and running time of
algorithm is analyzed. The first-fit algorithm has quadratic running time while the time
38

complexity of the best-fit algorithm is θ (n3). The next section describes the structure of database
used for simulator. The analysis of network messages is highly influenced by the records entered
in this database. The next chapter gives the running time of the two different algorithms when
implemented in java.
39

CHAPTER 5 - Results
The first section in this chapter illustrates the results and conclusion of PDM Simulator
implementation. The next section contains the time and efficiency analysis of agent assignments
when using the two different reorganization algorithms. In the final section, it describes the
limitations of the implementation and an outline of future work suggested for improving the
usefulness of the application.
5.1 Result Analysis The goal of simulating a power distribution management system for monitoring the
network for faults and finding fix was achieved. The design and implementation of PDM
simulator conforms to the OMACS methodology.
The simulator was run with both the reorganization algorithms in order to analyze the
difference in running time. For the same scenario file, the time taken for agent assignments was
studied. Figure 5.1 shows the graph plotted for number of agents against time in milliseconds. In
the tests, the time was logged just before the algorithm begins and immediately after the
algorithm completes. The algorithm was implemented in Java. The system used for testing had a
2 GHz Intel Core 2 Duo processor with 1 GB RAM. The JVM could provide a precision of
microseconds.
For the first run, the number of agents in the organization was thirteen. The time taken for
the assignment function throughout the simulation was recorded. In addition, there were five
runs of the same test so that a better estimate of the runtime could be obtained. It was found that
the first fit reorganization took lesser time compared to the best-fit algorithm. The same test was
repeated by increasing the number of agents to eighteen and twenty-three. In all cases, the time
taken by best-fit algorithm based assignment was slow compared to the other.
Figure 5.1 shows the graphs plotted based on tests. As the number of agents is increased,
the time taken for assignments also increases. It is obvious that the difference in time taken by
the two methods is not very high. The result looks linear because many operating systems
measure time in units of tens of milliseconds. Even though, java returns time in milliseconds, the
40

granularity of the value depends on the underlying operating system implementation. As the time
taken for executing the assignment algorithm is in milliseconds, we need to run the test in a
system that can give results accurate to the degree of microseconds. In addition, the test included
limited number of messages in the scenario file. In the real world application, the system will be
running for longer periods and the number of network messages processed will be much higher.
In those cases, this difference in time will be much more significant and will play a key role in
the performance of the system.
Figure 5.1 Number of Agents – Time Graph
No. of Agents - Time
0
500
1000
1500
2000
2500
13 18 23
No. of Agents
Time in ms First Fit
Best Fit
Another important observation in the analysis of simulation result was that the best-fit
algorithm made sure that during reorganization, the agent is always assigned to the role that it
can play the best from the specified score of capabilities that it possess. This may not be better
than the assignments based on organization assignment function (oaf). Considering the fact that
we mainly depend on the capability scores for assignment, this approach gives better
assignments than first-fit algorithm.
41

As the first-fit approach always chose the first available match for assignment, agents
were not assigned the roles that it can play most effectively. Figure 5.2 shows the chart that
compares agents against the rcf scores. The four monitor agents were tested for this. From chart,
it is clear that the agents were assigned to play roles, which they can play the best when using the
best-fit based assignment. The x-axis shows the four monitor agents and y-axis shows the rcf
values of their assignments.
Figure 5.2 Agents - rcf Chart
Agent - rcf Chart
0
0.1
0.2
0.3
0.4
0.5
0.6
0.7
0.8
0.9
1
1 2 3 4
Agent Name
Best FitFirst Fit
5.2 Conclusion The PDM application was able to simulate the process of power distribution management
by displaying the goals, roles, agents and assignments in the simulator. It was able to mock the
real world application by analyzing and simulating the network messages using the scenario file.
Two different approaches were put forward for the organization level assignments. An analysis
of runtime complexities of reorganization algorithms was done.
This project will be helpful to test and analyze the performance of multiagent systems
designed using the OMACS framework. It allows modifying the number of agents in the
organization and the score of capabilities possessed by each agent. The configuration file makes
42
it easy to achieve this. It also helps in studying the behavior of the organization under various
conditions. The system can be used for studying various network conditions by changing the
specifications in the scenario file. Analyzing the system for different reorganization algorithms
is also straightforward. The log files created during the simulation will help in comparing the
organization level activities when running the system in different environments. These are the
main advantages of using semi-autonomous agents for designing the PDM simulator.
Thus, the PDM simulator will be a useful tool for the analysis of systems designed using
the multiagent approach. It will help to study the methodology and performance, on applying
multiagent approach for complex and distributed systems.
5.3 Limitations One limitation of the PDM Simulator is the unavailability of live network messages and
updates. In order to overcome this, we specify all the network messages in a scenario file. It will
enable to test different situations that an electricity distribution network may encounter. The file
also allows specifying the wait time between two messages in order to simulate the time
difference between the different updates received in the real world scenario.
Another limitation of the simulator is that we do not use xml format for configuration file
and scenario file. They are plain text files. Therefore, the simulator expects the user to follow the
exact format specified while modifying those files. The format of these files are specified in
Appendix A and B.
5.4 Future Work Incorporating some changes to this simulator will make it more flexible and reusable.
One of the features of this simulator is that it can read the Goal Model diagram created using the
agentTool and can create a goal specification tree in the memory. If this feature is extended to
read Role Model and Agent Model, then it will be able to simulate any application designed
using multiagent approach, with very less modification. This will help in developing this into a
generic simulator framework. It enables to simulate a system from the design models. It will also
let the user easily customize the simulator for specific applications.
Another enhancement suggested for this simulator is to make the configuration file and
scenario file into xml format. This will add a lot more flexibility to the application.
43

Bibliography
1. L.Z. Varga, N.R. Jennings, D. Cockburn, “Integrating Intelligent Systems into a
Cooperating Community for Electricity Distribution Management”, International Journal
of Expert Systems with Applications, 1994.
2. N.R. Jennings, “The ARCHON System and Its Applications”, Second International
Working Conference on Cooperating Knowledge Based Systems, 1994.
3. D. Cockburn, N.R. Jennings, “ARCHON: A Distributed Artificial Intelligence System for
Industrial Applications”, John Wiley Sixth-Generation Computer Technology Series,
1996.
4. D. Cockburn, L.Z. Varga, N.R. Jennings, “Cooperating Intelligent Systems for Electricity
Distribution”, International Journal of Expert Systems with Applications, 1994
5. T. Wittig, N. R. Jennings and E. H. Mamdani, “ARCHON: framework for intelligent co-
operation”, Intelligent Systems Engineering, 1994
6. L. Panait and S. Luke, “Cooperative Multi-Agent Learning: The State of Art”,
Autonomous Agents and Multi-Agent Systems, 2005
7. Y. Yamaguchi, Y. Shimoda and M.Mizuno, “Development of District Energy System
Simulation Model Based on Detailed Energy Demand Model”, Proceeding of Eighth
International IBPSA Conference, 2003
8. Scott A. DeLoach, W. H. Oyenan and Eric T. Matson, “A Capabilities-based Model for
Adaptive Organizations”, as resubmitted to Journal of Autonomous Agents and
Multiagent Systems, October 2006.
9. Scott A. DeLoach and Eric T. Matson, “An Organizational Model for Designing
Multiagent Systems”, In Technical Report WS-04-02, pages 66-73, San Jose, California,
July 2004. The AAI-04 Workshop on Agent Organizations: Theory and Practice
(AOTP’04), AAAI Press.
10. Christopher Zhong and Scott A. DeLoach, “An Investigation of Reorganization
Algorithms”,
44

11. Miller, Matthew A. Goal Model for Dynamic Systems. Master's Thesis, Dept. of
Computing and Information Sciences, Kansas State University, 2007
12. Scott A. DeLoach, “Multiagent Systems Engineering of Organization based Multiagent
Systems”, In SELMAS ’05: Proceedings of the fourth international workshop on
Software Engineering for large-scale multi-agent systems, pages 1-7, New York, NY,
USA, 2005.
13. Westar Energy website, http://www.westarenergy.com/corp_com/contentmgt.nsf
/publishedpages/our%20energy%20home
45

Appendix A - Configuration File
We specify all the agents for running the PDM simulator in this file. The file lets user
specify the name and the capability scores for each of the agent. We can specify any number of
agents in this file. This is a text file and it expects all the specifications to be in the format given
below.
<Agent Name 1>
<Capability Name 1> <Capability Score>
<Capability Name 2> <Capability Score>
Figure A.1 shows a part of the configuration file used for running the PDM simulator.
Figure A.1 Sample Configuration File
46

Appendix B - Scenario File
We specify all the different network messages in this file. It will also allow the user to
specify a wait time in seconds between the messages. We can specify any number of network
messages in this file. This is also a text file and it expects all the specifications to be in the
format given below. The possible values for different messages are given in section 3.2.
Figure B.1 shows a part of the scenario file used for running the PDM simulator.
Figure B.1 Sample Scenario File
47

48
Appendix C - User Manual
The various steps for running the simulator are given below.
1. Check out the PDMSimulator project from the macr.user.cis.ksu.edu project
repository.
2. Create a text file in C:\Desktop with name as config.txt.
3. Specify all the agents and their capability scores in the format given in Appendix
A.
4. Create a text file in C:\Desktop with name as scenario.txt.
5. Specify the network messages for testing the scenario in the format given in
Appendix B.
6. Open the PDMSimulator project using Eclipse IDE.
7. Add the projects GoalModel and OrganizationModel to its build path.
8. Right Click on the file PDMSimulator.java in edu.ksu.cis.macr.pdm.simu package
and click on Run as Java Application.
9. The application displays the simulator screen as shown in Figure 4.3
10. The Step button lets the user run the application one-step at a time. It updates the
screen with the organizational activities in each step.
11. The Simulate button will let the simulator run without any pause.
12. Once the simulator is run, a log file is created in location C:\Desktop\logs\
13. The file contains all the organization level activities during the simulation.