Embed Size (px)
Citation preview

Ninth Canadian Conference on Earthquake Engineering Ottawa, Ontario, Canada
26-29 June 2007
SIMULATION OF POST EARTHQUAKE EMBANKMENT FAILURE BY SEEPAGE-INDUCED LIQUEFACTION
S.A. Bastani1 and B.L. Kutter
2
ABSTRACT
Several earth dams, tailings dams, and slopes have failed or have been severely damaged due to liquefaction during or after earthquakes. In a significant number of cases, liquefaction-induced failure of embankments occurred from seconds to hours after an earthquake. One mechanism that would explain the delay between the end of shaking and the failure is that water produced by deep densifying layers flows upward and accumulates beneath an impermeable layer causing loosening of the soil beneath the impermeable layer. A finite slope, made of Nevada Sand, was modeled in the large Geotechnical Centrifuge at UC Davis to evaluate post-earthquake deformations with an injection-induced liquefaction system. A constitutive model was developed to capture the behavior of sands with a minimum number of parameters to enable prediction of post-earthquake liquefaction and/or seepage-induced liquefaction. This constitutive model, based on Critical State concepts is obtained by adding five physically meaningful parameters to the conventional Mohr-Coulomb model. The constitutive model is shown to capture the essential features of sand behavior under monotonic drained and undrained triaxial loading and water injection in a simple shear test under a constant shear stress. Using this constitutive model, the failure mode of a model, tested at the UC Davis large centrifuge, due to seepage-induced liquefaction was studied utilizing the FLAC finite difference computer code. A ¼ scale model of the embankment tested in the large centrifuge was also shaken in the small centrifuge at UC Davis. Finally, a similar embankment was tested with approximately four times higher g level at the large centrifuge facility. Void ratio redistribution phenomena were observed by the numerical models, indicating its influence on the deformation pattern of sands during and after injection and/or shaking. The results and comparison of the three centrifuge tests and the numerical models will be presented in this paper.
Introduction
Examples of post-earthquake liquefaction-induced failures of embankments are reported by Dobry and Alvarez (1967), Seed et al. (1975), Okusa et al. (1978), and Finn (1980) based on the field case histories and by Malvick et al. (2004) in a centrifuge test at UC Davis. In these cases, liquefaction reduced the material strength and failure occurred under static forces after the earthquake shaking. One mechanism
1Vice President, Principal Engineer, Hushmand Associates, Inc., 250 Goddard, Irvine, California, USA
2Professor, Dept. of Civil and Environmental Engineering, University of California, Davis, California, USA
1903

for the delayed failure is the softening associated with redistribution of void ratio caused by gradients of pore water pressure in sloping ground with nonuniform permeability. This mechanism has been studied by Malvick et al. (2003) and (2004), Fiegel and Kutter (1994), and Kokusho and Kojima (2002). For the present study, the post-earthquake liquefaction-induced failure of granular embankments was investigated by two static centrifuge tests in which the water that might be produced during an earthquake due to densification of deep saturated soil was simulated by injecting a similar volume of water at the base of the model. One of the static experiments was later modeled in ¼ scale in a smaller centrifuge which was shaken by a sinusoidal motion. The static centrifuge tests were modeled by Fast Lagrangian Analysis of Continua (FLAC) computer code utilizing a new constitutive model as presented in this paper. For more
details on the centrifuge and numerical models refer to Bastani (2003).
Centrifuge Models
The static (NAB4 and NAB8) and dynamic (NAB5) centrifuge test configurations are shown on Figs. 1 through 3. The centrifuge models consisted of a densified coarse sand (Monterey sand, median grain size, D50 = 1.25 mm) layer beneath an embankment composed of a fine sand (Nevada sand, median grain size, D50 = 0.12 mm) capped by a layer of low permeability silty clay (Yolo Loam, ML-CL). The coarse sand layer was utilized to spread the injected water in the static experiments.
223146191
Coarse Sand
Nevada Sand
Yolo Loam
PPT 5296
PPT 1000
PPT 3589
PPT 3099PPT 2864
LVDT # 12LVDT # 9
LVDT # 14LVDT # A
LVDT # 11
ACC # DC88
ACC # CT99
ACC # DE87
ACC # DB81
ACC # CK57
ACC # CB93
1473
356
356
51 Coarse Sand
51
533584
Nevada Sand
102
51
51
23.5
Plastic Bag Filled with Water
Water
LVDT #2
LVDT #3
LVDT #14 LVDT #1
PPT #2864
PPT #6711PPT #5296
PPT #3589
PPT #6726
PPT #3298
PPT #3090
PPT #3099
116
36
Figure 3. Configuration of static test, NAB8, dimensions are in millimeters.
Figs. 1 through 3 are drawn to scale so that other dimensions may be scaled from the figures based on the given dimensions. The slope angle for the models was between 23.5 to 24.5 degrees. All dimensions are provided in the model scale. The average void ratio of the Nevada Sand was 0.74, 0.73, and 0.77 corresponding to relative densities of 41, 43, and 33 percent for NAB4, NAB5, and NAB8, respectively. The sand was dilative at the confining pressures applied in these experiments. The Yolo Loam had average undrained shear strengths of about 8.9 kPa in NAB4 and NAB5 and 11.6 kPa in NAB8 with an
Figure 1. Configuration of static test, NAB4, dimensions are in millimeters.
Figure 2. Configuration of dynamic test, NAB5, dimensions are in millimeters.
1904

approximate water content of 30 to 33 percents. The dynamic centrifuge model, NAB5, was ¼ the scale of the static centrifuge NAB4 with a similar slope geometry; however, lengths of slope toe and crest were slightly different due to the centrifuge box dimensions. Since the small centrifuge radius (approx. 1 m) was much smaller than the large centrifuge radius (9 m), NAB5 surfaces were properly shaped/curved to match the level ground situation and to compensate for the radial acceleration field at the sides of the slope. The coarse sand was also densified and shaped to create a flat and rigid base for the Nevada Sand embankment. Base/input acceleration of NAB5 was designed to produce liquefaction at the top 25 mm of Nevada Sand after six cycles of shaking. The small centrifuge model, NAB5, was shaken with 10 cycles of sinusoidal ground motion with single amplitude of 7g and approximate duration of 0.25 seconds in the model scale. An additional overburden pressure equivalent to 90 mm of water head was applied over a plastic membrane on the Yolo Loam layer during consolidation of NAB8. The centrifuge models NAB4, NAB5, and NAB8 were consolidated in several stages up to 10g, 40g, and 37.9g, respectively. All results presented in this paper are in the model scale.
Constitutive Model
A constitutive model was developed to simulate behavior of Nevada Sand in the FLAC program
framework, and it was incorporated in the numerical modeling of the static centrifuge test. The purpose of this model was to predict the principal behavior of Nevada Sand with a minimum number of parameters that are physically defined and measurable. The failure envelope for this constitutive model corresponds to the Mohr-Coulomb constitutive model (shear yield function) with tension cutoff (tensile yield function). The shear flow rule is non-associated and the tensile flow rule is associated. The shear potential function also corresponds to a non-associated flow rule. Details of Mohr-Coulomb model implementation are explained in the FLAC manual (Itasca 2001).
Several modifications are made to the Mohr-Coulomb model. The mobilized friction angle (φmobilized = φcs +
φdilation) is represented as a sum of the critical state friction angle (φcs) and the dilation angle (φdilation) as
suggested by Bolton (1991). φcs is considered constant, while, the φdilation is assumed to be variable
depending on the distance of the material state from the critical state line in e-log(p′) space, defined by the state parameter:
a
acscs
p
peeee
'log)( λψ +−=−=
(1) where e is the void ratio, (ecs)a is the critical state void ratio at one atmosphere, λ is the virgin compression slope, p′ is the mean effective stress, and pa is the atmospheric pressure. Been and Jefferies (1985) showed that the gradual change from dilative to contractive behavior could be quantified in terms of the state parameter ψ. The dilation angle (φdilation) was modified based on the state
parameter ψ and it changes according to equation [2].
( ) )1(.0
ψ
ψφφ
∆−=
dilationdilation (2)
where φdilation is the updated dilation angle, (φdilation)0 is the initial dilation angle, ψ is the state parameter,
and ψ∆ is the variation of the state parameter. The soil’s bulk and shear moduli are also modified in the
model. The bulk modulus (K) is evaluated utilizing equation [3].
( )
κ
epK
+=
1' (3)
where κ is the unloading slope and p′ and e are defined as above. The shear modulus (G) was
consequently determined based on the bulk modulus (K) and their elastic relationship in equation [4].
( )
( )υ
υ
+
−=
12
213 KG (4)
where ν is effective stress Poisson’s ratio. In summary, the constitutive model parameters are φcs, ν , κ ,
(φdilation)0, λ, and (ecs)a, and the material state is described by the void ratio.
1905

The behavior of the constitutive model under selected load paths is presented in Fig. 4, which shows predicted paths for: conventional drained triaxial compression, conventional undrained triaxial compression, and a simple shear element subjected to a constant shear stress and water injection. Results are shown for deviator stress (q), mean effective stress (p'), volumetric strain (εv), void ratio (e),
and shear strain (γ). The constitutive model predicted the strain hardening behavior of the Nevada Sand during undrained shearing until cavitation occurred prior to reaching the critical state line. The predicted undrained path in Fig. 4 reasonably matched test results for the Nevada Sand with a relative density of 39.4% under the undrained condition in a triaxial test. The constitutive model behaved more stiffly under the undrained condition, approximately 2 times more than what was observed in the triaxial experiments for the Nevada Sand with a relative density of 26%. Comparison of the calculated undrained stress paths with experimental data (not shown here) are presented by Bastani (2003).
Model Behavior:
Drained Triaxial
Undrained Triaxial
Simple Shear w/ Water Injection
(Khc=0.6, τxy=62 kPa)
0 50 100 150 200 250 300
p' (kPa)
0
50
100
150
200
250
300
q (
kP
a)
(φ')cs
(φ')cs+(φ')dilation
0 0.05 0.1 0.15 0.2
γ
0
50
100
150
200
250
300
q (
kP
a)
0 0.05 0.1 0.15 0.2
γ
-100
-50
0
50
100
150
Po
re W
ate
r P
ress
ure
(k
Pa)
0 0.05 0.1 0.15 0.2
γ
-0.01
0
0.01
0.02
0.03
0.04
εv
1 10 100
p' (kPa)
0.76
0.8
0.84
0.88
0.92
e
Figure 4. Behavior of the new constitutive model.
Under the drained condition, the model behavior exhibited elastic contraction up to the peak shear stress. Dilation started after the peak shear stress and continued up to the critical state condition. Finally, the model behavior was studied under a constant shear stress and pore water pressure increase, modeling a simple shear test with pore fluid injection. The constitutive model slightly dilated prior to reaching the failure envelope; thereafter, the sample dilated with the increase of pore water pressure and the stress path approached the origin along the failure envelope in the p′-q space until it reached the
critical state condition similar to the stress path suggested by Boulanger (1990). Similar stress path for sands were also observed in triaxial tests using similar procedures by Boulanger and Truman (1995) and Vaid and Eliadorani (1998).
1906

As expected, the water injection into the element led to an unstable condition and a dynamic collapse when the strength of the element dropped below the constant applied shear stress. The simulation was carried out in FLAC, so the stresses in the element could continue to be tracked, even during the unstable dynamic collapse. Some numerical oscillation is observed in the q-γ curves at shear strains greater than
0.12, but the softening behavior can still be clearly observed during the unstable collapse. The parameters used for this calibration and later in the numerical modeling based on this constitutive model are provided in Table 1.
Table 1. Model Parameters. * Obtained from Archilleas et al. (2001).
Numerical Models of NAB4 and NAB8
The FLAC runs utilized the new constitutive model to predict the Nevada Sand behavior. The numerical
models were bounded by its own limitations and those of the constitutive model; however, it was successfully used to observe both the general mechanism of localized increase in void ratio just beneath the less permeable silty clay layer and the failure mechanism; exact predictions were not expected. The FLAC run was performed in the large strain mode.
Figs. 5 and 6 show the grids utilized in these models. The grid nodes and elements are identified in the subsequent figures with their column and row numbers (i,j). The column and row numbers increase from left to right and bottom to top, respectively.
Parameters Value
λ* 0.022
κ (=λ/5) 0.0044
φcs (degrees) 32
(φdilation)max (degrees) 10
ν 0.25
(ecs)a* 0.809
Atmospheric pressure, pa (kPa)
101.2
G r i d p l o t
0 5 E - 1
(40,21)(15,21)
(46,9)
Nevada Sand
Yolo Loam
Monterey Sand
(15,16)
(19,8)(14,8)(20,14)
(25,18) (41,18)
Figure 5. NAB4 FLAC mesh, scale in meters.
1907

Contours of mobilized volumetric strain, shear strain, and grid deformation patterns for the runs are plotted in Fig. 7. The lower 51 mm of the Monterey Sand layer is not shown for NAB4 plots in this figure. This numerical model indicated the following behavior: 1. Volumetric strains were concentrated along the interface of Nevada Sand and Yolo Loam layers; 2. Due to dilation, the mobilized friction angle was reduced to its critical state value along the Nevada Sand interface elements; 3. Shear strains were concentrated at the slope interface within the Nevada Sand layer; and 4. Nevada Sand and Yolo Loam layers moved downward along the slope, which was translated to vertical uplift at the toe. A significant, but smaller amount of dilation and shearing of deeper elements along the interface of Monterey Sand and Nevada Sand was also observed. It should also be noted that the development or lack of a deep failure mechanism was affected by the rate at which the water was injected relative to the permeability of the soils. For somewhat slower injection in the analysis, the deeper mechanism disappeared and only sliding along the bottom interface of the Yolo Loam was apparent. For much greater injection rates, a failure mechanism at the interface between the coarse Monterey Sand and the fine Nevada Sand was observed (Bastani 2003).
Grid plot
0 0.5
(13,9)
(18,4)
(20,13)
(40,16)(34,12)
(15,16)
(15,19)
(18,6)
(28,16)
(47,6)Nevada Sand
Yolo Loam
Monterey Sand
Figure 6. NAB8 FLAC mesh, scale in meters.
1908

G r i d p l o t
0 5 E - 1
0 1 E - 1
Friction Angle
M a x D i s p = 1 . 5 2 4 E - 0 2
0 5 E - 2
Shear Strains
Deformation Pattern
M a x D i s p = 4 . 6 4 8 E - 0 2
Volumetric Strains
Experiment NAB4
After 5 Seconds of Injection
Experiment NAB8
After 13 Seconds of Injection
Figure 7. Volumetric and shear strains and deformation patterns. Stress/strain paths of several elements at the toe, along the slope, and at the slope crest are plotted in Fig. 8 for the both models. In the figure, the shear strain is plotted on a logarithmic scale to allow visualization of behavior at small and large strains. Effective stresses of slope/leaning elements (20,14) and (25,18) of NAB4 and (20,13) and (28,16) of NAB8 reduced while oscillating around constant shear stresses up to the failure envelope. Shear stresses of elements (14,8) and (19,8) of NAB4 and (18,4) of NAB8 along the slope toe increased during the failure of leaning elements until reaching the failure envelope. Stress paths moved toward the origin after reaching the failure envelope and strain softening was observed. The stress path of toe elements moved away from the origin along the failure envelope in p’-q space without any additional shearing when the injection was halted; however, the slope and crest elements slightly dilated and showed additional shear strains after termination of injection. In general, the elements at the toe and along the slope showed higher shear strengths prior to the diving of their stress paths toward the origin due to the ability of the modified constitutive model to withstand a mobilized friction angle greater than the critical state friction angle during dilation. The volumetric strain rate of elements was drastically increased when the elements yielded either in shear or volume as shown by element (20,14) of NAB4 and (20,13) of NAB8. The volumetric strains were stabilized wherever the injection did not cause the strength to fall below the applied shear stress.
1909

Experiment NAB4
1E-006 1E-005 0.0001 0.001 0.01 0.1 1
γ
0
0.04
0.08
0.12
0.16
0.2
εv
0 2 4 6 8
p' (kPa)
0
2
4
6
8
10
q (
kP
a)
Elements:
(14,8)
(19,8)
(20,14)
(25,18)
(φ')cs
(φ')cs
+(φ')dialation
1E-006 1E-005 0.0001 0.001 0.01 0.1 1
γ
0
2
4
6
8
10
q (
kP
a)
1E-006 1E-005 0.0001 0.001 0.01 0.1 1
γ
0
10
20
30
40
Po
re W
ate
r P
ress
ure
(k
Pa)
Experiment NAB8
1E-006 1E-005 0.0001 0.001 0.01 0.1 1
γ
0
0.1
0.2
0.3
0.4
0.5
εv
0 10 20 30 40 50 60 70
p' (kPa)
0
10
20
30
40
50
60
70
q (
kP
a)
Elements:
(18,4)
(18,6)
(20,13)
(28,16)
(φ')cs
(φ')cs+(φ')
dialation
1E-006 1E-005 0.0001 0.001 0.01 0.1 1
γ
0
10
20
30
40
50
60
70
q (
kP
a)
1E-006 1E-005 0.0001 0.001 0.01 0.1 1
γ
0
50
100
150
200
250
Po
re W
ate
r P
ressu
re (
kP
a)
Figure 8. Stress and strain paths and behavior of elements in FLAC model.
1910

Predicted pore water pressures and deformations for the static centrifuge tests, NAB4 and NAB8, are compared with the experimental results in Figs. 9 and 10. Prediction of experiment NAB4 indicated that pore water pressures were over-predicted for PPT #2864 at depth and PPTs #3590 and #3099 at the
0
20
40
60
80
100
NAB4-PPT 5296
NAB4-ELM (20,14)
NAB8-PPT 5296
NAB8-ELM (20,13)
0
20
40
60
80
100
NAB4-PPT 3283
NAB4-ELM (25,18)
NAB8-PPT 6711
NAB8-ELM (28,16)
0
20
40
60
80
100
NAB4-PPT 1000
NAB4-ELM (41,18)
NAB8-PPT 6726
NAB8-ELM (40,16)
0
50
100
150
200
Po
re W
ate
r P
ressu
re R
ati
o,
r u (
%)
NAB4-PPT 3099
NAB4-ELM (19,8)
NAB8-PPT 3589
NAB8-ELM (18,6)
NAB4-PPT 3590
NAB4-Element (14,8)
NAB8-PPT 3298
NAB8-ELM (34,12)0
20
40
60
80
100
NAB4-PPT 2864
NAB4-Element (46,9)
NAB8-PPT 2864
NAB8-Element (47,6)
0
20
40
60
80
100
0 5 10 15
Time (sec)
0
0.4
0.8
1.2
1.6
Inje
cte
d V
olu
me/B
ase
Are
a* (
cm
)
NAB4-Injection
NAB4-FLAC Injection
NAB8-Injection (Test & FLAC)
* Centrifuge base area = 8,981 cm
2
Figure 9. Comparison of pore water pressure time histories.
1911
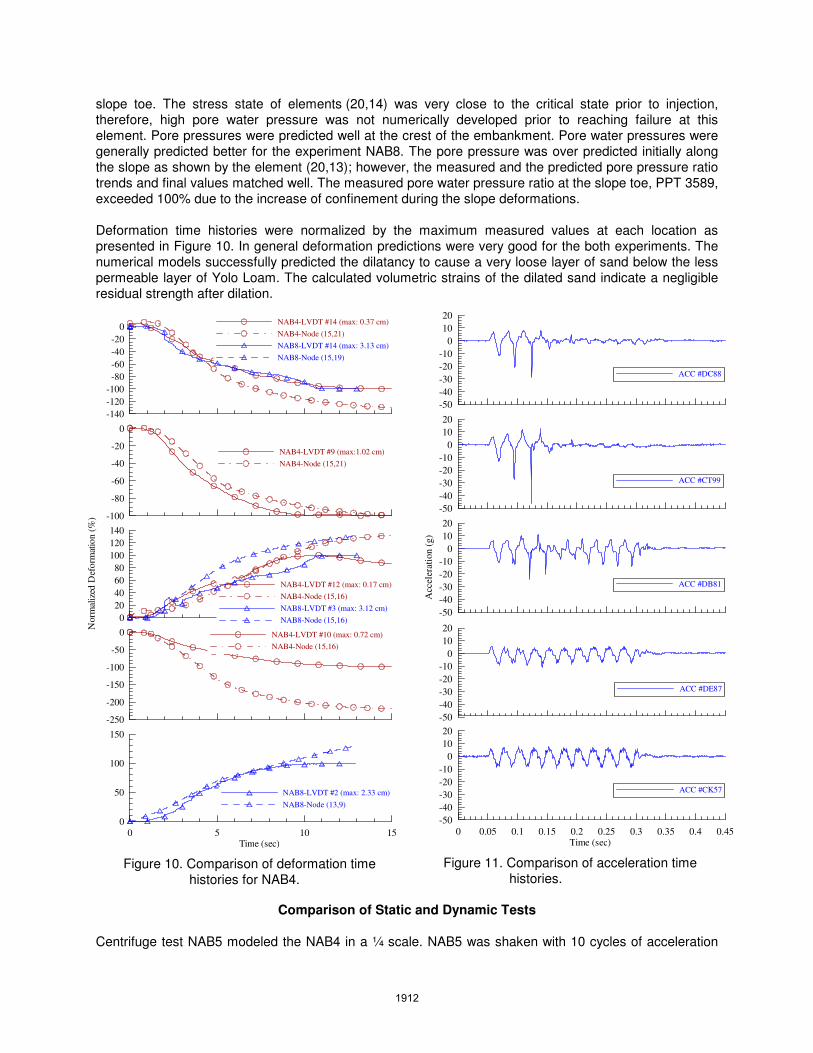
slope toe. The stress state of elements (20,14) was very close to the critical state prior to injection, therefore, high pore water pressure was not numerically developed prior to reaching failure at this element. Pore pressures were predicted well at the crest of the embankment. Pore water pressures were generally predicted better for the experiment NAB8. The pore pressure was over predicted initially along the slope as shown by the element (20,13); however, the measured and the predicted pore pressure ratio trends and final values matched well. The measured pore water pressure ratio at the slope toe, PPT 3589, exceeded 100% due to the increase of confinement during the slope deformations. Deformation time histories were normalized by the maximum measured values at each location as presented in Figure 10. In general deformation predictions were very good for the both experiments. The numerical models successfully predicted the dilatancy to cause a very loose layer of sand below the less permeable layer of Yolo Loam. The calculated volumetric strains of the dilated sand indicate a negligible residual strength after dilation.
Comparison of Static and Dynamic Tests
Centrifuge test NAB5 modeled the NAB4 in a ¼ scale. NAB5 was shaken with 10 cycles of acceleration
-50
-40
-30
-20
-10
0
10
20
ACC #DE87
-50
-40
-30
-20
-10
0
10
20
Accele
rati
on (
g)
ACC #DB81
-50
-40
-30
-20
-10
0
10
20
ACC #CT99
0 0.05 0.1 0.15 0.2 0.25 0.3 0.35 0.4 0.45
Time (sec)
-50
-40
-30
-20
-10
0
10
20
ACC #CK57
-50
-40
-30
-20
-10
0
10
20
ACC #DC88
0
20
40
60
80
100
120
140
Norm
ali
zed
Defo
rmatio
n (
%)
NAB4-LVDT #12 (max: 0.17 cm)
NAB4-Node (15,16)
NAB8-LVDT #3 (max: 3.12 cm)
NAB8-Node (15,16)
-100
-80
-60
-40
-20
0
NAB4-LVDT #9 (max:1.02 cm)
NAB4-Node (15,21)
-140
-120
-100
-80
-60
-40
-20
0NAB4-LVDT #14 (max: 0.37 cm)
NAB4-Node (15,21)
NAB8-LVDT #14 (max: 3.13 cm)
NAB8-Node (15,19)
-250
-200
-150
-100
-50
0 NAB4-LVDT #10 (max: 0.72 cm)
NAB4-Node (15,16)
0 5 10 15
Time (sec)
0
50
100
150
NAB8-LVDT #2 (max: 2.33 cm)
NAB8-Node (13,9)
Figure 11. Comparison of acceleration time histories.
Figure 10. Comparison of deformation time histories for NAB4.
1912

with single amplitude of 7g as shown on Fig. 11. The acceleration time histories showed that at the slope crest the motions were damped after four cycles (Fig. 11).
Acceleration spikes due to de-liquefaction of sand, as explained in Kutter and Wilson (1999), were also
observed at the slope crest (ACC #DC88 and #CT99) and at the middle of sand (ACC #DB81) layer. To compare NAB4 and NAB5 pore water pressure and deformation time histories, time in NAB4 was normalized by the injection time and time for NAB5 was normalized by the shaking duration in Figs. 12 and 13. The pore water pressure ratio for the transducer #1000 oscillated greatly in the NAB5 result, which was possibly due to the inertia of water in front of the embankment that may have caused a change of total stress during the shaking and cyclic dilation of the Nevada Sand. These oscillations were not observed in NAB4 since the model was not shaken. Pore pressure transducer #5296 of NAB5 also shows large oscillations. Pore pressure transducer #3589 shows much less oscillation relative to the other transducers. Lack of oscillations in the PPT #3589 in NAB5, and the fact that it lags behind the result of NAB4 measurement could be due to partially clogged porous stone for PPT #3589 in NAB5. The NAB4 pore water pressure trend matches the average trend of pore water pressure generation in NAB5 along the slope. The only exception was that the pore water pressure ratio at the deeper part of the embankment was much smaller during injection than during shaking as shown by PPT #2864 in Fig. 12 for NAB4 and NAB5, respectively. After shaking stops the pore pressure ratios in the static and dynamic experiments are very similar everywhere.
-3
-2
-1
0
1
LVDT #14 (NAB5)
LVDT #10 (NAB4)
-3
-2
-1
0
1
Defo
rmati
on
(cm
) LVDT #9 (NAB5)
LVDT #14 (NAB4)
-3
-2
-1
0
1LVDT #11 (NAB5)
LVDT #9 (NAB4)
0 0.5 1 1.5
Normalized Time
-3
-2
-1
0
1
LVDT #A (NAB5)
LVDT #12 (NAB4)
Figure 13. Comparison of deformations.
0 0.5 1 1.5
Normalized Time
0
20
40
60
80
100
PPT #2864 (NAB5)
PPT #2864 (NAB4)
0
20
40
60
80
100
Po
re P
ressu
re R
ati
o,
r u (
%)
PPT #5296 (NAB5)
PPT #3099 (NAB4)
-100
-50
0
50
100
150
PPT #1000 (NAB5)
PPT #5296 (NAB4)
0
20
40
60
80
100
PPT #3589 (NAB5)
PPT #3283 (NAB4)
Figure 12. Pore water pressure comparison.
1913

The consistency in pore pressure results between the static and dynamic experiment is consistent with the idea that the pore pressures have reached a limiting condition corresponding to the intersection of the applied shear stress and the phase transformation line. This is similar to the limiting ru concept described by Malvick et al. (2003) and Bastani (2003). After stopping the centrifuge, the surface profiles were measured, cracks were mapped, and the sample was dissected. From these observations it was clear that failure/shearing occurred primarily in the partially liquefied sand layer rather than the overlaying silty clay layer. Comparison of the measured deformations in Fig. 13 shows that NAB5 deformations were equal to three times greater than the deformations in NAB4 in the model scale; NAB5 was 1/4 scale of NAB4. Taking this into account deformations in NAB5 were about four to 12 times greater at prototype scale. The local drainage inside the models was calculated in the FLAC models of the experiments NAB4 and NAB8. Volumetric strain rate of several elements along the slopes are plotted versus their normalized time in Fig. 14 for purposes of comparison. Since Nevada Sand at 40% and 33% relative densities is dilative during monotonic loading, the assumption of partially drained failure of elements at the interface of Yolo Loam and Nevada Sand is logical. Fig. 14 shows that the predicted volumetric strain rates were reduced at the end of the injection and shaking events, at the same time the rate of predicted deformations were also reduced at the end of injection/shaking (See Figs. 10 and 13).
After injection and shaking the deformations continued with lower rates in the analysis, which were directly correlated to the volumetric strain rates of the interface elements. The deformation rates after injection and shaking were lower in the experiment compared to analysis. This difference may be due to crack formation through the less permeable top layer which allowed water to escape without accumulating at the interface. Cracking was not accounted for by the numerical model. Existence of these cracks directed the internal pore fluid flow to the outside and prevented further dilation of interface elements. Predicted volumetric strains quickly increased at the elements that yielded either in volume or shear, as shown by elements (20, 14) and (20, 13) of NAB4 and NAB8, respectively, in Fig. 14. The difference in post-injection deformation could also be explained by imperfections in the constitutive model. Shaking or injection causes increase of pore water pressure which makes the stress state of elements move toward the failure envelope. After reaching the failure envelope, elements continue to shear under
0 0.5 1 1.5
Normalized Time (sec)
0
0.05
0.1
0.15
εv
for
ΝΑ
Β4
0
0.1
0.2
0.3
0.4
0.5
εv
for
ΝΑ
Β8
Elem. #19,8 (NAB4, Slope Toe)
Elem. #20,14 (NAB4, Mid-Slope)
Elem. #25,18 (NAB4, Slope Top)
Elem. #18,6 (NAB8, Slope Toe)
Elem. #20,13 (NAB8, Mid-Slope)
Elem. #28,16 (NAB8, Slope Top)
Figure 14. Volumetric strains within NAB4.
1914

dynamic plus static shear stresses or static stresses as long as the pore water flow required for dilation of the material is available due to the hydraulic gradients inside the system.
If the soil remains in a dilatant state with constant applied shear stress at the end of shaking, shearing will cease when injection/dilation stops, which will be due to change of the mode of failure from drained water injection mode to undrained shear mode. Since the material is dilative, in undrained circumstances, additional shear strains will be obtained only if the applied shear stresses increase. In the centrifuge experiments, static shear stresses were less than the undrained strength after minor deformations and therefore displacements ceased when volumetric dilations stop.
Conclusions
A centrifuge test was performed using a shaker to induce liquefaction in a slope covered by a less permeable layer in a dynamic experiment. The pore water produced by vibration of liquefiable soil was also simulated by the water injection system in two centrifuge experiments without shaking. If sloping ground is made of contractive soil, a sudden increase of pore water pressures or dynamic shaking will push the stress state of the soil element towards the failure envelope and may trigger the undrained flow failure mechanism of the soil elements. However, generation of shear strains/deformations for the dilative soils will be restricted by the availability of water for dilation. Less permeable layers of soil retain pore water that may be made available on a delayed time scale to dilating soil on a potential failure mechanism. A modified Mohr-Coulomb constitutive model was developed based upon critical state theory in conjunction with a new expression for dilatancy that depends on the state parameter (the distance between the state and the critical state). The constitutive model was shown to enable calculation of strain softening paths, and dilation due to water injection. The constitutive model was implemented in FLAC and used to analyze results of centrifuge model tests of layered sloping ground subject to pore fluid injection. The injection was intended to simulate the upward flow of water that might be generated by densification of deep soil deposits during earthquake shaking. From one perspective, embankments made of dilative material may be considered to be safe, because the undrained strength is greater than the driving stress as explained by Poulos et al. (1985). The centrifuge tests and the FLAC analyses presented here, however, clearly demonstrate the possibility that layers that impede drainage may cause a significant localized zone of softened material that should be considered as a possibility in seismic design. To determine induced deformations due to local drainage of a system, a material model that captures this process should be incorporated in the numerical model. The mode of failure and local drainage of the centrifuge tests presented here was successfully predicted utilizing the modified Mohr-Coulomb constitutive model in conjunction with FLAC numerical framework. An apparent difference between dynamic- versus injection-induced liquefaction is the lack of seismic inertia forces and dynamic deformations in the latter condition. A similar concept is also applicable to the during- and post-earthquake liquefaction-induced failures. As observed in NAB4 and NAB5, the deformation/failure during shaking occurred faster and with a larger magnitude compared to the injection-induced one. This behavior was also observed in the violent failure of the Mochikoshi Tailings dike No. 1 during 1978 Izu-Ohshima-Kinkai earthquake (main shock) with a magnitude of 7.0 that was reported to be quick/violent, leaving splash marks as high as 30 m on leaves and branches of forest trees along its path through a valley with a bed slope of 15
o, at high speed like a bluish white river for about 7-8 km versus the
less violent post-earthquake failure of dike No. 2 where tailings advanced slowly into another valley of about 10
o slope for a distance of 150-240 m, as explained by Okusa et al. (1978).
1915

In the NAB4, NAB5, and NAB8 centrifuge tests the deformations ceased after injection and shaking, respectively. The numerical model showed small additional deformations due to the additional void ratio redistribution within the model after completion of the injection and shaking. Longer drainage paths and/or lower permeability would be expected to cause the redistribution to continue for a longer time after injection and shaking. Both experimental results and the numerical model indicate that deformations increase with a smooth relationship to the injected volume of fluid; larger deformation will be expected with a larger injection volume. In order to make a prediction of rate and magnitude of injection-induced/post earthquake deformations in field conditions, it is necessary to predict the redistribution of pore water flow in the ground, and to have a constitutive relationship that reasonably predicts shear strains caused by pore water redistribution/injection. We have presented a constitutive model that captures essential features of the static injection problem. An unsolved segment of this problem, making it difficult to apply in practice, is the need to have an accurate model of the heterogeneous geometry of the permeability of all deposits and liquefiable deposits in field situations.
Acknowledgments
The authors wish to thank Professor I. M. Idriss for his support of the initial stages of this project and James Ward for reviewing this manuscript and providing constructive comments.
References
Archilleas, G.P., Bouckovalas, G.D., and Dafalias, Y.F. 2001, “Plasticity Model for Sand Under Small and
Large Cyclic Strains,” Journal of Geotechnical Engineering, ASCE 127(11), pp. 973-983. Bastani, S. A. 2003, “Evaluation of Deformations of Earth Structures due to Earthquakes,” Dissertation
presented to University of California, at Davis, in partial fulfillment of the requirements for the degree of Doctor of Philosophy.
Been, K. and Jefferies, M.G. 1985, “A State Parameter for Sands,” Geotechnique 35(2), pp. 99-112. Bolton, M. 1991, “A Guide to Soil Mechanics,” Published by M D and K Bolton, Printed by Chung Hwa
Book Company, pp. 63-92. Boulanger, R.W. 1990, “Liquefaction Behavior of Saturated Cohesionless Soils Subjected to Uni-
Directional and Bi-Directional Static and Cyclic Simple Shear Stresses,” Dissertation presented to University of California, at Berkeley, in partial fulfillment of the requirements for the degree of Doctor of Philosophy.
Boulanger, R.W., and Truman, P. 1995, “Void Redistribution in Sand Under Post-Earthquake Loading,”
Canadian Geotechnical Journal 33, pp. 829-834. Dobry, R. and Alvarez, L. 1967, “Seismic Failure of Chilean Tailing Dams,” Journal of Soil Mechanics and
Foundations Division, Proceeding of the American Society of Civil Engineers 93 (SM6): 237-260. Finn, W. D. 1980, “Seismic Response of Tailing Dams,” Presented at Seminar on Design and
Construction of Tailing Dams, Colorado School of Mines, Denver, Colorado, pp. 76-97. Fiegel, G. L., and Kutter, B. L. 1994, “Liquefaction-induced lateral spreading of mildly sloping ground.”
Journal of Geotechnical Engineering., ASCE 120(12), pp 2236-2243. Itasca Consulting Group, Inc. 2001, “FLAC - Fast Lagrangian Analysis of Continua, Version 4.0 User's
Manual,” Minneapolis, MN: Itasca.
1916

Kokusho, T. and Kojima, T. 2002, “Mechanism for Postliquefaction Water Film Generation in Layered Sand,” Journal of Geotechnical Engineering, ASCE 128(2): 129-137.
Malvick, E.J., Kutter, B.L., and Boulanger, R.W. 2004, “Post-Shaking Failure of Sand Slope in Centrifuge
Test,” Proceedings of the 11th International Conference on Soil Dynamics and Earthquake
Engineering and 3rd
International Conference on Earthquake Geotechnical Engineering Conference, Berkeley, CA, in press.
Malvick, E.J., Kulasingam, R., Boulanger, R.W., and Kutter, B.L. 2003, “Analysis of a Void Ratio
Redistribution Mechanism in Liquefied Soil,” Proceedings of 12th Pan-American Conference on Soil Mechanics and Geotechnical Engineering, Cambridge, MA. pp. 955-961.
Kutter, B. L. , and Wilson, D. W. (1999) "De-Liquefaction Shock Waves,” Proceedings of the Seventh
U.S.-Japan Workshop on Earthquake Resistant Design of Lifetime Facilities and Countermeasures Against Soil Liquefaction, Technical Report MCEER-99-0019, pp. 295-310.
Poulos, S.J., Castro, G., and France, J.W. 1985, “Liquefaction Evaluation Procedure,” Journal of the
Geotechnical Engineering Division, ASCE 111(6), pp. 772-792.
Okusa, S., Anma, S., and Maikuma, H. 1978, “Liquefaction of Mine Tailing in the 1978 Izu-Ohshima-Kihkai
Earthquake, Central Japan,” Engineering Geology 16, pp. 195-224, Elsevier Scientific Publishing Co.
Seed, H.B., Lee, K.L., Idriss, I.M., and Makdisi, F.I. 1975, “The Slides in the San Fernando Dams during
the Earthquake of February 9, 1971,” Journal of the Geotechnical Engineering Division, ASCE 101(GT7), pp. 651.
Vaid, Y. P. and Eliadorani, A. 1998, “Instability and Liquefaction of Granular Soils under Underained and
Partially Drained States,” Canadian Geotechnical Journal 35, pp. 1053-1062.
1917