Embed Size (px)
Citation preview
Simulation of Mixing Processes
VisiMix Ltd, PO Box 45170,
Jerusalem, 91450, Israel
Tel: 972 - 2 - 5870123 Fax: 972 - 2 - 5870206
E-mail: [email protected]

Practical Methods for Process Scale-Up
Moshe Bentolila
19/06/2018 2

Contents
• About Us • Motivation • What is a Good Mixing? • Proposed Method • Applications:
– Homogenous Reaction – Crystallization – Gas liquid Reaction – High Shear Rate in Semibatch Homogeneous Reaction
• Summary • Conclusions
19/06/2018 3

VisiMix.Ltd is a unique software enabling chemical engineers, process engineers and R&D personnel to
characterize and visualize mixing processes via a simple, user friendly interface.
Our products allow significant savings in time and costs by drastically reducing the need for trial-and-error.
They have been successfully adopted by hundreds of companies.
About Us

Motivation
19/06/2018 5

Common Questions
Did we cover the main parameters during the process
development?
Will our facilities will be appropriate for the developed
process?
Does the equipment offer is good for the process?
What about safety and runaway scenario?
Do our process is robust?
Does the operational range parameters are large enough for
the manufacture facilities?
19/06/2018 6

The Goal Once the Science of the process (Chemistry, Biology or physics) is known well, a common situation during the process transfer from lab to production or from site to site is the gap between the old and new results. Our first goal is to develop a process that will run properly in
the first trial on a new scale or site, similar to our successful results in the lab or in the old facility.
In order to achieve this, we need to evaluate the process with the same conditions we will have in the production phase. The main parameters we change are the hydrodynamics of
the system. If we are able to identify and control these parameters we will be able to achieve to the available and optimal solution.
19/06/2018 7

Mixing Simulation Software
R&D
Production
Design
QbD
Data and Results Management
19/06/2018 8

What is Good Mixing?

10

11
“From the outcome of this case, we understood that the combination of the
company knowledge of the process with VisiMix simulation is more than must –
in order to succeed to define new equipment for new processes.”
“The Launch was delayed by 6 months and the potential of production during
this months is – 1,200,000 Eu and there are some more expenses connected with purchasing equipment”

12

Proposed Method
19/06/2018 13

19/06/2018 14

19/06/2018 15

19/06/2018 16

17 Visimix.Ltd
Methodology (J.M. Berty, CEP, 1979)
LABORATORY (R&D)
BENCH SCALE (RC1,Mini Pilot)
PILOT
Demo – Simulation
PLANT (Production)
LABORATORY (R&D)
BENCH SCALE (RC1,HEL)
PILOT (Mini Pilot)
PLANT (Pilot, Production)
Scale Down
Final Design
Build
Design Analyze
New Process with Mixing

18 Visimix.Ltd
Methodology
Step 1: Know the Mechanism of your Process.
Step 2: Calculate Mixing Parameters will be available to provide in the commercial stage equipment.
Step 3: Set Up Lab or Pilot equipment at the same range of work as calculated in Step 2.
Step 4: Run Statistical Design of Experiments under conditions Set Up in Step 3 and select relevant experiments to proof the mechanism and achieved a good product quality, effective process operation and maximum yield.
Step 5: Model Verification by Scaling down in industrial equipment for sample customer product.
Step 6: Generate a Final Design, Procedure an Operation.

Lab and Prod Calculations
Moshe Bentolila, Roberto Novoa, and Wayne Genck, Michal Hasson, Efrat Manoff, "Computer Aided Process Engineering at Chemagis" , PHARMACEUTICAL ENGINEERING July/August 2011. 30-38
19/06/2018 19

Non Ideal Stirring – Non homogeneity
Before performance of scale up experiments VisiMix simulation was used to check suspension at different Mini Pilot Reactors:
Reactor 7603 7605 7605 7607
Volume, L 10 25 25 50
RPM 500 (Max) 400 500 (Max) 150 (Max)
Liquid – Solid Mixing
Solid suspension quality
Complete suspension is questionable.
Partial settling of solid phase may
occur.
Complete suspension is
expected.
Complete suspension is
expected.
Complete suspension is questionable.
Partial settling of solid phase may
occur. Max. degree of non uniformity of solid distribution
AXIAL, % 22.3 10.3 29.1 132
RADIAL, % 65.7 34.3 76.3 90.8 Not all Mini Pilot reactor are capable of full suspension of
Reagent
20

Methodology
19/06/2018
Number of produced batches needed until
a stable process is achieved
21

VisiMix Application
Homogeneous Reaction
19/06/2018 22

Chemical Reaction

Lab experiment
without stirring HClFeeding
upper from the top HClFeeding the
close to the impeller low rpm HClFeeding the
close to the impeller high rpm HClFeeding the

Results VisiMix
Visimix.Ltd 25
Optimax VisiMix Optimax Model

Results VisiMix
Visimix.Ltd 26

VisiMix Application
Crystallization
19/06/2018 27

ProcessesMixing Parameters for Crystallization
IMPORTANT PARAMETERS ANSWERED QUESTIONS AND NOTES
Axial and radial solids uniformity (distribution)
What is the uniformity throughout the vessel? Ensure that solids do not accumulate on the bottom.
Micromixing time How long is the micro scale degradation of non-homogenized concentration? This is important for precipitations.
Energy of collisions in bulk What is the collision energy of particles? A high number of collisions in the bulk can affect breakage and secondary nucleation.
Collisions of maximum energy
How often do the slurry particles see the maximum collision energy? What is the frequency near the zone of maximum turbulence near the impeller blades? Frequent collisions lead to more breakage and secondary nucleation.
Local values of energy dissipation
What is the average energy dissipation in the agitator zone? What is in the bulk slurry? What is it at the baffles? Dissipation controls breakage, nucleation and micromixing in these zones.
Maximum energy dissipation Manipulating energy dissipation in the area behind the agitator blades controls breakage, nucleation and micromixing in this zone.
Time between strong collisions
What is the average period of uninterrupted crystal growth?
Shear rates What is the likelihood of rupturing the crystal or agglomerates? What is the impact on growth and desolution for the agitation conditions?

Mixing Parameters for Crystallization Processes
Cooling crystallization of API in 6000 liter reactor.
After investigation it was found that the tip diameter of the Agitator was damaged and the real diameter is a 80 % of the reported one.
X (v,90)< 250 µm Campaign
195 First
325 Second

Visimix.Ltd 30

VisiMix Application
Gas Liquid Reaction
19/06/2018 31

Description
• Gas – Liquid reaction in pilot scale ~ 1000 liter is finished after 4 Hour
• Same in Production 4 Days.
Visimix.Ltd 32
After Change
Position the
process take
around 14 hours

VisiMix Application
High Shear Rate in Semi Batch Homogeneous Reaction
19/06/2018 33

Process and Quality Problem
Process
R-6826
Feed R-Cl
R-NH2 + R’-Cl t-D-R-R’
Impurity
t-L-R-R’
19/06/2018 34
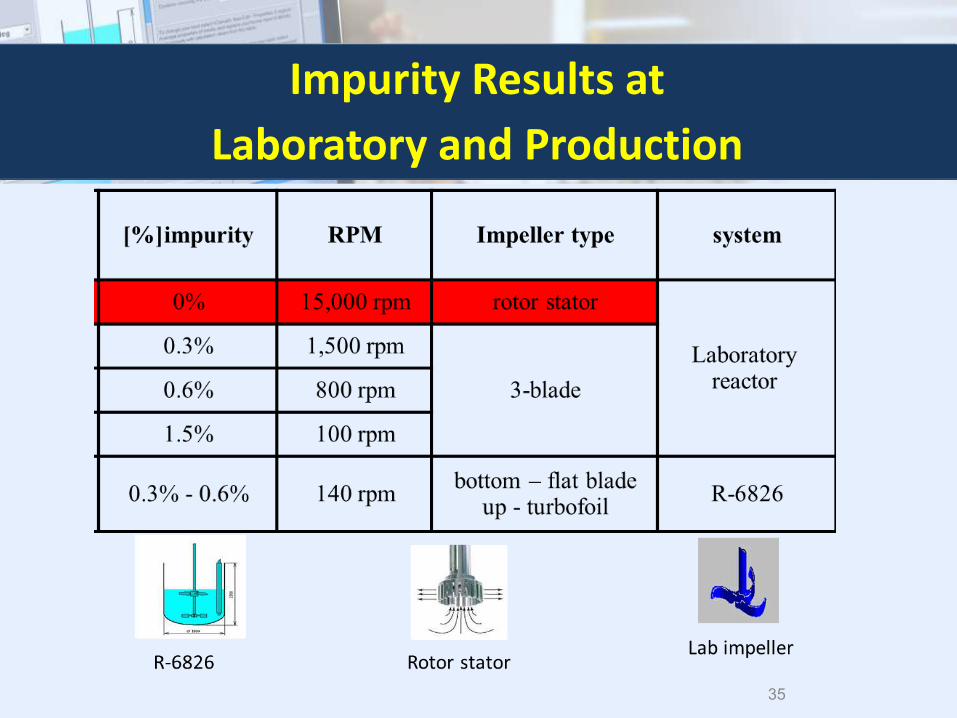
Impurity Results at
Laboratory and Production
35

R’- Cl (liquid)
R- NH2
Working with Rotor Stator
at Laboratory Scale
Problem
How to scale up ?
Potential Saving :
MORE than 250 K$
36

Calculating Shear Forces with VisiMix
Lab impeller Rotor stator R-6826
system Impeller type RPM impurity]%[ Turbulent shear rate
[1/s]
Laboratory reactor
rotor stator 15,000 rpm 0% 780,000
3-blade
1,500 rpm 0.3% 32,900
800 rpm 0.6% 12,900
100 rpm 1.5% 580
R-6826 bottom – flat blade
up - turbofoil 140 rpm 0.3% - 0.6% 15,200
19/06/2018 37

Visimix.Ltd 38
Summary
Step 1: Know the Mechanism of your Process.
Step 2: Calculate Mixing Parameters will be available to provide in the commercial stage equipment.
Step 3: Set Up Lab or Pilot equipment at the same range of work as calculated in Step 2.
Step 4: Run Statistical Design of Experiments under conditions Set Up in Step 3 and select relevant experiments to proof the mechanism and achieved a good product quality, effective process operation and maximum yield.
Step 5: Model Verification by Scaling down in industrial equipment for sample customer product.
Step 6: Generate a Final Design, Procedure an Operation.

Conclusion Using VisiMix Products support you can
understand better your processes
Reduce dramatically your Scaling up processes and Scaling down
Save a huge amount of Time & Money ($1,000,000 +)
The VisiMix Products are friendly and easy to use with very quick results.
The VisiMix results are based on a systematic and seriously experimental checking – and found very reliable.
VisiMix Projects Parameters and Data Base allows you to share and transfer the data with colleagues in the company.

Thank you for your attention

Visimix.Ltd 41
Thank You For your attention
VisiMix Ltd.
PO Box 45170, Jerusalem, 91450, Israel Tel: 972 - 2 - 5870123 | Fax: 972 - 2 - 5870206
E-mail: [email protected]