Embed Size (px)
Citation preview
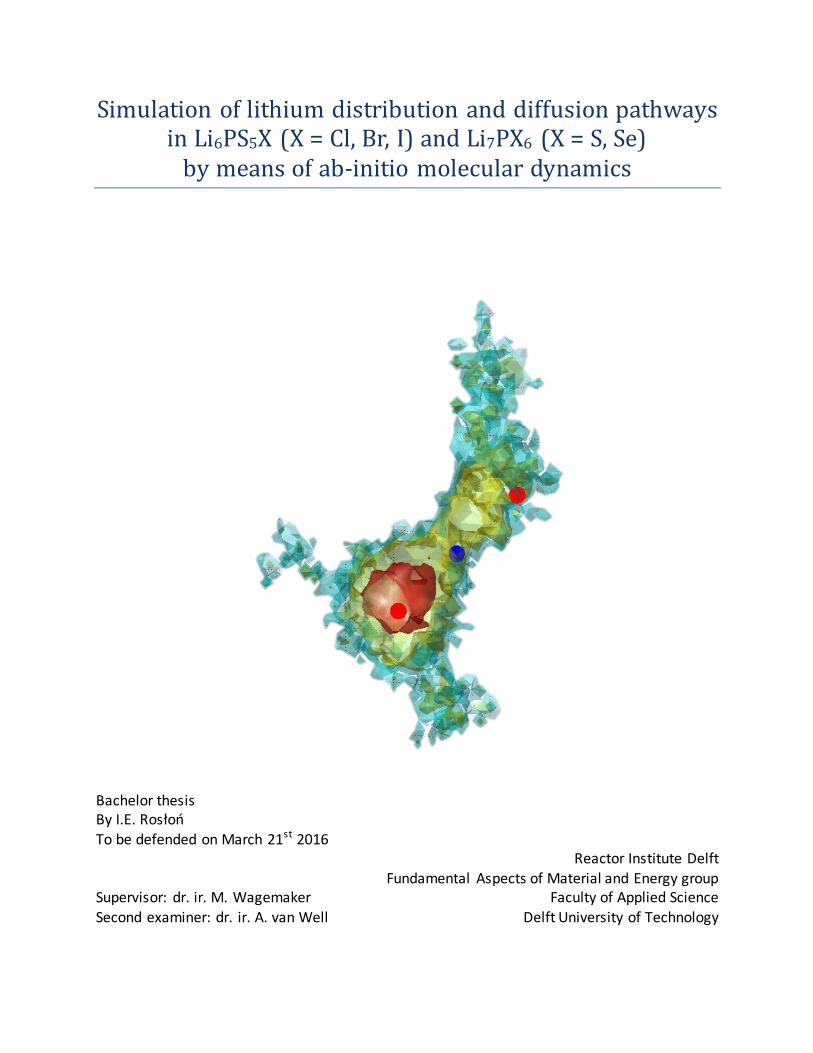
Simulation of lithium distribution and diffusion pathways in Li6PS5X (X = Cl, Br, I) and Li7PX6 (X = S, Se)
by means of ab-initio molecular dynamics
Bachelor thesis By I.E. Rosłoń To be defended on March 21st 2016 Reactor Institute Delft
Fundamental Aspects of Material and Energy group Supervisor: dr. ir. M. Wagemaker Faculty of Applied Science Second examiner: dr. ir. A. van Well Delft University of Technology

1
1
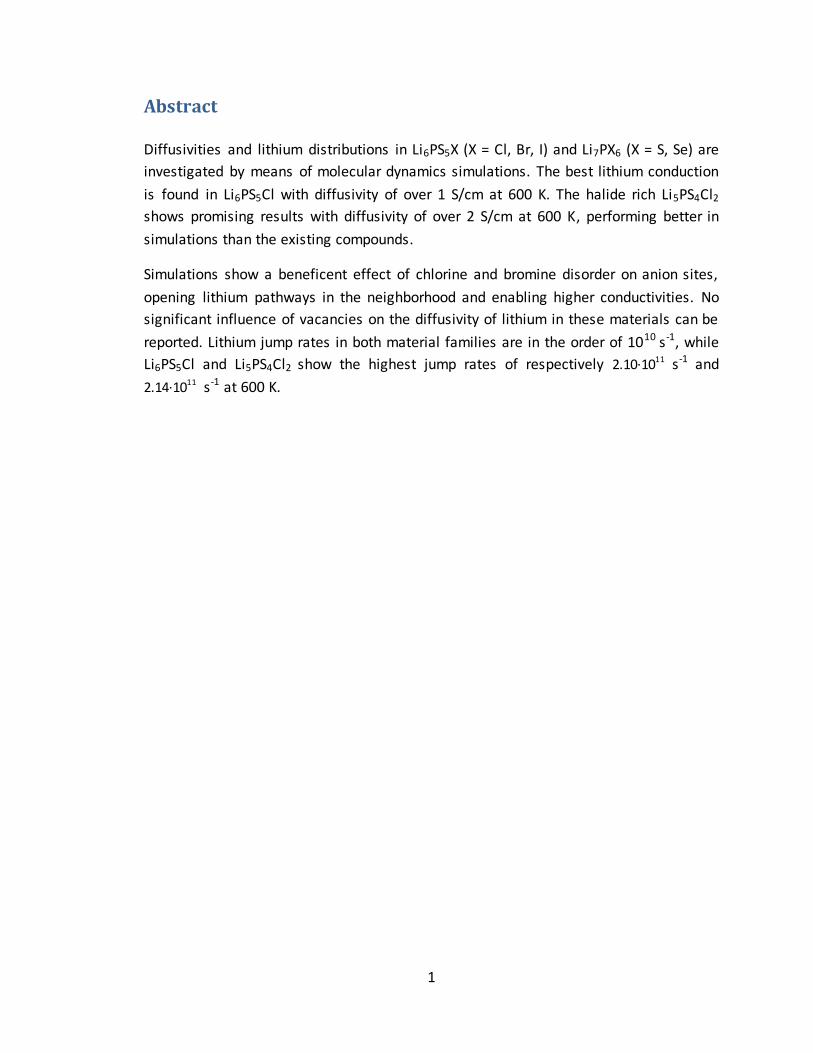
Abstract
Diffusivities and lithium distributions in Li6PS5X (X = Cl, Br, I) and Li7PX6 (X = S, Se) are
investigated by means of molecular dynamics simulations. The best lithium conduction
is found in Li6PS5Cl with diffusivity of over 1 S/cm at 600 K. The halide rich Li5PS4Cl2
shows promising results with diffusivity of over 2 S/cm at 600 K, performing better in
simulations than the existing compounds.
Simulations show a beneficent effect of chlorine and bromine disorder on anion sites,
opening lithium pathways in the neighborhood and enabling higher conductivities. No
significant influence of vacancies on the diffusivity of lithium in these materials can be
reported. Lithium jump rates in both material families are in the order of 1010 s-1, while
Li6PS5Cl and Li5PS4Cl2 show the highest jump rates of respectively 2.10·1011 s-1 and
2.14·1011 s-1 at 600 K.

2

3
Table of contents
Abstract ............................................................................................................................... 1
Table of contents ................................................................................................................ 3
Symbols and abbreviations ................................................................................................. 5
Introduction ........................................................................................................................ 6
Theory ................................................................................................................................. 7
Ab-Initio Molecular Dynamics......................................................................................... 7
Pseudopotentials ........................................................................................................ 7
Projector Augmented Wave method.......................................................................... 7
Hopping and jump frequency ......................................................................................... 8
Delaunay triangulation................................................................................................ 8
Debye frequency ............................................................................................................. 8
Brownian motion ............................................................................................................ 9
Diffusivity ........................................................................................................................ 9
Conductivity .................................................................................................................. 10
Coefficient of variation ................................................................................................. 10
Methodology..................................................................................................................... 11
Materials simulated ...................................................................................................... 11
Results ............................................................................................................................... 12
Conductivity data .......................................................................................................... 13
Pathway categorization ................................................................................................ 15
Triplet site (48h – 24g – 48h) .................................................................................... 15
Pathway cage ............................................................................................................ 16
Cage interconnections .............................................................................................. 16
Li6PS5X (X = Cl, Br, I) compounds results ....................................................................... 18
Pathways in Li6PS5Br ................................................................................................. 20
Pathways in Li6PS5Cl .................................................................................................. 21
Pathways in Li6PS5I .................................................................................................... 22
Li5PS4Cl2 results.............................................................................................................. 24
4
Li7PX6 (X = S, Se) compounds results............................................................................. 25
Pathways in Li7PS6 and Li7PSe6 .................................................................................. 25
Detailed short range diffusivity in Li7PX6 (X = S, Se) .................................................. 26
Effect of vacancies on Li-diffusivity............................................................................... 28
Jump rates ..................................................................................................................... 30
Conclusion ......................................................................................................................... 32
Recommendations ............................................................................................................ 34
Acknowledgments............................................................................................................. 36
References......................................................................................................................... 38

5
Symbols and abbreviations
Table 1 List of symbols in order of appearance
Symbol Quantity Unit Unit in words
D Diffusivity m2s-1 Square meter per second J Flux t-1m-2 Mole per square meter per second
φ Concentration m-3 Mole per cubic meter
x Distance m Meter Γ Jump rate s-1 Per second
n Number - - λ Jump distance m Meter
V Volume m3 Cubic meters f Frequency s-1 Per second
m Mass kg Kilogram
v Velocity ms-1 Meter per second t Time s Second
F Force N Newton d Number of dimensions - - 𝑟 Place vector m Meter C Conductivity S/cm Siemens per centimeter
R Universal gas constant JK-1mol-1 Joule per Kelvin per mole
𝐹𝐶 Faraday’s constant Cmol-1 Coulomb per mole z Ionic charge C Coulomb
T Temperature K Kelvin 𝑐𝑣 Coefficient of variation - -
σ Standard deviation - -
μ Mean - -
Table 2 List of abbreviations in order of appearance
Abbreviation Meaning
VASP Vienna Ab-Initio Simulation Package DFT Density Functional Theory
PAW Projector Augmented Wave method
MSD Mean Square Displacement
MD Molecular Dynamics GGA Generalized Gradient Approximation
PBE Perdew-Burke-Ernzerhof

6
Introduction
Batteries are one of the most frequently used devices in everyday life, especially in
products that require high portability or have low accessibility. These batteries are often
a limiting factor in product performance, causing consumers to desire batteries to
become lighter, to last longer and to be safer. Profound understanding of the physics
behind them is a key to manufacturing even better ones. A promising research field
concerning batteries is that of all solid batteries. The aim of this research is to gain
deeper understanding of solid state electrolytes and improve battery characteristics.
A simple battery consists of two electrodes where chemical reactions generate electrical
energy. As electrons flow from one electrode to another through an external circuit,
ions have to pass through an electrolyte to keep a steady-state charge distribution in
the battery. Lithium frequently acts as ionic conductor and batteries of this type are
depicted Li-ion batteries; their use is widely spread in consumer products such as mobile
cell phones and electric vehicles.
Because an electrolyte is a passageway for ions, connecting the electrodes, it has to be
both an electric insulator and a good ionic conductor. Frequently used electrolytes are
liquids that show high ionic conductivity. (1) They have to be packed well to prevent
leakage and give protection against their high flammability. Solid state electrolytes need
less packaging since they cannot leak and have increased mechanical and thermal
stability compared to liquids. (2) On the other hand, solids are by their nature far less
favorable in achieving high ionic conductivities.
Materials from both the Li6PS5X (X = Cl, Br, I) and Li7PX6 (X = S, Se) families are reported
to be promising for use as solid state electrolytes. (3) These materials are electric
insulators and have shown high lithium ion conductivities in practice. (4) Goal of this
research is to broaden the understanding of Lithium transport in these argyrodite type
crystals by means of molecular dynamics simulations and find ways of improving their
performance.

7
Theory
The crystal structure adopted by a particular material depends on the nature of the
forces between the atoms within it. In some materials, particularly metals, a good
approximation is that of attracting hard spheres packed closely together. (5) The
argyrodite type materials cannot be described this way because of the far bigger spacing
in their structures, that is allowing even for macroscopic diffusivity in some cases.
Because of the complexity of the structures a far more elaborate approximation is
needed, which is implemented in the Vienna Ab-Initio Simulation Package (VASP).
Ab-Initio Molecular Dynamics
The exact movement of molecules in a material can be simulated using a computer.
Solutions to Newton’s equations of motion for many body problems are numerically
approximated based on the potentials obtained from electronic structure calculations of
the atoms involved. The Ab-Initio part refers to the on-the-fly calculations of the
electronic structures, highly improving the results compared to methods neglecting
electronic degrees of freedom.
With Density Functional Theory (DFT) the Schrodinger equation can be simplified into
one with less variables. Rather than adding each electron separately, one uses the
electron density and performs calculations with functionals (functions with a function as
input instead of a variable). (6) Also, several approximations are used in order to speed
up the calculations; the most important ones are listed below.
Pseudopotentials The effective potential of an atom is mainly depending on electrons in the outer shell,
the valence electrons. (5) Therefore the complicated interactions between the nucleus
and the inner electrons can be replaced by a less complicated pseudopotential and
corresponding wave function. Since this replacement is not valid for short distances, a
cut-off radius or energy has to be specified.
Projector Augmented Wave method
The pseudopotentials have characteristic shapes and symmetries, allowing for easier
description than with a set of plane waves. The Projector Augmented Wave method
(PAW) incorporates these simplifications into DFT allowing for more efficient
calculations. (7) Essentially, the fact that the electron density is expected to be smooth
is exploited to find regions of constant density.
8
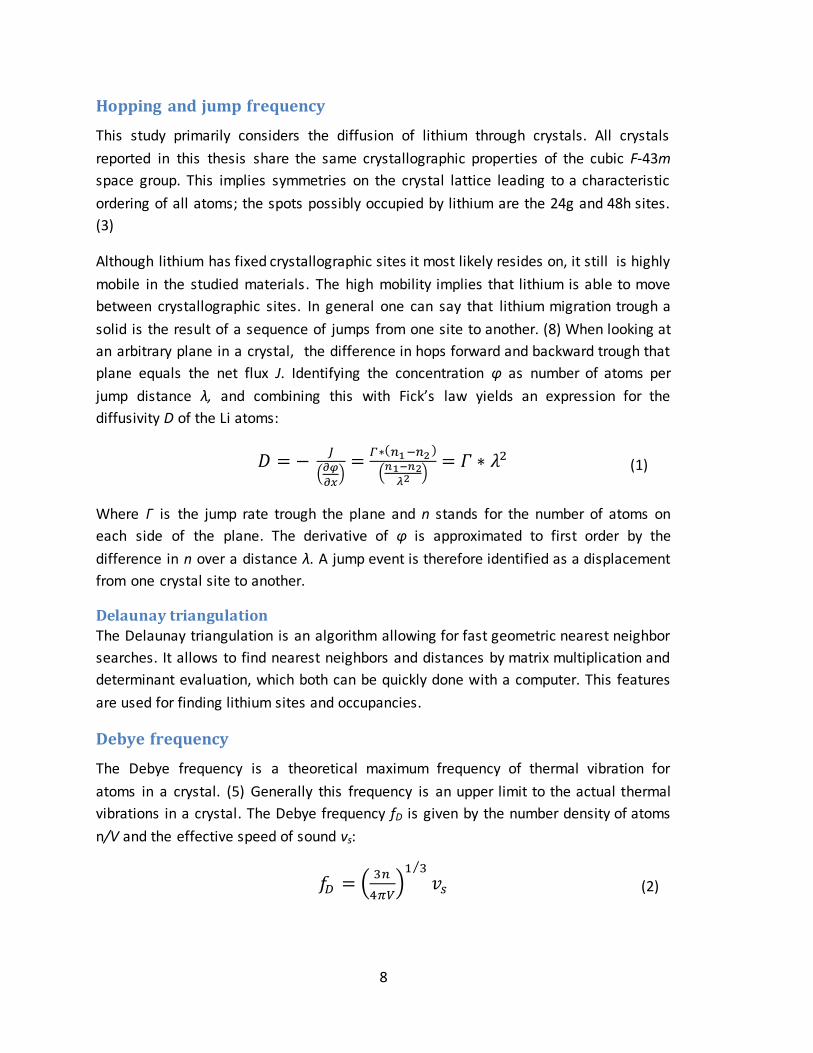
Hopping and jump frequency
This study primarily considers the diffusion of lithium through crystals. All crystals
reported in this thesis share the same crystallographic properties of the cubic F-43m
space group. This implies symmetries on the crystal lattice leading to a characteristic
ordering of all atoms; the spots possibly occupied by lithium are the 24g and 48h sites.
(3)
Although lithium has fixed crystallographic sites it most likely resides on, it still is highly
mobile in the studied materials. The high mobility implies that lithium is able to move
between crystallographic sites. In general one can say that lithium migration trough a
solid is the result of a sequence of jumps from one site to another. (8) When looking at
an arbitrary plane in a crystal, the difference in hops forward and backward trough that
plane equals the net flux J. Identifying the concentration φ as number of atoms per
jump distance λ, and combining this with Fick’s law yields an expression for the
diffusivity D of the Li atoms:
𝐷 = − 𝐽
(𝜕𝜑
𝜕𝑥)
=𝛤∗(𝑛1 −𝑛2 )
(𝑛1−𝑛2
𝜆2 )= 𝛤 ∗ 𝜆2
Where Γ is the jump rate trough the plane and n stands for the number of atoms on
each side of the plane. The derivative of φ is approximated to first order by the
difference in n over a distance λ. A jump event is therefore identified as a displacement
from one crystal site to another.
Delaunay triangulation The Delaunay triangulation is an algorithm allowing for fast geometric nearest neighbor
searches. It allows to find nearest neighbors and distances by matrix multiplication and
determinant evaluation, which both can be quickly done with a computer. This features
are used for finding lithium sites and occupancies.
Debye frequency
The Debye frequency is a theoretical maximum frequency of thermal vibration for
atoms in a crystal. (5) Generally this frequency is an upper limit to the actual thermal
vibrations in a crystal. The Debye frequency fD is given by the number density of atoms
n/V and the effective speed of sound vs:
𝑓𝐷 = (3𝑛
4𝜋𝑉)
1 3⁄
𝑣𝑠
(1)
(2)
9
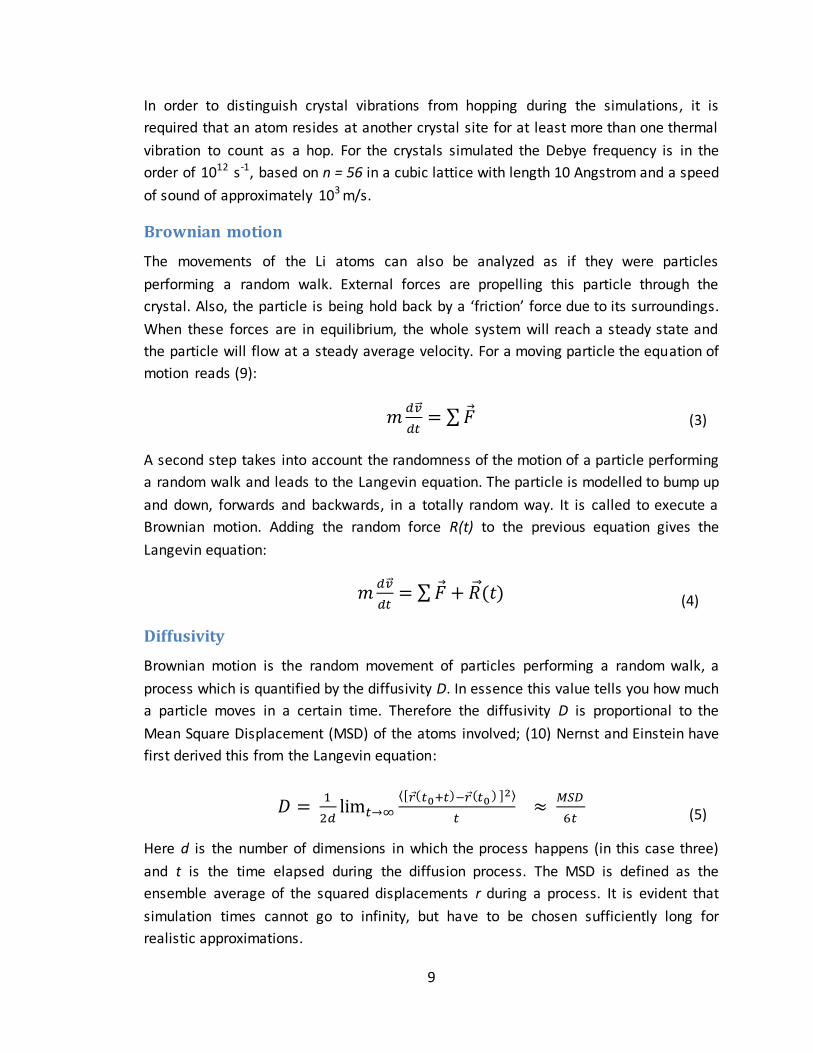
In order to distinguish crystal vibrations from hopping during the simulations, it is
required that an atom resides at another crystal site for at least more than one thermal
vibration to count as a hop. For the crystals simulated the Debye frequency is in the
order of 1012 s-1, based on n = 56 in a cubic lattice with length 10 Angstrom and a speed
of sound of approximately 103 m/s.
Brownian motion
The movements of the Li atoms can also be analyzed as if they were particles
performing a random walk. External forces are propelling this particle through the
crystal. Also, the particle is being hold back by a ‘friction’ force due to its surroundings.
When these forces are in equilibrium, the whole system will reach a steady state and
the particle will flow at a steady average velocity. For a moving particle the equation of
motion reads (9):
𝑚𝑑�⃗⃗�
𝑑𝑡= ∑ �⃗�
A second step takes into account the randomness of the motion of a particle performing
a random walk and leads to the Langevin equation. The particle is modelled to bump up
and down, forwards and backwards, in a totally random way. It is called to execute a
Brownian motion. Adding the random force R(t) to the previous equation gives the
Langevin equation:
𝑚𝑑�⃗⃗�
𝑑𝑡= ∑ �⃗� + �⃗⃗�(𝑡)
Diffusivity
Brownian motion is the random movement of particles performing a random walk, a
process which is quantified by the diffusivity D. In essence this value tells you how much
a particle moves in a certain time. Therefore the diffusivity D is proportional to the
Mean Square Displacement (MSD) of the atoms involved; (10) Nernst and Einstein have
first derived this from the Langevin equation:
𝐷 = 1
2𝑑lim𝑡→∞
⟨[𝑟(𝑡0+𝑡)−𝑟(𝑡0 ) ]2⟩
𝑡≈
𝑀𝑆𝐷
6𝑡
Here d is the number of dimensions in which the process happens (in this case three)
and t is the time elapsed during the diffusion process. The MSD is defined as the
ensemble average of the squared displacements r during a process. It is evident that
simulation times cannot go to infinity, but have to be chosen sufficiently long for
realistic approximations.
(3)
(4)
(5)
10
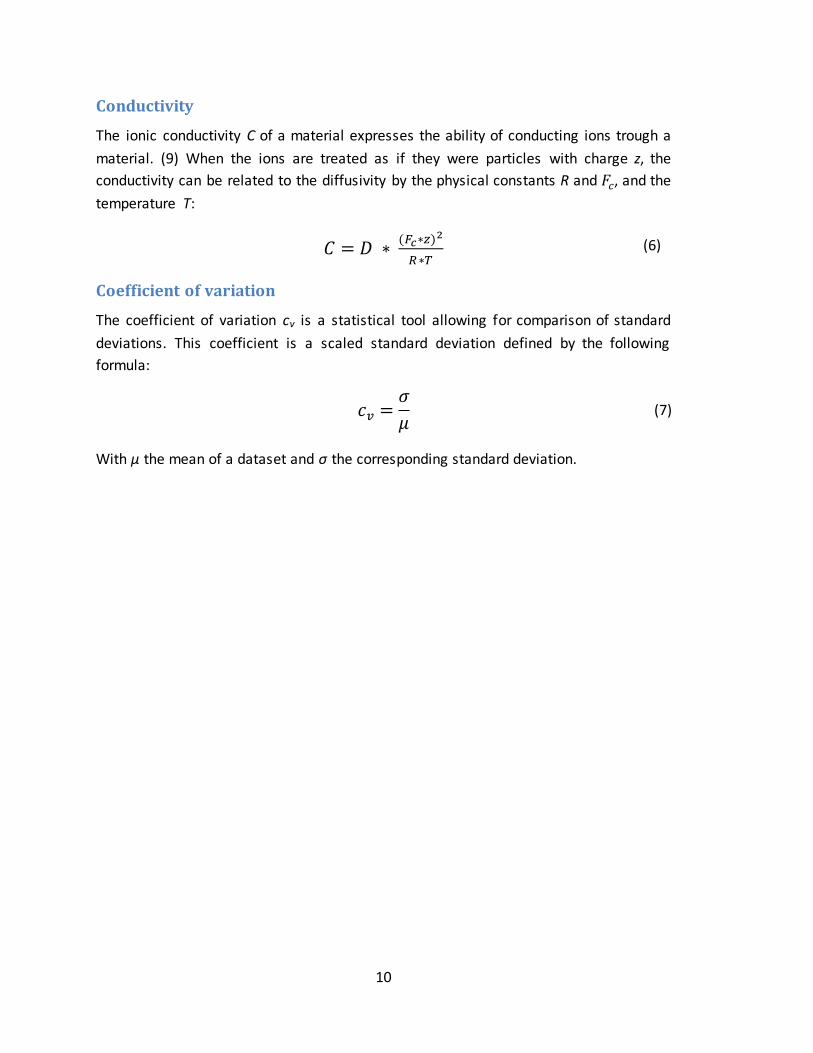
Conductivity
The ionic conductivity C of a material expresses the ability of conducting ions trough a
material. (9) When the ions are treated as if they were particles with charge z, the
conductivity can be related to the diffusivity by the physical constants R and 𝐹𝑐, and the
temperature T:
𝐶 = 𝐷 ∗ (𝐹𝑐∗𝑧)2
𝑅 ∗𝑇
Coefficient of variation
The coefficient of variation cv is a statistical tool allowing for comparison of standard
deviations. This coefficient is a scaled standard deviation defined by the following
formula:
𝑐𝑣 =𝜎
𝜇
With μ the mean of a dataset and σ the corresponding standard deviation.
(6)
(7)
11
Methodology
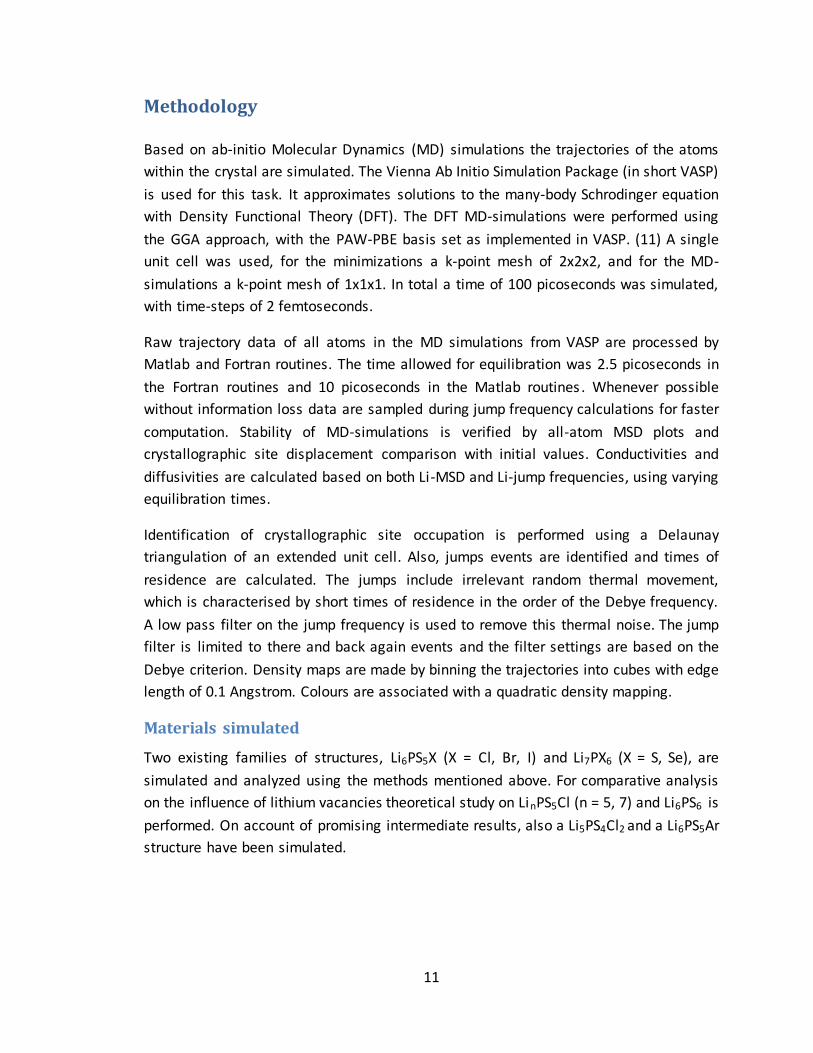
Based on ab-initio Molecular Dynamics (MD) simulations the trajectories of the atoms
within the crystal are simulated. The Vienna Ab Initio Simulation Package (in short VASP)
is used for this task. It approximates solutions to the many-body Schrodinger equation
with Density Functional Theory (DFT). The DFT MD-simulations were performed using
the GGA approach, with the PAW-PBE basis set as implemented in VASP. (11) A single
unit cell was used, for the minimizations a k-point mesh of 2x2x2, and for the MD-
simulations a k-point mesh of 1x1x1. In total a time of 100 picoseconds was simulated,
with time-steps of 2 femtoseconds.
Raw trajectory data of all atoms in the MD simulations from VASP are processed by
Matlab and Fortran routines. The time allowed for equilibration was 2.5 picoseconds in
the Fortran routines and 10 picoseconds in the Matlab routines . Whenever possible
without information loss data are sampled during jump frequency calculations for faster
computation. Stability of MD-simulations is verified by all-atom MSD plots and
crystallographic site displacement comparison with initial values. Conductivities and
diffusivities are calculated based on both Li-MSD and Li-jump frequencies, using varying
equilibration times.
Identification of crystallographic site occupation is performed using a Delaunay
triangulation of an extended unit cell. Also, jumps events are identified and times of
residence are calculated. The jumps include irrelevant random thermal movement,
which is characterised by short times of residence in the order of the Debye frequency.
A low pass filter on the jump frequency is used to remove this thermal noise. The jump
filter is limited to there and back again events and the filter settings are based on the
Debye criterion. Density maps are made by binning the trajectories into cubes with edge
length of 0.1 Angstrom. Colours are associated with a quadratic density mapping.
Materials simulated
Two existing families of structures, Li6PS5X (X = Cl, Br, I) and Li7PX6 (X = S, Se), are
simulated and analyzed using the methods mentioned above. For comparative analysis
on the influence of lithium vacancies theoretical study on LinPS5Cl (n = 5, 7) and Li6PS6 is
performed. On account of promising intermediate results, also a Li5PS4Cl2 and a Li6PS5Ar
structure have been simulated.

12
Results
Simulations are performed for several crystals using VASP. Three simulations are
performed for each material at 300, 450 and 600 Kelvin. Table 3 lists all materials
simulated with their Li-conductivities at 600 Kelvin based on the respective MSD’s.
Table 3 List of all simulated materials and their conductivities at 600 K.
Material structure Conductivity at 600 K (S/cm)
Exis
ting
com
poun
ds Li7PS6 0.438
Li6PS5Cl 1.01 Li6PS5Cl (2x1x1 supercell) 0.840
Li6PS5Br 0.845 Li6PS5I 0.080
Li7PSe6 0.730
Theo
reti
cal
com
poun
ds
Li6PS6 0.443
Li7PS5Cl 0.1801 Li5PS5Cl 0.3702
Li5PS4Cl2 2.04 Li6PS5Ar -3
In order to validate the consistency and spread of the results multiple runs with the
same starting conditions are performed for Li7PS6. This compound is chosen because it is
best described in literature and by experimental studies. (12) With rising temperature
the spread in the results becomes smaller, since the actual value for diffusivity should be
better approximated with increased jumping activity. As listed in Table 4, within four
runs at 300 Kelvin the coefficient of variation for the mean square displacement equals
0.33, whilst at 600 Kelvin the same coefficient equals 0.08.
Table 4 Coefficients of variation for the mean square displacement of diffusing lithium over 4 MD simulations of Li7PS6 at varying temperatures. The coefficient of variation is lower at higher temperatures because of the higher diffusivity.
Temperature (K) Mean conductivity (S/cm) Coefficient of variation (-) 300 0.054 0.33
450 0.30 0.22 600 0.50 0.08
1 Unstable at 600 K, results l isted for 450 K.
2 Unstable at 600 K, results l isted for 450 K.
3 No data available because of structure instability.

13
Exact calculation of the variation for each material requires multiple runs with the same
starting conditions. This approach is highly ineffective and computational power is
limited. Therefore other materials are assumed to have comparable coefficients of
variation. The assumption is reasonable, since the crystals are much alike and the
temperature dependence of the diffusivity is expected and found in all simulated
compounds. Even if calculated, errors bars are left away to make the figures more clear.
In the next chapters the conductivity data, jump rates and Li-pathways are thoroughly
discussed for all compounds.
Conductivity data
Figure 1 shows conductivities calculated from the Li MSD’s. Comparison of conductivity
data shows that Li6PS5Cl is the best Li conductor from the Li7PX6 (X = S, Se) and Li6PS5X (X
= Cl, Br, I) families, with a conductivity of over 1 S/cm at 600 K, while the Li6PS5I
compound performs significantly worse from the others. The data points of Li7PS6 show
the spread in the results. It should also be mentioned that in consequence of the low
activity and limited simulation time the spread in the results at 300K is very large,
resulting in much overlap between the data points and low reliability.
Figure 1 Conductivities in Li7PX6 (X = S, Se) and Li6PS5X (X = Cl, Br, I) based on Li MSD’s. Clearly, Li6PS5Cl performs best and Li6PS5I performs significantly worse compared to all the other materials.
0
0.2
0.4
0.6
0.8
1
1.2
250 350 450 550 650
Co
nd
uct
ivit
y (S
/cm
)
Temperature (K)
Li7PS6
Li6PS5Br
Li6PS5Cl
Li7PSe6
Li6PS5I

14
Next to the two existing families of materials, several theoretical materials are
simulated for comparison and analysis purposes. The Li5PS4Cl2 was stable at all
temperatures, and showed promising results with a conductivity of over 2 S/cm at 600
K. Two other materials simulated, LinPS5Cl (n = 5, 7), suffered from instability at an
elevated temperature of 600 K, whereas Li6PS5Ar was not stable at all. Figure 2 shows
conductivities for all stable theoretical materials simulated.
Figure 2 Conductivities in LinPS5Cl (n = 5, 7), Li5PS4Cl2 and Li6PS6 based on Li MSD’s. Note that the data
points of Li5PS5Cl and Li6PS6 overlap slightly. Clearly Li5PS4Cl2 outperforms all other materials as to
conductivity.
0
0.5
1
1.5
2
2.5
250 350 450 550 650
Co
nd
uct
ivit
y (S
/cm
)
Temperature (K)
Li5PS4Cl2
Li7PS5Cl
Li5PS5Cl
Li6PS6

15
Pathway categorization
Based on the molecular dynamics data density plots are made for all the materials. Since
they belong to the same space group, the diffusion pathways are similar in all
simulations. These pathways can be divided into 3 categories, mainly depending on the
distance between the crystallographic sites occupied, as indicated in Table 5. (13) The
categorization is used to investigate the Li-pathways and jump frequencies in a
structured manner.
Table 5 Pathway categorization and typical values for jump distance and energy barrier
Pathway category
Characteristic description Typical jump distance (Å)
Typical energy barrier (eV)
1 Triplet site <2 <0.1
2 Pathway cage 2 – 3 >0.1 3 Enabling macroscopic
diffusion
>3 >0.2
Triplet site (48h – 24g – 48h)
Figure 3 A triplet site in Li6PS5Br in a density plot at 450 Kelvin, where red stands for high occupancy and blue for low occupancy. The triplet sites consist of two red marked 48h sites with a blue marked 24g site in between. During this simulation the bottom 48h site is particularly longer occupied than the top one.
The first category with the lowest energy barrier is that between two closest pairs of
48h sites. In the halide containing materials an interstitial 24g site in between eases this
passage, together forming a triplet. As a result of the very short distance between these
16
sites, the lithium in a crystal distributes evenly over all triplets, avoiding states in which
one triplet has two Li’s and another triplet is empty. This however is a necessary
stadium for diffusion trough Li6PS5X.
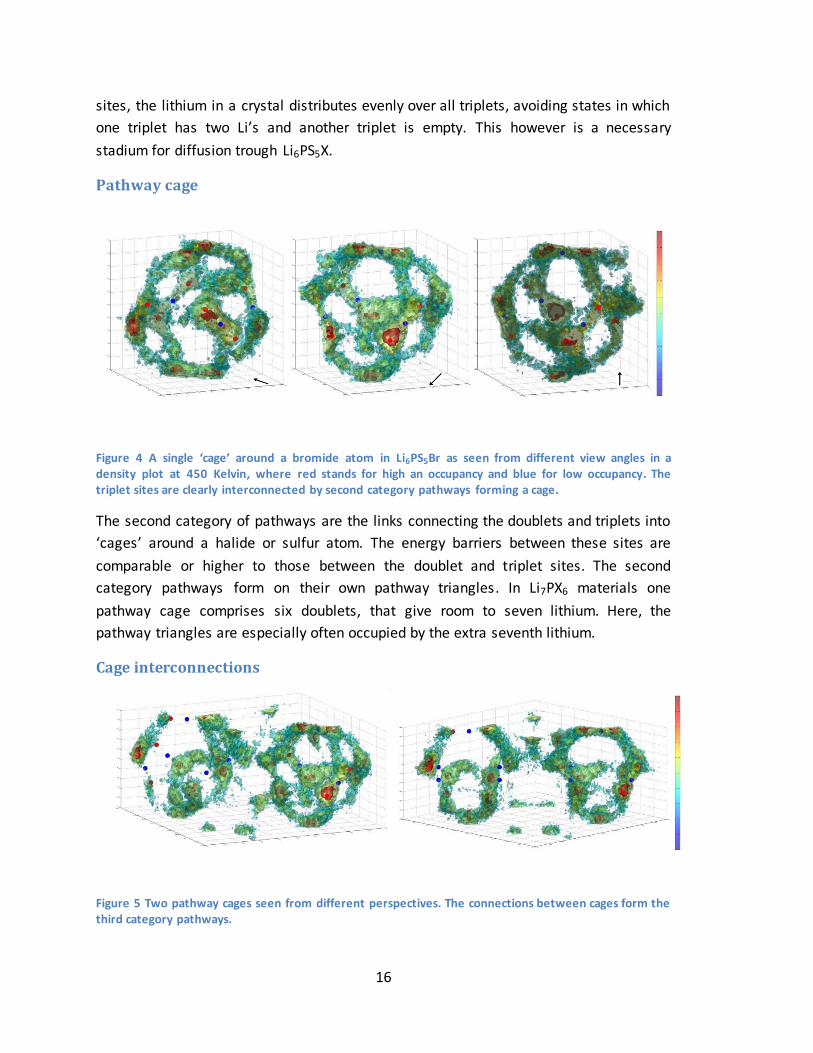
Pathway cage
Figure 4 A single ‘cage’ around a bromide atom in Li6PS5Br as seen from different view angles in a density plot at 450 Kelvin, where red stands for high an occupancy and blue for low occupancy. The triplet sites are clearly interconnected by second category pathways forming a cage.
The second category of pathways are the links connecting the doublets and triplets into
‘cages’ around a halide or sulfur atom. The energy barriers between these sites are
comparable or higher to those between the doublet and triplet sites. The second
category pathways form on their own pathway triangles. In Li7PX6 materials one
pathway cage comprises six doublets, that give room to seven lithium. Here, the
pathway triangles are especially often occupied by the extra seventh lithium.
Cage interconnections
Figure 5 Two pathway cages seen from different perspectives. The connections between cages form the third category pathways.

17
The third category pathways are the connections between the four ‘cages’ within a unit
cell. The energy barrier for these connections is the highest from the three categories.
These connections are necessary for long range diffusivity of lithium through F-43m
crystals. Because of their high energy barrier, they are the least likely to occur and are
the main limiting factor for lithium diffusivity in these crystals.

18
Li6PS5X (X = Cl, Br, I) compounds results
The diffusion pathways have been made visible for Li6PS5X structures. First of all several
density plots are made, that show where the lithium resides most frequently. The spots
with highest density coincide with the experimental values for the crystal structure,
supporting the correctness of the simulations. (13)
Figure 6 Li-density maps for Li6PS5Cl, Li6PS5Br and Li6PS5I at 600K. The Li6PS5Br and Li6PS5Cl are much alike, but Li6PS5I has a more localized lithium distribution.
Figure 6 shows the density plots for Li6PS5Cl, Li6PS5Br and Li6PS5I. Four ‘cages’ around
the halide and sulfur atoms are clearly visible. It is also immediately visible that in the
Li6PS5I compound, the lithium rarely moves from cage to cage, accounting for far worse
conductivity compared to the other two compounds. Connections in a single cage are
also far less pronounced in Li6PS5I.
Figure 7 A triplet site in both Li6PS5Br (left) and Li6PS5Cl (right) in a density plot at 450 Kelvin, where red stands for high occupancy and blue for low occupancy. A triplet site consist of two red marked 48h sites
with a blue marked 24g site in between.
19
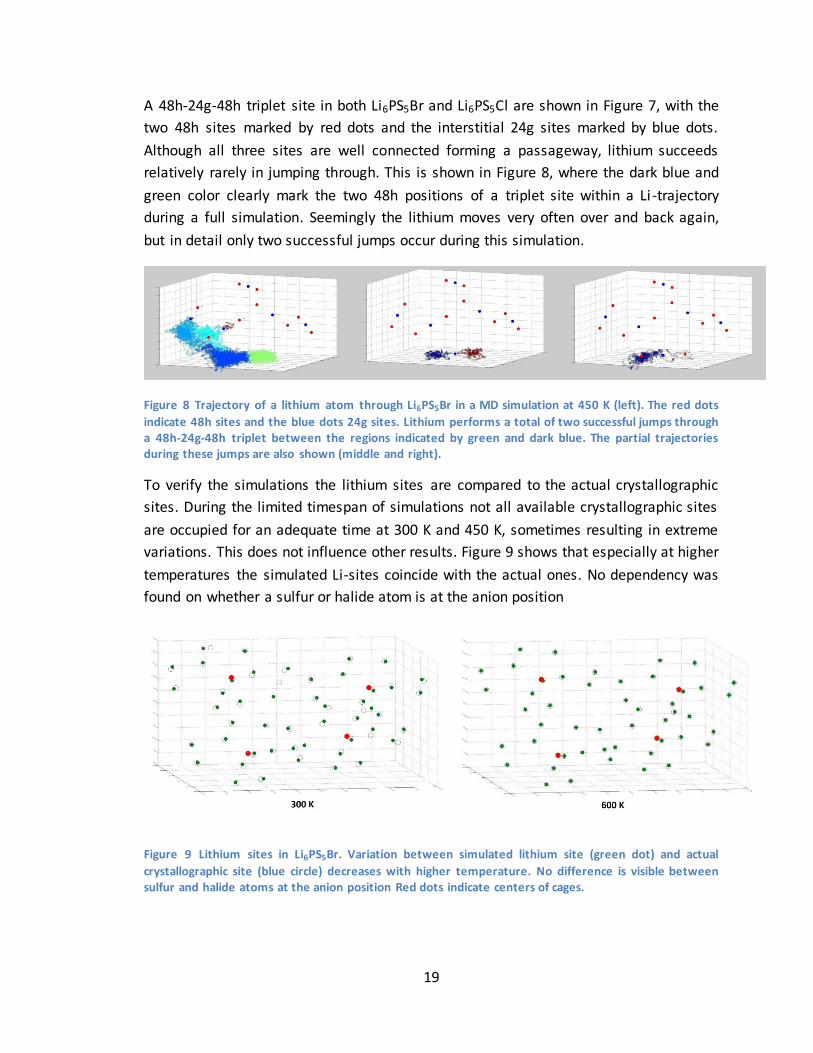
A 48h-24g-48h triplet site in both Li6PS5Br and Li6PS5Cl are shown in Figure 7, with the
two 48h sites marked by red dots and the interstitial 24g sites marked by blue dots.
Although all three sites are well connected forming a passageway, lithium succeeds
relatively rarely in jumping through. This is shown in Figure 8, where the dark blue and
green color clearly mark the two 48h positions of a triplet site within a Li -trajectory
during a full simulation. Seemingly the lithium moves very often over and back again,
but in detail only two successful jumps occur during this simulation.
Figure 8 Trajectory of a lithium atom through Li6PS5Br in a MD simulation at 450 K (left). The red dots
indicate 48h sites and the blue dots 24g sites. Lithium performs a total of two successful jumps through a 48h-24g-48h triplet between the regions indicated by green and dark blue. The partial trajectories during these jumps are also shown (middle and right).
To verify the simulations the lithium sites are compared to the actual crystallographic
sites. During the limited timespan of simulations not all available crystallographic sites
are occupied for an adequate time at 300 K and 450 K, sometimes resulting in extreme
variations. This does not influence other results. Figure 9 shows that especially at higher
temperatures the simulated Li-sites coincide with the actual ones. No dependency was
found on whether a sulfur or halide atom is at the anion position
Figure 9 Lithium sites in Li6PS5Br. Variation between simulated lithium site (green dot) and actual
crystallographic site (blue circle) decreases with higher temperature. No difference is visible between sulfur and halide atoms at the anion position Red dots indicate centers of cages.

20
Pathways in Li6PS5Br
Figure 10 The Li-density and Li-jumps for Li6PS5Br at 300 K (left), 450 K (middle) and 600 K (right)
In Figure 10 Li-density maps and Li-jumps are shown. At low temperature (300 K) the
density map does not show Li-pathways which run throughout the unit cell, but upon
increasing the temperature interconnected pathways appear. As shown in Figure 10
there are 3 types of Li-jumps in Li6PS5Br, the thickness of the lines corresponds to the
jump rate. At 600 K the mean jump rate per lithium equals 1.57·1011 s-1. The blue lines
show jumps between 48h sites via 24g sites (1.68 Å apart), the yellow lines show jumps
between the remaining connections of 48h sites within one ‘cage’ surrounding a sulphur
or halide atom (2.48 Å), and the red lines show jumps between 48h sites in different
‘cages’ (>3 Å). The red jumps are the most important since these make pathways
through the crystal. At 300 K there are some red jumps, so the Li-ions can move through
the whole crystal, but the MD-simulations are too short to capture this in the density
map. At higher temperatures more red lines appear, showing that the pathways become
better connected, leading to increased macroscopic diffusion. The mean jump distance
increases from 2.6 to 3 Angstrom between 300 K and 600 K.
The bromine atoms change the diffusion pathways in their surroundings, causing lithium
to hop less often along the blue connections and more often along the yellow
connections in Figure 10. This variation in environment has impact on the long range
diffusivity of lithium. An alternating pattern of sulphur and bromine on the anion
positions shows most red connections, promising best macroscopic diffusion.
(a) (b) (c)
21
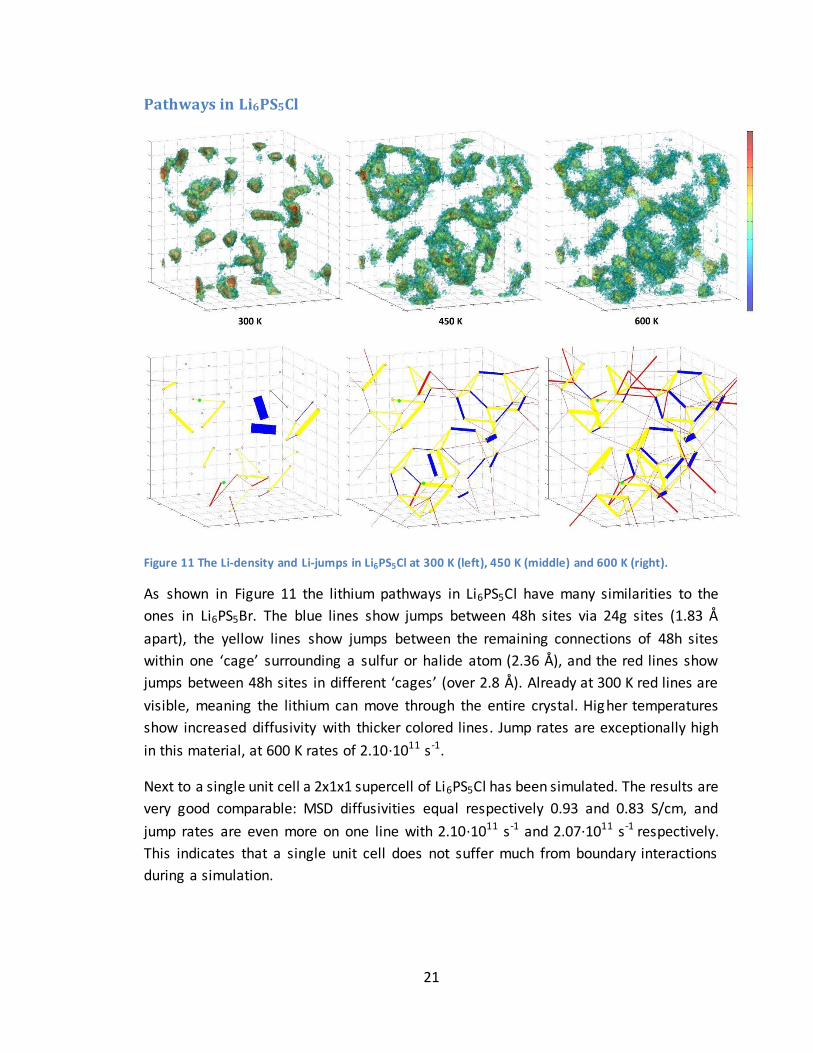
Pathways in Li6PS5Cl
Figure 11 The Li-density and Li-jumps in Li6PS5Cl at 300 K (left), 450 K (middle) and 600 K (right).
As shown in Figure 11 the lithium pathways in Li6PS5Cl have many similarities to the
ones in Li6PS5Br. The blue lines show jumps between 48h sites via 24g sites (1.83 Å
apart), the yellow lines show jumps between the remaining connections of 48h sites
within one ‘cage’ surrounding a sulfur or halide atom (2.36 Å), and the red lines show
jumps between 48h sites in different ‘cages’ (over 2.8 Å). Already at 300 K red lines are
visible, meaning the lithium can move through the entire crystal. Higher temperatures
show increased diffusivity with thicker colored lines. Jump rates are exceptionally high
in this material, at 600 K rates of 2.10·1011 s-1.
Next to a single unit cell a 2x1x1 supercell of Li6PS5Cl has been simulated. The results are
very good comparable: MSD diffusivities equal respectively 0.93 and 0.83 S/cm, and
jump rates are even more on one line with 2.10·1011 s-1 and 2.07·1011 s-1 respectively.
This indicates that a single unit cell does not suffer much from boundary interactions
during a simulation.
22
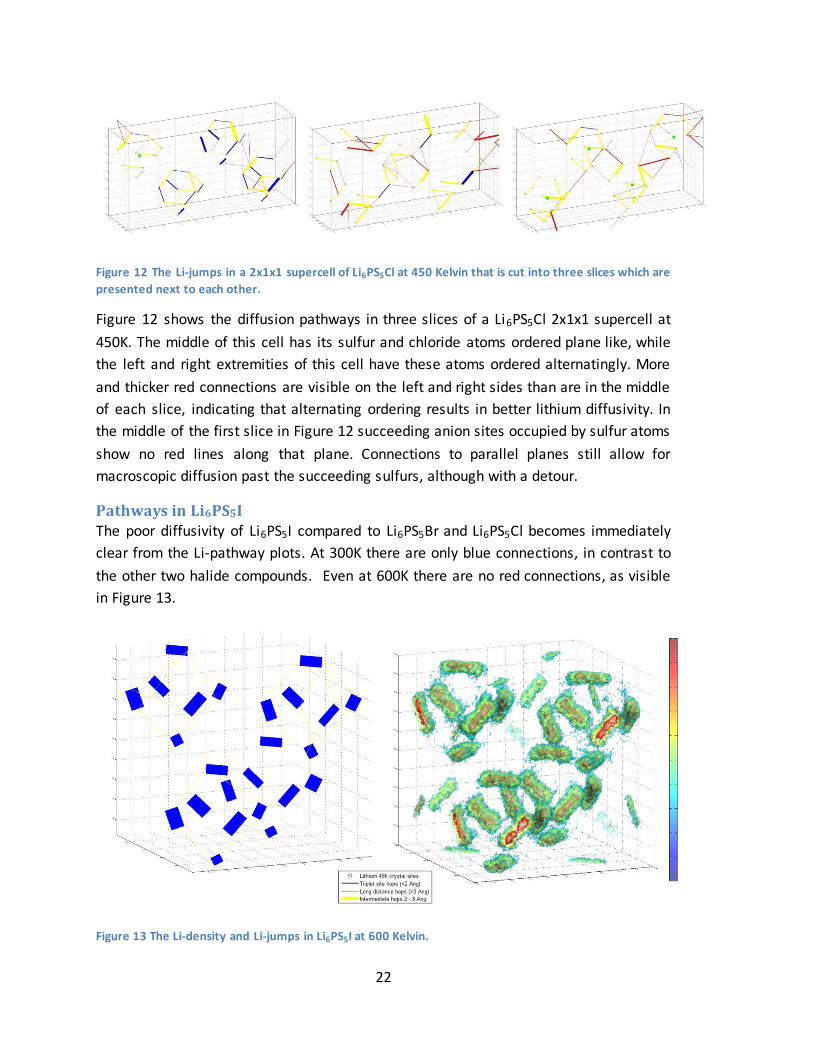
Figure 12 The Li-jumps in a 2x1x1 supercell of Li6PS5Cl at 450 Kelvin that is cut into three slices which are
presented next to each other.
Figure 12 shows the diffusion pathways in three slices of a Li6PS5Cl 2x1x1 supercell at
450K. The middle of this cell has its sulfur and chloride atoms ordered plane like, while
the left and right extremities of this cell have these atoms ordered alternatingly. More
and thicker red connections are visible on the left and right sides than are in the middle
of each slice, indicating that alternating ordering results in better lithium diffusivity. In
the middle of the first slice in Figure 12 succeeding anion sites occupied by sulfur atoms
show no red lines along that plane. Connections to parallel planes still allow for
macroscopic diffusion past the succeeding sulfurs, although with a detour.
Pathways in Li6PS5I The poor diffusivity of Li6PS5I compared to Li6PS5Br and Li6PS5Cl becomes immediately
clear from the Li-pathway plots. At 300K there are only blue connections, in contrast to
the other two halide compounds. Even at 600K there are no red connections, as visible
in Figure 13.
Figure 13 The Li-density and Li-jumps in Li6PS5I at 600 Kelvin.
23
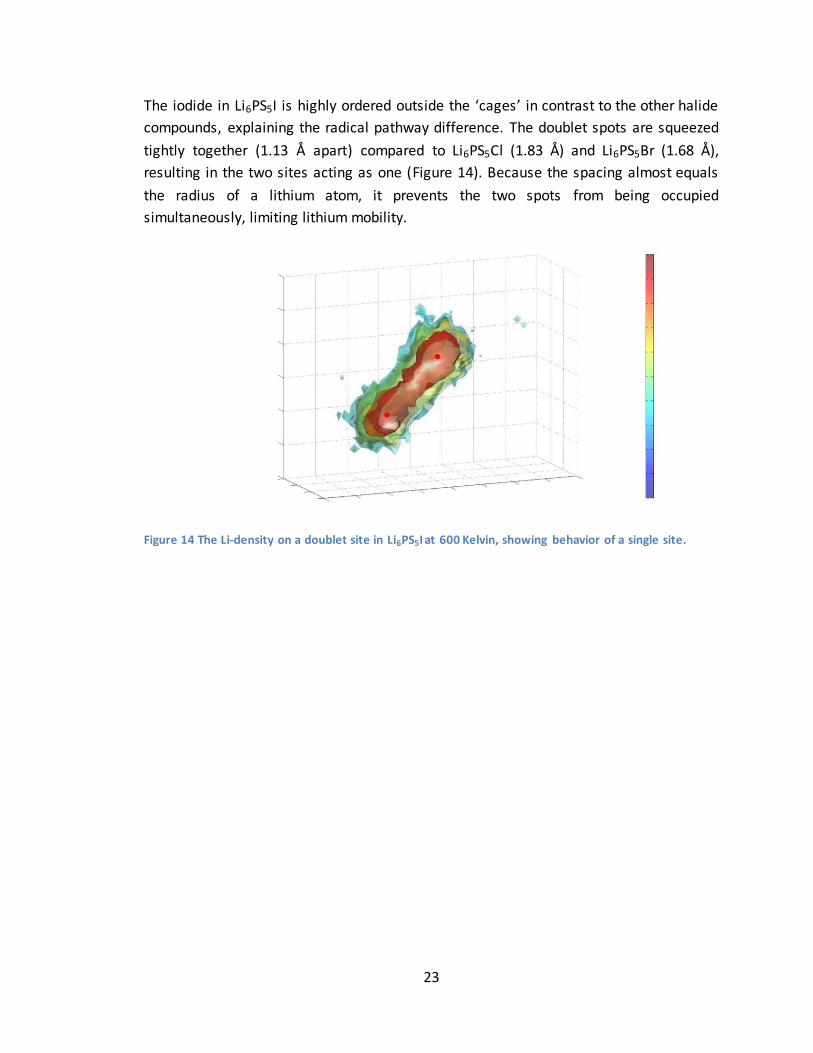
The iodide in Li6PS5I is highly ordered outside the ‘cages’ in contrast to the other halide
compounds, explaining the radical pathway difference. The doublet spots are squeezed
tightly together (1.13 Å apart) compared to Li6PS5Cl (1.83 Å) and Li6PS5Br (1.68 Å),
resulting in the two sites acting as one (Figure 14). Because the spacing almost equals
the radius of a lithium atom, it prevents the two spots from being occupied
simultaneously, limiting lithium mobility.
Figure 14 The Li-density on a doublet site in Li6PS5I at 600 Kelvin, showing behavior of a single site.
24
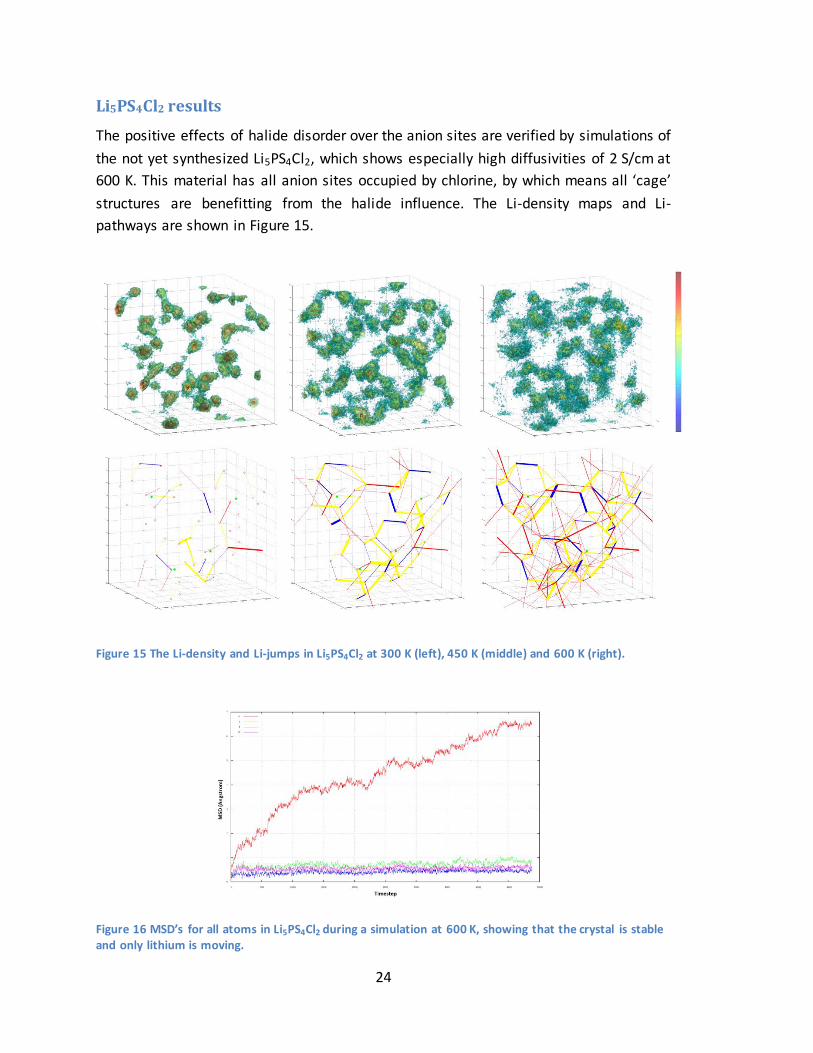
Li5PS4Cl2 results
The positive effects of halide disorder over the anion sites are verified by simulations of
the not yet synthesized Li5PS4Cl2, which shows especially high diffusivities of 2 S/cm at
600 K. This material has all anion sites occupied by chlorine, by which means all ‘cage’
structures are benefitting from the halide influence. The Li-density maps and Li-
pathways are shown in Figure 15.
Figure 15 The Li-density and Li-jumps in Li5PS4Cl2 at 300 K (left), 450 K (middle) and 600 K (right).
Figure 16 MSD’s for all atoms in Li5PS4Cl2 during a simulation at 600 K, showing that the crystal is stable and only lithium is moving.
25
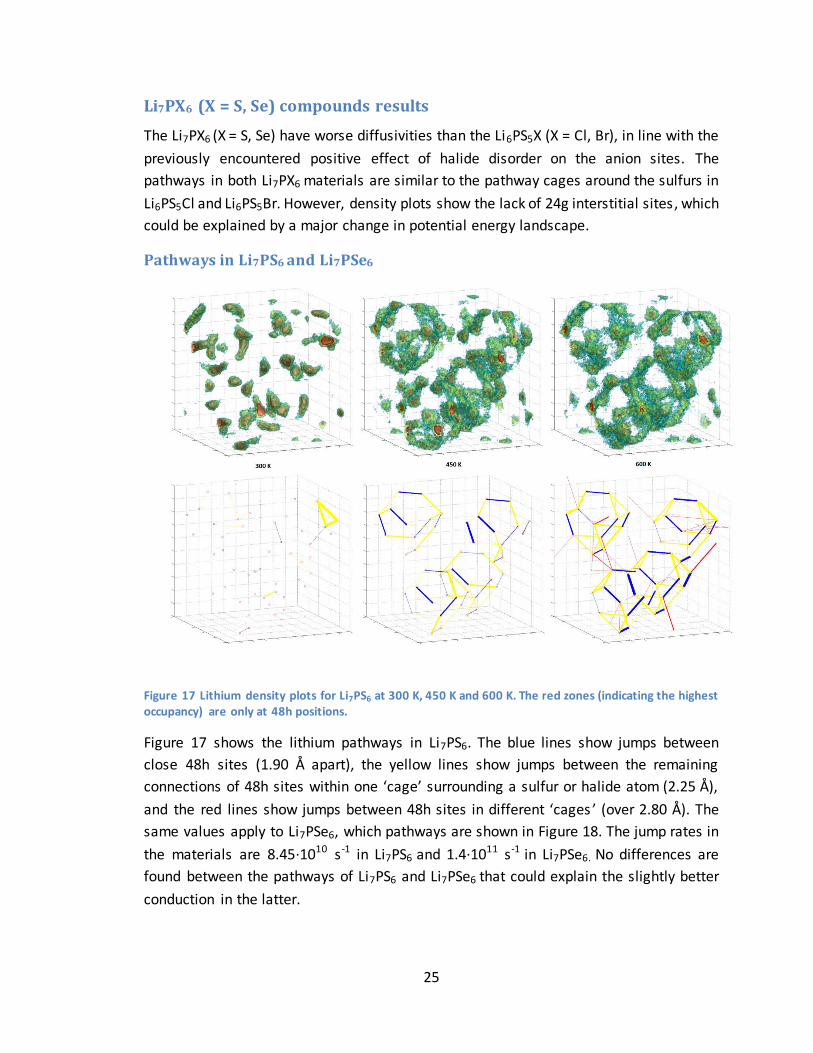
Li7PX6 (X = S, Se) compounds results
The Li7PX6 (X = S, Se) have worse diffusivities than the Li6PS5X (X = Cl, Br), in line with the
previously encountered positive effect of halide disorder on the anion sites. The
pathways in both Li7PX6 materials are similar to the pathway cages around the sulfurs in
Li6PS5Cl and Li6PS5Br. However, density plots show the lack of 24g interstitial sites, which
could be explained by a major change in potential energy landscape.
Pathways in Li7PS6 and Li7PSe6
Figure 17 Lithium density plots for Li7PS6 at 300 K, 450 K and 600 K. The red zones (indicating the highest occupancy) are only at 48h positions.
Figure 17 shows the lithium pathways in Li7PS6. The blue lines show jumps between
close 48h sites (1.90 Å apart), the yellow lines show jumps between the remaining
connections of 48h sites within one ‘cage’ surrounding a sulfur or halide atom (2.25 Å),
and the red lines show jumps between 48h sites in different ‘cages ’ (over 2.80 Å). The
same values apply to Li7PSe6, which pathways are shown in Figure 18. The jump rates in
the materials are 8.45·1010 s-1 in Li7PS6 and 1.4·1011 s-1 in Li7PSe6. No differences are
found between the pathways of Li7PS6 and Li7PSe6 that could explain the slightly better
conduction in the latter.
26
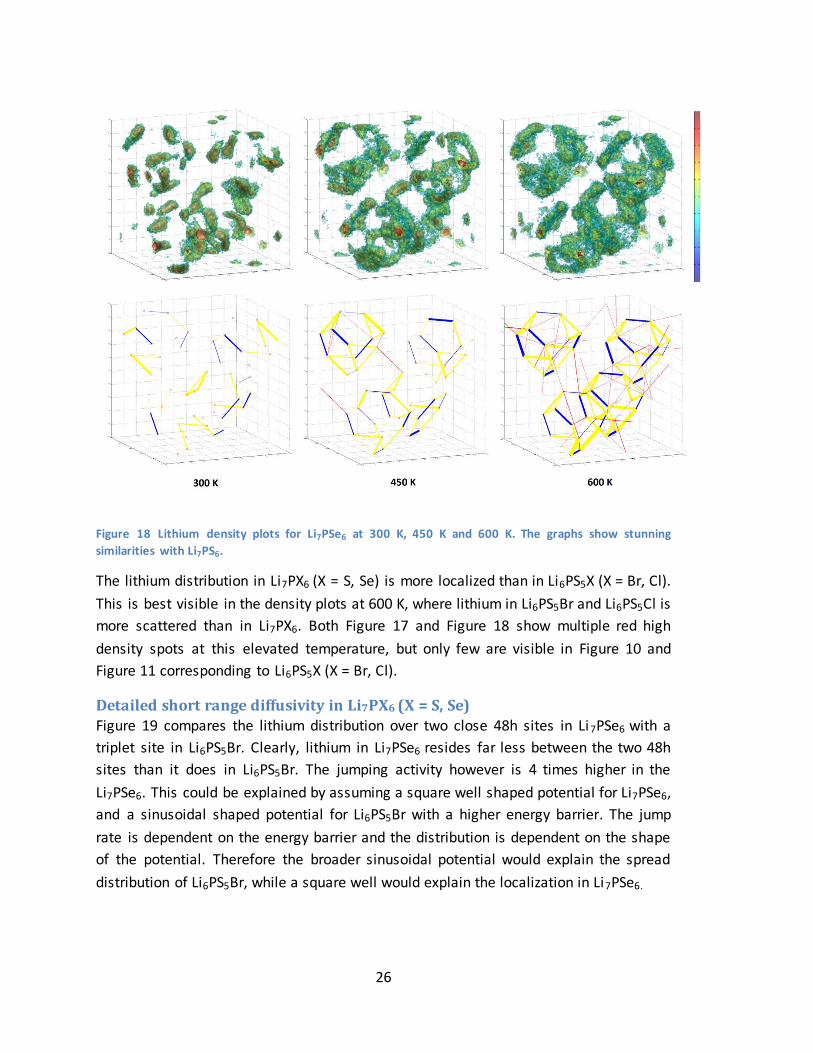
Figure 18 Lithium density plots for Li7PSe6 at 300 K, 450 K and 600 K. The graphs show stunning
similarities with Li7PS6.
The lithium distribution in Li7PX6 (X = S, Se) is more localized than in Li6PS5X (X = Br, Cl).
This is best visible in the density plots at 600 K, where lithium in Li6PS5Br and Li6PS5Cl is
more scattered than in Li7PX6. Both Figure 17 and Figure 18 show multiple red high
density spots at this elevated temperature, but only few are visible in Figure 10 and
Figure 11 corresponding to Li6PS5X (X = Br, Cl).
Detailed short range diffusivity in Li7PX6 (X = S, Se)
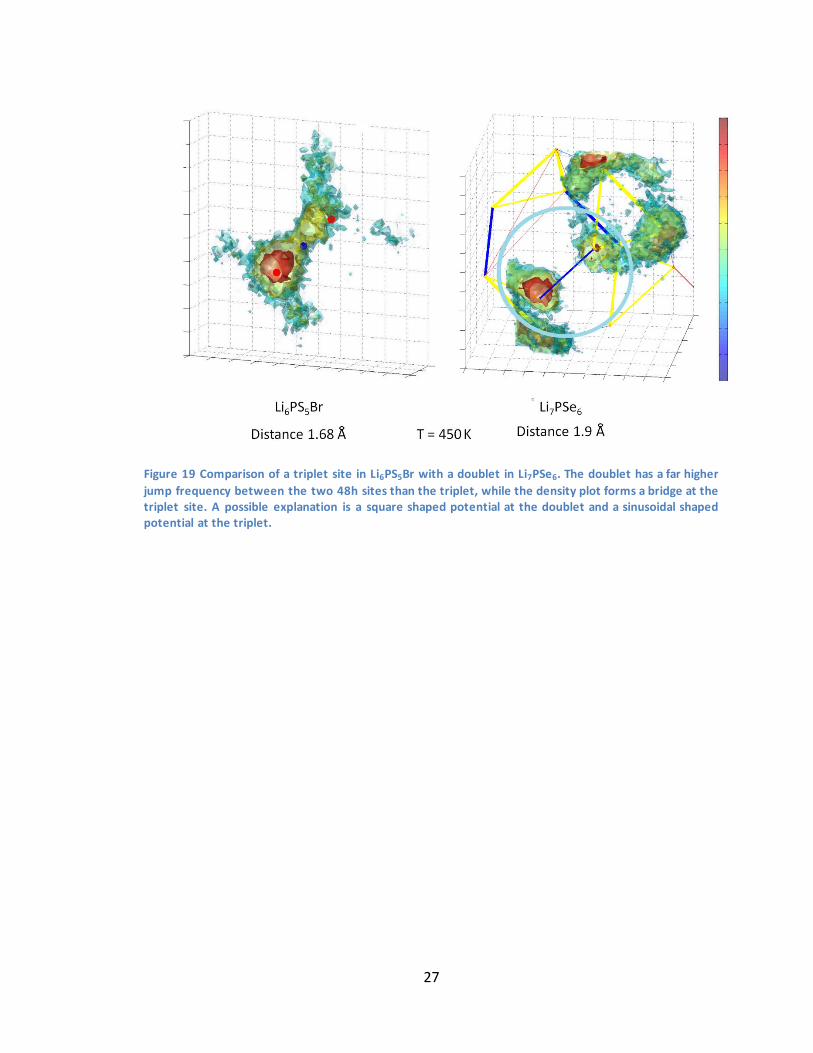
Figure 19 compares the lithium distribution over two close 48h sites in Li7PSe6 with a
triplet site in Li6PS5Br. Clearly, lithium in Li7PSe6 resides far less between the two 48h
sites than it does in Li6PS5Br. The jumping activity however is 4 times higher in the
Li7PSe6. This could be explained by assuming a square well shaped potential for Li7PSe6,
and a sinusoidal shaped potential for Li6PS5Br with a higher energy barrier. The jump
rate is dependent on the energy barrier and the distribution is dependent on the shape
of the potential. Therefore the broader sinusoidal potential would explain the spread
distribution of Li6PS5Br, while a square well would explain the localization in Li7PSe6.
27
Figure 19 Comparison of a triplet site in Li6PS5Br with a doublet in Li7PSe6. The doublet has a far higher
jump frequency between the two 48h sites than the triplet, while the density plot forms a bridge at the triplet site. A possible explanation is a square shaped potential at the doublet and a sinusoidal shaped potential at the triplet.
28
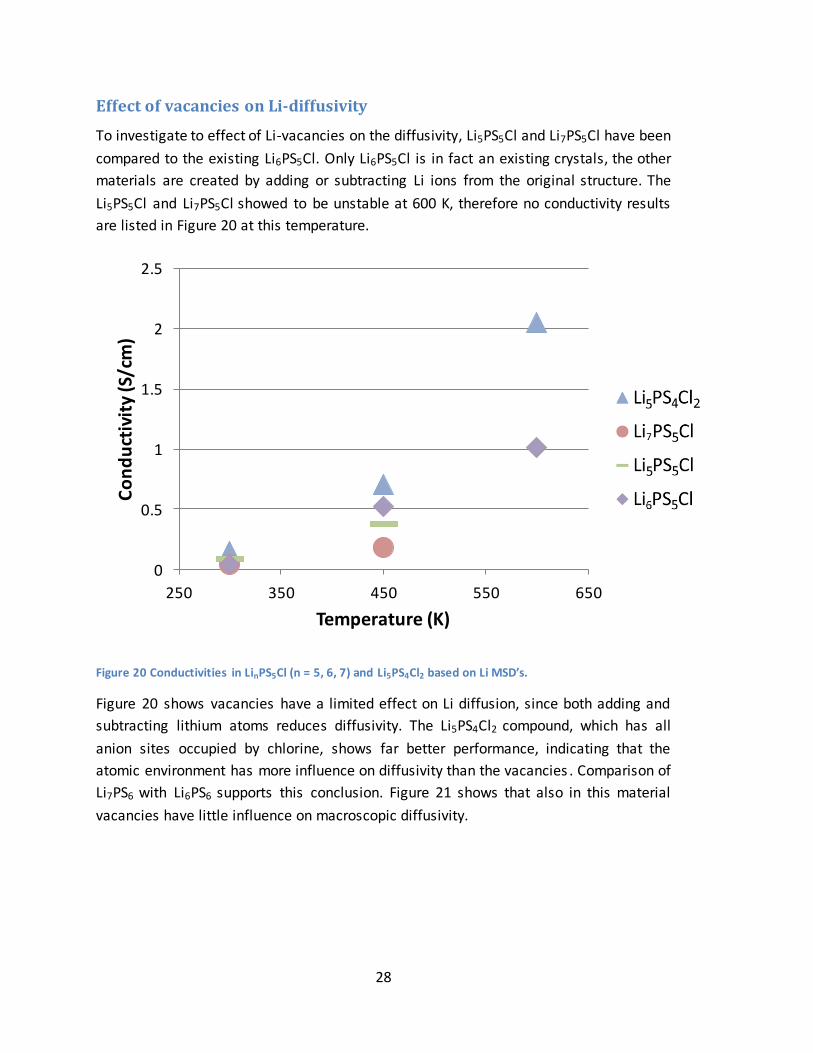
Effect of vacancies on Li-diffusivity
To investigate to effect of Li-vacancies on the diffusivity, Li5PS5Cl and Li7PS5Cl have been
compared to the existing Li6PS5Cl. Only Li6PS5Cl is in fact an existing crystals, the other
materials are created by adding or subtracting Li ions from the original structure. The
Li5PS5Cl and Li7PS5Cl showed to be unstable at 600 K, therefore no conductivity results
are listed in Figure 20 at this temperature.
Figure 20 Conductivities in LinPS5Cl (n = 5, 6, 7) and Li5PS4Cl2 based on Li MSD’s.
Figure 20 shows vacancies have a limited effect on Li diffusion, since both adding and
subtracting lithium atoms reduces diffusivity. The Li5PS4Cl2 compound, which has all
anion sites occupied by chlorine, shows far better performance, indicating that the
atomic environment has more influence on diffusivity than the vacancies . Comparison of
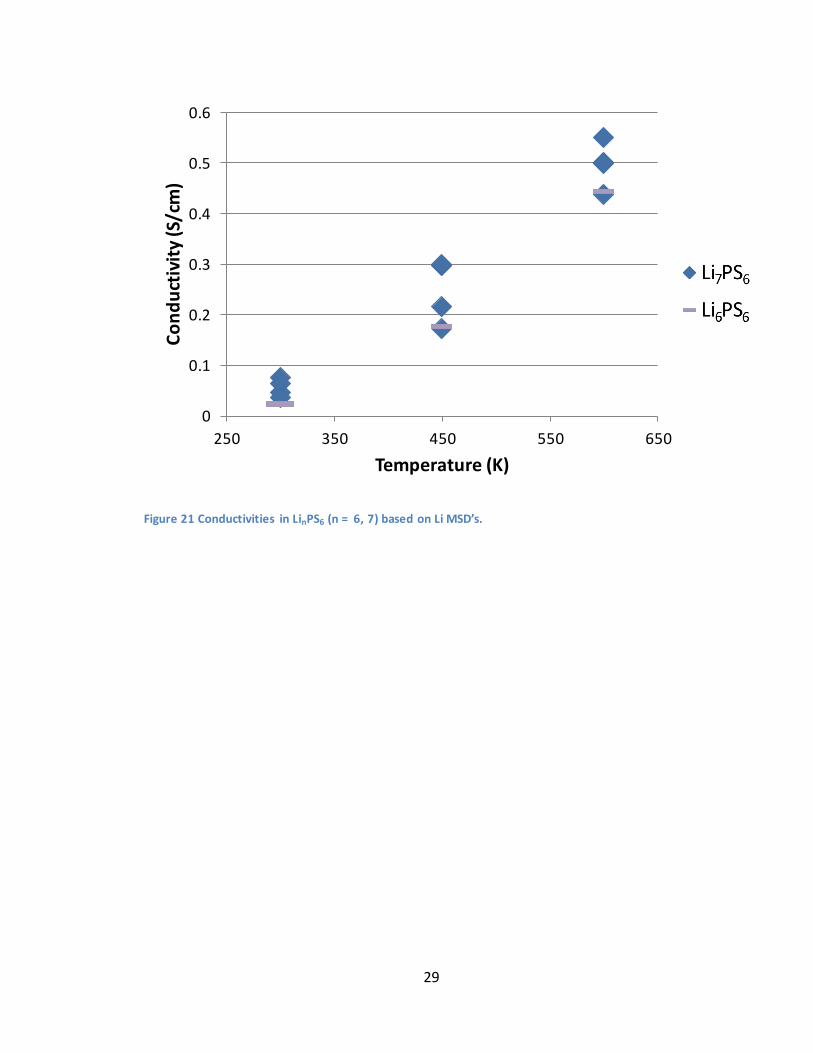
Li7PS6 with Li6PS6 supports this conclusion. Figure 21 shows that also in this material
vacancies have little influence on macroscopic diffusivity.
0
0.5
1
1.5
2
2.5
250 350 450 550 650
Co
nd
uct
ivit
y (S
/cm
)
Temperature (K)
Li5PS4Cl2
Li7PS5Cl
Li5PS5Cl
Li6PS5Cl
29
Figure 21 Conductivities in LinPS6 (n = 6, 7) based on Li MSD’s.
0
0.1
0.2
0.3
0.4
0.5
0.6
250 350 450 550 650
Co
nd
uct
ivit
y (S
/cm
)
Temperature (K)
Li7PS6
Li6PS6

30
Jump rates
In Table 6 jump frequencies and average jump distances for relevant materials are
listed. Column Ratio shows that conductivities based on jump frequencies differ
significantly from MSD results at 300 K, but the values approach each other at higher
temperatures. This indicates that at lower temperatures some Li atoms only exhibit local
hopping, whilst at elevated temperatures all macroscopic pathways are being used.
Table 6 Jump rates, mean jump distances and conductivities from MD-simulations with 10 picoseconds equilibration time.
Structure T (K)
Mean jump distance (Å)
Jump rate (s-1)
Jump rate conductivity (S/cm)
Ratio MSD (Å2)
MSD Conductivity (S/cm)
Li7PS6 300 2.3 1.43·109 1.84·10-2 1 1.3 3.20·10-2
Li7PS6 450 2.3 3.45·1010 0.303 2 8.5 0.14
Li7PS6 600 2.4 8.45·1010 0.602 2 28.2 0.35
Li7PSe6 300 2.3 2.82·1010 0.367 6 2.4 0.06
Li7PSe6 450 2.3 6.55·1010 0.573 5 6.7 0.12
Li7PSe6 600 2.4 1.40·1011 1.00 1 48.7 0.67
Li6PS5Cl 300 2.5 3.70·1010 0.573 27 0.9 0.02
Li6PS5Cl 450 2.5 1.17·1011 1.21 2 30.3 0.50
Li6PS5Cl 600 2.8 2.10·1011 2.04 2 74.9 0.93
Li6PS5Cl (sc)
300 2.5 4.14·1010 0.638 14 1.7 0.05
Li6PS5Cl (sc)
450 2.5 9.35·1010 0.974 4 14.6 0.27
Li6PS5Cl
(sc) 600 2.8 2.07·1011 2.02 2 60.0
0.83
Li6PS5Br 300 2.6 4.44·1010 0.728 5 5.9 0.16
Li6PS5Br 450 2.9 9.95·1010 1.39 4 21.0 0.39
Li6PS5Br 600 3 1.57·1011 1.78 2 60.0 0.83
Li5PS4Cl2 300 2.4 2.67·1010 0.366 4 4.2 0.1
Li5PS4Cl2 450 2.6 1.24·1011 2.38 3 43.0 0.711
Li5PS4Cl2 600 3.1 2.14·1011 2.55 1 157.0 1.94
The 24g sites that would make up to the triplet sites are omitted in the jump rate
calculations and pathway graphs in the next sections, because they are primarily used
by the lithium as a passageway between 48h sites instead of really stationary crystal

31
sites. During a simulation the lithium atom moves very often up and back between
these positions. The average residence time on a 24g site is 50 femtoseconds, while it is
at least 100 femtoseconds on a 48h site and often much longer. Evidently the lithium
only passes through the 24g spot rather than staying there.
32
Conclusion
Diffusivity values and lithium distributions in Li6PS5X (X = Cl, Br, I) and Li7PX6 (X = S, Se)
are investigated using MD simulations. The best lithium conduction is found in Li6PS5Cl
with diffusivity over 1 S/cm at 600 K. The change of lithium pathways near halide atoms
plays a prominent role in lithium diffusion. Disorder of chlorine and bromine on anion
sites opens pathways in the neighborhood enabling higher conductivities. Strictly
ordered iodide in Li6PS5I shows unfavorable influence blocking lithium pathways leading
to a lower conductivity of 0.08 S/cm at 600 K. For materials with partial halide disorder
on the anion sites an alternating pattern is most favorable for high lithium diffusion.
The halide rich Li5PS4Cl2 shows promising results with diffusivity of over 2 S/cm at 600 K,
clearly benefitting from having all its anion sites occupied by chlorine. Comparative
study of LinPS5Cl (n = 5, 6, 7) and LinPS6 (n = 6, 7) shows no significant influence of
lithium vacancies on the diffusivity of lithium in these materials.
Both Li7PS6 and Li7PSe6 show a more localized lithium distribution compared to the
Li6PS5X (X = Cl, Br, I) group. However, this does not hinder lithium diffusivity. The lithium
pathways have been categorized into three groups, depending on the corresponding
jump distances and morphology. Jump rates in both material families are in the order of
1010 s-1, while Li6PS5Cl and Li5PS4Cl2 show the highest jump rates of respectively 2.10·1011
s-1 and 2.14·1011 s-1 at 600 K.

33
34
Recommendations
Based on the MD results the best Li-conductor in the Li6PS5X (X = Cl, Br, I) and Li7PX6 (X =
S, Se) families is Li6PS5Cl. Real life performance of Li6PS5Cl and Li6PS5Br can be improved
by ensuring that the halide disorder follows an alternating pattern. Furthermore, ways
to achieve higher anion disorder ratios during the synthetization process should be
sought in order to increase lithium diffusivity in these materials.
Possibilities of synthesizing the promising Li5PS4Cl2 are to be evaluated, since this
material performs better in the simulations than the existing families mentioned above.
The simulations show that this material is stable, insulating and a particularly good
lithium conductor. Therefore this material would be a good runner up for a solid state
electrolyte.
In future MD simulations a broader use of higher level languages for data analysis
purposes is recommended. While the VASP routines are reasonably written in a low
level language allowing for faster execution (Fortran), the analysis tools do not
necessarily have to be written this way. Higher level environments (Matlab, Python) are
more versatile and easier to debug at the exchange of performance. Efficient integration
of both environments requires optimization of the output files from VASP for easier
loading to the higher level environments, since this turned out to be a bottle neck
during the analysis in this report.
Follow up studies of the MD simulations could also take into account the potentials of
different atoms, especially during jump events. This allows for a deeper understanding
of the diffusion mechanisms and processes occurring.

35

36
Acknowledgments
First I want to thank both N. de Klerk and dr. ir. M. Wagemaker for their help and
guidance in writing this bachelor thesis. Furthermore I would like to thank both Chuang
Yu and Swapna Ganapathy for answering my questions and helping me when I was in
doubt. And also all the others from the staff of FAME with who I spend a good time at
the Reactor Institute in Delft writing this thesis.

37
38
References
1. Recent progress in high-voltage lithium ion batteries. Hu, M., Pang, X. and Zhou, Z.
s.l. : Journal of Power Sources, 2013.
2. How Electrolytes influence battery safety. Roth, E.P. and Orendorff, C.J. s.l. : The
Electrochemical Society, 2012.
3. Li6PS5X: A class of crystalline Li-Rich Solids With an Unusaually High Li+ Mobility.
Deiseroth, H.-J., et al., et al. Weinheim : Angewandte Chemie, 2007.
4. Li7PS6 and Li6PS5X (X: Cl, Br, I): Possible Three-dimensional DIffusion Pathways for
Lithium Ions and Temperature Dependance of the Ionic Conductivity by Impedance
Measurements. Deiseroth, H.-J., et al., et al. Weinheim : Wiley-VCH, 2011.
5. Hook, J.R. and Hall, H.E. Solid State Physics. Salisbury : APS, 1991.
6. DFT in a nutshell. Burke, Kieron and Wagner, L.O. s.l. : International Journal of
Quatnum Chemistry, 2012.
7. Kohanoff, Jorge. Electronic Structure Calculations for Solids and Molecules.
Cambridge : Cambridge University Press, 2006.
8. Mehrer, H. Diffusion in Solids: Fundamentals, Methods, Materials, Diffusion-
Controlled Processes. s.l. : Springer Science & Business Media, 2007.
9. Wolfson, R. Essential University Physics. Harlow : Addison-Wesley, 2007.
10. On the theory of Brownian motion. Uhlenbeck, G.E. and Ornstein, L.S. 35(5):823,
s.l. : Physical review, 1930.
11. Kresse, G. and Hafner, J. 47, 558, s.l. : Physical Review B, 1993.
12. Synthesis and Characterization of Lithium Argyrodite, Li7PS6. Kong, S.T., Reiner, C.
and Deiseroth, H.J. s.l. : WILEY-VCH Verlag, 2006.
13. Variation in structure and Li+-ion migration in argyrodite-type Li6PS5X (X = Cl, Br, I)
solid electrolytes. Rayavarapu, P.R., et al., et al. s.l. : Springler-Verlag, 2011.