Embed Size (px)
Citation preview

1) The minimum-geometry UMOST has an area advantage of two to one over the minimum-geometry VMOST.
2) The UMOST has an intrinsic time constant better than that of the VMOST by a factor of 1.35 to 1.50.
In addition, UMOS end-plane effects have been explained, quantitatively analyzed, and found to cause self-stopping after a sufficiently long etch.
The intrinsic time constant of UMOS with a 1.5-pm epitaxial layer is comparable to that of 2-pm NMOS.
REFERENCES [ 1 ] T. J. Rodgers, W. R. Hiltpold, J. W. Zimmer, G. Marr, and J. D.
Trotter, “VMOS ROM,” IEEE J. Solid-state Circuits, vol. Sc-11,
[2] T. J. Rodgers, W. R. Hiltpold, B. Frederick, J. J. Barnes, F. B. JennB, and J. D. Trotter, “VMOS memory technology,” IEEE J. Solid-State Circuits, vol. SC-12, no. 5, pp. 515-523, Oct. 1977.
pp. 614-622, Oct. 1976.
D. B. Lee, “misolropic: etching 01 silicon,” J. Appl . Plzys., vol. 40, pp. 4569-4574, Oct. 1969. J. B. Price, ‘ ‘hisot~opi : etchmg of silicon with KOH-H20- isopropyl alcohol,” in Scwricona’wfor Silicon. Princeton, NJ: Electrochem. Soc., 1973, pp. 339. D. L. Kendall, “On e:ching vary narrow grooves in silicon,” Appl . Phys. Ltctt., vol. 26, no. 4, Feb. 15, 1975. K. E. Bean, “Anisotropic: etching of silicon,” IEEE Trans. Elec- tron Devices, vol. ED-25, rto. 10, p p . 1185-1193, 1978. T. J. Rodgers, “Advanced integrate’d circuit technology for micro- power IC’s,” Ph.D. dissertation, Ranford Electronics Lab., Stan- ford Univ., Stanford, ,CA, PI). 110-153. T. J. Rodgers et al., “An (experimental and theoretical analysis of double-diffusad MOS t:ransistors,” IEEE J. Solid-state Circuirs,
R. H. Denna:;d et al., “Dc:sign of ion implanted MOSFET’s with very small physical dime!nsionr;,” IEEE J. Solid-state Circuirs,
W. S. Lee, “Threshold vclltage of short channel IGFET,” in Semi- conductor Silicon. Princ:et’on, N J : Electrochem. SOC., 1973, pp. 45-53.
V O ~ . SC-10, PI). 322-331, Oct. 1975.
V O ~ . SC-9, pp. 256-268, Ckt. 19’74.
Simulation of Impurity Freezeout Thrwgh Numerical Solution of Poisson‘s Equation with Application to
MOS Device Behavior
Abstract-Incorporation of temperature dependencies in the one- dimensional Poisson’s equation for use in numerical simulation of MOSFET threshold behavior from 350 to 50 K is discussed. Careful consideration has been given to accurate modeling of impurity freeze- out and temperature-&pendent parameters. Examples of simulation of depletion-mode MOSFET’s demonstrate the importance of proper modeling and show that impurity freezeout must be considered even at room temperature.
LIST OF SYMBOLS Cox Oxide capacitance. EA Acceptor impurity level. Ec Conduction band edge. Eo Donor impurity level. EF Fermi level. Ep,, Electron quasi-Fermi level.
Manuscript received June 19, 1979; revised November 13, 1979. R. C. Jaeger is with the Electrical Engineering Department, Auburn
F. H. Gaensslen is with the IBM Corporation, T. J. Watson Resoarch University, Auburn, AL 36830.
Center, Yorktown Heights, NY 10598.
E F ~ Hole quasi-Fermi level. E, Energy gap in silicon. Ei Intrinsic energy levltil. E , Valence band edge. es Dielectric constant !of silicon. k Boltzmann’s constant. L j Intrinsic Debye length. mc Effective mass for electrons. rn, Effective mass for holes. n Electron density. ni Intrinsic carrier density. NA Total acceptor density. N2 Ionized acceptor density. NcH Carrier concentration in channel. No Total donor density. NA Ionized donor density. p Hole density. Cp,, Metal-oxide barrier. Cpso Silicon-oxide barr:ier. \k Normalized potential. 9, Normalized surface potential.
0018-9383/80/0500-0914$00.75 0 1980 IEEE

JAEGER AND GAENSSLIEN: IMPURITY FREEZEOUT THROUGH SOLUTION OF POISSON’S EQUATION 915
q Elementary charge. Qox Oxide charge. p Space-charge density. T Absolute temperature. V, Gate-to-source voltage. V& Source-to-substrat,e voltage. V, Threshold voltage. x Distance. 4‘ Degeneracy correction factor.
I. INTRODUCTION
T HE SOLUTION of Poisson’s equation is commonly used to study the basic behavior of MOS devices [l] -[3]. In
particular, the threshold and capacitance-voltage character- istics of MOS structures; may be obtained from knowledge of the charge distribution below the gate electrode of the device. For arbitrary impurity distributions, a numerical solution of Poisson’s equation provides the most accurate and flexible method of determining the charge distribution within the semiconductor.
A one-dimensional solution of Poisson’s equation is useful in characterizing the geometry-independent behavior of the device and its operation in the subthreshold and linear regions. The same techniques are also applicable to simulation of the gate capacitance of MOS structures and Schottky-barrier de- vices. Numerical analysis of device operation in the saturation region and simulation of short- or narrow-channel effects both require more complex and expensive two-dimensional simula- tion techniques which are beyond the scope of this work.
Klopfenstein and Wu [4] have presented a detailed discus- sion of various finite-difference approximations for solving Poisson’s equation in one dimension. They have assumed full impurity ionization, and the solutions are useful mainly at room temperature and above. However, as temperature is de- creased, full ionization of impurities can no longer be as- sumed. Impurity freezeout can also occur at any temperature when band bending in the semiconductor forces the donor or acceptor impurity levels near to the Fermi level. Furthermore, at high channel concentrations, it is possible for the Fermi level to enter the conduction or valence bands, and the Boltz- mann expressions normally used for electrons and holes are no longer valid. Including these effects results in more com- plexity in the formulation and solution of Poisson’s equation. Finally, the temperature dependence of physical paraineters, including the energy gap, intrinsic carrier density, and effective masses, must also be considered.
This paper discusses the solution of Poisson’s equation in one dimension over the temperature range 50-350 K including modeling of the temperature-dependent parameters, modifica- tions of the fiite-difference approximations to Poisson’s equa- tion, and the iterative techniques used to obtain the solution. Selected simulation results illustrate the importance of correct modeling of impurity ionization even at room temperature.
11. FORMULATION OF POISSON’S EQUATION The charge distribution underneath the gate of a MOSFET is
obtained by solving Poisson’s equation for boundary condi- tions of zero electric field in the substrate and a specified po- tential at the insulator-semiconductor interface
TABLE I
JI E c J I , EQN.0 -4 - 3
1.00 1.01 1.02 1.02
-2 1.04 1.05 -I 1.12 1.12 0 1.3 I 1.27 I 1.72 2
1.6 I
3 4.45 4.14 2.61 2.40
4 8.36 8.12 5 6
16.80 17. IO 35.20 37.50
7 76.70 83.70 8 9
172.00 188.00 393.00 425.00
IO 916.00 961 .OO -
The charge density in the semiconductor is given by p(x ) = q [ p - n t N i - N i l where p and n represent the hole and electron concentrations, and N& and . N i stand for the ionized donor and acceptor impurity concentrations. The dependence of N s and N;; on temperature is modeled using Fermi-Dirac statistics with the appropriate factors for oonduction and valence-band degeneracy [ 5 ] and with the introduction of quasi-Fermi levels for electrons and holes
The concentration of electrons and holes is represented by
exp { E d }
4‘ P k T E C }
kT n = ni
exp {” i:} p = ni
in which [ is a degeneracy correction €actor. ‘The equation for [ has been obtained using a least square fit to the data of Wolf [6 ] normalized by the factor 2 / 6 .
[(x) = 1 t 0.2709 exp (0.8173~). (4)
The carrier densities using the preceding expressions are within 10 percent of those derived using Fermi-Dirac statistics for ex- cursions of the Fermi level of up to 10 kT into the conduction or valence bands as shown in Table I. This expression for [ permits closed-form evaluation of the derivatives required for the iterative numerical solutions.’
Since beginning this work we have found other approximations such as those in Blakemore, Semiconductor Statistics. New York: Pergamon, 1962, pp. 354-365.

The dependence of ni on temperature is taken from the work of Barber [7] and also requires accurate representation of the temperature dependence of the effective masses of holes and electrons and of the bandgap of silicon. The expressio:ns for EG are also taken from Barber and those for m, and m, result from the work of Bludau, Onton, and Heinke [8].
nf = 2.5 X 10'' (m,m,)o*75(T/300)1~5 exp ( - E G / ~ ~ T )
m, = 1.045 t 4.500 X T
m, =OS23 t 1.400X loa3 T - 1.480X T 2
EG = 1.170 t 1.059 X lom6 T - 6.050 X T 2 ,
T G 170K
EG = 1.179 - 9.025 X lo-' T - 3.050 X lod7 T 2 ,
T > 170 K. (5)
With the preceding substitutions, the form of Poisson's equa- tion to be solved becomes
t NA/ni
1 t 4 e x P ( EA kT - EFp )
-1
The increased complexity in the solution of (6) arises because of the variation of impurity ionization and degeneracy factor with position. The relation of the various terms of (6) to \k may be determined from Fig. 1 and the equations below.
Fig. 1. Semiconductor energy-band diagram sh.owing the relat.ionships between the various energy levels.
The Fermi level EF is cholsen as zero reference for the case of zero-substrate bias, ;and constant quasi-Fermi levels for PI and p are defined symmetrically a t + q l 5 ~ / 2 k T for the case of ap- plied substrate bias as shown in Fig. 1. The constants AEA and AE, represent the impurity ionization energies of the acceptor and donor atoms, respectively, and are taken to be 0.044, 0.045, and 0.049 eV for phosphorus, boron, and arsenic [ 13 .
111. SOLUTION OF POISSON'S EQUATION The solution of (2)-(7) is obtained by applying Newton's
method to the function
\k is adjusted iteratively until F is forced to zero. The pro- cedure for updating \k is obtained by approximating F by the first two terms of its Taylor's series
or
The numerical evaluation of (9) requires the use of a suitable discrete approximation to Poisson's equation which yields a system of M simultaneous equations where M is the number of discrete mesh points.
Our choice wals to use Stormer's method for a nonumiform mesh as discussed in detail by Klopfenstein and Wu [4]. This approximation provides reasonable accuracy and is easier to

JAEGER AND GAENSSLEN: IMPURITY FREEZEOUT THROUGH SOLUTION OF POISSON'S EQUATION 917
- NONUNIFORM MESH DETAILS
OF POINTS SPACING [XI CUM. DEPTH ral 10 10 50 10 IO 10 IO IO IO
IKPOINTS
I O 5
20
I O 0 5 0
200
1000 500
2000
50 I 5 0
I150
265 0 1650
465 0
19650 9650
TOTAL 39650 DEPTH 39650 a
Fig. 2. Definition and details of nonuniform mesh used for the numerical simulations.
implement than the Cowell method discussed in [4]. Using this approximation the discrete form of F at the j th mesh point of Fig. 2 becomes
with
EG 4 VTX - t A E t A 2 2
kT
EG -_ A E t - 2 2
kT
*Nj = - - * j
4 VSX
*pj = - t * j .
The variables QNj and \kv have been introduced for notational compactness and represent the normalized potential difference between the hole and electron quasi-Fermi levels and the valence and conduction bands, respectively. These variables also explicitly identify the various terms' dependencies on * j . Because of the spatial dependence of N; and N i and the presence of the expressions for V F become substantially more complex than for the case of constant ionization and no degeneracy
[1.8173 t ( 'PNj)- 0.81731
1 t 0.25 exp *pi - -- ( A:;)
As can be seen from the preceding equations, the matrix form for VF will be tridiagonal, and A* is easily determined by Gaussian elimination tailored specifically for the tridiagonal systems of equations [ 9 ] . The quasi-,equilib:rium solution for W, obtained by setting p ( x ) = 0, assuming full impurity ion- ization and no degeneracy, is used fOr the initial guess*' as in [4] .
Repetitive calculations at constant substrate bias which oc- cur during simulation of subthreshold. turn-on or MOS capaci- tance use the previous solution point as initial guess to reduce the number of iterations required. The boundary conditions are established by \ko = Jr, and an auxiliary mesh point at X M + ~ assuming \ kM+l = qM with hMcl = hM.
In the iteration process, the (k t 1)th estimate for W is de- termined from the kth estimate and th.e computed value of AW
q k + l =Wk +- AWk. (10)
The iterations continue until the .magnitude of F at each mesh point is less than the error criterion 6 . An error bound of 6 = has been found adequate in the present program. Once this error criterion is met, the electron ;md hole densities are checked to see if an equilibrium condition has actually been reached in the bulk. If this condition is not achieved, the depth of the device region being simulated should be in- creased and the simulation rerun using the previous solution as the initial value for Y. The iteration process is illustrated by the flow diagram of Fig. 3.
At low temperatures, it has been found that taking the full Newton step given by (10) at each Iteratiom can lead to di- vergence of the solution. To overcome this problem, the maxi- mum change in the potential * has been limited to +lo0 kT/q at each step. This bound has proved sufficient to insure con- vergence of the iteration process over the e:ntire temperature range 50-350 K with substrate voltages ranging from 0 to -6 V.
An additional numerical problem arises as temperature is re- duced. The quantities n , p , alld ni are all dependent upon terms of the form exp [EIkT] . At 50 K, kT = 0.0043 eV and the normalized energy gap is approximately 267, placing exp [EG/2kT] outside the range of most computer arithmetic. The problem is compounded in the presence of substrate bias
IEEE TRANSACTIONS ON ELECTRON DEVICES, VOL. ED-27, NO. 5 , MAY 1980
GUESS AT INITIAL 90=9s VALUE OF qi g=o x-m - CALCULATE F
CALCULATE V,
Fig. 3. Flow diagram of the program used to solve Poisson's equation.
since the pa product is depressed by the factor exp [-qVsx/kT] as seen from (3) and (7).
However, the maximum value of d2\kldx2 in typical MOS devices ranges from 10-l' to loz5 V/cm2, and the evaluation of Poisson's equation should remain well within the computer range. The use of logarithms and proper ordering of multi- plications and divisions has allowed APL and PL/I versions of the program to operate successfully down to 50 K.
Once a solution to Poisson's equation has been obtained., then the gate voltage may be determined from the potential distribution, oxide charge, and other device parameters
The surface potential may then be iteratively changed to achieve some desired condition within the device (e.g., thresh- old) [ 101 , [ 111 .
IV. APPLICATION EXAMPLES Illustrations of the use of the program to simulate the in,.
ternal behavior of MOS devices, as shown in the cross section of Fig. 4, are discussed in what follows. The 130-point non- uniform mesh detailed in Fig. 2 has been employed in the: simulations. This mesh was refined experimentally starting with a 400-point uniform mesh with 50-A spacing. The: spacing was reduced near the surface after accuracy problems: were encountered in determining the total channel carrier con- centration in the presence of a strongly inverted surface channel. Closer spacing was also introduced in the region which contains the donor and acceptor implantations to per- mit accurate calculation of channel carrier concentration when a subsurface channel exists. The original substrate depth of 2 pm was not sufficient to insure that an equilibrium condi- tion would be reached in the device bulk at high substrate biases. Consequently, the depth of simulation was extended to approximately 4 pm. The mesh spacing gradually expands in the device bulk where the gradient of the electrostatic PO-
Fig. 4. Cross section and impurity profile of the polysilicon gate, n-channel depletion-mode MOSFET used in this study.
tential is approaching zero. Excellent results have been ob- tained with this mesh for temperatures ranging from 50 to ,350 K with 0 to - 6 V substrate bias.
An APL version of the program using the preceding mesh has been used extensively. The interactive nature of APL has proved to be extremely useful in our studies of depletion- :mode MOS device behavior at low temperatures. The program uses approximately 5 s of CPU time on an IBM 370/168 to obtain a solution with V& = 0 using the equilibrium solution as the initial guess. Less time is required with better initial conditions, and slightly more time is required with nonzero substrate bias.
Fig. 5 shows the formation of the conducting region in the n-channel depletion-mode device of Fig. 4 as the gate potential changes from well below threshold to wellabove threshold at 77 K. In Fig. 5(a), the gate voltage is below threshold and the MOS device is in the subthreshold conduction region with only a small subsurface electron concentration in the channel. At the same time, the donor impurities are almost completely ionized. As the gate voltage is raised to near the threshold- voltage condition (Fig. 5(b)), the channel concentration increases, and the net impurity concentration decreases as substantial donor freezeout occurs in the channel region. Finally, with the gate voltage well above threshold in Fig. 5(c), a surface channel has formed and only 20 percent of the donor impurities remain ionized. The distribution of ionized impurities remains constant for higher gate voltages since the substrate is now shielded by the surface channel. Donor-impurity freezeout causes the depletion-mode device to have a substantially different threshold dependence on temperature than the enhancement-mode device, and a sig- nificant reduction in substrate sensitivity has also been ob- served [ 101 -[12] .
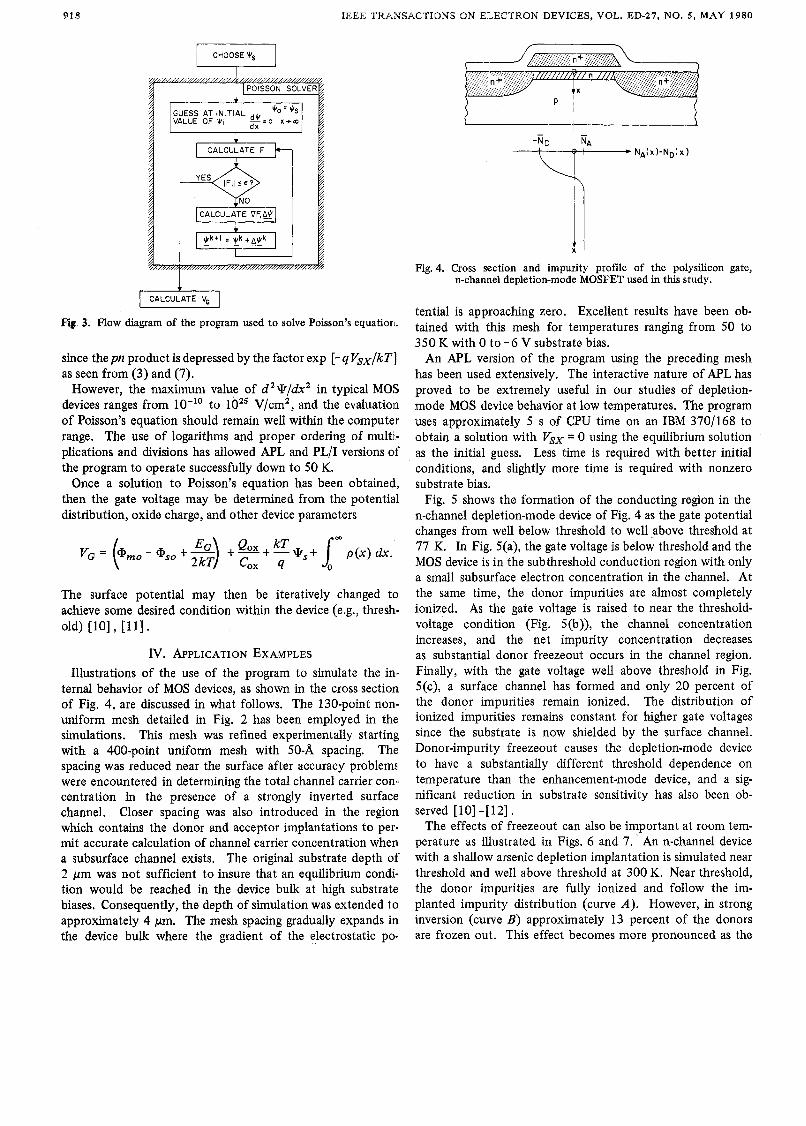
The effects of freezeout can also be important at room tem- perature as illustrated in Figs. 6 and 7. ' An n-channel device with a shallow arsenic depletion implantation is simulated near threshold and well above threshold at 300 K. Near threshold, the donor impurities are fully ionized and follow the im- planted impurity distribution (curve A). However, in strong inversion (curve B ) approximately 13 percent of the donors are frozen out. This effect becomes more pronounced as the

JAEGER AND GAENSSLEN: IMPURITY FREEZEOUT THROUGH SOLUTION OF POISSON'S EQUATION 919
Y
TlVE DONOR DOSE - - 2 O t tY
AC'
CARRIER CONC. - N ~ ~ = l x I O ~ c r n - ~
-300 -25vl 200 400 , IN CHANNEL 600 800 I 1000 1 1200 I I
I I I
-201
1 i
-. j#ff GATE VOLTAGE - V,
,&/ ACTIVE DONOR DOSE - N,C
I 1 I I I I 1 200 400 600 800 1000 1200
x (a) @)
"1 5
200 400 600 800 1000
x(a)
25
20 ACTIVE DOSE ND+ =9.3xd'crn-Z
+o 15 z
l o t \ '0 200 400 600 800 loo0 1200 1400 1600 1800
x(&)
Fig. 6. Simulations of donor-impurity freezeout at room temperature in a depletion-mode MOSFET. (d) With gate voltage near threshold, no freezeout is observed. (B) About 13 percent of the donors are frozen out at a gate voltage well above threshold.
1 '\WITH DEEP LEVEL DONOR lDOSE=9.3xIO"cm~21/
Fig. 7. Simulation of a proposed enhancement-mode MOSFET device design with deep-level donor-impurity freezeout at room tempera- ture. (a) Donor, acceptor, and net impurity densities implanted into a uniformly boron-doped silicon substrate (NA := 2.75E15/cm3). (b) Substrate sensitivities for device designs with and without deep- level donors showing the significant improvement obtained by in- corporating the deeplevel donors.
Fig. 5. Low temperature (77 IC) simulations of channel carrier concen- implanted region becomes shallower, and a Dirac distribution
trations and ionized impurity profiles under the gate with gate voltage at the interface approach total in strong as a parameter. Crosshatched areas represent the difference between inversion. the total and ionized impurity profiles. An arsenic dose of 9.3Ell/ A possible beneficial application of donor freezeout in n- cm2 was implanted into silicon with a boron background concentra- tion of 2.75E1S/cm3. The thickness ofkhe gate oxide was 250 a. channel devices is illustrated in the hypothetical device design (a) Gate voltage below threshold with a buried channel just beginning of Fig. 7. Here,. re-ionization of a frozen-out deep-level donor to form and slight donor freezeout. (b) Gate voltage near threshold species ('ED = 0.25 v) is used to obtain a substantid im- with the buried channel just reaching the surface and significant freezeout. (c) With gate well above threshold, a strong surface chan- provement in the substrate sensitivity Of the enhancement- ne1 has formed and 80 percent of the donors are frozen out. mode device. A possible candidate for the donor species in

920 IEEE TRANSACTIONS ON ELECTROX DEVICES, VOL. ED-27, M3. 5, MAY 1980
this device would be tellurium [13]. The mechanism behind this effect has been discussed in detail in [ 111, [ 121.
Freezeout in both the preceding examples occurs as the con- duction band and donor energy levels move near to the Fermi level and is a function of gate and substrate potential. Thus freezeout should be considered even in models used at room temperature and above. A more detailed discussion of these results is beyond the scope of this paper and may be found in [lo]-[12].
V. SUMMARY AND CONCLUSIONS A method for solving the one-dimensional Poisson’s equa-
tion over the temperature range 50 to 350 K has been pre- sented. Modeling of temperature-dependent parameters has been discussed as well as the iterative techniques used to ob- tain the numerical solutions. Results have been presented which iuustrate the importance of the correct modeling of im- purity freezeout even at room temperature.
The computer model has proved to be a very important tool for the study of MOS device behavior. However, the one- dimensional program is adequate for modeling the device only in its linear region. Measurements indicate that impurity ion- ization is apparently not a function of channel geometry when temperature-dependent threshold variation is taken into con- sideration [ 141 . An understanding of these observations may require the use of a two-dimensional program to model the geometry-related effects of impurity freezeout. The present work will be of significant value in the development of such a simulation tool.
RI3FERfiI\.<!I<S
S. M. Sze, k’hysicr &of Selnb?ondu,:tcv Devices. ‘New York: Wile:,, 1969. R. S. Cobbold, i%eory and Application of Field Efyect Tran- sistors. New York: Wiley, 1970. P. Richman, MOS Field .Effc’ct !Transistors and Integrated a r - cuits. New York: Wiley, 1973. R. W. Klopfenstein and C. P. Wu, “Computer solution of one- dimensional Poisson’s equation,” lEEE Trans. Electron Device,s, vol. ED-22, no. 6, pp. 329-333, June 1975. K. B. Wolfstirn, “Hole and electron mobilities in doped silicon from radiochemical and conductivity measurements,”’ Phys. Chem. Solids, vol. 16, pp. 279-2:34:, 1960. H. F. Wolf, Semiconductors. New York: Wiley, 1971, c:hs. 1 4 . H. D. Barber, “Effective mass and intrinsic concentr,ation .in silicon,” Solid-state Electron., vol. 10, no. 11, pp. 1039-1051, Nov. 1967. W. Bludau, A. Onton, alnd W. Heinke, “Temperature dependence of the bandgap of siliclon,” J. ,4ppl. Phys., vol. 45, no. 4, pp. 1846-1848, Apr. 1974. H. B. KeUer, Numerical Methodz; fiw Two-Point Boundary Value Problems. Waltham, MA: Blaisdell, 1968. F. H. Gaensslen and R. C. Jaeger:, “Low temperature th.reshold behavior of depletion m(ode devices;-Characterization and simula- tion,” in 1977 IEDM Dig., pp. 520-524.
mode devices-Characterization and simulation,”Solid-Stafe Elec- tron., vol. 22, no. 4, pp. 423-430, Apr. 1979. R. C. Jaeger and F. H. [Gaensslen, “Simple analytical models for the temperature depend’ent threshold behavior of depletion mode devices,” IEEE Trans. Electron D,evices (Joint Special Issue on VLSI), vol. ED-26, no. ‘4, pp. 501-508, Apr. 1979: also IEEE J. Solid-state circuits, vol. SC-14, no. 2, pp, 423-430, Apr. 11979. B. L. Crowder, private communication. F. H. Gaensslen and R. C. Jaeger, “Behavior of electrically small depletion mode MOSFETs at low temperature,” to be published.
- , “Temperature dependent threshold behavior of depletion