Embed Size (px)
Citation preview
Simulation of Ground-Water Flow and Evaluation of Water-Management Alternatives in the Assabet River Basin, Eastern Massachusetts
By Leslie A. DeSimone
Abstract
Water-supply withdrawals and wastewater disposal in the Assabet River Basin in eastern Massachusetts alter the flow and water quality in the basin. Wastewater discharges and stream-flow depletion from ground-water withdrawals adversely affect water quality in the Assabet River, especially during low-flow months (late summer) and in headwater areas. Streamflow depletion also contributes to loss of aquatic habitat in tributaries to the river. In 1997–2001, water-supply withdrawals averaged 9.9 million gallons per day (Mgal/d). Wastewater discharges to the Assabet River averaged 11 Mgal/d and included about 5.4 Mgal/d that originated from sources outside of the basin. The effects of current (2004) and future withdrawals and discharges on water resources in the basin were investigated in this study.
Steady-state and transient ground-water-flow models were developed, by using MODFLOW-2000, to simulate flow in the surficial glacial deposits and underlying crystalline bedrock in the basin. The transient model simulated the average annual cycle at dynamic equilibrium in monthly intervals. The models were calibrated to 1997–2001 conditions of water withdrawals, wastewater discharges, water levels, and nonstorm streamflow (base flow plus wastewater discharges). Total flow through the simulated hydrologic system averaged 195 Mgal/d annually. Recharge from precipitation and ground-water discharge to streams were the dominant inflow and outflow, respectively. Evapotranspiration of ground water from wetlands and non-wetland areas also were important losses from the hydrologic system. Water-supply withdrawals and infiltration to sewers averaged 5 and 1.3 percent, respectively, of total annual out-flows and were larger components (12 percent in September) of the hydrologic system during low-flow months. Water budgets for individual tributary and main stem subbasins identified areas, such as the Fort Meadow Brook and the Assabet Main Stem Upper subbasins, where flows resulting from anthropo-genic activities were relatively large percentages, compared to other subbasins, (more than 20 percent in September) of total out-flows. Wastewater flows in the Assabet River accounted for 55, 32, and 20 percent of total nonstorm streamflow (base flow
plus wastewater discharge) out of the Assabet Main Stem Upper, Middle, and Lower subbasins, respectively, in an average September.
The ground-water-flow models were used to evaluate water-management alternatives by simulating hypothetical scenarios of altered withdrawals and discharges. A scenario that included no water management quantified nonstorm stream-flows that would result without withdrawals, discharges, septic-system return flow, or consumptive use. Tributary flows in this scenario increased in most subbasins by 2 to 44 percent relative to 1997–2001 conditions. The increases resulted mostly from variable combinations of decreased withdrawals and decreased infiltration to sewers. Average annual nonstorm streamflow in the Assabet River decreased slightly in this scenario, by 2 to 3 percent annually, because gains in ground-water discharge were offset by the elimination of wastewater discharges.
A second scenario quantified the effects of increasing withdrawals and discharges to currently permitted levels. In this simulation, average annual tributary flows decreased in most subbasins, by less than 1 to 10 percent relative to 1997–2001 conditions. In the Assabet River, flows increased slightly, 1 to 5 percent annually, and the percentage of wastewater in the river increased to 69, 42, and 27 percent of total nonstorm streamflow out of the Assabet Main Stem Upper, Middle, and Lower subbasins, respectively, in an average September.
A third set of scenarios quantified the effects of ground-water discharge of wastewater at four hypothetical sites, while maintaining 1997–2000 wastewater discharges to the Assabet River. Wastewater, discharged at a constant rate that varied among sites from 0.3 to 1.5 Mgal/d, increased nonstorm streamflow in the tributaries adjacent to the sites and in down-stream reaches of the Assabet River. During low-flow months, flow increases in tributaries were less than the constant dis-charge rate because of storage effects and increased ground-water evapotranspiration. Average September flows, however, more than doubled in these scenarios relative to simulated 1997–2001 conditions in Fort Meadow, Taylor, Cold Harbor, and Stirrup Brooks. Increases in Assabet River flows were small, with reductions in the wastewater component of flow in September of 5 percent or less.
2 Simulation of Ground-Water Flow and Evaluation of Water-Management Alternatives in the Assabet River Basin, Eastern MA
Simulation-optimization analysis was applied to the upper part of the basin to determine whether streamflow depletion could be reduced, relative to 1997–2001 conditions, by management of monthly withdrawals, with and without ground-water discharge. The analysis included existing supply wells, one new well (in use since 2001), and a hypothetical discharge site in the town of Westborough. Without ground-water discharge, simulated nonstorm streamflow in September in the Assabet River about doubled at the outlet of the Main Stem Headwaters subbasin and increased by about 4 percent at the outlet of the Main Stem Upper subbasin. These increases were obtained by using water-supply sources upstream of lakes, which appeared to buffer the temporal effect of withdrawals, in low-flow months, and by using water-supply sources adjacent to streams, which immediately affected flows, in high-flow months. With ground-water discharge, simulated flows nearly tripled at the outlet of the Assabet Main Stem Headwaters subbasin, increased by 18 percent at the outlet of the main stem Upper subbasin, and more than doubled in a tributary stream. The general principles illustrated in the simulation-optimization analysis could be applied in other areas of the basin where streamflow depletion is of concern.
Introduction
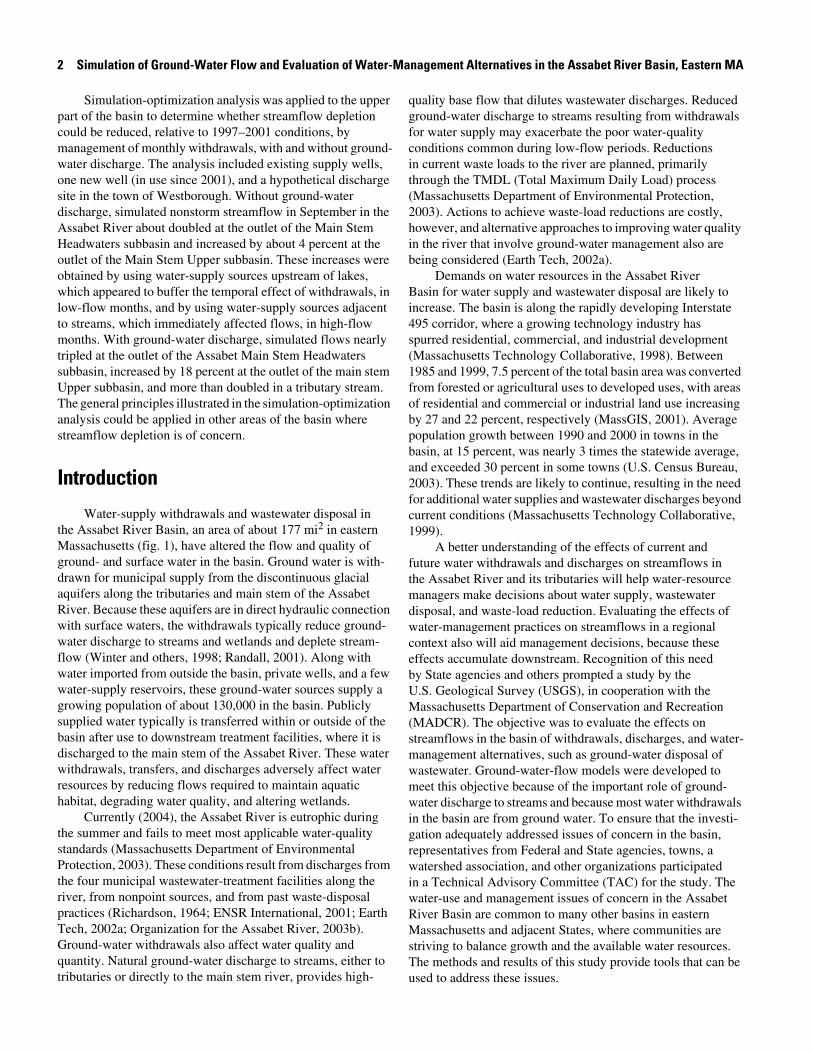
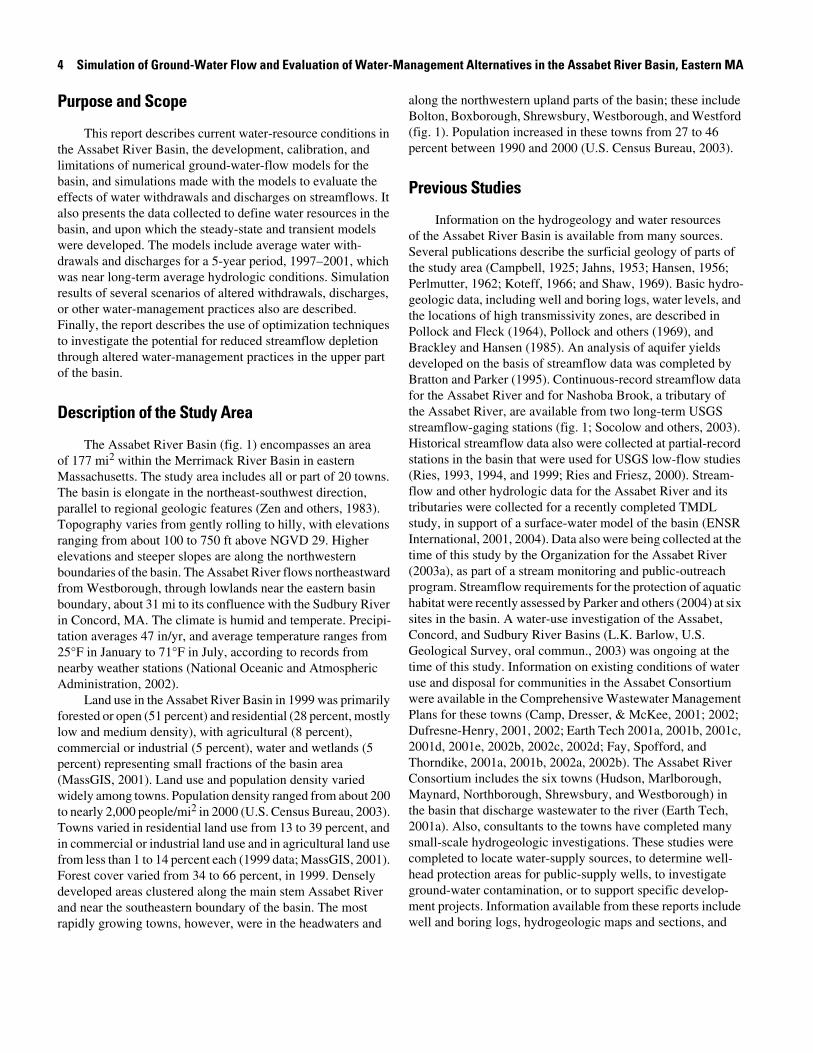
Water-supply withdrawals and wastewater disposal in the Assabet River Basin, an area of about 177 mi2 in eastern Massachusetts (fig. 1), have altered the flow and quality of ground- and surface water in the basin. Ground water is with-drawn for municipal supply from the discontinuous glacial aquifers along the tributaries and main stem of the Assabet River. Because these aquifers are in direct hydraulic connection with surface waters, the withdrawals typically reduce ground-water discharge to streams and wetlands and deplete stream-flow (Winter and others, 1998; Randall, 2001). Along with water imported from outside the basin, private wells, and a few water-supply reservoirs, these ground-water sources supply a growing population of about 130,000 in the basin. Publicly supplied water typically is transferred within or outside of the basin after use to downstream treatment facilities, where it is discharged to the main stem of the Assabet River. These water withdrawals, transfers, and discharges adversely affect water resources by reducing flows required to maintain aquatic habitat, degrading water quality, and altering wetlands.
Currently (2004), the Assabet River is eutrophic during the summer and fails to meet most applicable water-quality standards (Massachusetts Department of Environmental Protection, 2003). These conditions result from discharges from the four municipal wastewater-treatment facilities along the river, from nonpoint sources, and from past waste-disposal practices (Richardson, 1964; ENSR International, 2001; Earth Tech, 2002a; Organization for the Assabet River, 2003b). Ground-water withdrawals also affect water quality and quantity. Natural ground-water discharge to streams, either to tributaries or directly to the main stem river, provides high-
quality base flow that dilutes wastewater discharges. Reduced ground-water discharge to streams resulting from withdrawals for water supply may exacerbate the poor water-quality conditions common during low-flow periods. Reductions in current waste loads to the river are planned, primarily through the TMDL (Total Maximum Daily Load) process (Massachusetts Department of Environmental Protection, 2003). Actions to achieve waste-load reductions are costly, however, and alternative approaches to improving water quality in the river that involve ground-water management also are being considered (Earth Tech, 2002a).
Demands on water resources in the Assabet River Basin for water supply and wastewater disposal are likely to increase. The basin is along the rapidly developing Interstate 495 corridor, where a growing technology industry has spurred residential, commercial, and industrial development (Massachusetts Technology Collaborative, 1998). Between 1985 and 1999, 7.5 percent of the total basin area was converted from forested or agricultural uses to developed uses, with areas of residential and commercial or industrial land use increasing by 27 and 22 percent, respectively (MassGIS, 2001). Average population growth between 1990 and 2000 in towns in the basin, at 15 percent, was nearly 3 times the statewide average, and exceeded 30 percent in some towns (U.S. Census Bureau, 2003). These trends are likely to continue, resulting in the need for additional water supplies and wastewater discharges beyond current conditions (Massachusetts Technology Collaborative, 1999).
A better understanding of the effects of current and future water withdrawals and discharges on streamflows in the Assabet River and its tributaries will help water-resource managers make decisions about water supply, wastewater disposal, and waste-load reduction. Evaluating the effects of water-management practices on streamflows in a regional context also will aid management decisions, because these effects accumulate downstream. Recognition of this need by State agencies and others prompted a study by the U.S. Geological Survey (USGS), in cooperation with the Massachusetts Department of Conservation and Recreation (MADCR). The objective was to evaluate the effects on streamflows in the basin of withdrawals, discharges, and water-management alternatives, such as ground-water disposal of wastewater. Ground-water-flow models were developed to meet this objective because of the important role of ground-water discharge to streams and because most water withdrawals in the basin are from ground water. To ensure that the investi-gation adequately addressed issues of concern in the basin, representatives from Federal and State agencies, towns, a watershed association, and other organizations participated in a Technical Advisory Committee (TAC) for the study. The water-use and management issues of concern in the Assabet River Basin are common to many other basins in eastern Massachusetts and adjacent States, where communities are striving to balance growth and the available water resources. The methods and results of this study provide tools that can be used to address these issues.
Introduction 3
BO
YLS
TON
MARLBOROUGH
NORTHBROOKSUBBASIN
COLD HARBOR AND HOWARDBROOKSSUBBASIN
HOPBROOKSUBBASIN
ASSABET MAIN STEM HEADWATERSSUBBASIN
ASSABET MAIN STEMMIDDLE SUBBASIN
DANFORTHBROOKSUBBASIN
ELIZABETHBROOKSUBBASIN
FORT POND BROOKSUBBASIN
TAYLOR BROOKSUBBASIN
SPENCER BROOKSUBBASIN
NASHOBA BROOKSUBBASIN
ASSABET MAIN STEMLOWER SUBBASIN
ASSABET MAIN STEMUPPER SUBBASIN
STIRRUP BROOK SUBBASIN
EXPLANATION
0 1 2 3 4 5 MILES
0 2 KILOMETERS41 3 5From USGS and MassGIS data sources, Massachusetts State Plane Coordinate System, Mainland Zone.
01097000
ACW158
POND
WETLAND
BASIN AND SUBBASIN BOUNDARY
TOWN BOUNDARY
STREAM-GAGING STATION AND NUMBER
LONG-TERM OBSERVATION WELL AND IDENTIFIER
DAM
FORT MEADOW BROOKSUBBASIN
495
290
495
2
01097000
01097300
ACW158
A1A1ImpoundmnetImpoundmnet
Chauncy LakeChauncy Lake
LakeLakeBoonBoon
WhiteWhitePondPond
Warner Warner PondPond
NagogNagogPondPond
Little Chauncy LakeLittle Chauncy Lake
Bartlett PondBartlett Pond
LakeLakeWilliamsWilliams
Fort MeadowFort MeadowResevoirResevoir
Millham Millham ResevoirResevoirRockyRocky
PondPond
DelaneyDelaneyPondPond
LongLongPondPond
FortFortPondPond
GatesGatesPondPond
Hop Brook
Hop Brook
Cold H
arbo
r
Cold H
arbo
r
Brook
Brook
Howard Brook
Howard Brook
North Brook
North Brook
Stirrup Brook
Stirrup Brook
Fort Pond Brook
Fort Pond Brook
Spencer Brook
DanforthBrook
As
sabet River
Assabe
t Riv
er
Nashoba
Brook
A1Impoundment
Chauncy Lake
LakeBoon
WhitePond
Warner Pond
NagogPond
Little Chauncy Lake
Bartlett Pond
LakeWilliams
Fort MeadowReservoir
Millham ReservoirRocky
Pond
DelaneyPond
LongPond
FortPond
GatesPond
Hop Brook
Cold H
arbo
r
Brook
Howard Brook
North Brook
Stirrup Brook
Fort Pond Brook
Spencer Brook
DanforthBrook
As
sabet River
Assabe
t Riv
er
Nashoba
Brook
ElizabethBrook
71o36'
71o24'
42o18'
42o24'
42o30'
42o30'
73o00' 72o00'
71o00'
70o00'
41o30'
STUDY BASIN
0 10 20 30 40 50 KILOMETERS
0 10 20 30 40 50 MILES
BASIN BOUNDARIES
MA
SSACH
USE
TTS
BAYA TLANTIC
OC
EA
N
EXPLANATION
MASSACHUSETTS
Figure 1. The Assabet River Basin, subbasins, streamflow-gaging stations, and long-term observation well, eastern Massachusetts.
4 Simulation of Ground-Water Flow and Evaluation of Water-Management Alternatives in the Assabet River Basin, Eastern MA
Purpose and Scope
This report describes current water-resource conditions in the Assabet River Basin, the development, calibration, and limitations of numerical ground-water-flow models for the basin, and simulations made with the models to evaluate the effects of water withdrawals and discharges on streamflows. It also presents the data collected to define water resources in the basin, and upon which the steady-state and transient models were developed. The models include average water with-drawals and discharges for a 5-year period, 1997–2001, which was near long-term average hydrologic conditions. Simulation results of several scenarios of altered withdrawals, discharges, or other water-management practices also are described. Finally, the report describes the use of optimization techniques to investigate the potential for reduced streamflow depletion through altered water-management practices in the upper part of the basin.
Description of the Study Area
The Assabet River Basin (fig. 1) encompasses an area of 177 mi2 within the Merrimack River Basin in eastern Massachusetts. The study area includes all or part of 20 towns. The basin is elongate in the northeast-southwest direction, parallel to regional geologic features (Zen and others, 1983). Topography varies from gently rolling to hilly, with elevations ranging from about 100 to 750 ft above NGVD 29. Higher elevations and steeper slopes are along the northwestern boundaries of the basin. The Assabet River flows northeastward from Westborough, through lowlands near the eastern basin boundary, about 31 mi to its confluence with the Sudbury River in Concord, MA. The climate is humid and temperate. Precipi-tation averages 47 in/yr, and average temperature ranges from 25°F in January to 71°F in July, according to records from nearby weather stations (National Oceanic and Atmospheric Administration, 2002).
Land use in the Assabet River Basin in 1999 was primarily forested or open (51 percent) and residential (28 percent, mostly low and medium density), with agricultural (8 percent), commercial or industrial (5 percent), water and wetlands (5 percent) representing small fractions of the basin area (MassGIS, 2001). Land use and population density varied widely among towns. Population density ranged from about 200 to nearly 2,000 people/mi2 in 2000 (U.S. Census Bureau, 2003). Towns varied in residential land use from 13 to 39 percent, and in commercial or industrial land use and in agricultural land use from less than 1 to 14 percent each (1999 data; MassGIS, 2001). Forest cover varied from 34 to 66 percent, in 1999. Densely developed areas clustered along the main stem Assabet River and near the southeastern boundary of the basin. The most rapidly growing towns, however, were in the headwaters and
along the northwestern upland parts of the basin; these include Bolton, Boxborough, Shrewsbury, Westborough, and Westford (fig. 1). Population increased in these towns from 27 to 46 percent between 1990 and 2000 (U.S. Census Bureau, 2003).
Previous Studies
Information on the hydrogeology and water resources of the Assabet River Basin is available from many sources. Several publications describe the surficial geology of parts of the study area (Campbell, 1925; Jahns, 1953; Hansen, 1956; Perlmutter, 1962; Koteff, 1966; and Shaw, 1969). Basic hydro-geologic data, including well and boring logs, water levels, and the locations of high transmissivity zones, are described in Pollock and Fleck (1964), Pollock and others (1969), and Brackley and Hansen (1985). An analysis of aquifer yields developed on the basis of streamflow data was completed by Bratton and Parker (1995). Continuous-record streamflow data for the Assabet River and for Nashoba Brook, a tributary of the Assabet River, are available from two long-term USGS streamflow-gaging stations (fig. 1; Socolow and others, 2003). Historical streamflow data also were collected at partial-record stations in the basin that were used for USGS low-flow studies (Ries, 1993, 1994, and 1999; Ries and Friesz, 2000). Stream-flow and other hydrologic data for the Assabet River and its tributaries were collected for a recently completed TMDL study, in support of a surface-water model of the basin (ENSR International, 2001, 2004). Data also were being collected at the time of this study by the Organization for the Assabet River (2003a), as part of a stream monitoring and public-outreach program. Streamflow requirements for the protection of aquatic habitat were recently assessed by Parker and others (2004) at six sites in the basin. A water-use investigation of the Assabet, Concord, and Sudbury River Basins (L.K. Barlow, U.S. Geological Survey, oral commun., 2003) was ongoing at the time of this study. Information on existing conditions of water use and disposal for communities in the Assabet Consortium were available in the Comprehensive Wastewater Management Plans for these towns (Camp, Dresser, & McKee, 2001; 2002; Dufresne-Henry, 2001, 2002; Earth Tech 2001a, 2001b, 2001c, 2001d, 2001e, 2002b, 2002c, 2002d; Fay, Spofford, and Thorndike, 2001a, 2001b, 2002a, 2002b). The Assabet River Consortium includes the six towns (Hudson, Marlborough, Maynard, Northborough, Shrewsbury, and Westborough) in the basin that discharge wastewater to the river (Earth Tech, 2001a). Also, consultants to the towns have completed many small-scale hydrogeologic investigations. These studies were completed to locate water-supply sources, to determine well-head protection areas for public-supply wells, to investigate ground-water contamination, or to support specific develop-ment projects. Information available from these reports include well and boring logs, hydrogeologic maps and sections, and
Ground- and Surface-Water Resources 5
results of aquifer tests and numerical simulations. Consultant reports used in this study include ABB Environmental Services (1996), Camp, Dresser, & McKee (1990), Dufresne-Henry (1981, 1989, 1993, 1996, 1999), Earth Tech (2000a, 2000b, 2000c, 2000d, 2000e), Ecology and Environment (1994), Epsilon Associates (2000, 2002a, 2002b), Geologic Services Corporation (1984, 1985, 1987, 1989, 1995a, 1995b, 1996, 2000), GeoScience Consultants (1988), GeoTrans (2001), Goldberg-Zoino & Associates (1985), Goldberg, Zoino, Dunnicliff & Associates (1980a, 1980b), HMM Associates (1987), Keystone Environmental Resources (1991), McCulley, Frick, & Gilman (1997), Metcalf & Eddy (1994), Rizzo Associates (1990), Sasaki Associates (1989), Weston & Sampson Engineers (1997), and Whitman & Howard (1986, 1987a, 1987b, 1987c).
Ground- and Surface-Water Resources
Many factors affect water resources in the Assabet River Basin. Ground-water flow is influenced by the hydraulic properties of the geologic units in which it occurs and the timing and quantity of recharge. Impoundments, ponds, and wetlands, as well as climate and topography, affect surface-water flow. Ground-water- and surface-water-flow systems are in close hydraulic connection, especially in the surficial geologic materials.
Geologic Setting
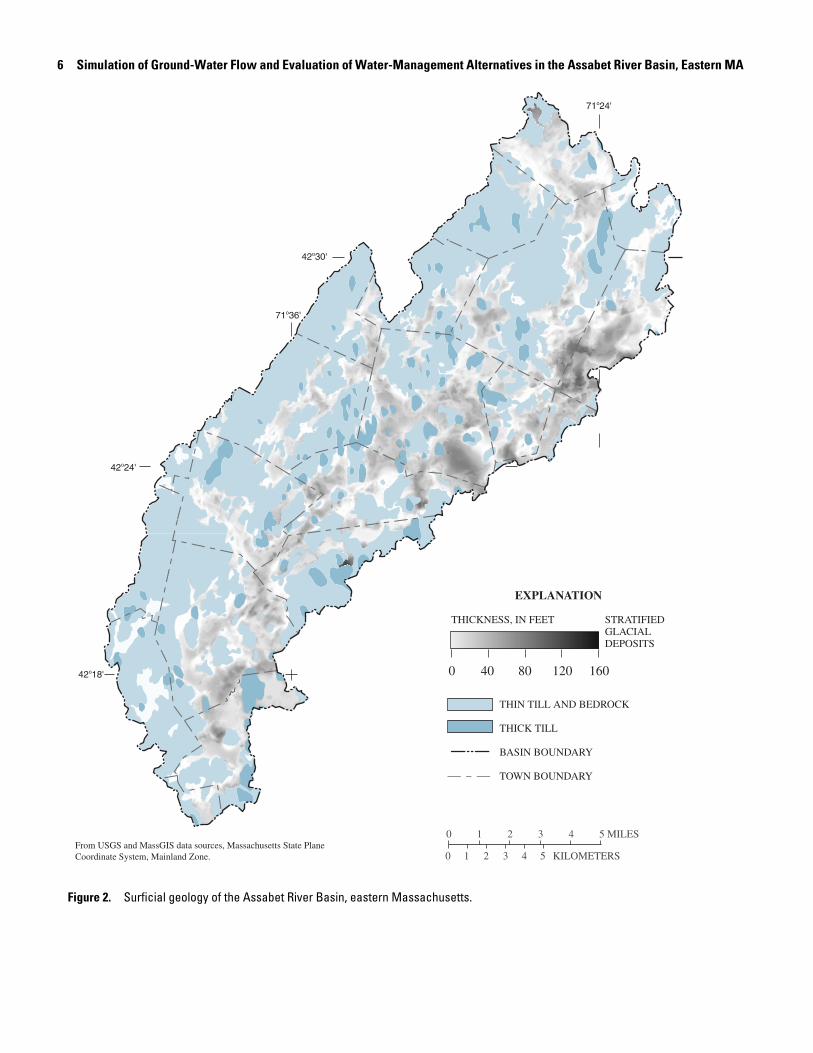
Ground water occurs in three major geologic units in the Assabet River Basin—stratified glacial deposits, glacial till, and bedrock (fig. 2). The stratified glacial deposits consist of sorted and layered sand, gravel, silt, and clay deposited by meltwater in streams or lakes in valleys and lowlands during the last glacial period. The till is generally an unsorted, unstratified mixture of clay, silt, sand, gravel, cobbles, and boulders, deposited directly by the glacial ice. Locally, till forms thick deposits in uplands or in areas of stratified glacial deposits and covers uplands in a thin layer. Crystalline bedrock underlies the stratified glacial deposits and till, and consists primarily of metasedimentary, metavolcanic, and metaintrusive rocks (Zen and others, 1983). Alluvium and swamp deposits are relatively minor components of the hydrogeologic system in the basin, and are not areally extensive and (or) form relatively thin surficial layers.
Although the stratified glacial deposits are discontinuous and heterogeneous, they are the most productive aquifers in the basin. They occur along the Assabet River and its major
tributaries and cover about 43 percent of the study area (fig. 2). The areal extent of stratified glacial deposits in the basin was determined from published and unpublished surficial geologic maps (J.R. Stone, U.S. Geological Survey, written commun., 2002). The thickness of the stratified glacial deposits was mapped by contouring the elevation of the underlying bedrock or till surface (J.R. Stone, U.S. Geological Survey, written commun., 2002) and subtracting that elevation from the land-surface elevation. Data on depth to bedrock, till, or drilling refusal were obtained from about 830 well logs or borings, available from USGS files, from the reports by private consultants cited previously, and from wells installed during this study. The thickness of the stratified glacial deposits ranges from 0 at its edges to about 160 ft (fig. 2). Typically, the deposits are less than 75 ft thick, and average only about 35 ft thick throughout the mapped area. Stratified glacial deposits are relatively thick in southeastern Stow, where a bedrock valley may represent the preglacial route of the Assabet River (Hansen, 1956; Perlmutter, 1962), and in Concord and southeastern Acton (fig. 2).
The stratified glacial deposits in the Assabet River Basin were deposited during successive pauses of the retreating ice margin in association with two meltwater lakes, glacial Lakes Assabet and Sudbury (Campbell, 1925; Hansen, 1956; Koteff, 1966; J.R. Stone, U.S. Geological Survey, oral commun., 2002). They include glacial stream, deltaic, and lake-bottom deposits. Distinct sequences of these units, as have been identified elsewhere in New England (Stone and others, 1998; Randall, 2001), have not been identified in the Assabet River Basin, and geologic mapping has not distinguished sediment packages based on lithology or depositional setting. Ice-contact deposits, variable in thickness, grain size, and sorting, are common throughout the basin. These stratified glacial deposits are characteristic of the low-relief, narrow valleys in southern New England (Randall, 2001). The areas of thick stratified glacial deposits in southeastern Stow and Concord, mapped as outwash plain and delta deposits, include sediments that were deposited farther from the ice margin and are better sorted than the more proximal ice-contact deposits (Hansen, 1956; Koteff, 1963). Also, near the Assabet River from Stow to Concord, thick layers of fine sand, silt, and clay underlie coarser-grained sediments. Fine-grained sediments also occur at depth farther south in Northborough and Westborough; fine-over-coarse sequences also are common in Westborough. These fine-grained sediments probably are lake-bottom sediments (Koteff, 1963); their distribution, however, is discontinuous. In areas of coarse-grained deposits, depressions left by melting ice blocks are common and often are occupied by kettle lakes or isolated wetlands.
6 Simulation of Ground-Water Flow and Evaluation of Water-Management Alternatives in the Assabet River Basin, Eastern MA
EXPLANATION
STRATIFIED GLACIALDEPOSITS
THICKNESS, IN FEET
0 40 80 120 160
THIN TILL AND BEDROCK
THICK TILL
BASIN BOUNDARY
TOWN BOUNDARY
0 1 2 3 4 5 MILES
0 2 KILOMETERS41 3 5From USGS and MassGIS data sources, Massachusetts State Plane Coordinate System, Mainland Zone.
71o36'
71o24'
42o18'
42o24'
42o30'
Figure 2. Surficial geology of the Assabet River Basin, eastern Massachusetts.
Ground- and Surface-Water Resources 7
Till in the Assabet River Basin consists of a thin upper till and a discontinuous, thick lower till. The upper or younger till forms a thin surficial layer over bedrock throughout the basin. The till is loosely consolidated, relatively permeable, character-ized by abundant boulders, and typically 10 to 15 ft thick or less (Campbell, 1925; Jahns, 1953; Hansen, 1956; Koteff, 1966). The lower or older till forms hills with deposits that often are 50 to 80 ft thick, and may exceed 100 or 200 ft thick. The thick lower till is compacted tightly and relatively impermeable. Hills of thick till (drumlins) are rounded and commonly elongate in the north-south direction, parallel to the direction of regional ice flow. Because of its low transmissivity, till rarely is used for water supply in the basin, even by domestic water users.
Bedrock consists of Proterozoic or Lower Paleozoic metasedimentary, metavolcanic, and intrusive igneous rocks, including the Nashoba Formation, Andover Granite, and Marlboro Formation (Zen and others, 1983; Goldsmith, 1991a). Typical rock types are mica schist and gneiss, granite, diorite, and amphibolite. The basin lies in a structural zone between two major fault zones, which trend northeast-southwest across the State. Within this zone, beds dip steeply and faulting is pervasive and complex (Goldsmith, 1991b; Walsh, 2001). Two regional faults within the basin, the Assabet River and Spencer Brook faults, extend northeast-southwest from Northborough to West Concord. Faults and joints are important hydrologically, because most water in bedrock is stored and flows in these openings; the unbroken rock is nearly impermeable.
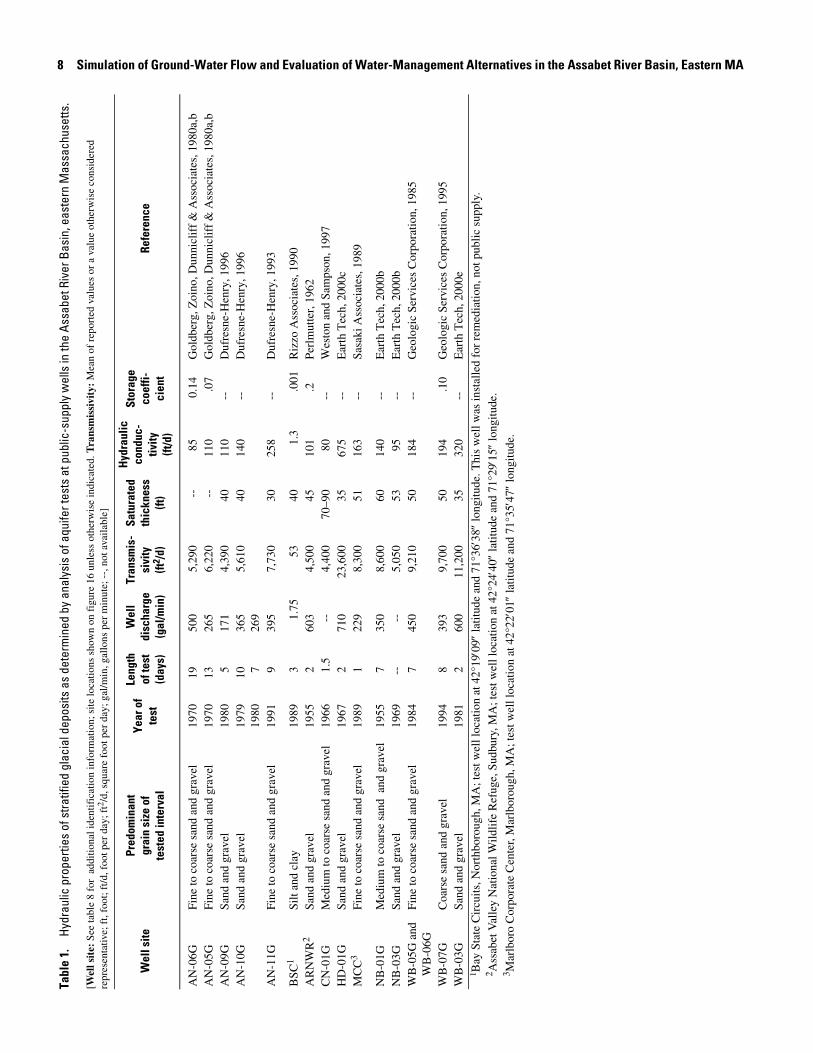
Hydraulic Properties
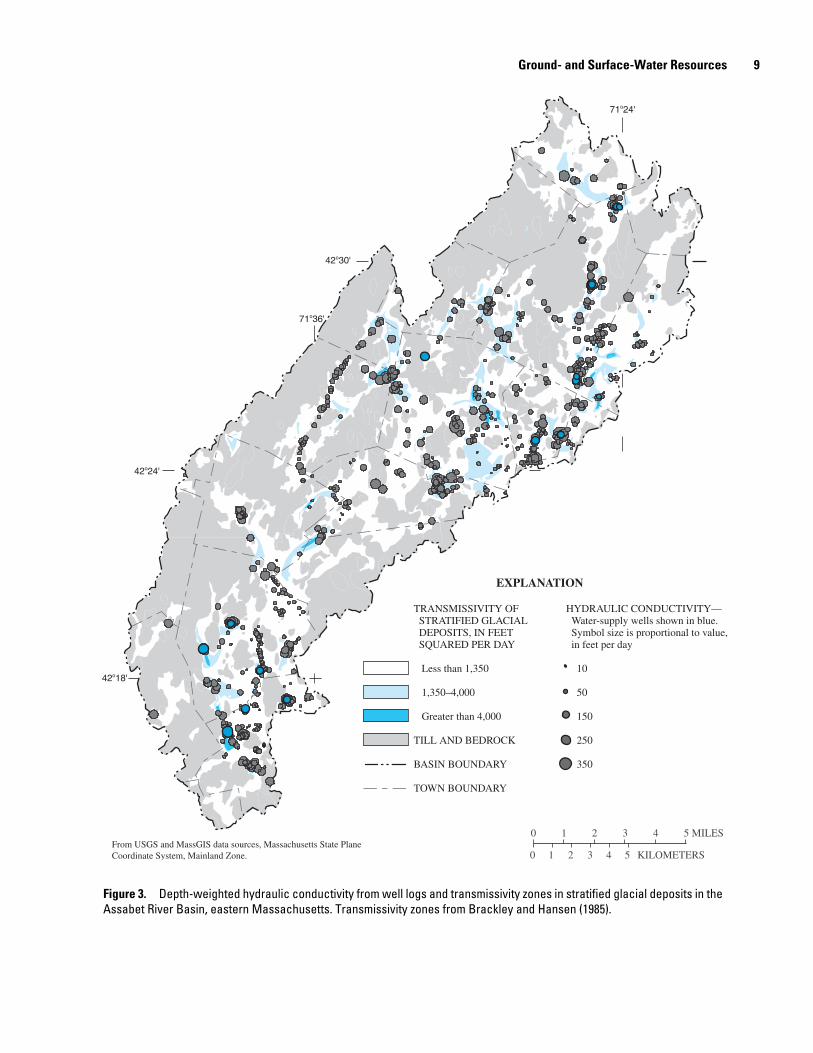
Information about the hydraulic properties of hydrogeo-logic units in the basin is most readily available for the stratified glacial deposits than for the other geologic units, because large water supplies commonly are developed in these deposits. Horizontal hydraulic conductivity values at public-supply wells, determined from analysis of aquifer tests, averaged about 190 ft/d (median value equal to 140 ft/d) and ranged from 80 to 675 ft/d (table 1). These values likely represent the most permeable and most productive deposits in the basin. Well logs, distributed throughout the stratified glacial deposits, are another source of information about hydraulic properties of sediments. Brackley and Hansen (1985) used horizontal hydraulic conduc-tivity values estimated from well logs, along with other data, to map transmissivity (hydraulic conductivity multiplied by aquifer thickness) in the basin. The estimates were based on values for sediments of various grain size and sorting in New England, compiled from aquifer tests and other sources (B.P. Hansen, U.S. Geological Survey, oral commun., 2002). The
values determined by Brackley and Hansen (1985), and similar values calculated for well logs inventoried in this study, were used to characterize horizontal hydraulic conductivity in the stratified glacial deposits (fig. 3). Spatially, hydraulic conduc-tivity values from well logs and aquifer tests are variable, which reflects the vertical and horizontal heterogeneity of sediment characteristics (for well logs) because the values are depth-weighted averages. Hydraulic conductivity values, however, were significantly different among the mapped transmissivity zones, with geometric mean values of 46, 72, and 108 ft/d for low-, medium-, and high-transmissivity zones, respectively.
Little information about vertical hydraulic conductivity is available for stratified glacial deposits in the study area, but values can be estimated from reported ratios of vertical to horizontal conductivity. Reported ratios range from 1:3 to 1:5, for coarse-grained stratified glacial deposits, and from 1:30 to 1:100, for fine-grained deposits (Dickerman and others, 1990; Masterson and Barlow, 1997; Masterson and others, 1998; Stone and Dickerman, 2002). Reported values of specific yield, or unconfined storage coefficient, of stratified glacial deposits ranges from 0.16 to 0.47, with typical values of 0.25 to 0.33 for medium to coarse sand and gravel, 0.21 to 0.33 for fine sand, and 0.02 to 0.08 for silt and clay (Johnson, 1967; Morris and Johnson, 1967; Moench and others, 2000; Kontis and others, in press). Storage coefficients from aquifer tests in coarse-grained deposits in the basin range from 0.07 to 0.14 (table 1); these values may be representative of short-term aquifer responses to stress. Less information is available for confined storage coeffi-cient for stratified glacial deposits than for specific yield. Typical values of specific storage are 1×10⁻⁴ ft-1 for fine-grained deposits and 1×10⁻⁶ ft-1 for coarse-grained deposits in the glaciated northeastern United States (Kontis and others, in press); these values would need to be multiplied by aquifer thickness to determine the storage coefficient.
Hydraulic properties of till are not well known. Horizontal hydraulic conductivity of till in the study area probably ranges from 0.01 to 10 ft/d (Allen and others, 1963; Randall and others, 1988; Melvin and others, 1992; Tiedeman and others, 1997; Lyford and others, 2003; Kontis and others, in press), with the thin till at the upper end of the reported range. The ratio of vertical to horizontal hydraulic conductivity may range from 1:1 to 1:100. The vertical hydraulic conductivity of thin surficial deposits, consisting of lake-bottom silt, fine sand, and thin till, as determined from an aquifer test for municipal supply wells in Maynard, ranges from 0.13 to 1.35 ft/d, averaging 0.48 ft/d (Lyford and others, 2003). Specific yield values of 0.06 to 0.26 have been reported for silty and sandy till (Allen and others, 1963; Morris and Johnson, 1967).
8 Simulation of Ground-Water Flow and Evaluation of Water-Management Alternatives in the Assabet River Basin, Eastern MA
1 Bay
Sta
te C
ircu
its, N
orth
boro
ugh,
MA
; tes
t wel
l loc
atio
n at
42°
19′0
9″ la
titud
e an
d 71
°36′
38″
long
itude
. Thi
s w
ell w
as in
stal
led
for
rem
edia
tion,
not
pub
lic
supp
ly.
2 Ass
abet
Val
ley
Nat
iona
l Wild
life
Ref
uge,
Sud
bury
, MA
; tes
t wel
l loc
atio
n at
42°
24′4
0″ la
titud
e an
d 71
°29′
15″
long
itud
e.3 M
arlb
oro
Cor
pora
te C
ente
r, M
arlb
orou
gh, M
A; t
est w
ell l
ocat
ion
at 4
2°22
′01″
latit
ude
and
71°3
5′47
″ lo
ngitu
de.
Tabl
e 1.
Hy
drau
lic p
rope
rties
of s
tratif
ied
glac
ial d
epos
its a
s de
term
ined
by
anal
ysis
of a
quife
r tes
ts a
t pub
lic-s
uppl
y w
ells
in th
e As
sabe
t Riv
er B
asin
, eas
tern
Mas
sach
uset
ts.
[Wel
l sit
e: S
ee ta
ble
8 fo
r a
dditi
onal
iden
tifi
catio
n in
form
atio
n; s
ite lo
catio
ns s
how
n on
fig
ure
16 u
nles
s ot
herw
ise
indi
cate
d. T
rans
mis
sivi
ty:
Mea
n of
rep
orte
d va
lues
or
a va
lue
othe
rwis
e co
nsid
ered
re
pres
enta
tive;
ft,
foot
; ft/d
, foo
t per
day
; ft2 /
d, s
quar
e fo
ot p
er d
ay; g
al/m
in, g
allo
ns p
er m
inut
e; -
-, n
ot a
vail
able
]
Wel
l site
Pred
omin
ant
grai
n si
ze o
fte
sted
inte
rval
Year
of
test
Leng
th
of te
st
(day
s)
Wel
l di
scha
rge
(gal
/min
)
Tran
smis
-si
vity
(ft2 /d
)
Satu
rate
d th
ickn
ess
(ft)
Hyd
raul
ic
cond
uc-
tivity
(ft/d
)
Stor
age
coef
fi-ci
ent
Refe
renc
e
AN
-06G
Fine
to c
oars
e sa
nd a
nd g
rave
l19
7019
500
5,29
0--
850.
14G
oldb
erg,
Zoi
no, D
unni
clif
f &
Ass
ocia
tes,
198
0a,b
AN
-05G
Fine
to c
oars
e sa
nd a
nd g
rave
l19
7013
265
6,22
0--
110
.07
Gol
dber
g, Z
oino
, Dun
nicl
iff
& A
ssoc
iate
s, 1
980a
,bA
N-0
9GSa
nd a
nd g
rave
l19
805
171
4,39
040
110
--D
ufre
sne-
Hen
ry, 1
996
AN
-10G
Sand
and
gra
vel
1979
1980
10 7
365
269
5,61
040
140
--D
ufre
sne-
Hen
ry, 1
996
AN
-11G
Fine
to c
oars
e sa
nd a
nd g
rave
l19
919
395
7,73
030
258
--D
ufre
sne-
Hen
ry, 1
993
BSC
1Si
lt an
d cl
ay19
893
1.75
5340
1.3
.001
Riz
zo A
ssoc
iate
s, 1
990
AR
NW
R2
Sand
and
gra
vel
1955
260
34,
500
4510
1.2
Perl
mut
ter,
196
2C
N-0
1GM
ediu
m to
coa
rse
sand
and
gra
vel
1966
1.5
--4,
400
70–9
080
--W
esto
n an
d Sa
mps
on, 1
997
HD
-01G
Sand
and
gra
vel
1967
271
023
,600
3567
5--
Ear
th T
ech,
200
0cM
CC
3Fi
ne to
coa
rse
sand
and
gra
vel
1989
122
98,
300
5116
3--
Sasa
ki A
ssoc
iate
s, 1
989
NB
-01G
M
ediu
m to
coa
rse
sand
and
gra
vel
1955
735
08,
600
6014
0--
Ear
th T
ech,
200
0bN
B-0
3GSa
nd a
nd g
rave
l19
69--
--5,
050
5395
--E
arth
Tec
h, 2
000b
WB
-05G
and
W
B-0
6GFi
ne to
coa
rse
sand
and
gra
vel
1984
745
09,
210
5018
4--
Geo
logi
c Se
rvic
es C
orpo
ratio
n, 1
985
WB
-07G
Coa
rse
sand
and
gra
vel
1994
839
39,
700
5019
4.1
0G
eolo
gic
Serv
ices
Cor
pora
tion,
199
5W
B-0
3GSa
nd a
nd g
rave
l19
812
600
11,2
0035
320
--E
arth
Tec
h, 2
000e
Ground- and Surface-Water Resources 9
EXPLANATION
0 1 2 3 4 5 MILES
0 2 KILOMETERS41 3 5From USGS and MassGIS data sources, Massachusetts State Plane Coordinate System, Mainland Zone.
TRANSMISSIVITY OF STRATIFIED GLACIAL DEPOSITS, IN FEET SQUARED PER DAY
Less than 1,350
1,350–4,000
Greater than 4,000
TILL AND BEDROCK
BASIN BOUNDARY
TOWN BOUNDARY
HYDRAULIC CONDUCTIVITY— Water-supply wells shown in blue. Symbol size is proportional to value, in feet per day
10
50
150
250
350
71o36'
71o24'
42o18'
42o24'
42o30'
Figure 3. Depth-weighted hydraulic conductivity from well logs and transmissivity zones in stratified glacial deposits in the Assabet River Basin, eastern Massachusetts. Transmissivity zones from Brackley and Hansen (1985).
10 Simulation of Ground-Water Flow and Evaluation of Water-Management Alternatives in the Assabet River Basin, Eastern MA
Hydraulic properties of bedrock generally are low but variable. Median values of hydraulic conductivity of crystalline bedrock for large and small supply wells in New England and adjacent areas range from 0.45 to 0.9 ft/d (Randall and others, 1966; Randall and others, 1988). Hydraulic conductivity in fractured crystalline bedrock in the Mirror Lake area, New Hampshire, varies over 6 orders of magnitude; representative values determined through model calibration were 0.02 and 0.09 ft/d (Tiedeman and others, 1997). Aquifer tests of four industrial supply wells in Acton and Hudson yielded hydraulic conductivity values of 0.18, 0.24, 0.97, and 2.8 ft/d (Epsilon Associates, 2000, 2002a, 2002b). The values for supply wells in bedrock, in the study area and elsewhere, likely represent the more permeable bedrock zones. Little information is available on vertical conductivity or storage properties of bedrock, which are likely to be highly variable. Vertical conductivity at the Maynard supply-well site ranged from 0.13 to 1.35 ft/d (Lyford and others, 2003). Storage coefficients for the industrial supply wells in Hudson and Acton ranged from 3×10⁻⁶ to 0.067 (Epsilon Associates, 2000, 2002a, 2002b), and a median value for large supply wells in New England was about 2×10⁻⁴ (Randall and others, 1988).
Ground-Water Flow
Ground water in the study area generally flows from topographic highs in the uplands toward stream channels and toward the stratified glacial deposits in valleys and lowlands. The water table mimics topography, such that surface- and ground-water divides typically coincide, especially in uplands. Precipitation recharges ground water in till and bedrock upland areas and in the stratified glacial deposits; surface runoff from uplands also recharges the stratified glacial deposits at the edges of valleys. Ground-water levels and flow directions, particu-larly in the stratified glacial deposits, are strongly influenced by the locations and elevations of streams, which, along with wetlands and pumping wells, are the discharge points for the ground-water-flow system (Winter and others, 1998; Randall and others, 2001).
Recharge
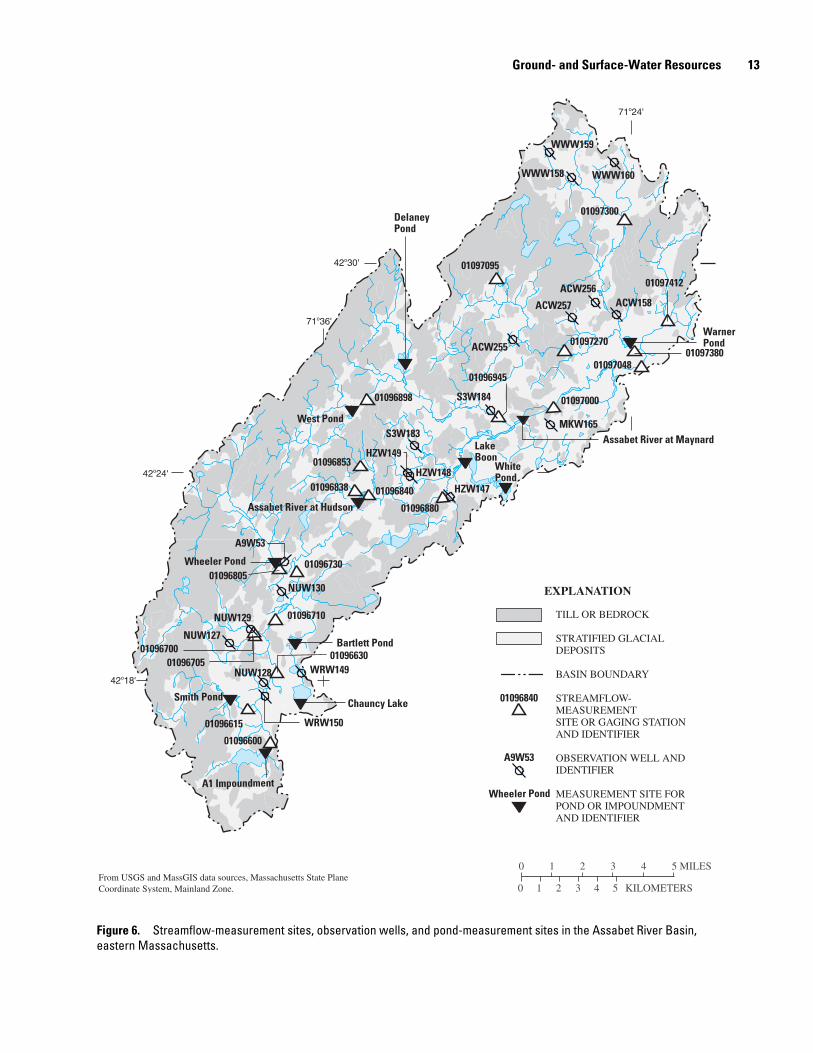
Recharge rates for the Assabet River Basin were estimated from two approaches and data sources—streamflow records and climate data. The recharge estimates were made to charac-terize the overall water budget for the basin and to guide calibration of the ground-water-flow models. The recession-curve displacement method was applied to mean daily stream-flow records from the two continuous-record streamflow-gaging stations (fig. 1) in the basin. The computer program
RORA, developed by Rutledge (1993, 1998) on theory by Rorabaugh (1964), was used to estimate recharge rates. In this method, recharge is quantified from the upward displacement of the streamflow-recession hydrograph after streamflow peaks. Individual recharge events are summed over yearly and monthly intervals. Several simplifying assumptions about the flow system are made, including the assumption of uniform aquifer properties and an instantaneous and uniform aquifer response to recharge events throughout the basin.
A water-balance method also was used to calculate daily recharge from climate data as:
, (1)
where
Climate data from the nearby Bedford and West Medway, MA, weather stations (about 5 and 15 mi, respectively, from the basin) were used for this analysis because they were considered most representative of conditions in the study area. Potential evapotranspiration (PET) for use in the water-balance method was calculated by using methods for estimating evaporation in settings where actual evaporation equals PET. The Hamon (1961) method (Lumb and Kittle, 1995) and the available climate data (mean daily temperature and hours of sunlight) initially were used. Because the Hamon method underestimates actual evaporation (Winter and others, 1995), values from this method were adjusted upward based on a comparison of monthly PET values calculated by Hamon and Penman methods for a basin in southern Rhode Island (P.J. Zarriello, U.S. Geological Survey, written commun., 2003). The Penman equation (Penman, 1948) more completely characterizes the driving forces of evaporation because it includes temperature, solar radiation, and wind speed; therefore, it is considered a better approximation of actual evaporation (Penman, 1948; Veihmeyer, 1964; Winter and others, 1995). The difference between mean daily streamflow and mean daily base flow (estimated with the automated hydrograph-separation method, PART; Rutledge, 1993, 1998) at the Assabet River streamflow-gaging station (fig. 1) was used as an estimate of direct runoff. Use of PART in an estimate of direct runoff assumes that anthropogenic effects on streamflow (for example, increased wastewater discharge to the river from storm inflow to sewers) are negligible compared to those resulting directly from precip-itation. The water-balance method was applied by using a FORTRAN computer program (D.R. LeBlanc, U.S. Geological Survey, written commun., 2002) that calculates ET, soil
R is recharge;P is precipitation;
ET is evapotranspiration;∆SM is change in soil moisture; and
DR is direct runoff.
R P ET– ∆SM– DR–=
Ground- and Surface-Water Resources 11
moisture deficit, and recharge on a daily basis, as described by Thornthwaite and Mather (1957). ET is set equal to PET when precipitation exceeds PET and is equal to precipitation and available soil moisture when precipitation is less than PET. The remaining available water first goes to satisfy the soil moisture deficit, then to recharge. A maximum soil storage capacity of 2 in. was assumed (Thornthwaite and Mather, 1957). No lag time is applied between precipitation and recharge to the water table, such that unsaturated-zone travel time is assumed negligible. As with the results produced by the RORA method, the water-balance method results in basin-wide recharge rates that simplify and homogenize recharge, runoff, and ET processes.
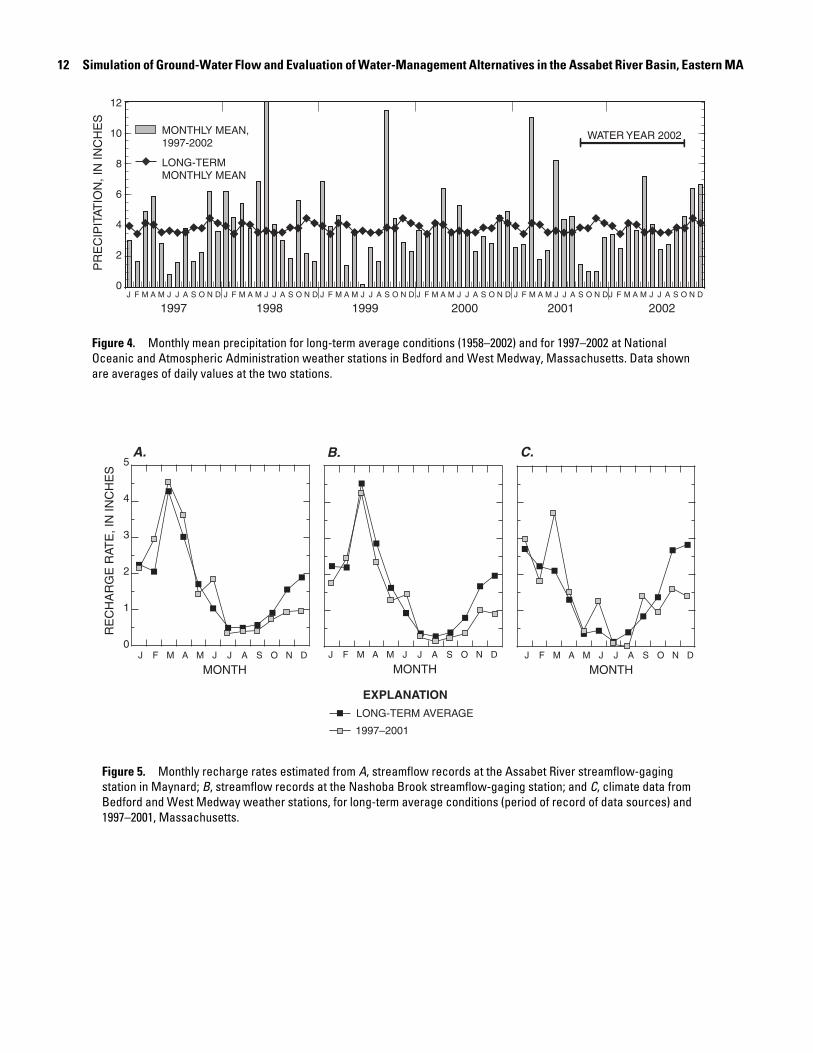
Recharge rates of about 20 in/yr were calculated from streamflow records, for long-term conditions and for the 1997–2001 period (table 2). The water-balance method yielded rates of about 17 in/yr. These values are consistent with recharge rates of 17.5 to 25.5 in/yr, estimated from streamflow records and model calibration for basins in southern New England with variable percentages of stratified glacial deposits and till-covered uplands (Bent, 1995, 1999; Barlow, 1997; Barlow and Dickerman, 2001; DeSimone and others, 2002). Although average annual rates for 1997–2001 are similar to long-term rates, this 5-year period was unusual in that it contained relatively dry summers in 1997 and 1999 and an extended period of dry weather that began in September 2001 (fig. 4). Recharge rates of 17 to 20 in/yr for 1997–2001 correspond to total inflow volumes to the basin of 143 to 169 Mgal/d (222 to 261 ft3/s).
1Assabet River streamflow-gaging station, 1941–2002; Nashoba Brook streamflow-gaging station, 1964–2002; water-balance method, 1958–2002.
The distribution of annual recharge among months from both methods (fig. 5) is consistent with conceptual models in which most aquifer recharge occurs during spring and winter months. Results of the two methods differ in that recharge rates from streamflow records have a distinct peak in the spring that may reflect the effects of snowmelt or aquifer storage that are not captured in the climate-based water-balance method. Unlike the annual average rates, deviations of 1997–2001 conditions from long-term average conditions are apparent in the monthly average rates. Average rates in October, November, and December for 1997–2001 are lower than long-term average rates for both methods because of the extended dry period in 2001. Average March and June rates for 1997–2001 are higher than the long-term average because of some unusually wet months in that 5-year period (figs. 4 and 5). Both methods, however, are more accurate for estimating long-term average rates than for estimating rates at shorter time scales, such as months (Rutledge, 1998, 2000).
Water Levels
Ground-water levels throughout the basin are strongly influenced by the locations and elevations of streams, ponds, and wetlands. Water-level fluctuations also are influenced by proximity to surface water. Annual fluctuations are smallest near streams and ponds, and are largest in the uplands, where thin surficial layers of till may dry out in summer (Randall and others, 1988). In this study, ground-water levels were measured only in the stratified glacial deposits; water levels and fluctua-tions in the till and bedrock upland areas were considered too variable to be characterized by the data-collection program.
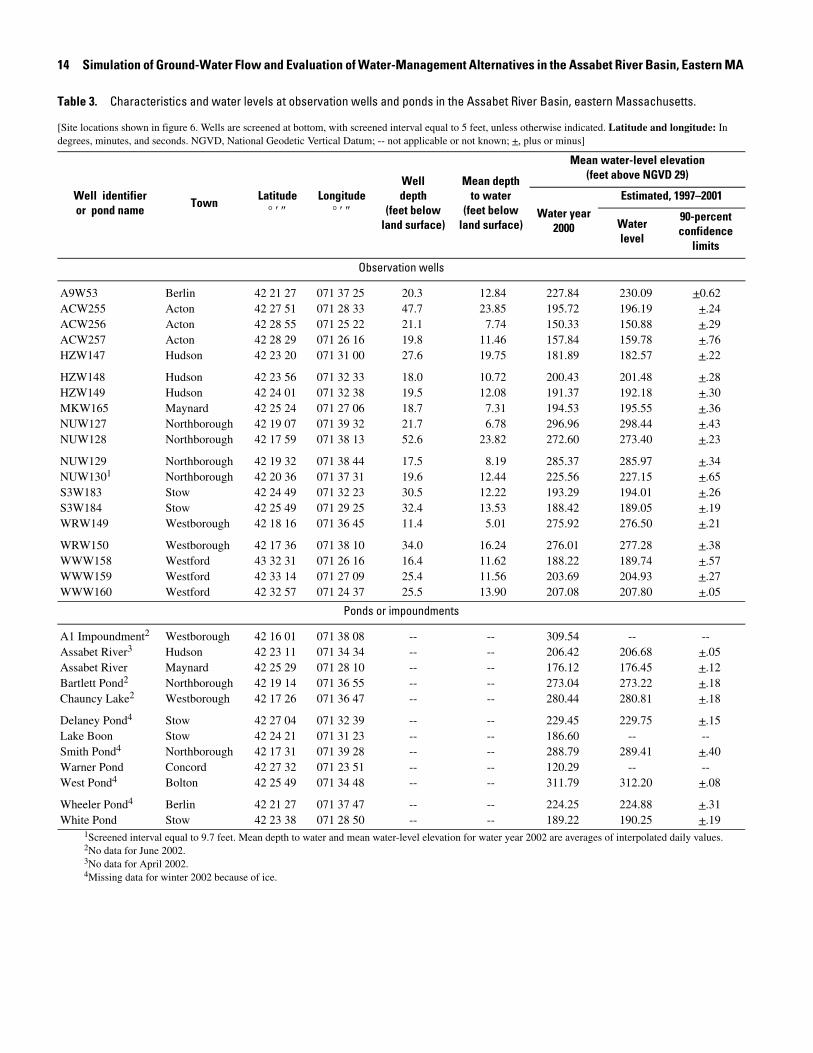
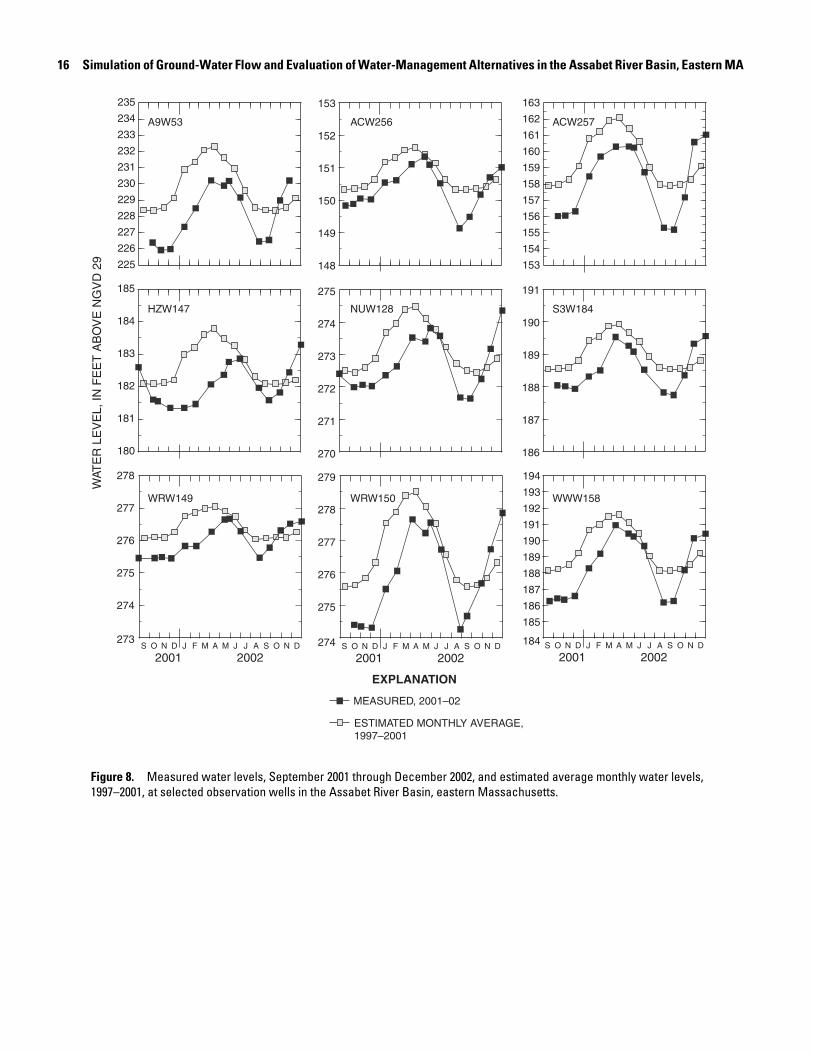
Water levels were measured in 19 wells at about monthly intervals from September 2001 through December 2002 (fig. 6 and table 3). Data also were available from a long-term observation well, ACW158, with a continuous record since July 2001 and a 40-year record of intermittent measurements (Socolow and others, 2003). The wells all were screened in the stratified glacial deposits. Water levels throughout eastern Massachusetts during the measurement period were lower than normal, as shown by records at ACW158 (fig. 7) and at other long-term observation wells (table 4; Socolow and others, 2002, 2003). Measured annual fluctuations in observation wells generally ranged from less than 2 to more than 4 ft. Fluctuations generally were largest in wells near boundaries of stratified glacial deposits with uplands, such as ACW257 and WRW150, and smallest in wells near streams, such as HZW147 and WRW149 (fig. 8).
Table 2. Average annual recharge rates and precipitation for the Assabet River Basin, eastern Massachusetts.
[in/yr, inches per year]
PeriodPrecip-itation (in/yr)
Recharge (in/yr)
Streamflow hydrograph displacement method
Water-balancemethod
AssabetRiver
station(01097000)
NashobaBrookstation
(01097300)
Data source period of record1 46.4 20.6 19.8 17.3
1964–2002 46.4 20.6 19.8 17.21997–2001 47.1 20.3 16.4 17.1
12 Simulation of Ground-Water Flow and Evaluation of Water-Management Alternatives in the Assabet River Basin, Eastern MA
J F M A M J J A S O N D
MONTHLY MEAN,1997-2002
LONG-TERM MONTHLY MEAN
J F M A M J J A S O N D J F M A M J J A S O N D J F M A M J J A S O N D J F M A M J J A S O N DJ F M A M J J A S O N D
1997 1998 1999 2000 2001 2002
WATER YEAR 2002
PR
EC
IPIT
ATIO
N, I
N IN
CH
ES
0
2
4
6
8
10
12
Figure 4. Monthly mean precipitation for long-term average conditions (1958–2002) and for 1997–2002 at National Oceanic and Atmospheric Administration weather stations in Bedford and West Medway, Massachusetts. Data shown are averages of daily values at the two stations.
J F M A M SJ J A O N D
MONTH
5
4
2
0
3
1
RE
CH
AR
GE
RAT
E, I
N IN
CH
ES
J F M A M SJ J A O N D
MONTHJ F M A M SJ J A O N D
MONTH
LONG-TERM AVERAGE
1997–2001
EXPLANATION
A. B. C.
Figure 5. Monthly recharge rates estimated from A, streamflow records at the Assabet River streamflow-gaging station in Maynard; B, streamflow records at the Nashoba Brook streamflow-gaging station; and C, climate data from Bedford and West Medway weather stations, for long-term average conditions (period of record of data sources) and 1997–2001, Massachusetts.
Ground- and Surface-Water Resources 13
NUW127
A9W53
WRW149NUW128
WRW150
NUW130
NUW129
01096615
01096600
0109663001096705
01096700
01096710
0109673001096805
Wheeler Pond
A1 Impoundment
HZW147
HZW148
HZW149
0109684001096838
01096853
01096898
01096945
01097000
01097095
01097270
0109704801097380
01097412
01097300
ACW256
ACW257
ACW255
S3W184
S3W183MKW165
WarnerPond
DelaneyPond
WhitePond
LakeBoon
Assabet River at Hudson
Assabet River at Maynard
West Pond
WWW160WWW158
WWW159
ACW158
01096880
Chauncy Lake
Bartlett Pond
Smith Pond
EXPLANATION
0 1 2 3 4 5 MILES
0 2 KILOMETERS41 3 5From USGS and MassGIS data sources, Massachusetts State Plane Coordinate System, Mainland Zone.
01096840
Wheeler Pond
A9W53
TILL OR BEDROCK
STRATIFIED GLACIAL DEPOSITS
BASIN BOUNDARY
STREAMFLOW-MEASUREMENTSITE OR GAGING STATION AND IDENTIFIER
OBSERVATION WELL AND IDENTIFIER
MEASUREMENT SITE FOR POND OR IMPOUNDMENT AND IDENTIFIER
71o36'
71o24'
42o18'
42o24'
42o30'
Figure 6. Streamflow-measurement sites, observation wells, and pond-measurement sites in the Assabet River Basin, eastern Massachusetts.
14 Simulation of Ground-Water Flow and Evaluation of Water-Management Alternatives in the Assabet River Basin, Eastern MA
1Screened interval equal to 9.7 feet. Mean depth to water and mean water-level elevation for water year 2002 are averages of interpolated daily values.2No data for June 2002.3No data for April 2002.4Missing data for winter 2002 because of ice.
Table 3. Characteristics and water levels at observation wells and ponds in the Assabet River Basin, eastern Massachusetts.
[Site locations shown in figure 6. Wells are screened at bottom, with screened interval equal to 5 feet, unless otherwise indicated. Latitude and longitude: In degrees, minutes, and seconds. NGVD, National Geodetic Vertical Datum; -- not applicable or not known; +, plus or minus]
Well identifieror pond name
TownLatitude
° ′ ″Longitude
° ′ ″
Well depth
(feet below land surface)
Mean depthto water
(feet belowland surface)
Mean water-level elevation (feet above NGVD 29)
Water year 2000
Estimated, 1997–2001
Water level
90-percent confidence
limits
Observation wells
A9W53 Berlin 42 21 27 071 37 25 20.3 12.84 227.84 230.09 +0.62ACW255 Acton 42 27 51 071 28 33 47.7 23.85 195.72 196.19 +.24ACW256 Acton 42 28 55 071 25 22 21.1 7.74 150.33 150.88 +.29ACW257 Acton 42 28 29 071 26 16 19.8 11.46 157.84 159.78 +.76HZW147 Hudson 42 23 20 071 31 00 27.6 19.75 181.89 182.57 +.22
HZW148 Hudson 42 23 56 071 32 33 18.0 10.72 200.43 201.48 +.28HZW149 Hudson 42 24 01 071 32 38 19.5 12.08 191.37 192.18 +.30MKW165 Maynard 42 25 24 071 27 06 18.7 7.31 194.53 195.55 +.36NUW127 Northborough 42 19 07 071 39 32 21.7 6.78 296.96 298.44 +.43NUW128 Northborough 42 17 59 071 38 13 52.6 23.82 272.60 273.40 +.23
NUW129 Northborough 42 19 32 071 38 44 17.5 8.19 285.37 285.97 +.34NUW1301 Northborough 42 20 36 071 37 31 19.6 12.44 225.56 227.15 +.65S3W183 Stow 42 24 49 071 32 23 30.5 12.22 193.29 194.01 +.26S3W184 Stow 42 25 49 071 29 25 32.4 13.53 188.42 189.05 +.19WRW149 Westborough 42 18 16 071 36 45 11.4 5.01 275.92 276.50 +.21
WRW150 Westborough 42 17 36 071 38 10 34.0 16.24 276.01 277.28 +.38WWW158 Westford 43 32 31 071 26 16 16.4 11.62 188.22 189.74 +.57WWW159 Westford 42 33 14 071 27 09 25.4 11.56 203.69 204.93 +.27WWW160 Westford 42 32 57 071 24 37 25.5 13.90 207.08 207.80 +.05
Ponds or impoundments
A1 Impoundment2 Westborough 42 16 01 071 38 08 -- -- 309.54 -- --Assabet River3 Hudson 42 23 11 071 34 34 -- -- 206.42 206.68 +.05Assabet River Maynard 42 25 29 071 28 10 -- -- 176.12 176.45 +.12Bartlett Pond2 Northborough 42 19 14 071 36 55 -- -- 273.04 273.22 +.18Chauncy Lake2 Westborough 42 17 26 071 36 47 -- -- 280.44 280.81 +.18
Delaney Pond4 Stow 42 27 04 071 32 39 -- -- 229.45 229.75 +.15Lake Boon Stow 42 24 21 071 31 23 -- -- 186.60 -- --Smith Pond4 Northborough 42 17 31 071 39 28 -- -- 288.79 289.41 +.40Warner Pond Concord 42 27 32 071 23 51 -- -- 120.29 -- --West Pond4 Bolton 42 25 49 071 34 48 -- -- 311.79 312.20 +.08
Wheeler Pond4 Berlin 42 21 27 071 37 47 -- -- 224.25 224.88 +.31White Pond Stow 42 23 38 071 28 50 -- -- 189.22 190.25 +.19
Ground- and Surface-Water Resources 15
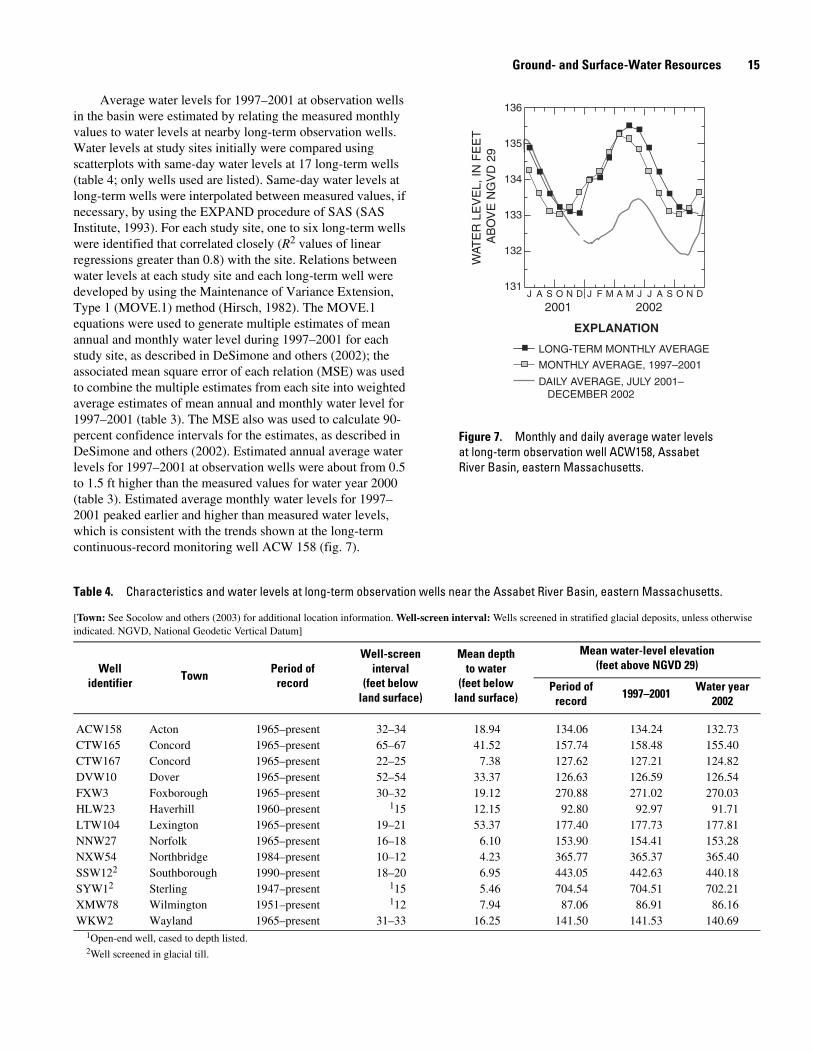
Average water levels for 1997–2001 at observation wells in the basin were estimated by relating the measured monthly values to water levels at nearby long-term observation wells. Water levels at study sites initially were compared using scatterplots with same-day water levels at 17 long-term wells (table 4; only wells used are listed). Same-day water levels at long-term wells were interpolated between measured values, if necessary, by using the EXPAND procedure of SAS (SAS Institute, 1993). For each study site, one to six long-term wells were identified that correlated closely (R2 values of linear regressions greater than 0.8) with the site. Relations between water levels at each study site and each long-term well were developed by using the Maintenance of Variance Extension, Type 1 (MOVE.1) method (Hirsch, 1982). The MOVE.1 equations were used to generate multiple estimates of mean annual and monthly water level during 1997–2001 for each study site, as described in DeSimone and others (2002); the associated mean square error of each relation (MSE) was used to combine the multiple estimates from each site into weighted average estimates of mean annual and monthly water level for 1997–2001 (table 3). The MSE also was used to calculate 90-percent confidence intervals for the estimates, as described in DeSimone and others (2002). Estimated annual average water levels for 1997–2001 at observation wells were about from 0.5 to 1.5 ft higher than the measured values for water year 2000 (table 3). Estimated average monthly water levels for 1997–2001 peaked earlier and higher than measured water levels, which is consistent with the trends shown at the long-term continuous-record monitoring well ACW 158 (fig. 7).
136
135
134
133
132
131J F M A M SJ J A O N DSJ A O N D
2001 2002
LONG-TERM MONTHLY AVERAGE
DAILY AVERAGE, JULY 2001– DECEMBER 2002
MONTHLY AVERAGE, 1997–2001
EXPLANATION
WAT
ER
LE
VE
L, IN
FE
ET
A
BO
VE
NG
VD
29
Figure 7. Monthly and daily average water levels at long-term observation well ACW158, Assabet River Basin, eastern Massachusetts.
1Open-end well, cased to depth listed.2Well screened in glacial till.
Table 4. Characteristics and water levels at long-term observation wells near the Assabet River Basin, eastern Massachusetts.
[Town: See Socolow and others (2003) for additional location information. Well-screen interval: Wells screened in stratified glacial deposits, unless otherwise indicated. NGVD, National Geodetic Vertical Datum]
Wellidentifier
Town Period ofrecord
Well-screeninterval
(feet belowland surface)
Mean depthto water
(feet belowland surface)
Mean water-level elevation (feet above NGVD 29)
Period of record
1997–2001 Water year2002
ACW158 Acton 1965–present 32–34 18.94 134.06 134.24 132.73CTW165 Concord 1965–present 65–67 41.52 157.74 158.48 155.40CTW167 Concord 1965–present 22–25 7.38 127.62 127.21 124.82DVW10 Dover 1965–present 52–54 33.37 126.63 126.59 126.54FXW3 Foxborough 1965–present 30–32 19.12 270.88 271.02 270.03HLW23 Haverhill 1960–present 115 12.15 92.80 92.97 91.71LTW104 Lexington 1965–present 19–21 53.37 177.40 177.73 177.81NNW27 Norfolk 1965–present 16–18 6.10 153.90 154.41 153.28NXW54 Northbridge 1984–present 10–12 4.23 365.77 365.37 365.40SSW122 Southborough 1990–present 18–20 6.95 443.05 442.63 440.18SYW12 Sterling 1947–present 115 5.46 704.54 704.51 702.21XMW78 Wilmington 1951–present 112 7.94 87.06 86.91 86.16WKW2 Wayland 1965–present 31–33 16.25 141.50 141.53 140.69
16 Simulation of Ground-Water Flow and Evaluation of Water-Management Alternatives in the Assabet River Basin, Eastern MA
ACW256A9W53 ACW257
WRW149 WRW150 WWW158
S3W184NUW128HZW147
225
227
226
228
229
230
231
232
233
234
235
180
181
182
183
184
185
273
274
275
276
277
278
148
149
150
151
152
153
270
271
272
273
274
275
274
275
276
277
278
279
184
186
185
187
188
189
190
191
192
193
194
186
187
188
189
190
191
153
155
154
156
157
158
159
160
161
162
163
EXPLANATION
MEASURED, 2001–02
ESTIMATED MONTHLY AVERAGE, 1997–2001
WAT
ER
LE
VE
L, IN
FE
ET
AB
OV
E N
GV
D 2
9
J F M A M SJ J A O N DS O N D
2001 2002J F M A M SJ J A O N DS O N D
2001 2002J F M A M SJ J A O N DS O N D
2001 2002
Figure 8. Measured water levels, September 2001 through December 2002, and estimated average monthly water levels, 1997–2001, at selected observation wells in the Assabet River Basin, eastern Massachusetts.
Ground- and Surface-Water Resources 17
Surface Water
The Assabet River originates at a large flood-control dam and impoundment at its headwaters in Westborough (the A1 Impoundment), and is impounded by six other mill dams before joining the Sudbury River in Concord (fig. 1). Some of the impoundments, such as that upstream of the Ben Smith Dam in Maynard, extend for several miles. The total elevation change along the length of the river is about 200 ft and occurs mostly at the dams and near the headwaters of the river. Most major tributaries in the basin flow from northwest to southeast and include Hop, Cold Harbor, Howard, Stirrup, North, Danforth, Elizabeth, Fort Pond, and Nashoba Brooks (fig. 1). Flood-control or mill dams also are common along the major tributaries, creating reservoirs, lakes, or wetlands and in some cases affecting main stem flow. Examples include Millham Reservoir, Fort Meadow Reservoir, Lake Boon, Delaney Pond and surrounding wetlands, and the wetlands along Cold Harbor and Hop Brooks (fig. 1). Wetlands along small perennial and intermittent streams also are common throughout the basin.
Streamflow
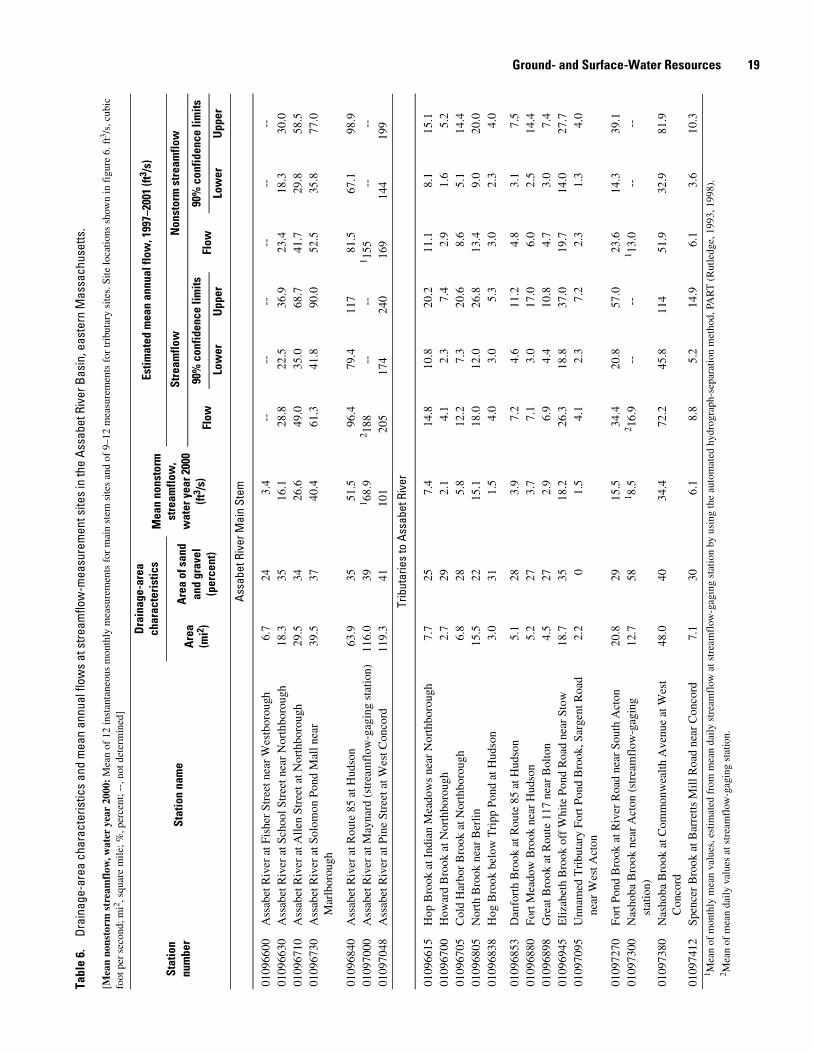
Average flow in the Assabet River at the continuous streamflow-gaging station in Maynard (0109700), with a drainage area of about two-thirds of the basin (116 mi2), is 188 ft3/s (table 5). Average streamflow out of the basin is an estimated 287 ft3/s (185 Mgal/d), as determined by the drainage-area ratio method and flow at the Maynard station. Average flow at the continuous streamflow-gaging station on Nashoba Brook (01097300), a major tributary to the Assabet River, is 20.2 ft3/s (table 5). In addition to measurements at the two continuous streamflow-gaging stations in the basin, streamflow was measured at 6 partial-record sites on the main stem Assabet River and at 13 tributary sites at monthly intervals from May or June 2001 through December 2002 (fig. 6 and table 6; see Socolow and others, 2003, for measurement data). Streamflow measurements were made after several days of dry weather; therefore, they represented nonstorm streamflow. Nonstorm streamflow in tributaries is defined here as base flow minus any surface-water withdrawals; in the main stem Assabet River, it is base flow minus withdrawals plus waste-
water discharges. Nonstorm streamflow excludes direct stream (stormwater) runoff, which occurs immediately after a precipi-tation event. Like water levels, streamflows in the basin during the measurement period were lower than average, as indicated by flows at streamflow-gaging stations in and near the basin (fig. 9 and table 5).
For streamflow-gaging stations in the basin, mean annual and monthly nonstorm streamflow for 1997–2001 was calcu-lated directly from streamflow records by using the automated hydrograph-separation method, PART (Rutledge, 1993). For partial-record study sites, mean annual and monthly streamflow and nonstorm streamflow for 1997–2001 (Appendix 1) were estimated by using the MOVE.1 methods described previously for water levels. The MOVE.1 analysis was done on logarithms of flow, in the way that the method commonly is applied to streamflow (Bent, 1995, 1999; Ries and Friesz, 2000). Instantaneous streamflow at measurement sites was correlated with same-day mean daily streamflow at up to eight nearby long-term streamflow-gaging stations (table 5). Long-term stations were on largely unregulated streams and represent ranges of drainage areas and percentages of stratified glacial deposits in drainage areas that were similar to the study sites. Nonstorm streamflow, or base flow at long-term stations, was estimated by using PART. The comparison between stream-flows at largely unregulated, long-term stations and at study sites assumes that flow components of nonstorm streamflow other than base flow at the study sites are of negligible quantity, or at least have insignificant effects on the temporal variation of flows. For main stem Assabet River sites where wastewater is a large and variable component of nonstorm streamflow, this assumption may introduce error, especially during low-flow months.
Mean annual flows for 1997–2001 at streamflow-gaging stations were similar to long-term average flows, and much higher than (about twice) flows in water year 2002 (table 5). Estimated mean annual nonstorm streamflow was about 70 to 80 percent of total flow at all stations except for the Old Swamp River station (01105600, 60 percent of total flow), which drains a small basin with extensive wetlands. Nonstorm streamflow at the Assabet River station (01097000), which would be expected to include most of the wastewater discharged to the river in the basin, was about 80 percent of total flow, one of the highest percentages of total flow.
18 Simulation of Ground-Water Flow and Evaluation of Water-Management Alternatives in the Assabet River Basin, Eastern MA
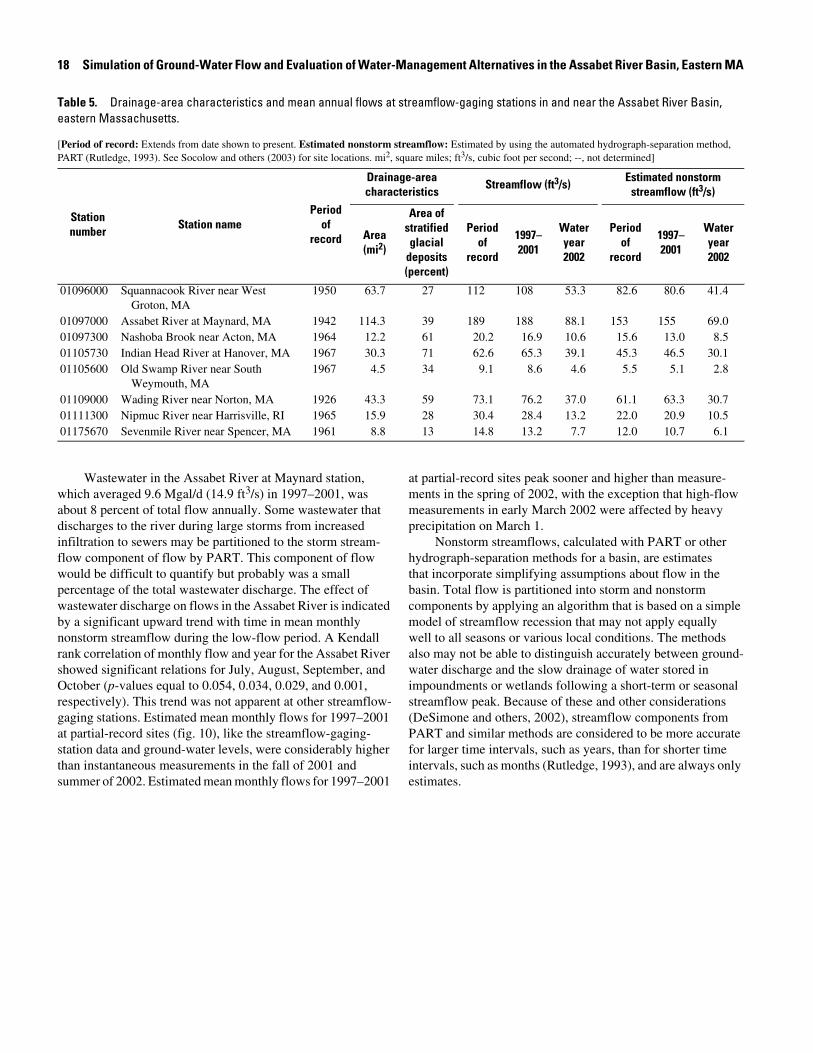
Table 5. Drainage-area characteristics and mean annual flows at streamflow-gaging stations in and near the Assabet River Basin, eastern Massachusetts.
[Period of record: Extends from date shown to present. Estimated nonstorm streamflow: Estimated by using the automated hydrograph-separation method, PART (Rutledge, 1993). See Socolow and others (2003) for site locations. mi2, square miles; ft3/s, cubic foot per second; --, not determined]
Stationnumber Station name
Periodof
record
Drainage-area characteristics
Streamflow (ft3/s) Estimated nonstorm streamflow (ft3/s)
Area(mi2)
Area ofstratified glacial
deposits(percent)
Periodof
record
1997–2001
Wateryear2002
Periodof
record
1997–2001
Wateryear2002
01096000 Squannacook River near West Groton, MA
1950 63.7 27 112 108 53.3 82.6 80.6 41.4
01097000 Assabet River at Maynard, MA 1942 114.3 39 189 188 88.1 153 155 69.001097300 Nashoba Brook near Acton, MA 1964 12.2 61 20.2 16.9 10.6 15.6 13.0 8.501105730 Indian Head River at Hanover, MA 1967 30.3 71 62.6 65.3 39.1 45.3 46.5 30.101105600 Old Swamp River near South
Weymouth, MA1967 4.5 34 9.1 8.6 4.6 5.5 5.1 2.8
01109000 Wading River near Norton, MA 1926 43.3 59 73.1 76.2 37.0 61.1 63.3 30.701111300 Nipmuc River near Harrisville, RI 1965 15.9 28 30.4 28.4 13.2 22.0 20.9 10.501175670 Sevenmile River near Spencer, MA 1961 8.8 13 14.8 13.2 7.7 12.0 10.7 6.1
Wastewater in the Assabet River at Maynard station, which averaged 9.6 Mgal/d (14.9 ft3/s) in 1997–2001, was about 8 percent of total flow annually. Some wastewater that discharges to the river during large storms from increased infiltration to sewers may be partitioned to the storm stream-flow component of flow by PART. This component of flow would be difficult to quantify but probably was a small percentage of the total wastewater discharge. The effect of wastewater discharge on flows in the Assabet River is indicated by a significant upward trend with time in mean monthly nonstorm streamflow during the low-flow period. A Kendall rank correlation of monthly flow and year for the Assabet River showed significant relations for July, August, September, and October (p-values equal to 0.054, 0.034, 0.029, and 0.001, respectively). This trend was not apparent at other streamflow-gaging stations. Estimated mean monthly flows for 1997–2001 at partial-record sites (fig. 10), like the streamflow-gaging-station data and ground-water levels, were considerably higher than instantaneous measurements in the fall of 2001 and summer of 2002. Estimated mean monthly flows for 1997–2001
at partial-record sites peak sooner and higher than measure-ments in the spring of 2002, with the exception that high-flow measurements in early March 2002 were affected by heavy precipitation on March 1.
Nonstorm streamflows, calculated with PART or other hydrograph-separation methods for a basin, are estimates that incorporate simplifying assumptions about flow in the basin. Total flow is partitioned into storm and nonstorm components by applying an algorithm that is based on a simple model of streamflow recession that may not apply equally well to all seasons or various local conditions. The methods also may not be able to distinguish accurately between ground-water discharge and the slow drainage of water stored in impoundments or wetlands following a short-term or seasonal streamflow peak. Because of these and other considerations (DeSimone and others, 2002), streamflow components from PART and similar methods are considered to be more accurate for larger time intervals, such as years, than for shorter time intervals, such as months (Rutledge, 1993), and are always only estimates.
Ground- and Surface-Water Resources 19
1 Mea
n of
mon
thly
mea
n va
lues
, est
imat
ed f
rom
mea
n da
ily s
trea
mfl
ow a
t str
eam
flow
-gag
ing
stat
ion
by u
sing
the
auto
mat
ed h
ydro
grap
h-se
para
tion
met
hod,
PA
RT
(R
utle
dge,
199
3, 1
998)
.2 M
ean
of m
ean
daily
val
ues
at s
trea
mfl
ow-g
agin
g st
atio
n.
Tabl
e 6.
Dr
aina
ge-a
rea
char
acte
ristic
s an
d m
ean
annu
al fl
ows
at s
tream
flow
-mea
sure
men
t site
s in
the
Assa
bet R
iver
Bas
in, e
aste
rn M
assa
chus
etts
.
[Mea
n no
nsto
rm s
trea
mfl
ow, w
ater
yea
r 20
00:
Mea
n of
12
inst
anta
neou
s m
onth
ly m
easu
rem
ents
for
mai
n st
em s
ites
and
of 9
–12
mea
sure
men
ts f
or tr
ibut
ary
site
s. S
ite
loca
tions
sho
wn
in f
igur
e 6.
ft3 /
s, c
ubic
fo
ot p
er s
econ
d; m
i2 , s
quar
e m
ile; %
, per
cent
; --,
not
det
erm
ined
]
Stat
ion
num
ber
Stat
ion
nam
e
Dra
inag
e-ar
ea
char
acte
rist
ics
Mea
n no
nsto
rm
stre
amflo
w,
wat
er y
ear 2
000
(ft3 /s
)
Estim
ated
mea
n an
nual
flow
, 199
7–20
01 (f
t3 /s)
Are
a(m
i2 )
Are
a of
san
d an
d gr
avel
(per
cent
)
Stre
amflo
wN
onst
orm
str
eam
flow
Flow
90%
con
fiden
ce li
mits
Flow
90%
con
fiden
ce li
mits
Low
erU
pper
Low
erU
pper
Assa
bet R
iver
Mai
n St
em
0109
6600
Ass
abet
Riv
er a
t Fis
her
Stre
et n
ear
Wes
tbor
ough
6.7
243.
4--
----
----
--01
0966
30A
ssab
et R
iver
at S
choo
l Str
eet n
ear
Nor
thbo
roug
h18
.335
16.1
28.8
22.5
36.9
23.4
18.3
30.0
0109
6710
Ass
abet
Riv
er a
t Alle
n St
reet
at N
orth
boro
ugh
29.5
3426
.649
.035
.068
.741
.729
.858
.501
0967
30A
ssab
et R
iver
at S
olom
on P
ond
Mal
l nea
r M
arlb
orou
gh39
.537
40.4
61.3
41.8
90.0
52.5
35.8
77.0
0109
6840
Ass
abet
Riv
er a
t Rou
te 8
5 at
Hud
son
63.9
3551
.596
.479
.411
781
.567
.198
.901
0970
00A
ssab
et R
iver
at M
ayna
rd (
stre
amfl
ow-g
agin
g st
atio
n)11
6.0
391 6
8.9
2 188
----
1 155
----
0109
7048
Ass
abet
Riv
er a
t Pin
e St
reet
at W
est C
onco
rd11
9.3
4110
120
517
424
016
914
419
9
Trib
utar
ies
to A
ssab
et R
iver
0109
6615
Hop
Bro
ok a
t Ind
ian
Mea
dow
s ne
ar N
orth
boro
ugh
7.7
257.
414
.810
.820
.211
.18.
115
.101
0967
00H
owar
d B
rook
at N
orth
boro
ugh
2.7
292.
14.
12.
37.
42.
91.
65.
201
0967
05C
old
Har
bor
Bro
ok a
t Nor
thbo
roug
h6.
828
5.8
12.2
7.3
20.6
8.6
5.1
14.4
0109
6805
Nor
th B
rook
nea
r B
erlin
15.5
2215
.118
.012
.026
.813
.49.
020
.001
0968
38H
og B
rook
bel
ow T
ripp
Pon
d at
Hud
son
3.0
311.
54.
03.
05.
33.
02.
34.
0
0109
6853
Dan
fort
h B
rook
at R
oute
85
at H
udso
n5.
128
3.9
7.2
4.6
11.2
4.8
3.1
7.5
0109
6880
Fort
Mea
dow
Bro
ok n
ear
Hud
son
5.2
273.
77.
13.
017
.06.
02.
514
.401
0968
98G
reat
Bro
ok a
t Rou
te 1
17 n
ear
Bol
ton
4.5
272.
96.
94.
410
.84.
73.
07.
401
0969
45E
lizab
eth
Bro
ok o
ff W
hite
Pon
d R
oad
near
Sto
w18
.735
18.2
26.3
18.8
37.0
19.7
14.0
27.7
0109
7095
Unn
amed
Tri
buta
ry F
ort P
ond
Bro
ok, S
arge
nt R
oad
near
Wes
t Act
on2.
20
1.5
4.1
2.3
7.2
2.3
1.3
4.0
0109
7270
Fort
Pon
d B
rook
at R
iver
Roa
d ne
ar S
outh
Act
on20
.829
15.5
34.4
20.8
57.0
23.6
14.3
39.1
0109
7300
Nas
hoba
Bro
ok n
ear
Act
on (
stre
amfl
ow-g
agin
g st
atio
n)12
.758
1 8.5
2 16.
9--
--1 1
3.0
----
0109
7380
Nas
hoba
Bro
ok a
t Com
mon
wea
lth A
venu
e at
Wes
t C
onco
rd48
.040
34.4
72.2
45.8
114
51.9
32.9
81.9
0109
7412
Spen
cer
Bro
ok a
t Bar
retts
Mill
Roa
d ne
ar C
onco
rd7.
130
6.1
8.8
5.2
14.9
6.1
3.6
10.3
20 Simulation of Ground-Water Flow and Evaluation of Water-Management Alternatives in the Assabet River Basin, Eastern MA
10,000
1,000
100
10
1
LONG-TERM MONTHLY MEAN
ST
RE
AM
FLO
W, I
N C
UB
IC F
EE
T P
ER
SE
CO
ND
1,000
100
10
1
0.1
0.012001 20022000199919981997
DAILY MEAN, 1997–2001
A. 01097000 ASSABET RIVER AT MAYNARD
B. 01097300 NASHOBA BROOK NEAR ACTON
Figure 9. Monthly mean streamflow for long-term average conditions and daily mean streamflow, 1997–2001: A, Assabet River streamflow-gaging station at Maynard; B, Nashoba Brook streamflow-gaging station near Acton, Massachusetts.
Ponds and Wetlands
Ponds in the Assabet River Basin include instream ponds and impoundments, typically formed by mill or flood-control dams, and kettle lakes, depressions in the stratified glacial deposits that intersect the water table. Many kettle lakes also have surface-water inflows and outflows. Water levels were measured at about monthly intervals in 12 ponds and impound-ments (fig. 6 and table 3). Water levels changed little in the river impoundments or ponds upstream of dams (instream ponds),
such as Bartlett Pond and Lake Boon (fig. 11). In kettle lakes, such as Chauncy Lake and White Pond, water-level fluctuations were similar to those of ground water, although they were affected by ice conditions. Average annual water levels for 1997–2001 were estimated for ponds and impoundments by using the MOVE.1 methods (table 3), but these estimates may not be meaningful for ponds and impoundments where water levels are controlled predominantly by dams and outflow structures.
Ground- and Surface-Water Resources 21
100
10
1
ASSABET RIVER AT SCHOOL STREET (01096630)
1,000
100
10
ASSABET RIVER AT ROUTE 85(01096840)
100
1
0.01
10
0.1
HOWARD BROOK (01096700)
1,000
10
0.1
100
1
1,000
10
0.1
100
1
NASHOBA BROOK ATCOMMONWEALTH AVE. (01097380)ELIZABETH BROOK (01096945)
INSTANTANEOUS STREAMFLOW MEASUREMENT, JUNE 2001–DECEMBER 2002
EXPLANATION
ESTIMATED MEAN MONTHLY STREAMFLOW, 1997–2001
ESTIMATED MEAN MONTHLY NONSTORM STREAMFLOW, 1997–2001
J F M A M SJ J A O N DSJ A O N D
2001 2002
J
J F M A M SJ J A O N DSJ A O N D
2001 2002JJ F M A M SJ J A O N DSJ A O N D
2001 2002J
ST
RE
AM
FLO
W, I
N C
UB
IC F
EE
T P
ER
SE
CO
ND
Figure 10. Instantaneous streamflow measurements, June 2001 through December 2002, and estimated mean monthly streamflow and nonstorm streamflow at selected flow-measurement sites in the Assabet River Basin, eastern Massachusetts.
Wetlands are common in the basin, covering 3 percent of the basin area in 1999. Wetlands include areas mapped as bogs, marshes, shrub swamps, and forested wetlands (fig. 1; MassGIS, 2001; 1:5,000 scale). Wetlands potentially have important but variable, and largely unknown, functions in surface- and ground-water-flow systems at the regional scale (Carter and Novitzki, 1988; Mitsch and Gosselink, 1993; Hunt and others, 1996; Cole and Brooks, 2000). Their interaction with surface and ground water varies with location in the landscape, connection with other surface waters, and subsurface soil and hydrogeologic conditions. Wetlands commonly are considered to store surface runoff and reduce flood peaks. Wetlands may receive ground-water inflow and drain to surface water; they may be isolated from the ground-water system; or
when water levels in the wetland are above the surrounding water table, such as in a perched system, they may be sources of recharge to ground water. Evapotranspiration in riparian wetlands also may reduce streamflow in the summer (Motts and O’Brien, 1981). Wetlands in the Assabet River Basin, the majority of which are forested, are along all major tributaries and along the main stem river (fig. 1). Wetland areas that appear isolated in figure 1 are likely connected to the surface-water-flow system by small streams that in most cases that not apparent in the smaller scale (1:25,000) stream data. Because of their position low in the landscape and flow system, most wetlands in the basin probably are predominantly in areas of ground-water discharge (Motts and O’Brien, 1981).
22 Simulation of Ground-Water Flow and Evaluation of Water-Management Alternatives in the Assabet River Basin, Eastern MA
BARTLETT POND
LAKE BOON
CHAUNCY LAKEDELANEY POND
WHEELER POND
227
228
229
230
231
232
270
271
272
273
274
275
184
185
186
187
188
189
278
279
280
281
282
283
227
228
229
230
231
232
187
188
189
190
191
192
222
223
224
225
226
227
WHITE POND
173
174
175
176
177
178
ASSABET RIVER BEN SMITH IMPOUNDMENT
204
205
206
207
208
209
ASSABET RIVER HUDSON IMPOUNDMENT
WAT
ER
LE
VE
L, IN
FE
ET
AB
OV
E N
GV
D 2
9
307
308
309
310
311
312
A1 IMPOUNDMENT
J F M A M SJ J A O N DS O N D
2001 2002J F M A M SJ J A O N DS O N D
2001 2002J F M A M SJ J A O N DS O N D
2001 2002
Figure 11. Measured water levels, September 2001 through December 2002, at selected ponds and impoundments in the Assabet River Basin, eastern Massachusetts.
Water Use and Management
Information on water use and management was collected to quantify inflows and outflows of water from the ground- and surface-water-flow systems in the basin. Water withdrawals for public supply, agricultural, and other uses are outflows from the aquifers and streams. After use, most of the water that is withdrawn for these purposes is returned to ground or surface water as wastewater. Water imported for public supply from sources outside of the basin represents an inflow when it is discharged to ground or surface water after use. Some water is used consumptively; this water is a net outflow in areas of private water supply and waste disposal. In publicly supplied
areas, consumptive use is not a separate outflow from ground- or surface-water-flow systems, but is included in the imbalance between water withdrawals and wastewater return flows. Finally, infiltration of ground water into sewers is an outflow from the ground-water-flow system. When this water is discharged to streams as part of the treated wastewater from a municipal facility, it becomes an inflow to surface water. Inflows and outflows to the ground- and surface-water-flow systems from water use and management are shown schematically in figure 12. Overall, water use and management in the Assabet River Basin result in a net import of water, primarily as waste-water, and a net transfer of water from ground-water to surface-water-flow systems.
Ground- and Surface-Water Resources 23
GROUND-WATER- and SURFACE-WATER-FLOW SYSTEMS
ASSABET RIVER BASIN
Littleton,Shrewsbury
Westford
MWRA
Wastewater-Treatment Facilities
ConsumptiveUse
Septic Systems
Ground Water (-6.4)
Surface Water (+8.5)
Water Use
Hopkinton,Shrewsbury,Westborough
Water Supply
Waste-waterDisposal
2.6
4.5
3.7
1.7
1.50.3
2.211
7.2
0.1
3.5
0.2
0.4
0.7
1.3-2.0
4.3
0.7
0.8
3.2-3.9
0.7
EXPLANATION
WATER TRANSFER—Line thickness is proportional to volumetric flow rate. All volumes in million gallons per day.
1 million gallons per day
2 million gallons per day
5 million gallons per day
0.3
1.8
PW
WMA
PW WMA PW
WMA
I/I
UNACC
PrivW
Unper
Figure 12. Water use and return flows in the Assabet River Basin in eastern Massachusetts. Water withdrawals and discharges are average annual rates for 1997–2001; consumptive-use, septic-system return flow, and unaccounted-for water are annual averages for 2000. I/I, infiltration to sewers; MWRA, Massachusetts Water Resources Authority; PrivW, private-water consumptive use; PW, public-water withdrawal or consumptive use; UNACC, unaccounted-for water; Unper, unpermitted agricultural and golf-course consumptive use; WMA, nonmunicipal permitted withdrawal or consumptive use. Positive (+) and negative (-) values are net gains and losses, respectively, from surface water and ground water.
24 Simulation of Ground-Water Flow and Evaluation of Water-Management Alternatives in the Assabet River Basin, Eastern MA
Water Supply and Consumptive Use
Public-water systems (municipal or publicly owned systems) supply most water users in 12 of the 20 towns in the Assabet River Basin (table 7), serving about 80 percent of the basin population and about half of its area (fig. 13). Most publicly supplied water is obtained from within the basin, primarily from wells but also from several reservoirs (table 8 and fig. 14). Several towns that are only partly within the basin have water sources in the adjacent Blackstone, Concord, Nashua, or Sudbury River Basins as well as in the Assabet River Basin (table 9). The Massachusetts Water Resources Authority (MWRA) also supplies water to Marlborough, Northborough, and Clinton from sources in central Massachusetts.
Public-supply withdrawals from sources in the basin averaged 9.4 Mgal/d in 1997–2001 (table 8). Most (77 percent) public-supply withdrawals were from ground water (fig. 12), and ground-water withdrawals for public supply were nearly all (98 percent) from stratified glacial deposits. During the study period, total withdrawals by public-water systems in most towns in the basin were at or near their current permitted limits under the Massachusetts Water Management Act (WMA; table 9). Withdrawals were greatest in May, June, and July (fig. 15). Withdrawals likely were greater in these months because of outdoor water use, which is partly or wholly consumptive. This seasonal pattern also is apparent in per capita water-use rates in early summer, which average 30 percent greater than rates in November through March.
Imported water for public-supply use from MWRA for Marlborough and Northborough averaged about 1.7 Mgal/d in 1997–2001 (fig. 12). Water imported from MWRA for the small area of Clinton in the basin is not considered in this study, because it is disposed of outside of the Assabet River Basin. The estimate for Marlborough includes an apportionment, based on town area in and out of the basin, of the total amount of MWRA water supplied to Marlborough. The estimate for Marlborough may be higher than is typical because nearly all of Northborough’s water was supplied by MWRA in 2001, which was a temporary arrangement. Most of the MWRA imported water is delivered to wastewater-treatment facilities after use (fig. 12). Little information is available on volumes of water imported (or exported) from sources in adjacent basins through the public-supply water-distribution systems of the individual towns (table 9). However, the volumes of imported or exported
water are likely to be small, except in Shrewsbury, a densely populated town in which all water used in the basin in 1997–2001 originated in the adjacent Blackstone River Basin.
In the eight towns in the basin without public-water systems (table 7), private water companies or domestic wells supply water to residential, industrial, and other users. Nonmunicipal drinking-water sources are entirely from ground water, and include wells in bedrock and stratified glacial deposits. Data on locations and withdrawal rates for these sources are limited; however, comparison of public-water and sewer systems (fig. 13) indicates that areas without public water are not sewered. Consequently, water withdrawn through private water systems and wells is returned to the aquifers through on-site disposal, except for water that is used consumptively.
Consumptive use by publicly and privately supplied users was estimated from an analysis of seasonal water use in 11 publicly supplied towns (all publicly supplied towns except Clinton, for which no water-use data were collected; table 7) and land-use data. For this study, consumptive use is defined as the component of a water-supply withdrawal that is removed permanently from the ground- or surface-water system, through evaporation or other processes. Consumptive use was assumed to result from irrigation or other water use during the high- use months of spring, summer, and fall. Consumptive use (volumetric rates) in each month from April through October for each town was calculated as the difference between with-drawals in the month and the mean withdrawal rate in the low-use winter months of November through March. Months were identified as low- or high-use months based on the seasonal patterns of public-supply withdrawals in 1997–2001 (fig. 15). Areal rates were calculated by applying volumetric rates for each town to the developed land uses in publicly supplied areas in the towns, which were identified as areas of residential, commercial, industrial, and urban public land use within the extent of public-water systems. Monthly areal rates of con-sumptive water use ranged from 0.4 in/yr in April to 2.59 in/yr in July; the mean annual rate was 0.92 in/yr. These rates were applied to developed land-use areas in privately supplied towns to estimate a mean annual consumptive use for privately supplied parts of the basin of 0.72 Mgal/d. This volume is a net outflow from the ground-water system in privately supplied, developed areas (fig. 16). Consumptive use in publicly supplied parts of the basin was estimated similarly at 0.71 Mgal/d.
Ground- and Surface-Water Resources 25
This volume is not a separate outflow from the ground- or surface-water systems in publicly supplied areas, as mentioned previously, because it is included in the difference between public-water withdrawals and municipal wastewater discharges. This approach to estimating consumptive use does not take into account any differences in population density or land use between publicly and privately supplied areas; therefore, consumptive use in privately supplied areas (which are likely to be less densely populated) may be over- or underestimated. This approach also does not quantify variation in rates of consumptive use among land uses.
Withdrawals by several large industrial, agricultural, and golf-course users averaged 0.43 Mgal/d in 1997–2001 (table 8). These consist of withdrawals greater than 100,000 gal/d that are permitted under the WMA. The nonmunicipal WMA withdrawals are mostly from surface-water sources, including the Assabet River, tributary streams, and ponds; wells in stratified glacial deposits and bedrock also are used (fig. 12). Seasonally, these withdrawals peak in mid- to late summer, because of increased irrigation by agricultural and golf-course users. Industrial uses usually are constant throughout the year.
1Value applies to area of town in basin.2Includes use reported as semiresidential.
Table 7. Population on public water and sewer and per capita water use in the Assabet River Basin, eastern Massachusetts, 2000.
[Total population: From U.S. Census Bureau, 2003. Population on public water and sewer: From U.S. Census Bureau, 2003, and town water departments. Estimated residential water use: From 2000 public water-supply statistical reports from towns to the Massachusetts Department of Environmental Protection. Estimated per capita use in summer: Average use in May, June, and July. Estimated per capita use in winter: Average use from December through March. gal/person/d, gallons per person per day; Mgal/d, million gallons per day; --, not determined]
Town
Proportionof town in basin(percent)
Total population
Population on public water and sewer (percent)
Estimated public-supply
residentialwater use(Mgal/d)
Estimated per capita use(gal/person/d)
Water Sewer Annual Summer Winter
Acton 100 20,331 94 0 1.39 73 82 68Berlin 100 2,380 0 0 0 -- -- --Bolton 72 4,148 0 0 0 -- -- --Boxborough 66 4,868 0 0 0 -- -- --Boylston 24 4,008 10 0 0 -- -- --Carlisle 29 4,717 0 0 0 -- -- --Clinton 15 13,435 100 100 0 -- -- --Concord 36 15,537 95 38 1.20 82 98 68Grafton 7 14,894 10 10 0 -- -- --Harvard 22 5,981 10 0 0 -- -- --Hudson 94 18,113 94 82 1.21 71 80 66Littleton 42 8,184 80 0 2.48 73 80 58Marlborough 43 36,255 99 92 2.29 64 73 57Maynard 100 10,433 100 95 .57 55 56 53Northborough 94 14,013 85 20 .67 56 66 50Shrewsbury 37 31,640 97 85 2.51 82 97 74Stow 100 5,902 0 0 0 -- -- --Sudbury 9 16,841 1100 0 1.19 71 110 76Westborough 41 17,997 95 85 1.22 71 68 58Westford 24 20,754 75 0 1.35 87 94 47
Average -- -- -- -- -- 73 82 61
26 Simulation of Ground-Water Flow and Evaluation of Water-Management Alternatives in the Assabet River Basin, Eastern MA
0 1 2 3 4 5 MILES
0 2 KILOMETERS41 3 5From USGS and MassGIS data sources, Massachusetts State Plane Coordinate System, Mainland Zone.
EXPLANATION
TILL OR BEDROCK
STRATIFIED GLACIAL DEPOSITS BASIN BOUNDARY
TOWN BOUNDARY
PUBLIC-WATER DISTRIBUTION LINE
SEWER LINE
MUNICIPAL WASTEWATER DISCHARGE
71o36'
71o24'
42o18'
42o24'
42o30'
Figure 13. Public-water and sewer systems in the Assabet River Basin, eastern Massachusetts.
Ground- and Surface-Water Resources 27
Table 8. Permitted water-supply withdrawals and wastewater discharges in the Assabet River Basin, eastern Massachusetts.
[Identifier: See figure 14 for locations. Source type: GWSG, ground water, stratfied glacial deposits; GWB, ground water, bedrock; SW, surface water. Subbasin: MS, Main stem; Head, Headwaters. Maximum permitted withdrawal rate: Data from B.R. Bouck, Massachusetts Department of Environmental Protection, written commun., 2003; rates for industrial, agricultural, and golf-course sources are mean annual rates. No., number; Mgal/d, million gallons per day; --, not applicable or not known]
Identifier Source name SubbasinSource
type
Well depth(feet)
Mean annual withdrawal or discharge rate,
1997–2001 (Mgal/d)
Maximumpermitted
withdrawalrate
(Mgal/d)
Public-Supply Withdrawals
AN-01G Acton Whitcomb Well Fort Pond Brook GWSG 35 0.12 0.35AN-02G Acton Conant Well Nashoba Brook GWSG 34 .14 .47AN-03G Acton Lawsbrook Well Fort Pond Brook GWSG 53 .16 .15AN-04G Acton Christofferson Well Fort Pond Brook GWSG 40 .19 .40AN-05G Acton Assabet Well No. 1 Assabet MS Lower GWSG 68 .30 .50
AN-06G Acton Assabet Well No. 2 Assabet MS Lower GWSG 59 .36 .50AN-07G Acton Clapp Well Fort Pond Brook GWSG 36 .07 .35AN-08G Acton Scribner Well Fort Pond Brook GWSG 29 .10 .15AN-09G Acton Marshall Well Nashoba Brook GWSG 31 .03 .30AN-10G Acton Kennedy Wells No. 1–4 Nashoba Brook GWSG 35 .37 .54
AN-11G Acton Conant II Wells No. 1–5 Nashoba Brook GWSG 28 .09 .43CN-01S Concord Nagog Pond Nashoba Brook SW -- .30 --CN-01G Concord Second Division Well Assabet MS Lower GWSG 80 .58 .85HD-01S Hudson Gates Pond Reservoir Assabet MS Middle SW -- .16 --HD-01G Hudson Rimkus Well Assabet MS Middle GWSG 60 .00 --
HD-02G Hudson Kane Well Fort Meadow Brook GWSG 64 .16 .50HD-03G Hudson Chestnut Street Well No. 1 Fort Meadow Brook GWSG 48 .61 .75HD-04G Hudson Chestnut Street Well No. 2 Fort Meadow Brook GWSG 56 .69 1.01HD-05G Hudson Chestnut Street Well No. 3 Assabet MS Middle GWSG 47 .43 1.01ML-01S Marlborough Millham Reservoir Assabet MS Middle SW -- 1.55 --
ML-02S Marlborough Lake Williams Reservoir Assabet MS Middle SW -- 1-- --MN-01S Maynard White Pond Assabet MS Middle SW -- .23 --MN-01G Maynard Old Marlborough Road Well
Nos. 1 and 2Taylor Brook GWSG 46,49 .30 .58
MN-02G Maynard Old Marlborough Road Well No. 3
Taylor Brook GWSG 44 .14 .29
MN-03G Maynard Great Road Well No. 4 Taylor Brook GWSG 73 .12 .38
MN-04G Maynard Rockland Avenue Wells Nos. 2, 3, and 5
Fort Pond Brook GWB 355–470
.16 1.13
NB-01G Northborough Brigham Street Well Assabet MS Upper GWSG 60 .34 .45NB-02G Northborough Lyman Street Well Stirrup Brook GWSG 57 .00 --NB-03G Northborough Crawford Street Well Cold Harbor and
Howard BrooksGWSG 52 .32 .44
NB-04G Northborough Howard Street Well Cold Harbor and Howard Brooks
GWSG 41 .13 .29
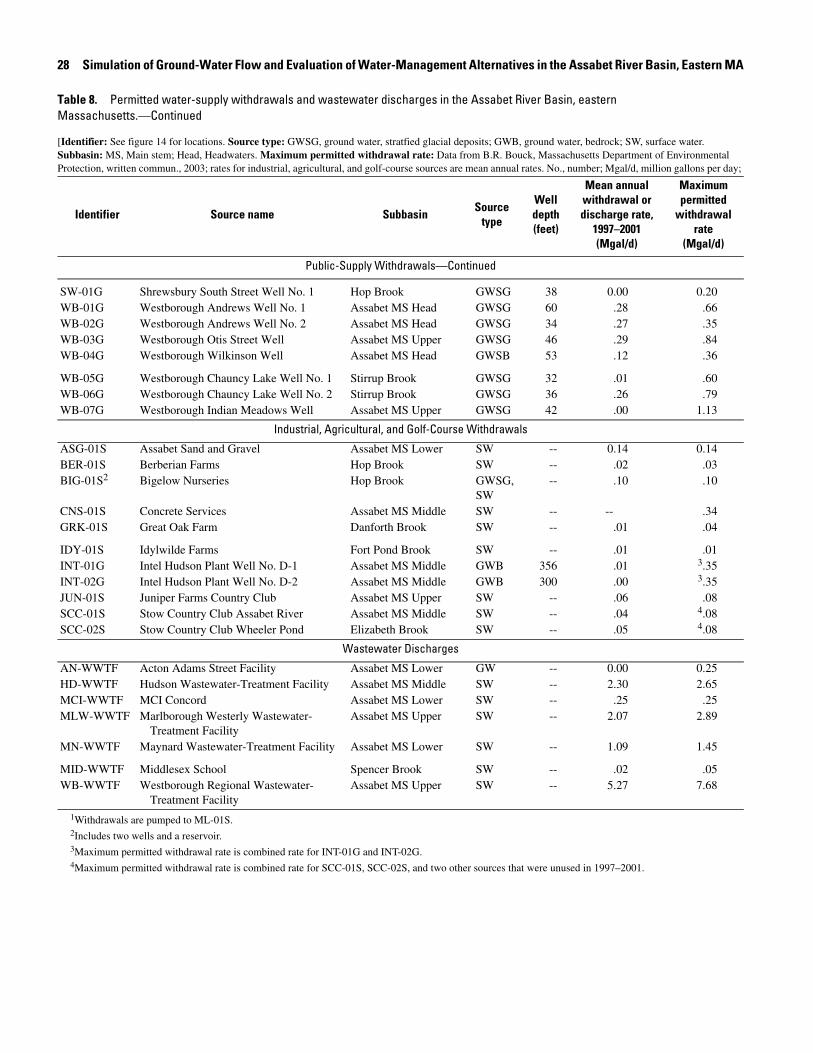
28 Simulation of Ground-Water Flow and Evaluation of Water-Management Alternatives in the Assabet River Basin, Eastern MA
1Withdrawals are pumped to ML-01S.2Includes two wells and a reservoir.3Maximum permitted withdrawal rate is combined rate for INT-01G and INT-02G.4Maximum permitted withdrawal rate is combined rate for SCC-01S, SCC-02S, and two other sources that were unused in 1997–2001.
Public-Supply Withdrawals—Continued
SW-01G Shrewsbury South Street Well No. 1 Hop Brook GWSG 38 0.00 0.20WB-01G Westborough Andrews Well No. 1 Assabet MS Head GWSG 60 .28 .66WB-02G Westborough Andrews Well No. 2 Assabet MS Head GWSG 34 .27 .35WB-03G Westborough Otis Street Well Assabet MS Upper GWSG 46 .29 .84WB-04G Westborough Wilkinson Well Assabet MS Head GWSB 53 .12 .36
WB-05G Westborough Chauncy Lake Well No. 1 Stirrup Brook GWSG 32 .01 .60WB-06G Westborough Chauncy Lake Well No. 2 Stirrup Brook GWSG 36 .26 .79WB-07G Westborough Indian Meadows Well Assabet MS Upper GWSG 42 .00 1.13
Industrial, Agricultural, and Golf-Course Withdrawals
ASG-01S Assabet Sand and Gravel Assabet MS Lower SW -- 0.14 0.14BER-01S Berberian Farms Hop Brook SW -- .02 .03BIG-01S2 Bigelow Nurseries Hop Brook GWSG,
SW-- .10 .10
CNS-01S Concrete Services Assabet MS Middle SW -- -- .34GRK-01S Great Oak Farm Danforth Brook SW -- .01 .04
IDY-01S Idylwilde Farms Fort Pond Brook SW -- .01 .01INT-01G Intel Hudson Plant Well No. D-1 Assabet MS Middle GWB 356 .01 3.35INT-02G Intel Hudson Plant Well No. D-2 Assabet MS Middle GWB 300 .00 3.35JUN-01S Juniper Farms Country Club Assabet MS Upper SW -- .06 .08SCC-01S Stow Country Club Assabet River Assabet MS Middle SW -- .04 4.08SCC-02S Stow Country Club Wheeler Pond Elizabeth Brook SW -- .05 4.08
Wastewater Discharges
AN-WWTF Acton Adams Street Facility Assabet MS Lower GW -- 0.00 0.25HD-WWTF Hudson Wastewater-Treatment Facility Assabet MS Middle SW -- 2.30 2.65MCI-WWTF MCI Concord Assabet MS Lower SW -- .25 .25MLW-WWTF Marlborough Westerly Wastewater-
Treatment FacilityAssabet MS Upper SW -- 2.07 2.89
MN-WWTF Maynard Wastewater-Treatment Facility Assabet MS Lower SW -- 1.09 1.45
MID-WWTF Middlesex School Spencer Brook SW -- .02 .05WB-WWTF Westborough Regional Wastewater-
Treatment FacilityAssabet MS Upper SW -- 5.27 7.68
Table 8. Permitted water-supply withdrawals and wastewater discharges in the Assabet River Basin, eastern Massachusetts.—Continued
[Identifier: See figure 14 for locations. Source type: GWSG, ground water, stratfied glacial deposits; GWB, ground water, bedrock; SW, surface water. Subbasin: MS, Main stem; Head, Headwaters. Maximum permitted withdrawal rate: Data from B.R. Bouck, Massachusetts Department of Environmental Protection, written commun., 2003; rates for industrial, agricultural, and golf-course sources are mean annual rates. No., number; Mgal/d, million gallons per day;
Identifier Source name SubbasinSource
type
Well depth(feet)
Mean annual withdrawal or discharge rate,
1997–2001 (Mgal/d)
Maximumpermitted
withdrawalrate
(Mgal/d)
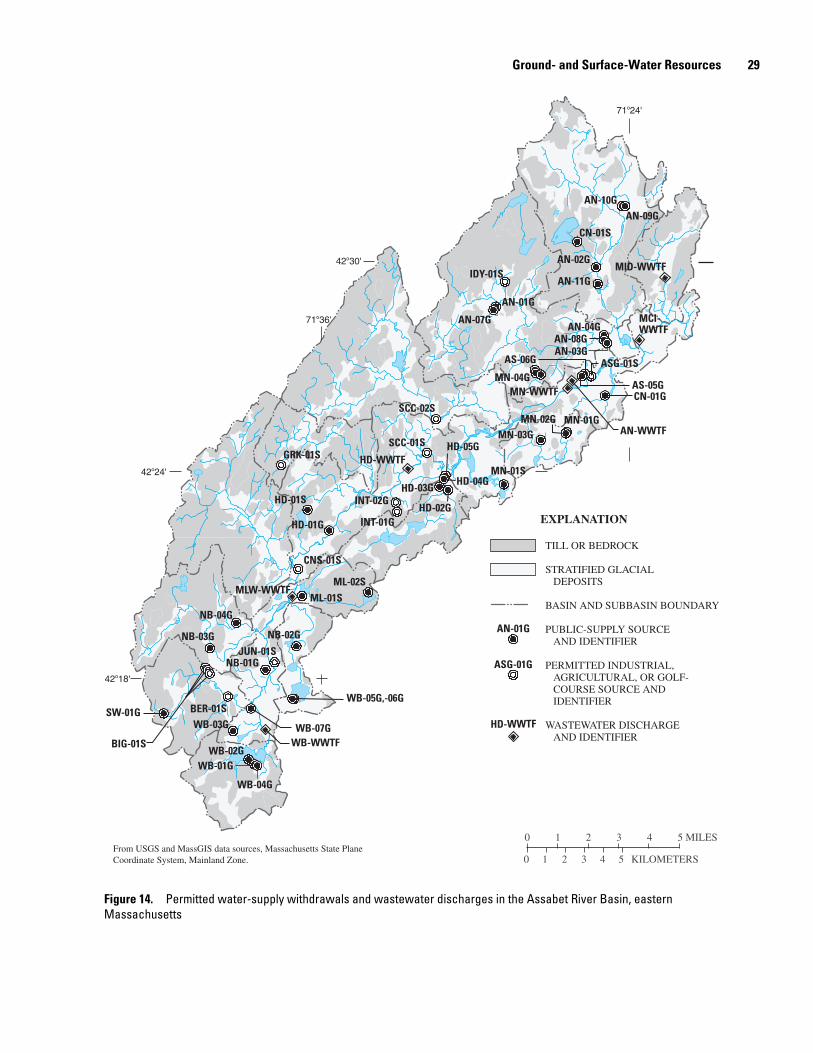
Ground- and Surface-Water Resources 29
EXPLANATION
TILL OR BEDROCK
STRATIFIED GLACIAL DEPOSITS
BASIN AND SUBBASIN BOUNDARY
PUBLIC-SUPPLY SOURCE AND IDENTIFIER
PERMITTED INDUSTRIAL, AGRICULTURAL, OR GOLF- COURSE SOURCE AND IDENTIFIER
WASTEWATER DISCHARGE AND IDENTIFIER
0 1 2 3 4 5 MILES
0 2 KILOMETERS41 3 5From USGS and MassGIS data sources, Massachusetts State Plane Coordinate System, Mainland Zone.
NB-04G
GRK-01S
JUN-01SNB-01G
WB-05G,-06G
WB-03G
WB-WWTF
NB-02G
BIG-01S
NB-03G
MLW-WWTF
CNS-01S
HD-01S
WB-04G
HD-03G
HD-02G
HD-WWTF
INT-01G
SCC-02S
MN-03G
CN-01G
IDY-01S
AS-05G
ASG-01S
MCI-WWTF
MID-WWTF
MN-01SHD-04G
HD-01G
MN-01G
SCC-01S
AN-10G
AN-02G
CN-01S
AN-01G
HD-WWTF
ASG-01G
WB-02GWB-01G
BER-01S
WB-07G
ML-01SML-02S
INT-02G
HD-05G
MN-02G
MN-WWTF
AN-01G
AN-07G
AN-09G
AN-11G
AN-04GAN-08G
AS-06G
MN-04G
AN-03G
SW-01G
AN-WWTF
71o36'
71o24'
42o18'
42o24'
42o30'
Figure 14. Permitted water-supply withdrawals and wastewater discharges in the Assabet River Basin, eastern Massachusetts
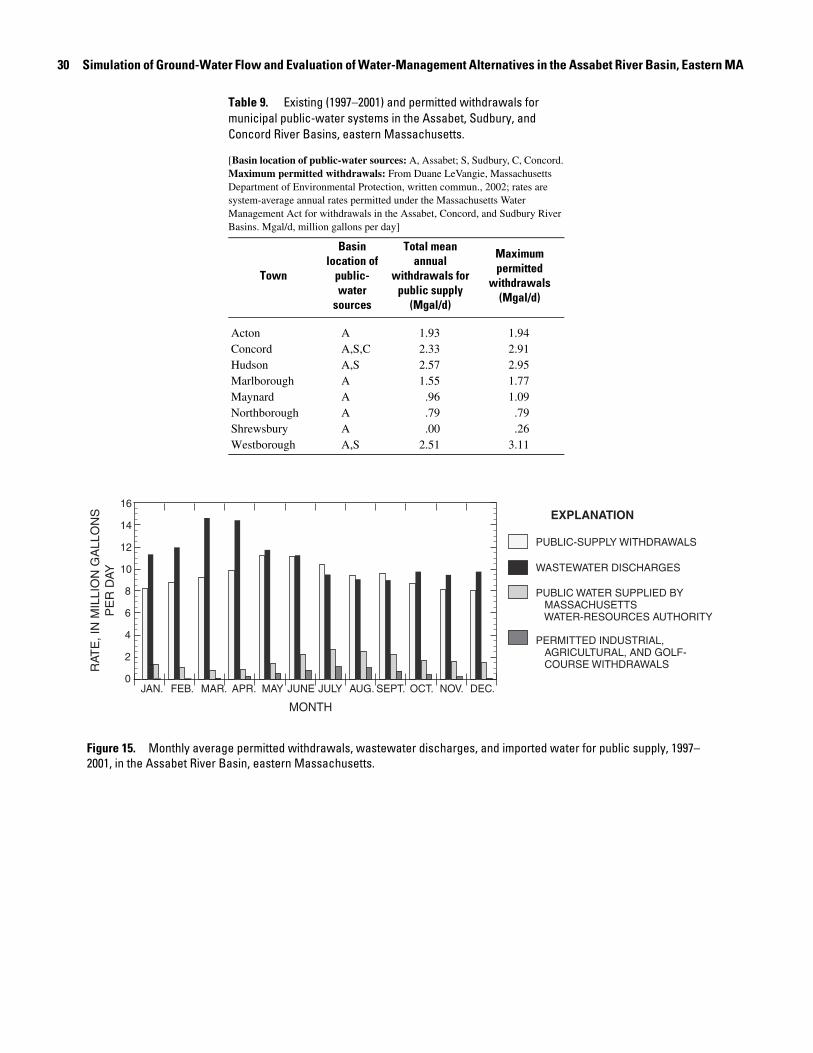
30 Simulation of Ground-Water Flow and Evaluation of Water-Management Alternatives in the Assabet River Basin, Eastern MA
Table 9. Existing (1997–2001) and permitted withdrawals for municipal public-water systems in the Assabet, Sudbury, and Concord River Basins, eastern Massachusetts.
[Basin location of public-water sources: A, Assabet; S, Sudbury, C, Concord. Maximum permitted withdrawals: From Duane LeVangie, Massachusetts Department of Environmental Protection, written commun., 2002; rates are system-average annual rates permitted under the Massachusetts Water Management Act for withdrawals in the Assabet, Concord, and Sudbury River Basins. Mgal/d, million gallons per day]
Town
Basin location of
public-water
sources
Total mean annual
withdrawals for public supply
(Mgal/d)
Maximum permitted
withdrawals (Mgal/d)
Acton A 1.93 1.94Concord A,S,C 2.33 2.91Hudson A,S 2.57 2.95Marlborough A 1.55 1.77Maynard A .96 1.09Northborough A .79 .79Shrewsbury A .00 .26Westborough A,S 2.51 3.11
JAN. FEB. MAR. APR. MAY SEPT.JUNE JULY AUG. OCT. NOV. DEC.
RAT
E, I
N M
ILLI
ON
GA
LLO
NS
P
ER
DAY
16
14
12
10
8
6
0
2
4
PUBLIC-SUPPLY WITHDRAWALS
PERMITTED INDUSTRIAL, AGRICULTURAL, AND GOLF- COURSE WITHDRAWALS
PUBLIC WATER SUPPLIED BY MASSACHUSETTS WATER-RESOURCES AUTHORITY
WASTEWATER DISCHARGES
EXPLANATION
MONTH
Figure 15. Monthly average permitted withdrawals, wastewater discharges, and imported water for public supply, 1997–2001, in the Assabet River Basin, eastern Massachusetts.
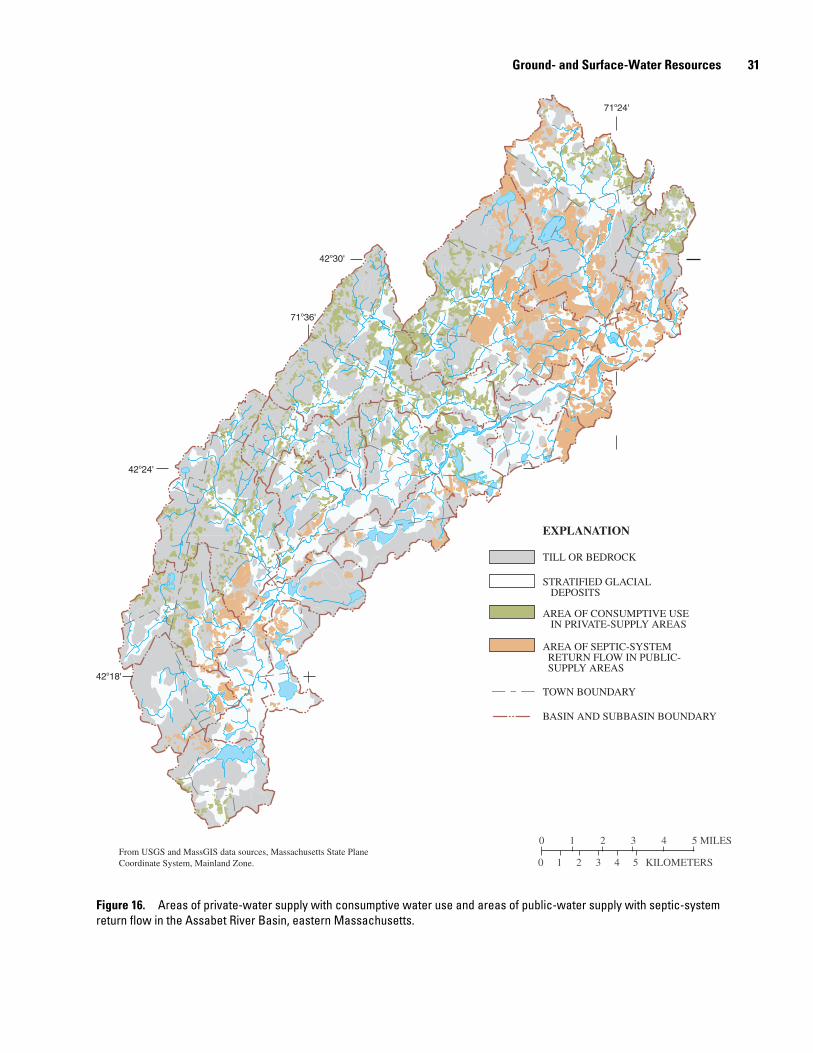
Ground- and Surface-Water Resources 31
EXPLANATION
AREA OF CONSUMPTIVE USE IN PRIVATE-SUPPLY AREAS
TILL OR BEDROCK
TOWN BOUNDARY
BASIN AND SUBBASIN BOUNDARY
AREA OF SEPTIC-SYSTEM RETURN FLOW IN PUBLIC- SUPPLY AREAS
STRATIFIED GLACIAL DEPOSITS
0 1 2 3 4 5 MILES
0 2 KILOMETERS41 3 5From USGS and MassGIS data sources, Massachusetts State Plane Coordinate System, Mainland Zone.
71o36'
71o24'
42o18'
42o24'
42o30'
Figure 16. Areas of private-water supply with consumptive water use and areas of public-water supply with septic-system return flow in the Assabet River Basin, eastern Massachusetts.
32 Simulation of Ground-Water Flow and Evaluation of Water-Management Alternatives in the Assabet River Basin, Eastern MA
Withdrawals by small and large agricultural and golf-course users in the Assabet River Basin are generally considered to be entirely consumptive (Barbara Kickham, Massachusetts Department of Environmental Protection, written commun., 2003). Data on water withdrawals by the large, permitted agricultural users were used to estimate consumptive use by the small, unpermitted users in privately supplied areas. Small agricultural users were identified as areas mapped in 1999 land-use data as nurseries and cropland. Mean annual consumptive use for nursery (0.04 mi2) and cropland (3.2 mi2) areas in the basin were estimated at 0.02 and 0.24 Mgal/d, respectively. Consumptive use by unpermitted golf-course withdrawals was estimated from application rates listed in the MADEP golf course water-use policy (Massachusetts Department of Environmental Protection, 2000) and the irrigated area of four unpermitted golf courses in the basin (Barbara Kickham, Massachusetts Department of Environmental Protection, written commun., 2003). Water use for agriculture and golf courses is seasonal, with maximum use in summer. Monthly mean rates of cropland use were estimated at 0.96 Mgal/d in June, July, and August; rates for nurseries ranged from 0.02 Mgal/d in November to 0.07 Mgal/d in July; and unpermitted golf-course withdrawals ranged from 0.008 Mgal/d in April to 0.22 Mgal/d in June, July, and August. Mean annual consumptive use by unpermitted golf courses in the basin was estimated at 0.08 Mgal/d. The unpermitted withdrawals may be from either surface water or ground water, but are shown as surface-water withdrawals in figure 12.
Wastewater Discharge and Return Flow
Municipal water-treatment facilities in Westborough, Marlborough, Hudson, and Maynard discharge treated waste-water into the Assabet River (fig. 14). These facilities treat wastewater from about 50 percent of the basin population, in eight towns. Additionally, wastewater from the MCI Concord prison facility is discharged to the Assabet River, and waste-water from Middlesex School in Carlisle is discharged to Spencer Brook (table 8). Total wastewater discharges averaged 11.0 Mgal/d in 1997–2001. Discharges from the four municipal facilities included water withdrawn from sources in and out of the basin: wastewater from Shrewsbury that originated from sources in the Blackstone River Basin is treated and discharged at the Westborough facility, and wastewater that was imported from MWRA is discharged at the Marlborough facility. The Marlborough facility also treats and discharges wastewater from Northborough (about 15 percent of total flows), but this water originated at sources in the Assabet River Basin. Seasonally, wastewater discharges are greatest in February,
March, and April (fig. 15). Soils are saturated and the water table is high, so that infiltration of ground water to sewers is greatest during these months.
Wastewater from unsewered areas is returned to the ground-water-flow system through on-site septic systems. Areas receiving septic-system return flow as a net inflow to the ground-water system were identified as areas of developed land use within public-water systems that were beyond the extent of existing sewer systems (fig. 13). The rates and spatial distribu-tion of septic-system return flow from residential water use was estimated from per capita water use, land use, and population data. Population densities per residential land-use type (multi-family residential, and high-, medium-, and low-density residential) were estimated from multiple regression of total population by town and area of each land-use type. Population densities determined by the regression were adjusted so that total population for each town equalled census data for year 2000. Septic-system return flow rates for residential areas were calculated by using the adjusted population densities and an average rate of nonconsumptive per capita water use for publicly supplied towns, about 60 gal/person/d (winter water-use rate; table 7). Return flow rates from water use in commercial, industrial, and urban public land-use areas were calculated from data on the number of employees per town per Standard Industrial Classification (SIC) Code for 2000 (Massachusetts Division of Employment and Training, 2003) and typical values of water use per employee per SIC code (Horn, 2000). Total commercial, industrial, and urban public water use was estimated for each town, and then apportioned to the study area by using the percentage of town area in the basin. Septic-system return flow rates thus calculated for land-use categories averaged 1.2 in/yr for low-density residential, 4.8 in/yr for medium-density residential, 10 in/yr for high-density residential, 33 in/yr for multi-family residential, and 13 in/yr for commercial, industrial, and urban public land use; the rates were assumed to be constant throughout the year. Summed across the entire study area, septic-system return flow was 4.34 Mgal/d, about 20 percent of which originated from water-supply sources outside of the basin (fig. 12).
Finally, infiltration to sewers is an outflow from the ground-water-flow system that can be estimated with informa-tion from the Wastewater Management Plans of towns in the Assabet Consortium. Infiltration to sewers was reported, as fractions of total wastewater flows, at 27 percent for Hudson, 32 percent for Marlborough, 26 percent for Maynard, 37 percent for Northborough, and 17 percent for Westborough and Shrewsbury (Camp, Dresser and McKee, 2002; Dufresne-Henry, 2001; Earth Tech, 2001e, 2002d; Fay, Spoffard, & Thorndike, 2001a). Rates vary seasonally, with maximum
Simulation of Ground-Water Flow 33
rates of infiltration in the spring, when the water table is high. Typical values in spring were reported at 35 to 45 percent of total wastewater flows. Applying these rates to 1997–2001 flows, and estimating infiltration for small areas of sewers in the study area in Concord and Clinton, infiltration to sewers in the basin was about 2.6 Mgal/d (fig. 12), or about 25 percent of average annual discharges from the municipal wastewater-treatment facilities.
Simulation of Ground-Water Flow
Ground-water levels and flow in the Assabet River Basin were simulated with the three-dimensional, finite-difference ground-water-flow modeling code, MODFLOW-2000 (Harbaugh and others, 2000). Steady-state and transient models were developed. The models were used to simulate water levels and flows in till and bedrock uplands and in stratified glacial deposits, but data were available to calibrate the model only in the stratified glacial deposits. The models were used to simulate average flow conditions from 1997 to 2001.
Steady-State Numerical Model
The steady-state numerical model simulated average annual conditions in the basin. Development of separate steady-state and transient models simplified model development and allowed for a two-step calibration approach, in which model-calculated average annual water levels and nonstorm streamflows first were matched to observed values with the steady-state model. The steady-state model also was useful for calculating average annual water balances and for evaluating the effects of alternative model practices on average annual nonstorm streamflows.
Spatial Discretization
The basin area was discretized into a grid of 700 rows and 290 columns of cells with uniform horizontal dimensions of 200 ft (fig. 17). The grid was rotated northeast at an angle of 45 degrees relative to north. Areas outside the basin boundary were inactive in the model. The vertical discretization consisted of two layers of variable thickness (fig. 18). The top of the upper layer (layer 1) was set equal to the land-surface elevation, which was interpolated from 30-meter digital-elevation-model data (Elassal and Caruso, 1983). The bottom of layer 1 was set equal to the top of the bedrock and till surface in the areas of stratified glacial deposits, except where stratified glacial deposits were
less than 10 ft. In these areas, the bottom of layer 1 was set at 10 ft below land surface. In upland areas, the bottom of layer 1 was set uniformly at 12 ft below land surface, consistent with typical till thicknesses in the basin, as described previously. The bottom of the lower layer (layer 2) was set at a constant elevation of 200 ft below NGVD 29.
Boundary Conditions
The horizontal boundaries of the active model area were defined as a no-flow boundary that coincides with the boundary of the Assabet River Basin (fig. 17). In most areas, the basin boundary is in relatively low-permeability till and bedrock uplands. The use of the surface-water boundary to delineate a no-flow boundary was based on the assumption that ground- and surface-water divides coincide. This assumption was reasonable for the stratified glacial deposits and for shallow flow paths in the uplands and underlying bedrock, because of the rolling topography, distribution of permeable stratified glacial deposits in the lowlands, and close connection between surface and ground water in the basin. Where pumping wells are close to divides in stratified glacial deposits (for example, near Chauncy Lake in Westborough or near the confluence with the Sudbury River in Concord), surface- and ground-water divides may deviate locally. These deviations, however, are likely to be small. Fracture systems in bedrock also may result in flow across basin boundaries along deep flow paths; however, little data were available on these flow systems at a regional scale for use in the model simulation.
Both model layers were simulated by using a fixed-transmissivity approach. For layer 2, this approach is equivalent to simulating a confined aquifer and conforms to a conceptual model of flow in bedrock where the water table is in the surficial layer. Simulating layer 1, which represents the till and stratified glacial deposits, with the fixed-transmissivity approach also is reasonable in areas of thick stratified glacial deposits, where changes in saturated thickness from the seasonally fluctuating water table are small relative to total saturated thickness. In till areas and areas of thin stratified glacial deposits, water-table fluctuations may represent significant fractions of the total saturated thickness. In these areas, transmissivity may be underestimated during periods of high water levels and overestimated during periods of low water levels with this approach. The fixed-transmissivity approach was necessary, however, because numerical instabilities resulting from the fluctuating water table in the steeply sloping, thinly saturated stratified glacial deposits near the upland boundaries prevented model convergence when a variable transmissivity was simulated.

34 Simulation of Ground-Water Flow and Evaluation of Water-Management Alternatives in the Assabet River Basin, Eastern MA
0 1 2 3 4 5 MILES
0 2 KILOMETERS41 3 5
From USGS and MassGIS data sources, Massachusetts State Plane Coordinate System, Mainland Zone.
EXPLANATION
SIMULATED GROUND-WATER WITHDRAWAL
Till or bedrock
SIMULATED SURFACE-WATER WITHDRAWAL
SIMULATED SURFACE-WATER INFLOW
HORIZONTAL HYDRAULIC- CONDUCTIVITY (Kh) ZONES OF STRATIFIED GLACIAL DEPOSITS
Kh = 45 feet per day Kh = 70 feet per dayKh = 110 feet per day
Pond
Stream
700
501
100
150
200
250
650
600
550
500
450
400
350
300
250
200
150
100
50
1
BOUNDARY OF THE ACTIVE MODEL AREA
RO
WS
COLUMNS
SIMULATED HYDROGEOLOGY N
Line ofsection
shown infigure 18
Figure 17. Model area, grid, hydraulic-conductivity zones, and simulated ponds, streams, water withdrawals, and surface-water inflows for ground-water-flow models of the Assabet River Basin, eastern Massachusetts.
Simulation of Ground-Water Flow 35
MO
DE
L C
OL
UM
N
ELEVATION, IN FEET ABOVE NGVD 29
050100
150
200
250
170
180
190
200
210
220
230
240
250
260
EX
PL
AN
AT
ION
HO
RIZ
ON
TAL
HY
DR
AU
LIC
-CO
ND
UC
TIV
ITY
(K
h)Z
ON
ES
OF
STR
AT
IFIE
D G
LA
CIA
L D
EPO
SIT
S—L
ayer
1
TIL
L A
ND
BE
DR
OC
K—
Lay
er 1
Kh =
45
feet
per
day
BE
DR
OC
K—
Lay
er 2
Kh =
110
fee
t per
day
Kh =
70
feet
per
day
INA
CT
IVE
SIM
UL
AT
ED
ST
RE
AM
Figu
re 1
8.
Verti
cal d
iscr
etiza
tion
for g
roun
d-w
ater
-flow
mod
els
of th
e As
sabe
t Riv
er B
asin
, eas
tern
Mas
sach
uset
ts. P
art o
f mod
el ro
w
191
is s
how
n. S
ectio
n lin
e is
sho
wn
in fi
gure
17.
36 Simulation of Ground-Water Flow and Evaluation of Water-Management Alternatives in the Assabet River Basin, Eastern MA
Streams were simulated as head-dependent flow bound-aries with a version of the Stream Package (Prudic, 1989) that is compatible with MODFLOW-2000. This package simulates hydraulic interaction between the aquifer and adjoining streams and routes water between adjacent simulated stream reaches. Water may flow either into or out of the simulated aquifer. Flow, or leakage, is calculated by multiplying the specified streambed conductance by the difference between the stream stage and the water level in the underlying aquifer. Simulated streams may go dry when stream leakage to the aquifer exceeds inflows from upstream reaches.
Simulated streams included perennial and intermittent streams delineated in the available 1:25,000 scale hydrographic data (MassGIS, 2001). Nearly all streams in the data were simulated, including mapped stream channels in wetlands. Streams reaches (10,460 model cells) were grouped into 692 stream segments. This dense stream network (fig. 17) was simulated because of the strong control that streams, acting as ground-water discharge areas, exert on ground-water levels and flow directions in the basin. Stream-stage elevations were determined by using geographic information system (GIS) software to interpolate between 3-meter topographic contours (MassGIS, 2001) along simulated streams. Interpolated stream-stage elevations at dams were adjusted manually using informa-tion from topographic maps, surveyed river profiles for flood-insurance studies (U.S. Department of Housing and Urban Development, 1978, 1979a–f, 1981, 1982a–c, 1988a–c, 1999), dam-safety inspection reports, and as-built plans for flood-control structures (William Saloma, Massachusetts Department of Conservation and Recreation, written commun., 2002). Streambed elevations ranged from 1 to 4 ft below stream stage, depending on the size of the stream as represented by the Strahler stream order (Gordon and others, 1992).
Stresses
Recharge and Evapotranspiration
A number of processes and water fluxes were simulated with the MODFLOW-2000 recharge matrix. These processes included aquifer recharge from precipitation, evapotranspira-tion of ground water in wetlands, septic-system return flow, consumptive use in privately supplied areas, consumptive use by unpermitted agriculture, and infiltration of ground water to sewers. The Recharge package was used to apply all recharge fluxes to the active model area as specified fluxes to the upper model layer. The Evapotranspiration Package of MODFLOW-2000 also was used to simulate water flux.
Precipitation recharge rates were specified separately for stratified glacial deposits, till and bedrock upland areas, and kettle ponds. Precipitation recharge rates for stratified glacial deposits and upland areas were determined from literature sources, analysis of streamflow records, and a water-balance analysis of climate data, as described previously, and were adjusted during model calibration within a range of reasonable values. Final recharge rates for the calibrated model were
28.2 in/yr for stratified glacial deposits, 22.5 in/yr for till and bedrock uplands, and 1.8 in/yr for kettle ponds. The recharge rate for kettle ponds equaled the difference between mean monthly precipitation and PET, where PET was determined by an estimate of the Penman method, as described previously, averaged over the annual cycle.
Wetlands and ponds drained by streams (fig. 1) were simulated as areas of no recharge or net loss from the ground-water-flow system. These features were treated as areas of ground-water discharge, where, on average, water levels were equal to or less than the surrounding water table (Carter and Novitzki, 1988). Soils that are saturated during most of the year and low-permeability sediments likely result in no net recharge of water to aquifers from precipitation in most wetlands in the basin, under natural conditions. Precipitation onto saturated wetlands and ponds drained by streams becomes direct stream runoff and does not result in ground-water recharge or consti-tute a component of the base flow that is simulated by the ground-water-flow models. Therefore, ground water discharging to wetlands and instream ponds was subject to evapotranspiration and (or) ran off as streamflow. This concep-tual model of the role of wetlands in the hydrologic system is consistent with several studies of wetlands in the New England valley-fill aquifer setting (Motts and O’Brien, 1981). Zero recharge was specified in the Recharge Package for wetlands in uplands. These wetlands are likely to dry out during the growing season (May through October), when evapotrans-piration is greatest, or may be perched and not well connected to the regional flow system. Evapotranspiration loss rates were specified for wetlands in areas of stratified glacial deposits and for impoundments and instream ponds, based on estimated monthly Penman PET rates. For areas of open water (ponds and impounded reaches of streams), where water availability is not limited, the loss rate was equal to the estimated mean annual PET rate, 42.1 in/yr. For wetlands, a loss rate equal to the growing-season PET rate, 29.4 in/yr, was specified in the Recharge Package.
Evapotranspiration (ET) of ground water from areas not mapped as wetlands was simulated with the Evapotranspiration Package. This package simulates evapotranspiration as a water loss at a rate that varies linearly from a specified maximum, when and where the water table is at (or above) land surface, to zero at a specified depth (extinction depth). The package was activated only for areas of stratified glacial deposits (fig. 17); it was expected that simulated water levels in uplands likely would not be accurate enough to appropriately simulate ground-water ET with the Evapotranspiration Package in upland areas. The specified maximum ground-water evapotranspiration rate was equal to the estimated Penman growing-season PET rate, 29.4 in/yr. Extinction depths varied among subbasins from 2 to 6 ft. Smaller values for extinction depth were used in upland tributaries, where water levels in stratified glacial deposits were more influenced by higher water levels in adjacent uplands and model discretization effects. Larger values were used in main stem Assabet River subbasins and other areas, where stratified glacial deposits are more extensive.
Simulation of Ground-Water Flow 37
Septic-system return flow, consumptive use in privately supplied areas, consumptive use by unpermitted agricultural uses, and infiltration of ground water to sewers were simulated with gain or loss rates equal to the mean annual rates that were determined, as described previously, from water-use, land-use, population, and other data. Septic-system return flow was simulated in areas of publicly supplied water use and on-site disposal (fig. 16). Rates varied among land-use categories and towns, averaging 1.2 in/yr for low-density residential (11.5 mi2 or about 8,000 model cells), 4.8 in/yr for medium-density residential (5.8 mi2 or about 4000 model cells), 10 in/yr for high-density residential (0.1 mi2 or about 70 model cells), 33 in/yr for multifamily residential (0.5 mi2 or about 350 model cells), and 13 in/yr for commercial, industrial, and urban public land use (3.1 mi2 or about 2,200 model cells), as described previously. Consumptive use in areas of privately supplied water use (fig. 16) was simulated as a loss rate of 0.92 in/yr. Consumptive use by unpermitted agriculture was simulated as loss rates of 1.2 in/yr for areas mapped as cropland (about 2,200 model cells) and 10.6 in/yr for areas mapped as nurseries (about 30 model cells); note that these areas, especially nurseries, were limited in extent. Finally, infiltration of ground water to sewers was simulated as a loss rate that averaged 4.4 in/yr. The rate varied among towns, based on their reported rates of infiltration, from 2.5 to 6.1 in/yr. The loss rate for infiltration to sewers was applied to model cells based on the locations of existing sewer lines (fig. 13).
Water Withdrawals and Discharges
Water withdrawals from wells and reservoirs for public supply and withdrawals from wells, ponds, and streams for permitted agricultural, industrial, and golf-course uses (fig. 17 and table 8) were simulated with the Well Package of MODFLOW-2000. Wells screened in stratified glacial deposits and pond sources were simulated in layer 1, and bedrock wells were simulated in layer 2. Flow rates in the steady-state model (table 10) were equal to mean annual withdrawal rates for 1997–2001 for most sources (tables 8 and 10). For sources in Maynard, the total mean annual withdrawal rate for the system in 1997–2001 was distributed among sources proportionately to the withdrawals of the sources in 2001. In July 2000, withdrawals began from new bedrock wells (MN-04G); withdrawals from Maynard’s surface-water source, White Pond (MN-01S), ended in this year. The 2001 distribution of withdrawals in Maynard was used in the model as the best representation of the current distribution of withdrawals among Maynard sources. Permitted sources that were not used in 1997–2001 (table 8) were not included in the model simulation, unless needed for model scenarios. Water use by unpermitted golf courses also was simulated with the Well Package (table 10 and fig. 17). These withdrawals may be from ground or surface water, but they were simulated with the Well Package for simplicity. Wastewater discharges to the Assabet River and Spencer Brook (table 8) were simulated as specified inflows at the beginning of stream reaches in the Stream Package.
Hydraulic Properties
Hydraulic properties required for the steady-state simulations were horizontal and vertical hydraulic conductiv-ities and streambed conductances. Horizontal hydraulic con-ductivities (Kh) for stratified glacial deposits, till, and bedrock were determined from literature sources, aquifer-test data from public-supply wells, and lithologic logs from wells and bore-holes, and were modified slightly during model calibration within a range of reasonable values. Horizontal hydraulic conductivity of the stratified glacial deposits was specified in three zones, coincident with the transmissivity zones described previously (fig. 3), at 45, 70, and 110 ft/d (fig. 17). Vertical hydraulic conductivities (Kv) were specified ratios of Kh:Kv of 20:1 for low- and medium-conductivity zones, and 10:1 for high-conductivity zones. These values are lower for fine-grained deposits and higher for coarse-grained deposits than values reported previously and were chosen to represent the expected heterogeneous character of sediments within the hydraulic conductivity zones. Horizontal and vertical hydraulic conductivities of till were specified at 10 and 0.1 ft/d, respec-tively. Horizontal and vertical hydraulic conductivities of bed-rock were specified at 0.01 ft/d for most of the model area. An area near the bedrock public-supply wells in Maynard was simulated as a high-conductivity zone, at 14 ft/d, based on a local-scale model and contributing-area study of that wellfield (Lyford and others, 2003).
Model areas used to simulate ponds were assigned hori-zontal and vertical hydraulic conductivity values of 10,000 ft/d. Simulating ponds as active model cells allowed pond levels to change as stresses changed in the aquifer. The large hydraulic conductivity value effectively simulates the lack of resistance to flow through the ponds, and results in little or no water-level change across adjacent pond cells and realistic flow patterns in the aquifer surrounding the ponds.
Streambed conductances were determined from literature sources and assumed stream geometries and calculated as (Prudic, 1989):
, (2)
where
Generally, streambed thickness and vertical hydraulic conduc-tivity are variable and mostly unknown. Values of 1 ft and 1 ft/d for TSB and KSB, respectively, were assumed, resulting in speci-fied streambed conductance values ranging from 1,000 to 3,000 ft2/d for small to large streams. These values of KSB are consis-tent with typical values of from 1 to 2 ft/d for streams in the glaciated northeastern United States (Rosenshein, 1968; DeLima, 1991; Prince and others, 1988; Dysart and Rheaume, 1999).
CSB is streambed conductance, in ft2/d;KSB is vertical hydraulic conductivity of the streambed, in
ft/d;LS is stream length, in ft;
WS is stream width, in ft; andTSB is streambed thickness, in ft.
CSBKSB LS WS••
TSB---------------------------------=
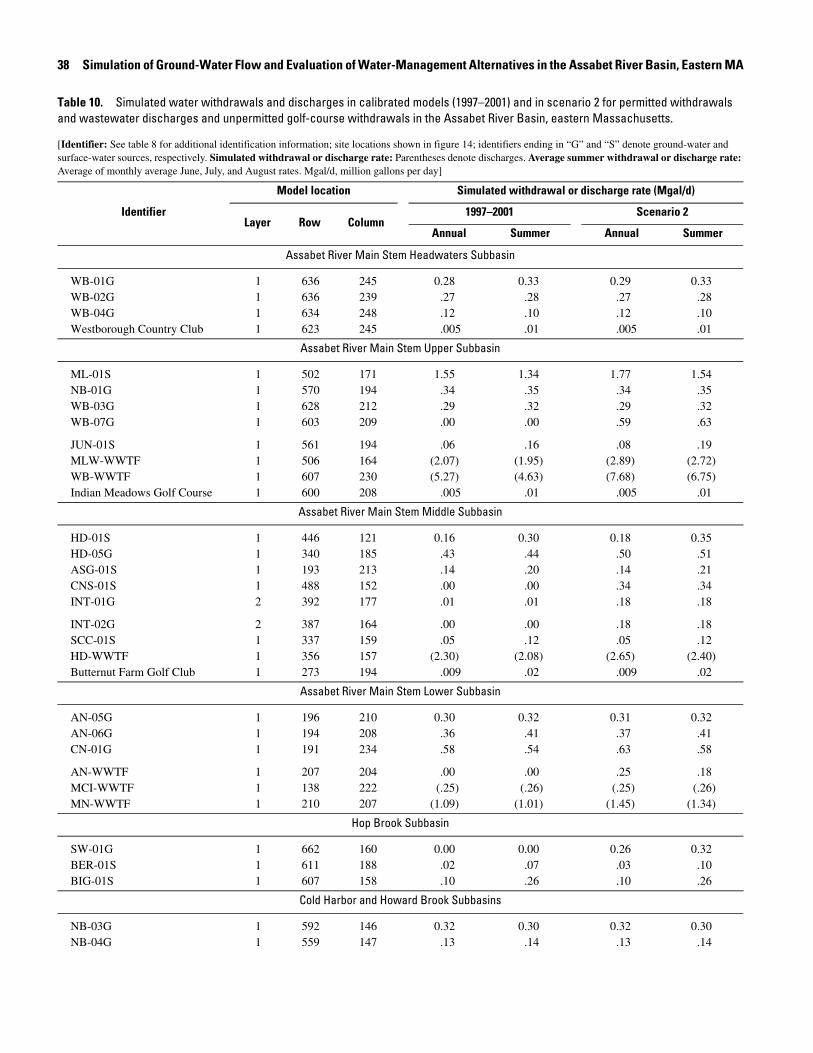
38 Simulation of Ground-Water Flow and Evaluation of Water-Management Alternatives in the Assabet River Basin, Eastern MA
Table 10. Simulated water withdrawals and discharges in calibrated models (1997–2001) and in scenario 2 for permitted withdrawals and wastewater discharges and unpermitted golf-course withdrawals in the Assabet River Basin, eastern Massachusetts.
[Identifier: See table 8 for additional identification information; site locations shown in figure 14; identifiers ending in “G” and “S” denote ground-water and surface-water sources, respectively. Simulated withdrawal or discharge rate: Parentheses denote discharges. Average summer withdrawal or discharge rate: Average of monthly average June, July, and August rates. Mgal/d, million gallons per day]
Identifier
Model location Simulated withdrawal or discharge rate (Mgal/d)
Layer Row Column1997–2001 Scenario 2
Annual Summer Annual Summer
Assabet River Main Stem Headwaters Subbasin
WB-01G 1 636 245 0.28 0.33 0.29 0.33WB-02G 1 636 239 .27 .28 .27 .28WB-04G 1 634 248 .12 .10 .12 .10Westborough Country Club 1 623 245 .005 .01 .005 .01
Assabet River Main Stem Upper Subbasin
ML-01S 1 502 171 1.55 1.34 1.77 1.54NB-01G 1 570 194 .34 .35 .34 .35WB-03G 1 628 212 .29 .32 .29 .32WB-07G 1 603 209 .00 .00 .59 .63
JUN-01S 1 561 194 .06 .16 .08 .19MLW-WWTF 1 506 164 (2.07) (1.95) (2.89) (2.72)WB-WWTF 1 607 230 (5.27) (4.63) (7.68) (6.75)Indian Meadows Golf Course 1 600 208 .005 .01 .005 .01
Assabet River Main Stem Middle Subbasin
HD-01S 1 446 121 0.16 0.30 0.18 0.35HD-05G 1 340 185 .43 .44 .50 .51ASG-01S 1 193 213 .14 .20 .14 .21CNS-01S 1 488 152 .00 .00 .34 .34INT-01G 2 392 177 .01 .01 .18 .18
INT-02G 2 387 164 .00 .00 .18 .18SCC-01S 1 337 159 .05 .12 .05 .12HD-WWTF 1 356 157 (2.30) (2.08) (2.65) (2.40)Butternut Farm Golf Club 1 273 194 .009 .02 .009 .02
Assabet River Main Stem Lower Subbasin
AN-05G 1 196 210 0.30 0.32 0.31 0.32AN-06G 1 194 208 .36 .41 .37 .41CN-01G 1 191 234 .58 .54 .63 .58
AN-WWTF 1 207 204 .00 .00 .25 .18MCI-WWTF 1 138 222 (.25) (.26) (.25) (.26)MN-WWTF 1 210 207 (1.09) (1.01) (1.45) (1.34)
Hop Brook Subbasin
SW-01G 1 662 160 0.00 0.00 0.26 0.32BER-01S 1 611 188 .02 .07 .03 .10BIG-01S 1 607 158 .10 .26 .10 .26
Cold Harbor and Howard Brook Subbasins
NB-03G 1 592 146 0.32 0.30 0.32 0.30NB-04G 1 559 147 .13 .14 .13 .14
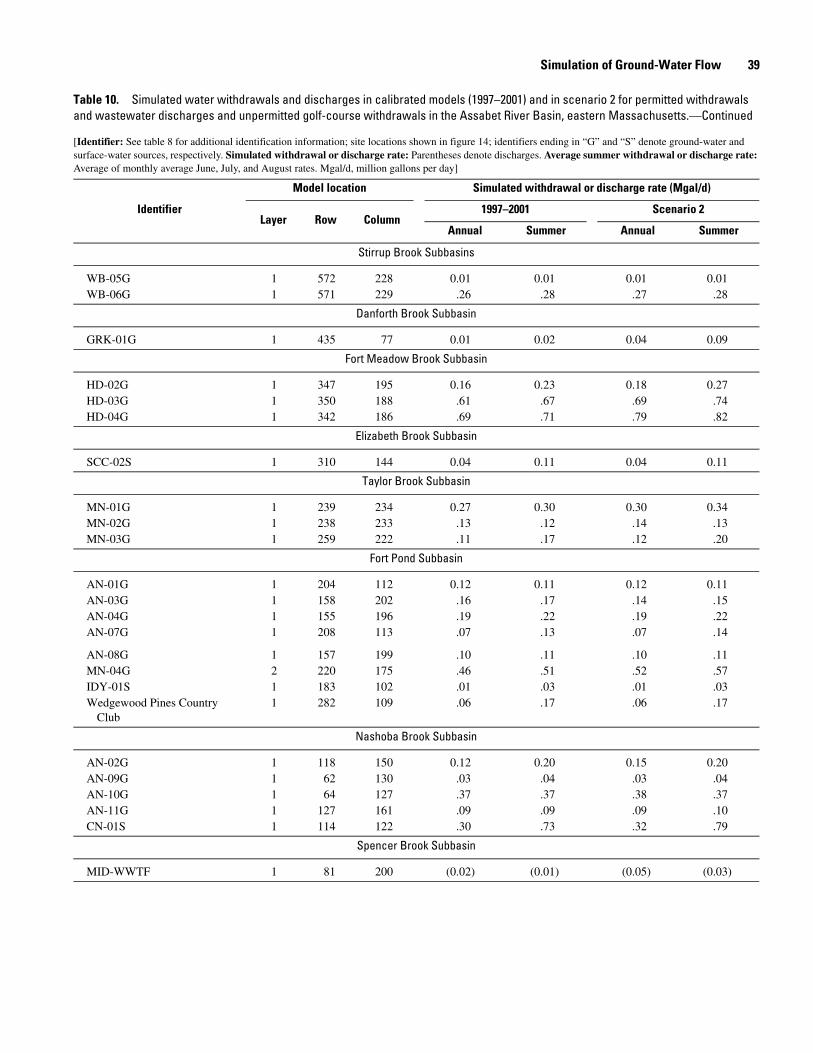
Simulation of Ground-Water Flow 39
Stirrup Brook Subbasins
WB-05G 1 572 228 0.01 0.01 0.01 0.01WB-06G 1 571 229 .26 .28 .27 .28
Danforth Brook Subbasin
GRK-01G 1 435 77 0.01 0.02 0.04 0.09
Fort Meadow Brook Subbasin
HD-02G 1 347 195 0.16 0.23 0.18 0.27HD-03G 1 350 188 .61 .67 .69 .74HD-04G 1 342 186 .69 .71 .79 .82
Elizabeth Brook Subbasin
SCC-02S 1 310 144 0.04 0.11 0.04 0.11
Taylor Brook Subbasin
MN-01G 1 239 234 0.27 0.30 0.30 0.34MN-02G 1 238 233 .13 .12 .14 .13MN-03G 1 259 222 .11 .17 .12 .20
Fort Pond Subbasin
AN-01G 1 204 112 0.12 0.11 0.12 0.11AN-03G 1 158 202 .16 .17 .14 .15AN-04G 1 155 196 .19 .22 .19 .22AN-07G 1 208 113 .07 .13 .07 .14
AN-08G 1 157 199 .10 .11 .10 .11MN-04G 2 220 175 .46 .51 .52 .57IDY-01S 1 183 102 .01 .03 .01 .03Wedgewood Pines Country
Club1 282 109 .06 .17 .06 .17
Nashoba Brook Subbasin
AN-02G 1 118 150 0.12 0.20 0.15 0.20AN-09G 1 62 130 .03 .04 .03 .04AN-10G 1 64 127 .37 .37 .38 .37AN-11G 1 127 161 .09 .09 .09 .10CN-01S 1 114 122 .30 .73 .32 .79
Spencer Brook Subbasin
MID-WWTF 1 81 200 (0.02) (0.01) (0.05) (0.03)
Table 10. Simulated water withdrawals and discharges in calibrated models (1997–2001) and in scenario 2 for permitted withdrawals and wastewater discharges and unpermitted golf-course withdrawals in the Assabet River Basin, eastern Massachusetts.—Continued
[Identifier: See table 8 for additional identification information; site locations shown in figure 14; identifiers ending in “G” and “S” denote ground-water and surface-water sources, respectively. Simulated withdrawal or discharge rate: Parentheses denote discharges. Average summer withdrawal or discharge rate: Average of monthly average June, July, and August rates. Mgal/d, million gallons per day]
Identifier
Model location Simulated withdrawal or discharge rate (Mgal/d)
Layer Row Column1997–2001 Scenario 2
Annual Summer Annual Summer
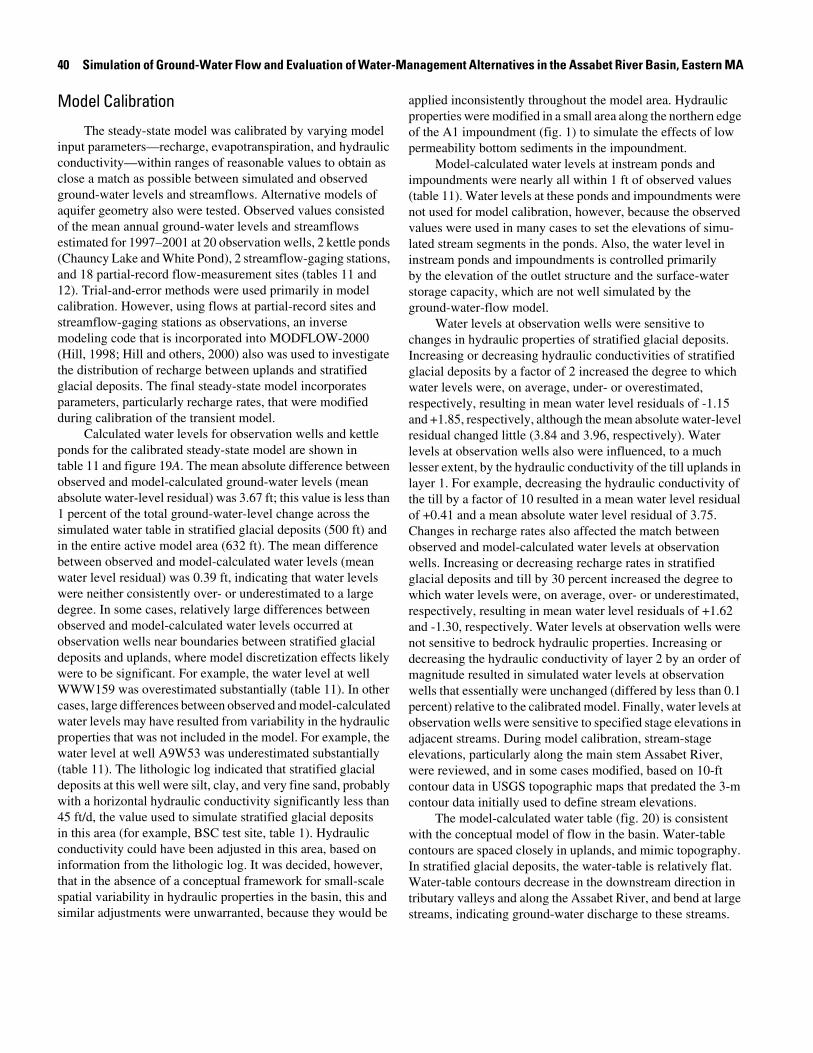
40 Simulation of Ground-Water Flow and Evaluation of Water-Management Alternatives in the Assabet River Basin, Eastern MA
Model Calibration
The steady-state model was calibrated by varying model input parameters—recharge, evapotranspiration, and hydraulic conductivity—within ranges of reasonable values to obtain as close a match as possible between simulated and observed ground-water levels and streamflows. Alternative models of aquifer geometry also were tested. Observed values consisted of the mean annual ground-water levels and streamflows estimated for 1997–2001 at 20 observation wells, 2 kettle ponds (Chauncy Lake and White Pond), 2 streamflow-gaging stations, and 18 partial-record flow-measurement sites (tables 11 and 12). Trial-and-error methods were used primarily in model calibration. However, using flows at partial-record sites and streamflow-gaging stations as observations, an inverse modeling code that is incorporated into MODFLOW-2000 (Hill, 1998; Hill and others, 2000) also was used to investigate the distribution of recharge between uplands and stratified glacial deposits. The final steady-state model incorporates parameters, particularly recharge rates, that were modified during calibration of the transient model.
Calculated water levels for observation wells and kettle ponds for the calibrated steady-state model are shown in table 11 and figure 19A. The mean absolute difference between observed and model-calculated ground-water levels (mean absolute water-level residual) was 3.67 ft; this value is less than 1 percent of the total ground-water-level change across the simulated water table in stratified glacial deposits (500 ft) and in the entire active model area (632 ft). The mean difference between observed and model-calculated water levels (mean water level residual) was 0.39 ft, indicating that water levels were neither consistently over- or underestimated to a large degree. In some cases, relatively large differences between observed and model-calculated water levels occurred at observation wells near boundaries between stratified glacial deposits and uplands, where model discretization effects likely were to be significant. For example, the water level at well WWW159 was overestimated substantially (table 11). In other cases, large differences between observed and model-calculated water levels may have resulted from variability in the hydraulic properties that was not included in the model. For example, the water level at well A9W53 was underestimated substantially (table 11). The lithologic log indicated that stratified glacial deposits at this well were silt, clay, and very fine sand, probably with a horizontal hydraulic conductivity significantly less than 45 ft/d, the value used to simulate stratified glacial deposits in this area (for example, BSC test site, table 1). Hydraulic conductivity could have been adjusted in this area, based on information from the lithologic log. It was decided, however, that in the absence of a conceptual framework for small-scale spatial variability in hydraulic properties in the basin, this and similar adjustments were unwarranted, because they would be
applied inconsistently throughout the model area. Hydraulic properties were modified in a small area along the northern edge of the A1 impoundment (fig. 1) to simulate the effects of low permeability bottom sediments in the impoundment.
Model-calculated water levels at instream ponds and impoundments were nearly all within 1 ft of observed values (table 11). Water levels at these ponds and impoundments were not used for model calibration, however, because the observed values were used in many cases to set the elevations of simu-lated stream segments in the ponds. Also, the water level in instream ponds and impoundments is controlled primarily by the elevation of the outlet structure and the surface-water storage capacity, which are not well simulated by the ground-water-flow model.
Water levels at observation wells were sensitive to changes in hydraulic properties of stratified glacial deposits. Increasing or decreasing hydraulic conductivities of stratified glacial deposits by a factor of 2 increased the degree to which water levels were, on average, under- or overestimated, respectively, resulting in mean water level residuals of -1.15 and +1.85, respectively, although the mean absolute water-level residual changed little (3.84 and 3.96, respectively). Water levels at observation wells also were influenced, to a much lesser extent, by the hydraulic conductivity of the till uplands in layer 1. For example, decreasing the hydraulic conductivity of the till by a factor of 10 resulted in a mean water level residual of +0.41 and a mean absolute water level residual of 3.75. Changes in recharge rates also affected the match between observed and model-calculated water levels at observation wells. Increasing or decreasing recharge rates in stratified glacial deposits and till by 30 percent increased the degree to which water levels were, on average, over- or underestimated, respectively, resulting in mean water level residuals of +1.62 and -1.30, respectively. Water levels at observation wells were not sensitive to bedrock hydraulic properties. Increasing or decreasing the hydraulic conductivity of layer 2 by an order of magnitude resulted in simulated water levels at observation wells that essentially were unchanged (differed by less than 0.1 percent) relative to the calibrated model. Finally, water levels at observation wells were sensitive to specified stage elevations in adjacent streams. During model calibration, stream-stage elevations, particularly along the main stem Assabet River, were reviewed, and in some cases modified, based on 10-ft contour data in USGS topographic maps that predated the 3-m contour data initially used to define stream elevations.
The model-calculated water table (fig. 20) is consistent with the conceptual model of flow in the basin. Water-table contours are spaced closely in uplands, and mimic topography. In stratified glacial deposits, the water-table is relatively flat. Water-table contours decrease in the downstream direction in tributary valleys and along the Assabet River, and bend at large streams, indicating ground-water discharge to these streams.
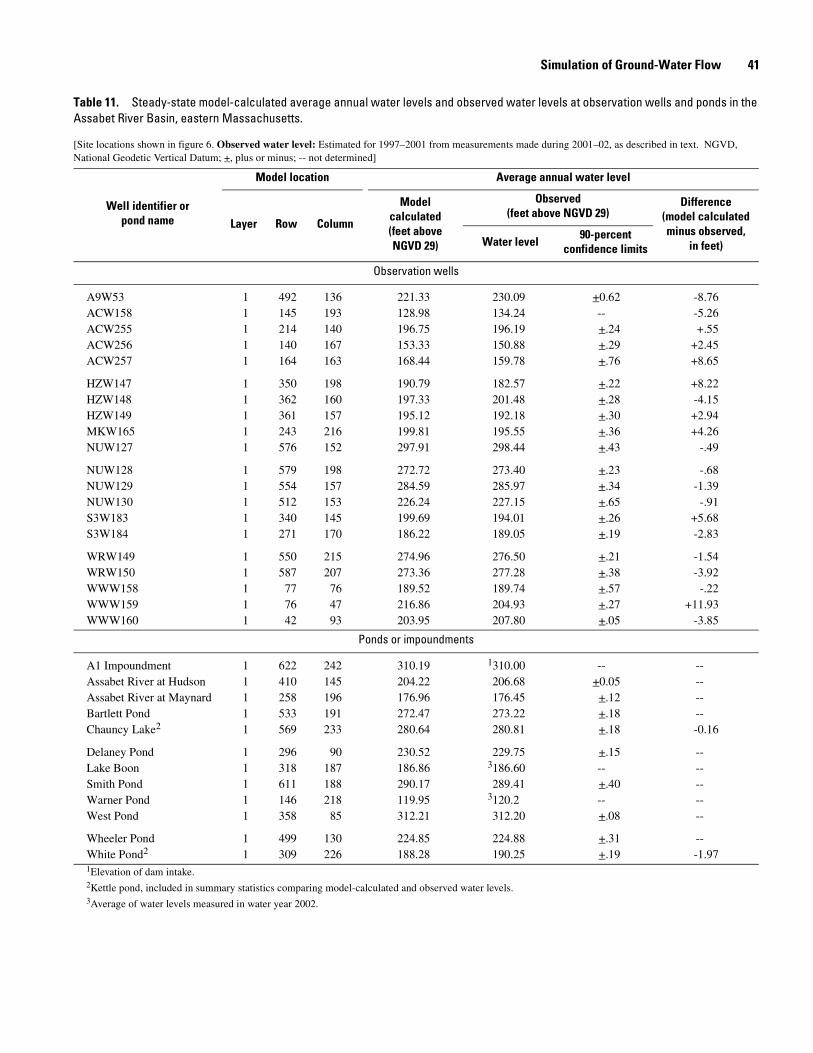
Simulation of Ground-Water Flow 41
1Elevation of dam intake.2Kettle pond, included in summary statistics comparing model-calculated and observed water levels.3Average of water levels measured in water year 2002.
Table 11. Steady-state model-calculated average annual water levels and observed water levels at observation wells and ponds in the Assabet River Basin, eastern Massachusetts.
[Site locations shown in figure 6. Observed water level: Estimated for 1997–2001 from measurements made during 2001–02, as described in text. NGVD, National Geodetic Vertical Datum; +, plus or minus; -- not determined]
Well identifier or pond name
Model location Average annual water level
Layer Row Column
Model calculated(feet aboveNGVD 29)
Observed(feet above NGVD 29)
Difference(model calculated minus observed,
in feet)Water level90-percent
confidence limits
Observation wells
A9W53 1 492 136 221.33 230.09 +0.62 -8.76ACW158 1 145 193 128.98 134.24 -- -5.26ACW255 1 214 140 196.75 196.19 +.24 +.55ACW256 1 140 167 153.33 150.88 +.29 +2.45ACW257 1 164 163 168.44 159.78 +.76 +8.65
HZW147 1 350 198 190.79 182.57 +.22 +8.22HZW148 1 362 160 197.33 201.48 +.28 -4.15HZW149 1 361 157 195.12 192.18 +.30 +2.94MKW165 1 243 216 199.81 195.55 +.36 +4.26NUW127 1 576 152 297.91 298.44 +.43 -.49
NUW128 1 579 198 272.72 273.40 +.23 -.68NUW129 1 554 157 284.59 285.97 +.34 -1.39NUW130 1 512 153 226.24 227.15 +.65 -.91S3W183 1 340 145 199.69 194.01 +.26 +5.68S3W184 1 271 170 186.22 189.05 +.19 -2.83
WRW149 1 550 215 274.96 276.50 +.21 -1.54WRW150 1 587 207 273.36 277.28 +.38 -3.92WWW158 1 77 76 189.52 189.74 +.57 -.22WWW159 1 76 47 216.86 204.93 +.27 +11.93WWW160 1 42 93 203.95 207.80 +.05 -3.85
Ponds or impoundments
A1 Impoundment 1 622 242 310.19 1310.00 -- --Assabet River at Hudson 1 410 145 204.22 206.68 +0.05 --Assabet River at Maynard 1 258 196 176.96 176.45 +.12 --Bartlett Pond 1 533 191 272.47 273.22 +.18 --Chauncy Lake2 1 569 233 280.64 280.81 +.18 -0.16
Delaney Pond 1 296 90 230.52 229.75 +.15 --Lake Boon 1 318 187 186.86 3186.60 -- --Smith Pond 1 611 188 290.17 289.41 +.40 --Warner Pond 1 146 218 119.95 3120.2 -- --West Pond 1 358 85 312.21 312.20 +.08 --
Wheeler Pond 1 499 130 224.85 224.88 +.31 --White Pond2 1 309 226 188.28 190.25 +.19 -1.97
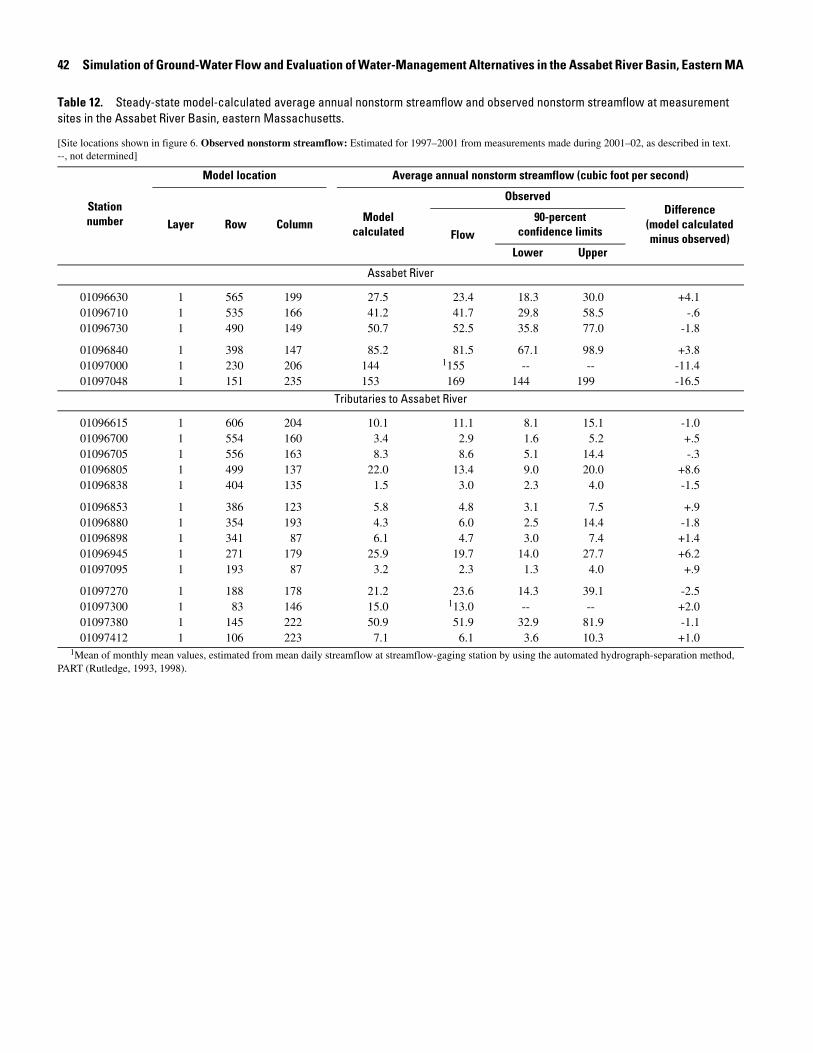
42 Simulation of Ground-Water Flow and Evaluation of Water-Management Alternatives in the Assabet River Basin, Eastern MA
1Mean of monthly mean values, estimated from mean daily streamflow at streamflow-gaging station by using the automated hydrograph-separation method, PART (Rutledge, 1993, 1998).
Table 12. Steady-state model-calculated average annual nonstorm streamflow and observed nonstorm streamflow at measurement sites in the Assabet River Basin, eastern Massachusetts.
[Site locations shown in figure 6. Observed nonstorm streamflow: Estimated for 1997–2001 from measurements made during 2001–02, as described in text. --, not determined]
Stationnumber
Model location Average annual nonstorm streamflow (cubic foot per second)
Layer Row ColumnModel
calculated
ObservedDifference
(model calculated minus observed)Flow
90-percentconfidence limits
Lower Upper
Assabet River
01096630 1 565 199 27.5 23.4 18.3 30.0 +4.101096710 1 535 166 41.2 41.7 29.8 58.5 -.601096730 1 490 149 50.7 52.5 35.8 77.0 -1.8
01096840 1 398 147 85.2 81.5 67.1 98.9 +3.801097000 1 230 206 144 1155 -- -- -11.401097048 1 151 235 153 169 144 199 -16.5
Tributaries to Assabet River
01096615 1 606 204 10.1 11.1 8.1 15.1 -1.001096700 1 554 160 3.4 2.9 1.6 5.2 +.501096705 1 556 163 8.3 8.6 5.1 14.4 -.301096805 1 499 137 22.0 13.4 9.0 20.0 +8.601096838 1 404 135 1.5 3.0 2.3 4.0 -1.5
01096853 1 386 123 5.8 4.8 3.1 7.5 +.901096880 1 354 193 4.3 6.0 2.5 14.4 -1.801096898 1 341 87 6.1 4.7 3.0 7.4 +1.401096945 1 271 179 25.9 19.7 14.0 27.7 +6.201097095 1 193 87 3.2 2.3 1.3 4.0 +.9
01097270 1 188 178 21.2 23.6 14.3 39.1 -2.501097300 1 83 146 15.0 113.0 -- -- +2.001097380 1 145 222 50.9 51.9 32.9 81.9 -1.101097412 1 106 223 7.1 6.1 3.6 10.3 +1.0
Simulation of Ground-Water Flow 43
Calculated nonstorm streamflow at streamflow-gaging stations and partial-record measurement sites are shown in table 12 and figure 19B. Observed and model-calculated nonstorm streamflow differ by about -8 percent at the Assabet River at Maynard station (01097000) and by +13 percent at the Nashoba Brook station (01097300). Nonstorm streamflows at partial-record sites on the main stem Assabet differ by less than 20 percent, and flows at most partial-record sites on tributaries differ by about 30 percent or less; large differences (greater than 30 percent) generally were associated with sites on small streams with low flows. Overall, the mean absolute difference between model-calculated and observed nonstorm streamflow (mean absolute flow residual) was 3.4 ft3/s, or 2 percent of the total range of observed flows. The mean difference between observed and model-calculated water levels (mean flow residual) was -0.55 ft3/s.
Streamflows were sensitive to recharge rates, evapotrans-piration rates, and the distribution of recharge between areas of stratified glacial deposits and uplands. Increasing or decreasing recharge rates in stratified glacial deposits and till by 30 percent resulted in flows at all sites being consistently over- or under-estimated, with mean flow residuals of +11.6 and -12.5 ft3/s, respectively; the mean absolute flow residuals were equal in magnitude to the mean flow residuals in both cases (all differ-ences were in the same direction). Increasing or decreasing evapotranspirative loss rates in wetlands, instream ponds, impoundments, and nonwetland areas by 30 percent had smaller, inverse effects than changes in recharge rates, resulting in mean flow residuals of -3.1 and +2.1 ft3/s, respectively. Finally, a uniform recharge rate for stratified glacial deposits and uplands, equal to the area-weighted average of the rates used in the calibrated model, resulted in flows being overesti-mated, with a mean flow residual of 2.2 ft3/s, and a mean absolute flow residual of 3.2 ft3/s.
350
300
250
200
150
100
MO
DE
L-C
ALC
ULA
TE
D,
IN F
EE
T A
BO
VE
NG
VD
29
350300250200150100
OBSERVED, IN FEET ABOVE NGVD 29
A. GROUND-WATER LEVELS
180
140
100
60
40
0
160
120
80
20
18014010060400 1601208020
OBSERVED, IN CUBIC FEET PER SECOND
MO
DE
L-C
ALC
ULA
TE
D,
IN C
UB
IC F
EE
T P
ER
SE
CO
ND
B. NONSTORM STREAMFLOW
Figure 19. Relation between observed and model-calculated A, ground-water levels; and B, nonstorm streamflow for average conditions, 1997–2001, for the steady-state ground-water-flow model of the Assabet River Basin, eastern Massachusetts. Observed values are estimates for 1997–2001 from measure-ments made in 2001–02 as described in the text. Line of equality between observed and model-calculated values is shown.
44 Simulation of Ground-Water Flow and Evaluation of Water-Management Alternatives in the Assabet River Basin, Eastern MA
EXPLANATION
TILL OR BEDROCK
MODEL-CALCULATED STEADY-STATE WATER- TABLE CONTOUR—Shows altitude of the water table in feet above NGVD 29. Contour interval is 20 feet, 100-foot contours are labelled.
BOUNDARY OF THE ACTIVE MODELED AREA
STRATIFIED GLACIAL DEPOSITS
200
71o36'
71o24'
42o18'
42o24'
42o30'
0 1 2 3 4 5 MILES
0 2 KILOMETERS41 3 5From USGS and MassGIS data sources, Massachusetts State Plane Coordinate System, Mainland Zone.
300
300
300
300
300
300
300
300
300
300
300
300
300
200
200
200
200
200
200
200
300
400
300
400
400
300
400
400
500
500
400
500
600
500
600
500
600
Figure 20. Model-calculated steady-state water table in the Assabet River Basin, eastern Massachusetts.
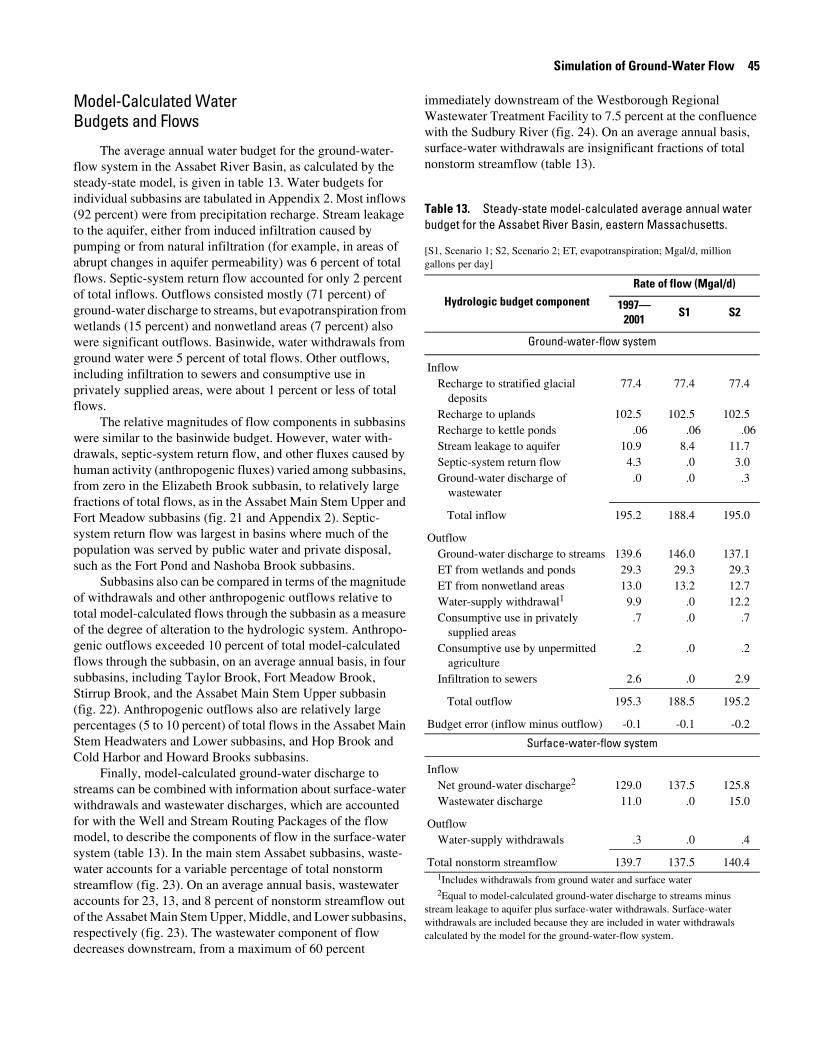
Simulation of Ground-Water Flow 45
Model-Calculated Water Budgets and Flows
The average annual water budget for the ground-water-flow system in the Assabet River Basin, as calculated by the steady-state model, is given in table 13. Water budgets for individual subbasins are tabulated in Appendix 2. Most inflows (92 percent) were from precipitation recharge. Stream leakage to the aquifer, either from induced infiltration caused by pumping or from natural infiltration (for example, in areas of abrupt changes in aquifer permeability) was 6 percent of total flows. Septic-system return flow accounted for only 2 percent of total inflows. Outflows consisted mostly (71 percent) of ground-water discharge to streams, but evapotranspiration from wetlands (15 percent) and nonwetland areas (7 percent) also were significant outflows. Basinwide, water withdrawals from ground water were 5 percent of total flows. Other outflows, including infiltration to sewers and consumptive use in privately supplied areas, were about 1 percent or less of total flows.
The relative magnitudes of flow components in subbasins were similar to the basinwide budget. However, water with-drawals, septic-system return flow, and other fluxes caused by human activity (anthropogenic fluxes) varied among subbasins, from zero in the Elizabeth Brook subbasin, to relatively large fractions of total flows, as in the Assabet Main Stem Upper and Fort Meadow subbasins (fig. 21 and Appendix 2). Septic-system return flow was largest in basins where much of the population was served by public water and private disposal, such as the Fort Pond and Nashoba Brook subbasins.
Subbasins also can be compared in terms of the magnitude of withdrawals and other anthropogenic outflows relative to total model-calculated flows through the subbasin as a measure of the degree of alteration to the hydrologic system. Anthropo-genic outflows exceeded 10 percent of total model-calculated flows through the subbasin, on an average annual basis, in four subbasins, including Taylor Brook, Fort Meadow Brook, Stirrup Brook, and the Assabet Main Stem Upper subbasin (fig. 22). Anthropogenic outflows also are relatively large percentages (5 to 10 percent) of total flows in the Assabet Main Stem Headwaters and Lower subbasins, and Hop Brook and Cold Harbor and Howard Brooks subbasins.
Finally, model-calculated ground-water discharge to streams can be combined with information about surface-water withdrawals and wastewater discharges, which are accounted for with the Well and Stream Routing Packages of the flow model, to describe the components of flow in the surface-water system (table 13). In the main stem Assabet subbasins, waste-water accounts for a variable percentage of total nonstorm streamflow (fig. 23). On an average annual basis, wastewater accounts for 23, 13, and 8 percent of nonstorm streamflow out of the Assabet Main Stem Upper, Middle, and Lower subbasins, respectively (fig. 23). The wastewater component of flow decreases downstream, from a maximum of 60 percent
immediately downstream of the Westborough Regional Wastewater Treatment Facility to 7.5 percent at the confluence with the Sudbury River (fig. 24). On an average annual basis, surface-water withdrawals are insignificant fractions of total nonstorm streamflow (table 13).
1Includes withdrawals from ground water and surface water2Equal to model-calculated ground-water discharge to streams minus
stream leakage to aquifer plus surface-water withdrawals. Surface-water withdrawals are included because they are included in water withdrawals calculated by the model for the ground-water-flow system.
Table 13. Steady-state model-calculated average annual water budget for the Assabet River Basin, eastern Massachusetts.
[S1, Scenario 1; S2, Scenario 2; ET, evapotranspiration; Mgal/d, million gallons per day]
Hydrologic budget componentRate of flow (Mgal/d)
1997—2001 S1 S2
Ground-water-flow system
InflowRecharge to stratified glacial
deposits77.4 77.4 77.4
Recharge to uplands 102.5 102.5 102.5Recharge to kettle ponds .06 .06 .06Stream leakage to aquifer 10.9 8.4 11.7Septic-system return flow 4.3 .0 3.0Ground-water discharge of
wastewater.0 .0 .3
Total inflow 195.2 188.4 195.0
OutflowGround-water discharge to streams 139.6 146.0 137.1ET from wetlands and ponds 29.3 29.3 29.3ET from nonwetland areas 13.0 13.2 12.7Water-supply withdrawal1 9.9 .0 12.2Consumptive use in privately
supplied areas.7 .0 .7
Consumptive use by unpermitted agriculture
.2 .0 .2
Infiltration to sewers 2.6 .0 2.9
Total outflow 195.3 188.5 195.2
Budget error (inflow minus outflow) -0.1 -0.1 -0.2
Surface-water-flow system
InflowNet ground-water discharge2 129.0 137.5 125.8Wastewater discharge 11.0 .0 15.0
OutflowWater-supply withdrawals .3 .0 .4
Total nonstorm streamflow 139.7 137.5 140.4
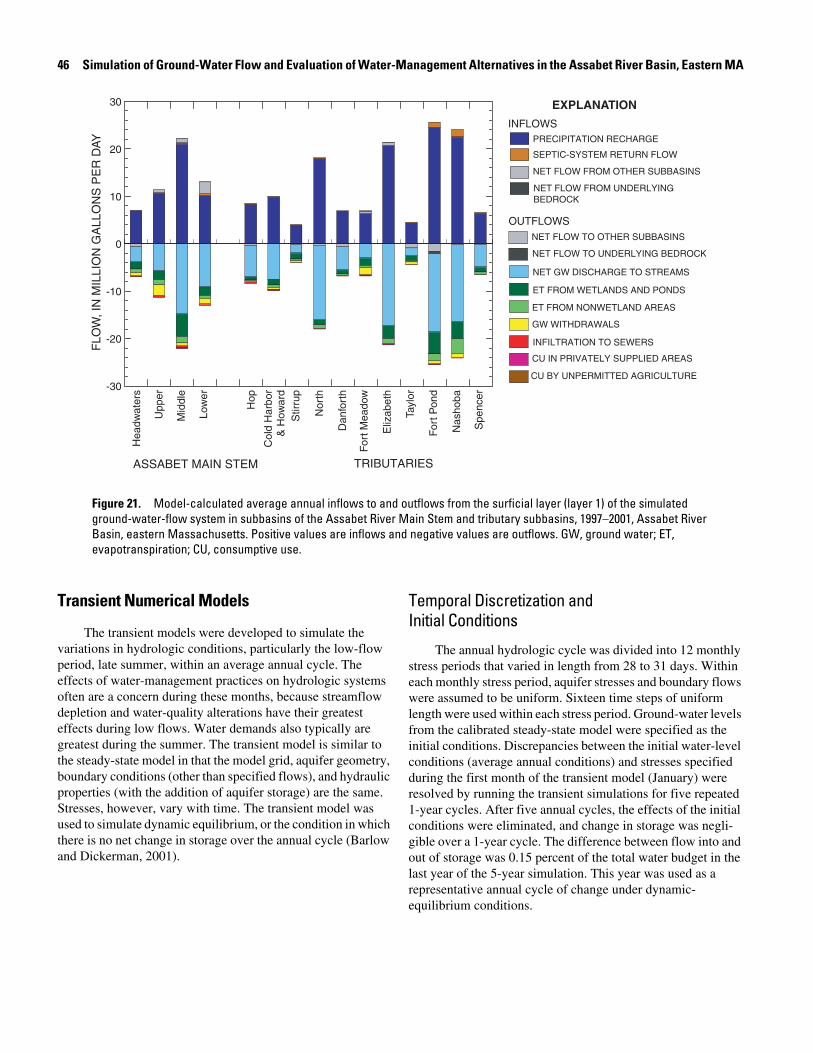
46 Simulation of Ground-Water Flow and Evaluation of Water-Management Alternatives in the Assabet River Basin, Eastern MA
NET FLOW TO OTHER SUBBASINS
PRECIPITATION RECHARGE
SEPTIC-SYSTEM RETURN FLOW
NET FLOW FROM OTHER SUBBASINS
NET FLOW FROM UNDERLYING BEDROCK
NET GW DISCHARGE TO STREAMS
ET FROM WETLANDS AND PONDS
ET FROM NONWETLAND AREAS
GW WITHDRAWALS
INFILTRATION TO SEWERS
CU IN PRIVATELY SUPPLIED AREAS
CU BY UNPERMITTED AGRICULTURE
EXPLANATIONF
LOW
, IN
MIL
LIO
N G
ALL
ON
S P
ER
DAY
30
20
10
-10
-20
-30
0
Hea
dwat
ers
Upp
er
Mid
dle
Low
er
Hop
Col
d H
arbo
r &
How
ard
Nor
th
Dan
fort
h
For
t Mea
dow
Eliz
abet
h
Tayl
or
For
t Pon
d
Nas
hoba
Spe
ncer
Stir
rup
INFLOWS
OUTFLOWS
NET FLOW TO UNDERLYING BEDROCK
TRIBUTARIESASSABET MAIN STEM
Figure 21. Model-calculated average annual inflows to and outflows from the surficial layer (layer 1) of the simulated ground-water-flow system in subbasins of the Assabet River Main Stem and tributary subbasins, 1997–2001, Assabet River Basin, eastern Massachusetts. Positive values are inflows and negative values are outflows. GW, ground water; ET, evapotranspiration; CU, consumptive use.
Transient Numerical Models
The transient models were developed to simulate the variations in hydrologic conditions, particularly the low-flow period, late summer, within an average annual cycle. The effects of water-management practices on hydrologic systems often are a concern during these months, because streamflow depletion and water-quality alterations have their greatest effects during low flows. Water demands also typically are greatest during the summer. The transient model is similar to the steady-state model in that the model grid, aquifer geometry, boundary conditions (other than specified flows), and hydraulic properties (with the addition of aquifer storage) are the same. Stresses, however, vary with time. The transient model was used to simulate dynamic equilibrium, or the condition in which there is no net change in storage over the annual cycle (Barlow and Dickerman, 2001).
Temporal Discretization and Initial Conditions
The annual hydrologic cycle was divided into 12 monthly stress periods that varied in length from 28 to 31 days. Within each monthly stress period, aquifer stresses and boundary flows were assumed to be uniform. Sixteen time steps of uniform length were used within each stress period. Ground-water levels from the calibrated steady-state model were specified as the initial conditions. Discrepancies between the initial water-level conditions (average annual conditions) and stresses specified during the first month of the transient model (January) were resolved by running the transient simulations for five repeated 1-year cycles. After five annual cycles, the effects of the initial conditions were eliminated, and change in storage was negli-gible over a 1-year cycle. The difference between flow into and out of storage was 0.15 percent of the total water budget in the last year of the 5-year simulation. This year was used as a representative annual cycle of change under dynamic-equilibrium conditions.
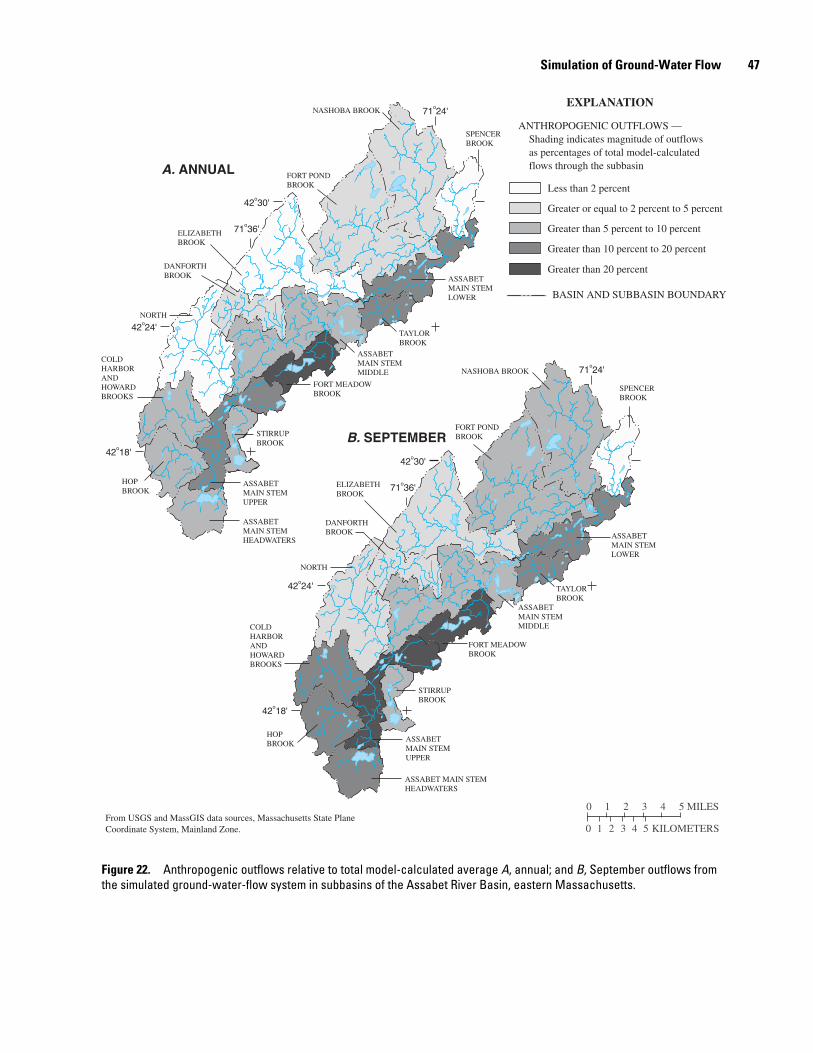
Simulation of Ground-Water Flow 47
71o36'
71o24'
42o18'
42o24'
42o30'
71o36'
71o24'
42o18'
42o24'
42o30'
EXPLANATION
NORTH
COLD HARBOR ANDHOWARDBROOKS
HOPBROOK
ASSABET MAIN STEM HEADWATERS
ASSABET MAIN STEMMIDDLE
DANFORTHBROOK
ELIZABETHBROOK
FORT POND BROOK
FORT MEADOW BROOK
SPENCER BROOK
NASHOBA BROOK
ASSABET MAIN STEMLOWER
ASSABET MAIN STEMUPPER
STIRRUPBROOK
NORTH
COLD HARBOR ANDHOWARDBROOKS
HOPBROOK
ASSABET MAIN STEM HEADWATERS
ASSABET MAIN STEMMIDDLE
TAYLORBROOK
DANFORTHBROOK
ELIZABETHBROOK
FORT POND BROOK
FORT MEADOW BROOK
SPENCER BROOK
NASHOBA BROOK
ASSABET MAIN STEMLOWER
ASSABET MAIN STEMUPPER
STIRRUPBROOK
ANTHROPOGENIC OUTFLOWS — Shading indicates magnitude of outflows as percentages of total model-calculated flows through the subbasin
Less than 2 percent
Greater or equal to 2 percent to 5 percent
Greater than 5 percent to 10 percent
Greater than 10 percent to 20 percent
Greater than 20 percent
0 1 2 3 4 5 MILES
0 2 KILOMETERS41 3 5From USGS and MassGIS data sources, Massachusetts State Plane Coordinate System, Mainland Zone.
TAYLORBROOK
BASIN AND SUBBASIN BOUNDARY
B. SEPTEMBER
A. ANNUAL
Figure 22. Anthropogenic outflows relative to total model-calculated average A, annual; and B, September outflows from the simulated ground-water-flow system in subbasins of the Assabet River Basin, eastern Massachusetts.
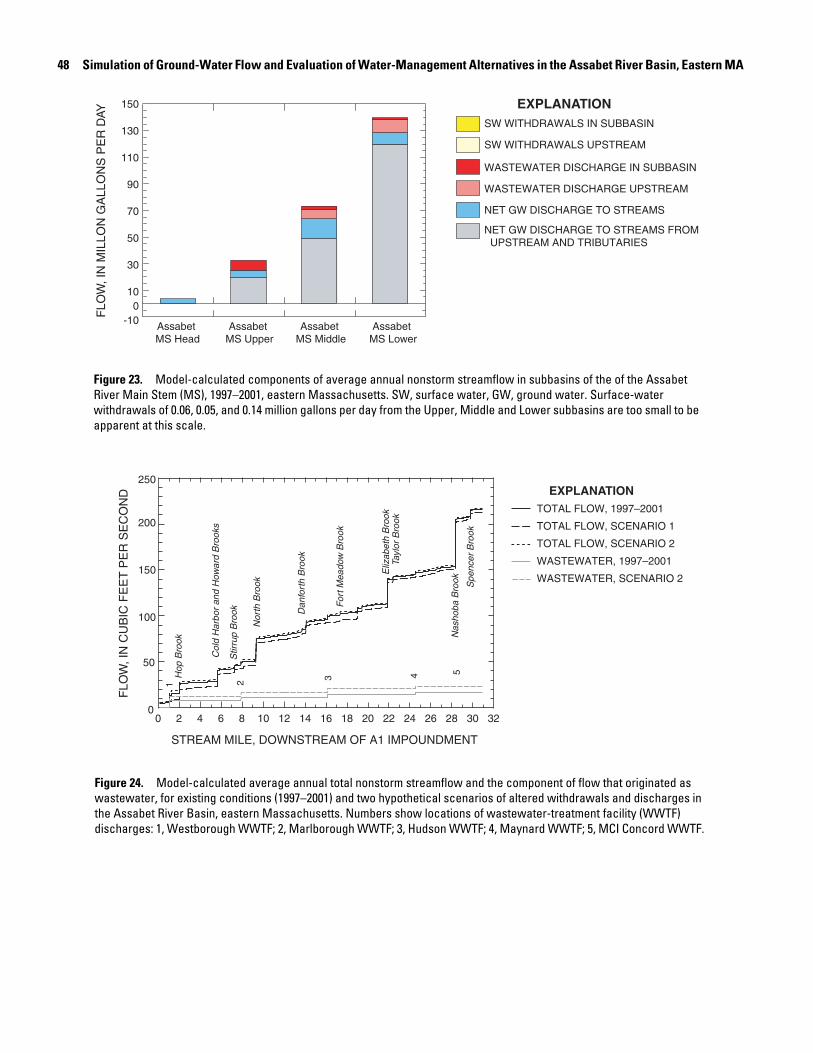
48 Simulation of Ground-Water Flow and Evaluation of Water-Management Alternatives in the Assabet River Basin, Eastern MA
NET GW DISCHARGE TO STREAMS FROM UPSTREAM AND TRIBUTARIES
NET GW DISCHARGE TO STREAMS
WASTEWATER DISCHARGE UPSTREAM
WASTEWATER DISCHARGE IN SUBBASIN
SW WITHDRAWALS UPSTREAM
SW WITHDRAWALS IN SUBBASIN
150
130
110
70
50
30
90
FLO
W, I
N M
ILLO
N G
ALL
ON
S P
ER
DAY
100
-10 Assabet MS Head
Assabet MS Upper
Assabet MS Middle
Assabet MS Lower
EXPLANATION
Figure 23. Model-calculated components of average annual nonstorm streamflow in subbasins of the of the Assabet River Main Stem (MS), 1997–2001, eastern Massachusetts. SW, surface water, GW, ground water. Surface-water withdrawals of 0.06, 0.05, and 0.14 million gallons per day from the Upper, Middle and Lower subbasins are too small to be apparent at this scale.
TOTAL FLOW, 1997–2001
250
200
150
50
100
0
EXPLANATION
0 2 141210864 323028262422201816
TOTAL FLOW, SCENARIO 1
TOTAL FLOW, SCENARIO 2
WASTEWATER, 1997–2001
WASTEWATER, SCENARIO 2
STREAM MILE, DOWNSTREAM OF A1 IMPOUNDMENT
FLO
W, I
N C
UB
IC F
EE
T P
ER
SE
CO
ND
Hop
Bro
ok
Col
d H
arbo
r an
d H
owar
d B
rook
s
Nor
th B
rook
Stir
rup
Bro
ok
Nas
hoba
Bro
ok Spe
ncer
Bro
ok
Eliz
abet
h B
rook
Tayl
or B
rook
For
t Mea
dow
Bro
ok
Dan
fort
h B
rook
1 2 3 4 5
Figure 24. Model-calculated average annual total nonstorm streamflow and the component of flow that originated as wastewater, for existing conditions (1997–2001) and two hypothetical scenarios of altered withdrawals and discharges in the Assabet River Basin, eastern Massachusetts. Numbers show locations of wastewater-treatment facility (WWTF) discharges: 1, Westborough WWTF; 2, Marlborough WWTF; 3, Hudson WWTF; 4, Maynard WWTF; 5, MCI Concord WWTF.
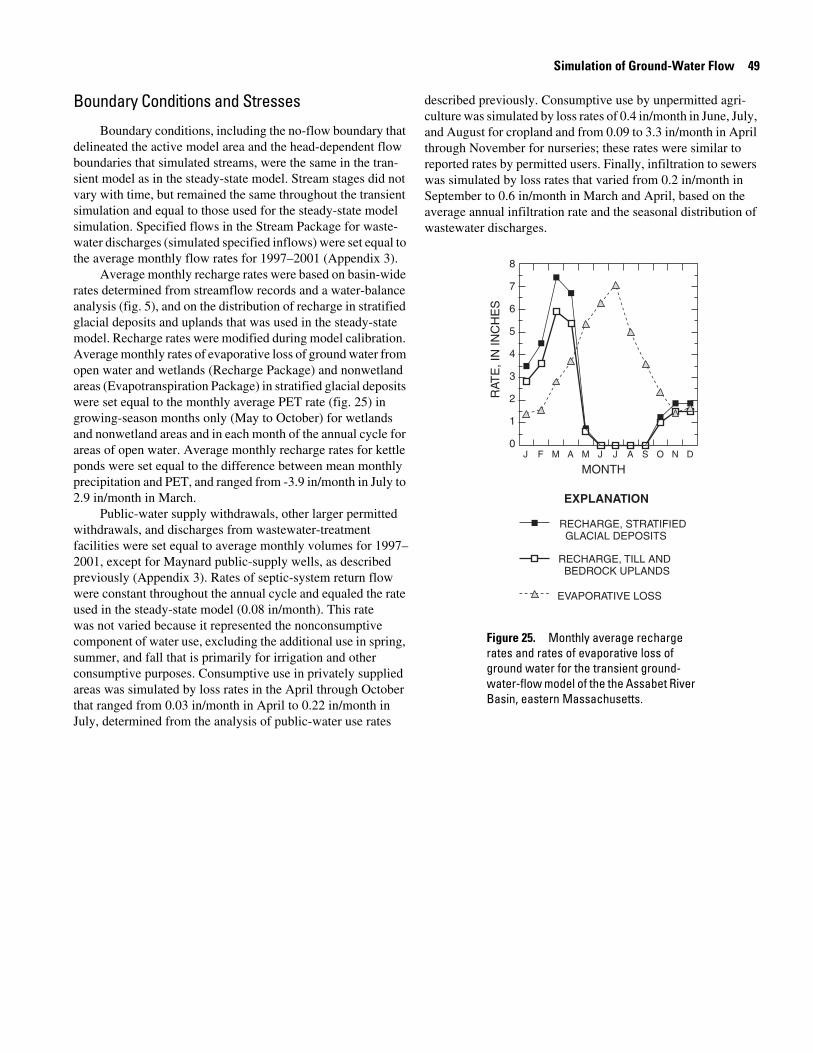
Simulation of Ground-Water Flow 49
Boundary Conditions and Stresses
Boundary conditions, including the no-flow boundary that delineated the active model area and the head-dependent flow boundaries that simulated streams, were the same in the tran-sient model as in the steady-state model. Stream stages did not vary with time, but remained the same throughout the transient simulation and equal to those used for the steady-state model simulation. Specified flows in the Stream Package for waste-water discharges (simulated specified inflows) were set equal to the average monthly flow rates for 1997–2001 (Appendix 3).
Average monthly recharge rates were based on basin-wide rates determined from streamflow records and a water-balance analysis (fig. 5), and on the distribution of recharge in stratified glacial deposits and uplands that was used in the steady-state model. Recharge rates were modified during model calibration. Average monthly rates of evaporative loss of ground water from open water and wetlands (Recharge Package) and nonwetland areas (Evapotranspiration Package) in stratified glacial deposits were set equal to the monthly average PET rate (fig. 25) in growing-season months only (May to October) for wetlands and nonwetland areas and in each month of the annual cycle for areas of open water. Average monthly recharge rates for kettle ponds were set equal to the difference between mean monthly precipitation and PET, and ranged from -3.9 in/month in July to 2.9 in/month in March.
Public-water supply withdrawals, other larger permitted withdrawals, and discharges from wastewater-treatment facilities were set equal to average monthly volumes for 1997–2001, except for Maynard public-supply wells, as described previously (Appendix 3). Rates of septic-system return flow were constant throughout the annual cycle and equaled the rate used in the steady-state model (0.08 in/month). This rate was not varied because it represented the nonconsumptive component of water use, excluding the additional use in spring, summer, and fall that is primarily for irrigation and other consumptive purposes. Consumptive use in privately supplied areas was simulated by loss rates in the April through October that ranged from 0.03 in/month in April to 0.22 in/month in July, determined from the analysis of public-water use rates
described previously. Consumptive use by unpermitted agri-culture was simulated by loss rates of 0.4 in/month in June, July, and August for cropland and from 0.09 to 3.3 in/month in April through November for nurseries; these rates were similar to reported rates by permitted users. Finally, infiltration to sewers was simulated by loss rates that varied from 0.2 in/month in September to 0.6 in/month in March and April, based on the average annual infiltration rate and the seasonal distribution of wastewater discharges.
8
7
5
4
2
0
6
3
1
J F M A M SJ J A O N D
RECHARGE, STRATIFIED GLACIAL DEPOSITS
RECHARGE, TILL AND BEDROCK UPLANDS
EXPLANATIONR
ATE
, IN
INC
HE
S
EVAPORATIVE LOSS
MONTH
Figure 25. Monthly average recharge rates and rates of evaporative loss of ground water for the transient ground-water-flow model of the the Assabet River Basin, eastern Massachusetts.
50 Simulation of Ground-Water Flow and Evaluation of Water-Management Alternatives in the Assabet River Basin, Eastern MA
Hydraulic Properties
The storage properties of each simulated hydrogeologic unit were characterized by a constant storage term that was specified in the model as specific storage (L-1). For each model layer, specific storage was specified as an array of values equal to the storage term divided by layer thickness. For stratified glacial deposits in layer 1, the storage term represented specific yield and was set equal to 0.18. For till-covered uplands in layer 1, the storage term also conceptually represented specific yield. However, a storage term for till-covered uplands in layer 1, 2.5×10⁻⁶, was used in the final calibrated model that was considerably lower than the expected specific yield of these deposits, based on literature sources. This approach was used to compensate for the inability of the model to simulate the complete dewatering of upland cells in layer 1. This inability, a consequence of using the fixed-transmissivity approach, would result in unrealistically large water exchanges with storage during times in the annual cycle when the water level in layer 1 was below the layer bottom. In the transient simulations, as in the actual ground-water systems, water-level fluctuations in the till-covered uplands were large, tens of feet in many areas; therefore, it is likely that the till deposits in these settings dry out to the extent that they no longer transmit water for some period of the year (Randall and others, 1988). For bedrock in layer 2, the storage term represents a confined storage coefficient and was specified as 2.0×10⁻⁷, which is consistent with literature sources. A storage term of 1.0 was used for areas simulated as ponds.
Model Calibration
The transient model was calibrated primarily by varying the monthly recharge rates, evapotranspiration, and storage properties within ranges of reasonable values to obtain a close match between simulated and observed monthly streamflows and water levels. Observed values were the mean monthly water levels and flows estimated for 1997–2001 at the same long-term and study sites as used in the steady-state model (tables 11 and 12). Alternative models of aquifer geometry and hydraulic properties also were tested that varied layer thickness and hydraulic conductivity for layer 1 in uplands and varied the minimum thicknesses for layer 1 in stratified glacial deposits. An alternative distribution and routing of recharge in uplands also was tested to simulate the recharge of unchanneled runoff from uplands. In this test, recharge in uplands was reduced by about 30 percent and the volumetric difference was applied as an enhanced recharge to the upland edge of stratified glacial
deposits. Finally, model runs were completed in which the storage properties of thin stratified glacial deposits were reduced to approximate the effects of model cells in these areas going dry.
Average monthly recharge rates used in the calibrated transient model are shown in figure 25. Precipitation recharge rates in the model generally were higher in winter and spring than basinwide rates estimated from streamflow and climate records (fig. 5) and lower than estimated basinwide rates in summer. In some months, the recharge rates used in the transient model exceeded the average monthly precipitation rate. This result is reasonable because the precipitation recharge rate, particularly to stratified glacial deposits, includes several processes that were not directly simulated in the model, including recharge of snowmelt, recharge of unchanneled surface runoff from uplands, and possibly recharge at the edges of saturated wetland areas.
Model-calculated water-level fluctuations generally corresponded well with the observed timing of seasonal high and low water levels (fig. 26). In most cases, however, the amplitude of observed water-level fluctuations was overestimated, in many cases by several feet. The average difference between model-calculated and observed water-level fluctuations was 2.71 ft. One possible explanation for this difference is that water-level fluctuations in the uplands affected model-calculated water levels in the stratified glacial deposits. Model-calculated water levels in the simulated till deposits of the uplands, especially in areas of higher elevations, fluctuated by tens of feet and probably overestimated actual water-level fluctuations in these deposits. Spatial heterogeneity in the storage properties of the stratified glacial deposits, which was not simulated, is another likely factor in the overestimation of water-level fluctuations at some observation wells. The specified storage term of 0.18, used basinwide for stratified glacial deposits, probably was too low for deposits in the vicinity of some observation wells. For example, wells ACW255, HZW147, and S3W184 were screened in medium or coarse to very coarse sand, deposits for which a higher storage term probably would be appropriate. In contrast, wells A9W53 and WRW150, where water-level fluctuations were better matched, were screened in silt, very fine sand, and clay and in poorly sorted, silty fine to very coarse sand, respectively. Water-levels fluctuations in simulated ponds generally were underestimated. This result probably was a consequence of the constant elevation specified for stage in stream cells within the pond. In actuality, pond levels, even in instream ponds with dams or control structures, fluctuate in response to seasonal water-level changes and runoff events (fig. 11).
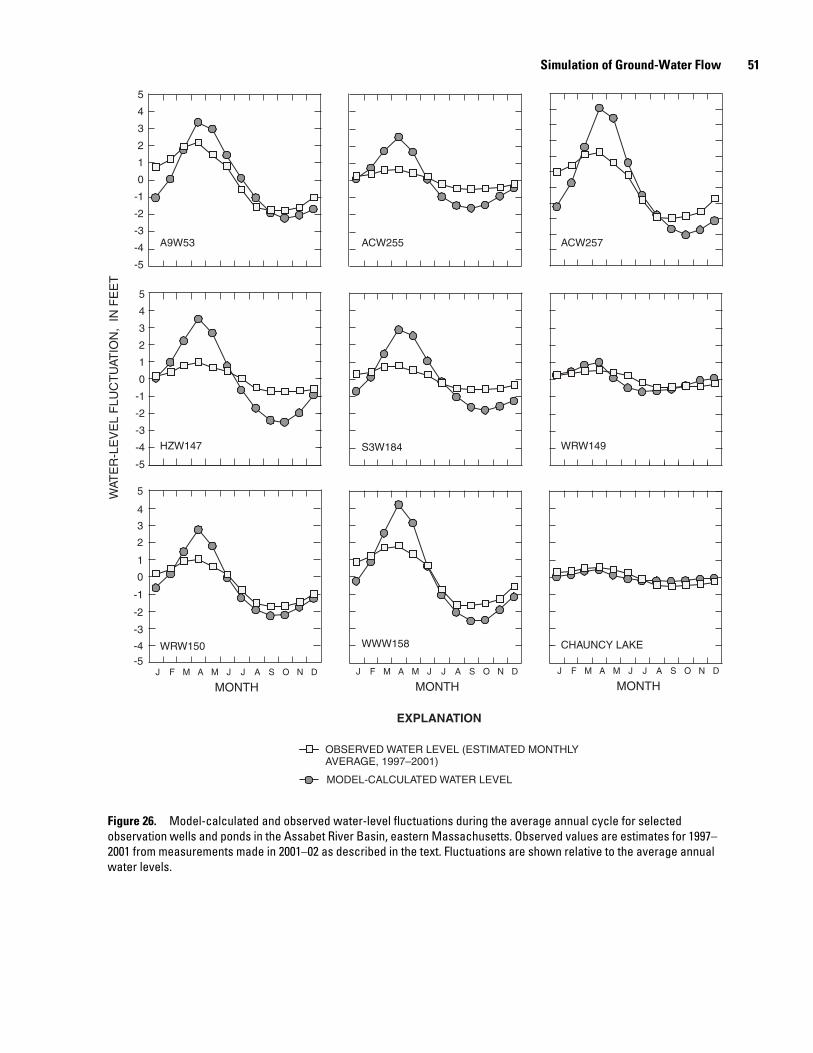
Simulation of Ground-Water Flow 51
ACW255A9W53 ACW257
WRW149
WRW150 WWW158
S3W184HZW147
EXPLANATION
MODEL-CALCULATED WATER LEVEL
OBSERVED WATER LEVEL (ESTIMATED MONTHLY AVERAGE, 1997–2001)
WAT
ER
-LE
VE
L F
LUC
TU
ATIO
N,
IN F
EE
T
CHAUNCY LAKE
-5
-3
-1
1
3
5
4
2
0
-2
-4
-5
-3
-1
1
3
5
4
2
0
-2
-4
-5
-3
-1
1
3
5
4
2
0
-2
-4
J F M A M SJ J A O N D
MONTHJ F M A M SJ J A O N D
MONTHJ F M A M SJ J A O N D
MONTH
Figure 26. Model-calculated and observed water-level fluctuations during the average annual cycle for selected observation wells and ponds in the Assabet River Basin, eastern Massachusetts. Observed values are estimates for 1997–2001 from measurements made in 2001–02 as described in the text. Fluctuations are shown relative to the average annual water levels.
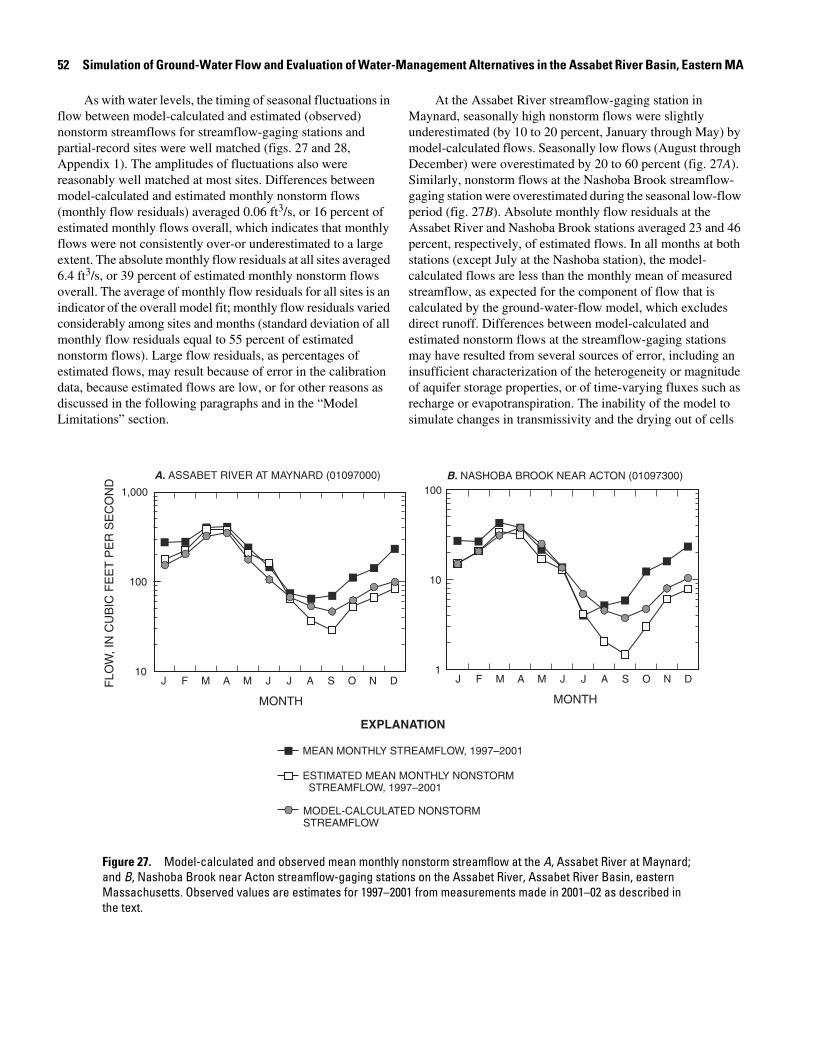
52 Simulation of Ground-Water Flow and Evaluation of Water-Management Alternatives in the Assabet River Basin, Eastern MA
As with water levels, the timing of seasonal fluctuations in flow between model-calculated and estimated (observed) nonstorm streamflows for streamflow-gaging stations and partial-record sites were well matched (figs. 27 and 28, Appendix 1). The amplitudes of fluctuations also were reasonably well matched at most sites. Differences between model-calculated and estimated monthly nonstorm flows (monthly flow residuals) averaged 0.06 ft3/s, or 16 percent of estimated monthly flows overall, which indicates that monthly flows were not consistently over-or underestimated to a large extent. The absolute monthly flow residuals at all sites averaged 6.4 ft3/s, or 39 percent of estimated monthly nonstorm flows overall. The average of monthly flow residuals for all sites is an indicator of the overall model fit; monthly flow residuals varied considerably among sites and months (standard deviation of all monthly flow residuals equal to 55 percent of estimated nonstorm flows). Large flow residuals, as percentages of estimated flows, may result because of error in the calibration data, because estimated flows are low, or for other reasons as discussed in the following paragraphs and in the “Model Limitations” section.
At the Assabet River streamflow-gaging station in Maynard, seasonally high nonstorm flows were slightly underestimated (by 10 to 20 percent, January through May) by model-calculated flows. Seasonally low flows (August through December) were overestimated by 20 to 60 percent (fig. 27A). Similarly, nonstorm flows at the Nashoba Brook streamflow-gaging station were overestimated during the seasonal low-flow period (fig. 27B). Absolute monthly flow residuals at the Assabet River and Nashoba Brook stations averaged 23 and 46 percent, respectively, of estimated flows. In all months at both stations (except July at the Nashoba station), the model-calculated flows are less than the monthly mean of measured streamflow, as expected for the component of flow that is calculated by the ground-water-flow model, which excludes direct runoff. Differences between model-calculated and estimated nonstorm flows at the streamflow-gaging stations may have resulted from several sources of error, including an insufficient characterization of the heterogeneity or magnitude of aquifer storage properties, or of time-varying fluxes such as recharge or evapotranspiration. The inability of the model to simulate changes in transmissivity and the drying out of cells
EXPLANATION
MODEL-CALCULATED NONSTORM STREAMFLOW
MEAN MONTHLY STREAMFLOW, 1997–2001
FLO
W, I
N C
UB
IC F
EE
T P
ER
SE
CO
ND
ESTIMATED MEAN MONTHLY NONSTORM STREAMFLOW, 1997–2001
J F M A M SJ J A O N D
MONTH
J F M A M SJ J A O N D
MONTH
100
10
1
1,000
100
10
A. ASSABET RIVER AT MAYNARD (01097000) B. NASHOBA BROOK NEAR ACTON (01097300)
Figure 27. Model-calculated and observed mean monthly nonstorm streamflow at the A, Assabet River at Maynard; and B, Nashoba Brook near Acton streamflow-gaging stations on the Assabet River, Assabet River Basin, eastern Massachusetts. Observed values are estimates for 1997–2001 from measurements made in 2001–02 as described in the text.
Simulation of Ground-Water Flow 53
in thinly saturated areas—changes that accompany seasonal water-table fluctuations—also may have contributed to differences between model-calculated and estimated nonstorm flows. Efforts to compensate for these drawbacks of the fixed-transmissivity approach, by using alternative model geometries, such as previously described, did not greatly change the model-calculated fluctuations in flow at the streamflow-gaging stations. Also, the estimated mean monthly nonstorm streamflows at the stations, which are used as calibration data for the transient model, contain sources of error, as described
previously. Moreover, estimated mean monthly nonstorm streamflow for August to December of 1997–2001 were unusually low, relative to long-term values, ranging from 40 to 60 percent lower than period-of- record values for the Assabet River station and from 50 to 70 percent lower for the Nashoba Brook station. Long-term storage effects, resulting from the near-drought conditions in 1999 and 2001 (fig. 4), that were not simulated in the model also may have affected low estimated nonstorm streamflows for 1997–2001.
1,000
100
10
1,000
100
10
1,000
100
10
1,000
100
10
EXPLANATION
ESTIMATED MEAN MONTHLY STREAMFLOW, 1997–2001
FLO
W, I
N C
UB
IC F
EE
T P
ER
SE
CO
ND
ESTIMATED MEAN MONTHLY NONSTORM STREAMFLOW, 1997–2001
J F M A M SJ J A O N D
MONTH
J F M A M SJ J A O N D
MONTH
MODEL-CALCULATED NONSTORM STREAMFLOW
90-PERCENT CONFIDENCE INTERVAL AROUND ESTIMATED FLOW
100
10
1
ASSABET RIVER AT SCHOOL STREET (01096630)
ASSABET RIVER AT ALLEN STREET(01096710)
ASSABET RIVER AT SOLOMON POND MALL (01096730)
ASSABET RIVER AT ROUTE 85(01096840)
ASSABET RIVER AT PINE STREET (01097048)
A. ASSABET RIVER SITES
Figure 28. Model-calculated and observed mean nonstorm streamflow at flow-measurement sites on the A, Assabet River; and B, tributaries, Assabet River Basin, eastern Massachusetts. Observed values are estimates for 1997–2001 from measurements made in 2001–02 as described in the text.
54 Simulation of Ground-Water Flow and Evaluation of Water-Management Alternatives in the Assabet River Basin, Eastern MA
ESTIMATED MEAN MONTHLY NONSTORM STREAMFLOW, 1997–2001
HOP BROOK (01096615)
COLD HARBOR BROOK (01096705)
HOWARD BROOK (01096700)
NORTH BROOK (01096805)
100
10
1
100
10
0.1
1
100
10
0.1
1
100
10
1
100
10
0.1
1
DANFORTH BROOK (01096853)
ELIZABETH BROOK (01096945)
100
10
1
EXPLANATION
MODEL-CALCULATED NONSTORM STREAMFLOW
ESTIMATED MEAN MONTHLY STREAMFLOW, 1997–2001
FLO
W, I
N C
UB
IC F
EE
T P
ER
SE
CO
ND
MONTH MONTH
B. TRIBUTARY SITES
90-PERCENT CONFIDENCE INTERVAL AROUND ESTIMATED FLOW
J F M A M SJ J A O N D J F M A M SJ J A O N D
Figure 28—Continued. Model-calculated and observed mean monthly nonstorm streamflow at flow-measurement sites on the A, Assabet River; and B, tributaries, Assabet River Basin, eastern Massachusetts. Observed values are estimates for 1997–2001 from measurements made in 2001–02 as described in the text.
Simulation of Ground-Water Flow 55
1,000
10
0.1
1
100
FORT POND BROOK (01097270)
1,000
100
1
10NASHOBA BROOK AT COMMONWEALTH AVENUE (01097380)
J F M A M SJ J A O N D J F M A M SJ J A O N D
MONTH MONTH
B. TRIBUTARY SITES
FLO
W, I
N C
UB
IC F
EE
T P
ER
SE
CO
ND
ESTIMATED MEAN MONTHLY NONSTORM STREAMFLOW, 1997–2001
EXPLANATION
ESTIMATED MEAN MONTHLY STREAMFLOW, 1997–2001
MODEL-CALCULATED NONSTORM STREAMFLOW
90-PERCENT CONFIDENCE INTERVAL AROUND ESTIMATED FLOW
Figure 28—Continued. Model-calculated and observed mean monthly nonstorm streamflow at flow-measurement sites on the A, Assabet River; and B, tributaries, Assabet River Basin, eastern Massachusetts. Observed values are estimates for 1997–2001 from measurements made in 2001–02 as described in the text.
At partial-record flow measurement sites, model-calculated mean monthly flows were, in most cases, within 90-percent confidence intervals of estimated nonstorm streamflows in most months (fig. 28B). At two tributary sites (North Brook, 01096805, and Elizabeth Brook, 01096945), estimated nonstorm streamflows in low-flow months were overestimated significantly. These differences may have resulted for similar reasons, as discussed previously, for low flows at the streamflow-gaging stations. Estimated flows at the tributary partial-record sites contain additional sources of error, however, because they are based on correlation with long-term stations and on much less data than estimates for the Assabet River and Nashoba Brook stations. Low flows estimated at partial-record sites may be particularly affected by error. In some cases, measured flows during the study period at tributary sites were approximately zero or less than could be measured, and these values were not included in the correlation of study-site flows with long-term stations. Consequently, the low-flow conditions were not well characterized at these sites.
Monthly average nonstorm streamflows and water levels calculated with the transient model were not sensitive to changes in hydraulic conductivity. Increasing or decreasing the hydraulic conductivity (Kh and Kv) of stratified glacial deposits by a factor of 2 had little effect on model-calculated nonstorm streamflows (figs. 29A, B). Absolute monthly flow residuals with these changes were similar to those produced by the calibrated model (table 14). Increasing or decreasing the hydraulic conductivity of the till and bedrock uplands (layer 1) by a factor of 2 similarly had little effect on model-calculated nonstorm streamflows (figs. 29C, D and table 14). These changes in hydraulic conductivity of stratified glacial deposits or till also had little effect on model-calculated water-level fluctuations during the annual cycle. The average difference between observed (estimated values for 1997–2001) and model-calculated annual water-level fluctuations (water-level fluctuation residual) changed by 10 percent or less, relative to the calibrated model (table 14).
56 Simulation of Ground-Water Flow and Evaluation of Water-Management Alternatives in the Assabet River Basin, Eastern MA
30
15
0
25
20
10
5
400
200
0
350
250
150
50
100
300
30
15
0
25
20
10
5
30
15
0
25
20
10
5
30
15
0
25
20
10
5
400
200
0
350
250
150
50
100
300
400
200
0
350
250
150
50
100
300
400
200
0
350
250
150
50
100
300
COLD HARBORBROOK
OBSERVEDCALIBRATED MODELSD K x 2SD K / 2
OBSERVEDCALIBRATED MODELSD K x 2SD K / 2
OBSERVEDCALIBRATED MODELTILL K x 2TILL K / 2
OBSERVEDCALIBRATED MODELTILL K x 2TILL K / 2
OBSERVEDCALIBRATED MODELSD Ss x 2SD Ss / 2
OBSERVEDCALIBRATED MODELSD Ss x 2SD Ss / 2
OBSERVEDCALIBRATED MODELR FLUCTUATIONS / 2ET RATE / 2
OBSERVEDCALIBRATED MODELR FLUCTUATIONS / 2ET RATE / 2
COLD HARBORBROOK
COLD HARBORBROOK
COLD HARBORBROOK
ASSABET RIVERAT MAYNARD
ASSABET RIVERAT MAYNARD
ASSABET RIVERAT MAYNARD
ASSABET RIVERAT MAYNARD
A. B.
C. D.
E. F.
G. H.
FLO
W, I
N C
UB
IC F
EE
T P
ER
SE
CO
ND
J F M A M SJ J A O N D
MONTH
J F M A M SJ J A O N D
MONTH
Figure 29. Observed and model-calculated monthly nonstorm streamflow for the calibrated transient model and for several alternative model parameters at the Assabet River at Maynard and a selected tributary site in the Assabet River Basin, eastern Massachusetts. Horizontal and vertical hydraulic conductivity (K) of stratified glacial deposits (SD) multiplied and divided by 2 for the A, Assabet River at Maynard and B, Cold Harbor Brook; horizontal and vertical hydraulic conductivity of till multiplied and divided by 2 for the C, Assabet River at Maynard and D, Cold Harbor Brook; storage property (Ss) of stratified glacial deposits increased and decreased by 50 percent for the E, Assabet River at Maynard and F, Cold Harbor Brook; recharge (R) fluctuations during the annual cycle and evapotranspiration (ET) rate in wetlands and non-wetland areas decreased by 50 percent for the G, Assabet River at Maynard and H, Cold Harbor Brook.
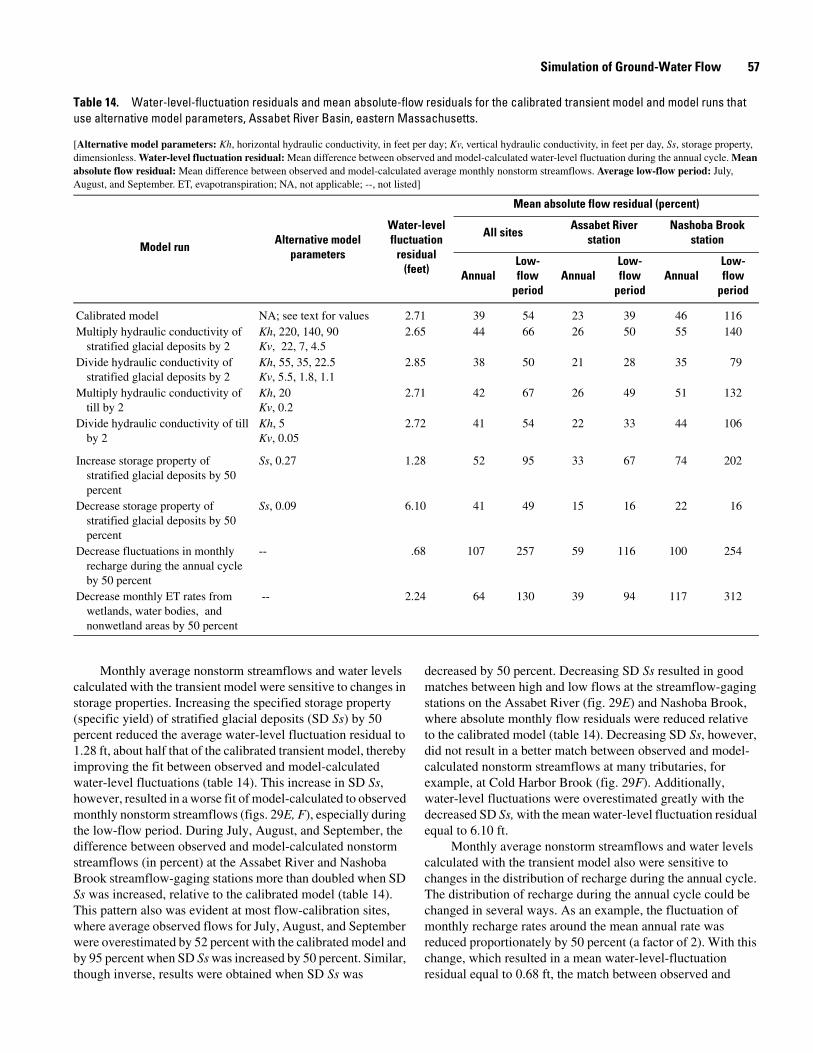
Simulation of Ground-Water Flow 57
Table 14. Water-level-fluctuation residuals and mean absolute-flow residuals for the calibrated transient model and model runs that use alternative model parameters, Assabet River Basin, eastern Massachusetts.
[Alternative model parameters: Kh, horizontal hydraulic conductivity, in feet per day; Kv, vertical hydraulic conductivity, in feet per day, Ss, storage property, dimensionless. Water-level fluctuation residual: Mean difference between observed and model-calculated water-level fluctuation during the annual cycle. Mean absolute flow residual: Mean difference between observed and model-calculated average monthly nonstorm streamflows. Average low-flow period: July, August, and September. ET, evapotranspiration; NA, not applicable; --, not listed]
Model runAlternative model
parameters
Water-level fluctuation
residual (feet)
Mean absolute flow residual (percent)
All sitesAssabet River
stationNashoba Brook
station
Annual Low-flow
period Annual
Low-flow
period Annual
Low-flow
period
Calibrated model NA; see text for values 2.71 39 54 23 39 46 116Multiply hydraulic conductivity of
stratified glacial deposits by 2 Kh, 220, 140, 90Kv, 22, 7, 4.5
2.65 44 66 26 50 55 140
Divide hydraulic conductivity of stratified glacial deposits by 2
Kh, 55, 35, 22.5 Kv, 5.5, 1.8, 1.1
2.85 38 50 21 28 35 79
Multiply hydraulic conductivity of till by 2
Kh, 20Kv, 0.2
2.71 42 67 26 49 51 132
Divide hydraulic conductivity of till by 2
Kh, 5Kv, 0.05
2.72 41 54 22 33 44 106
Increase storage property of stratified glacial deposits by 50 percent
Ss, 0.27 1.28 52 95 33 67 74 202
Decrease storage property of stratified glacial deposits by 50 percent
Ss, 0.09 6.10 41 49 15 16 22 16
Decrease fluctuations in monthly recharge during the annual cycle by 50 percent
-- .68 107 257 59 116 100 254
Decrease monthly ET rates from wetlands, water bodies, and nonwetland areas by 50 percent
-- 2.24 64 130 39 94 117 312
Monthly average nonstorm streamflows and water levels calculated with the transient model were sensitive to changes in storage properties. Increasing the specified storage property (specific yield) of stratified glacial deposits (SD Ss) by 50 percent reduced the average water-level fluctuation residual to 1.28 ft, about half that of the calibrated transient model, thereby improving the fit between observed and model-calculated water-level fluctuations (table 14). This increase in SD Ss, however, resulted in a worse fit of model-calculated to observed monthly nonstorm streamflows (figs. 29E, F), especially during the low-flow period. During July, August, and September, the difference between observed and model-calculated nonstorm streamflows (in percent) at the Assabet River and Nashoba Brook streamflow-gaging stations more than doubled when SD Ss was increased, relative to the calibrated model (table 14). This pattern also was evident at most flow-calibration sites, where average observed flows for July, August, and September were overestimated by 52 percent with the calibrated model and by 95 percent when SD Ss was increased by 50 percent. Similar, though inverse, results were obtained when SD Ss was
decreased by 50 percent. Decreasing SD Ss resulted in good matches between high and low flows at the streamflow-gaging stations on the Assabet River (fig. 29E) and Nashoba Brook, where absolute monthly flow residuals were reduced relative to the calibrated model (table 14). Decreasing SD Ss, however, did not result in a better match between observed and model-calculated nonstorm streamflows at many tributaries, for example, at Cold Harbor Brook (fig. 29F). Additionally, water-level fluctuations were overestimated greatly with the decreased SD Ss, with the mean water-level fluctuation residual equal to 6.10 ft.
Monthly average nonstorm streamflows and water levels calculated with the transient model also were sensitive to changes in the distribution of recharge during the annual cycle. The distribution of recharge during the annual cycle could be changed in several ways. As an example, the fluctuation of monthly recharge rates around the mean annual rate was reduced proportionately by 50 percent (a factor of 2). With this change, which resulted in a mean water-level-fluctuation residual equal to 0.68 ft, the match between observed and
58 Simulation of Ground-Water Flow and Evaluation of Water-Management Alternatives in the Assabet River Basin, Eastern MA
model-calculated water-level fluctuations was improved greatly. However, the fluctuations in mean monthly nonstorm streamflows also were decreased greatly, such that the match between observed and model-calculated flows was much worse, especially during the low-flow period (table 14). For July, August, and September, absolute monthly flow residuals with reduced fluctuation of recharge averaged 116 percent of observed flows for the Assabet River streamflow-gaging station, 254 percent for the Nashoba Brook station, and 257 percent for all flow-calibration sites.
Finally, changes in the ET rate specified for wetlands, water bodies, and nonwetland areas also affected model-calculated nonstorm streamflows and water-level fluctuations. Decreasing the specified ET rates by 50 percent resulted in less fluctuations in water levels than simulated by the calibrated model (table 14). Model-calculated monthly nonstorm stream-flows were higher than in the calibrated model, especially in the summer. This resulted in a worse fit between observed and model-calculated monthly nonstorm streamflows at many sites (figs. 29G, H and table 14).
The model runs with alternative values for storage properties and monthly recharge rates illustrate how the calibrated transient model balanced the need to match the observed monthly nonstorm streamflows and annual water-level fluctuations. In evaluating these model results, however, it is important to consider that the observed data used in model calibration were estimates that included several potential sources of error. Also, the inability of the ground-water-flow model to simulate unsaturated-zone and surface-water processes may contribute to differences between model-calculated and observed water-levels and streamflows, as discussed in the “Model Limitations” section.
Model-Calculated Water Budgets and Flows
Average water budgets for March and September, the high- and low-flow months of the simulated annual cycle, were calculated for the Assabet River Basin (table 15) and for its subbasins (fig. 30; subbasins shown in fig. 1). The detailed water budgets for the subbasins are tabulated in Appendix 2. During March, inflows to the ground-water-flow system were nearly all from precipitation recharge; outflows were about equally to storage and ground-water discharge to streams. During September, inflows to the ground-water-flow system were nearly all from storage, and outflows were about equal to evapotranspiration (from wetlands and nonwetland areas) and ground-water discharge to streams.
Anthropogenic outflows and inflows were larger percentages of total flows through the ground-water system or of streamflows in September than annually or in March, primarily because flows were lower overall in September. Basinwide, anthropogenic outflows equalled 9 percent of total flows through the ground-water system for water-supply withdrawals, 1.5 percent for infiltration to sewers, and less than 1 percent for other outflows in September; the inflow of septic-system return flow was 4 percent of total flows. Among subbasins, water withdrawals varied from 20 to 25 percent of total flows in the Assabet Upper Main Stem and Fort Meadow Brook subbasins to zero in basins with private supply. ET also varied among subbasins, depending to a large extent on the areal distribution of wetlands. The transient model also indicates that anthropogenic flows are large percentages of total model-calculated flows during low-flow periods in the same subbasins as on an average annual basis (figs. 22B and 30B). Anthropogenic outflows account for more than 20 percent of total model-calculated flows in September in the Fort Meadow and Assabet Main Stem Upper subbasins.
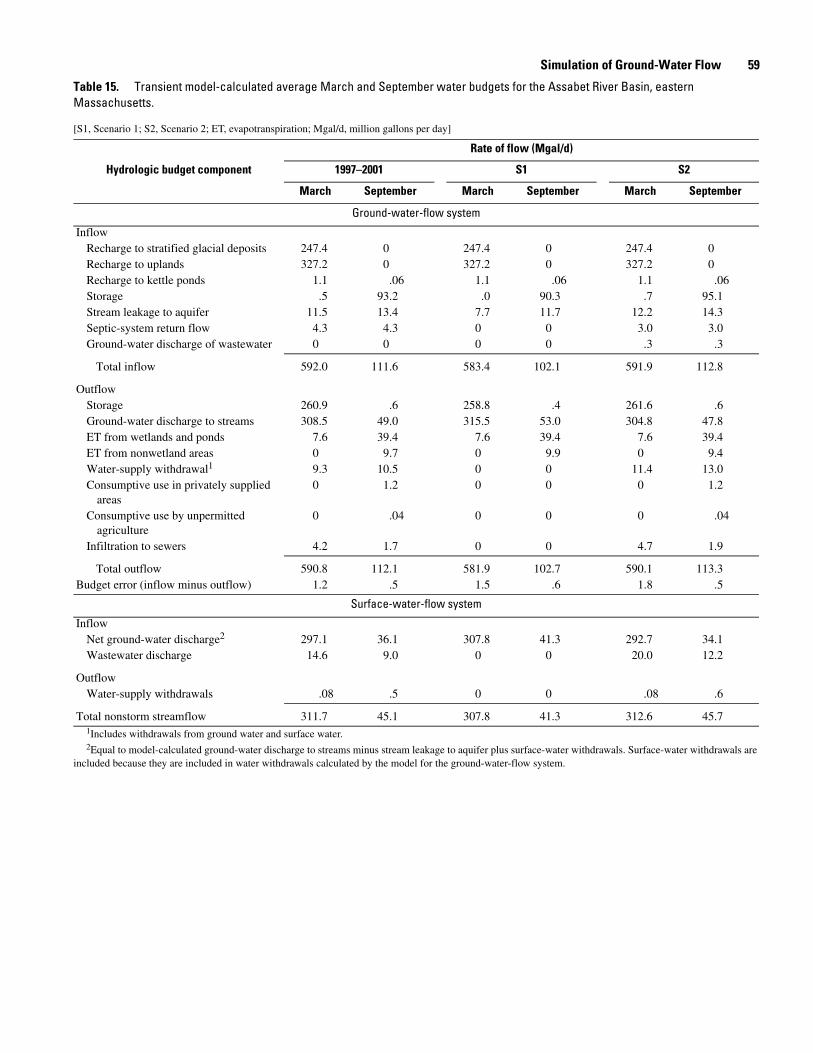
Simulation of Ground-Water Flow 59
1Includes withdrawals from ground water and surface water.2Equal to model-calculated ground-water discharge to streams minus stream leakage to aquifer plus surface-water withdrawals. Surface-water withdrawals are
included because they are included in water withdrawals calculated by the model for the ground-water-flow system.
Table 15. Transient model-calculated average March and September water budgets for the Assabet River Basin, eastern Massachusetts.
[S1, Scenario 1; S2, Scenario 2; ET, evapotranspiration; Mgal/d, million gallons per day]
Hydrologic budget component
Rate of flow (Mgal/d)
1997–2001 S1 S2
March September March September March September
Ground-water-flow system
InflowRecharge to stratified glacial deposits 247.4 0 247.4 0 247.4 0Recharge to uplands 327.2 0 327.2 0 327.2 0Recharge to kettle ponds 1.1 .06 1.1 .06 1.1 .06Storage .5 93.2 .0 90.3 .7 95.1Stream leakage to aquifer 11.5 13.4 7.7 11.7 12.2 14.3Septic-system return flow 4.3 4.3 0 0 3.0 3.0Ground-water discharge of wastewater 0 0 0 0 .3 .3
Total inflow 592.0 111.6 583.4 102.1 591.9 112.8
OutflowStorage 260.9 .6 258.8 .4 261.6 .6Ground-water discharge to streams 308.5 49.0 315.5 53.0 304.8 47.8ET from wetlands and ponds 7.6 39.4 7.6 39.4 7.6 39.4ET from nonwetland areas 0 9.7 0 9.9 0 9.4Water-supply withdrawal1 9.3 10.5 0 0 11.4 13.0Consumptive use in privately supplied
areas0 1.2 0 0 0 1.2
Consumptive use by unpermitted agriculture
0 .04 0 0 0 .04
Infiltration to sewers 4.2 1.7 0 0 4.7 1.9
Total outflow 590.8 112.1 581.9 102.7 590.1 113.3Budget error (inflow minus outflow) 1.2 .5 1.5 .6 1.8 .5
Surface-water-flow system
InflowNet ground-water discharge2 297.1 36.1 307.8 41.3 292.7 34.1Wastewater discharge 14.6 9.0 0 0 20.0 12.2
OutflowWater-supply withdrawals .08 .5 0 0 .08 .6
Total nonstorm streamflow 311.7 45.1 307.8 41.3 312.6 45.7
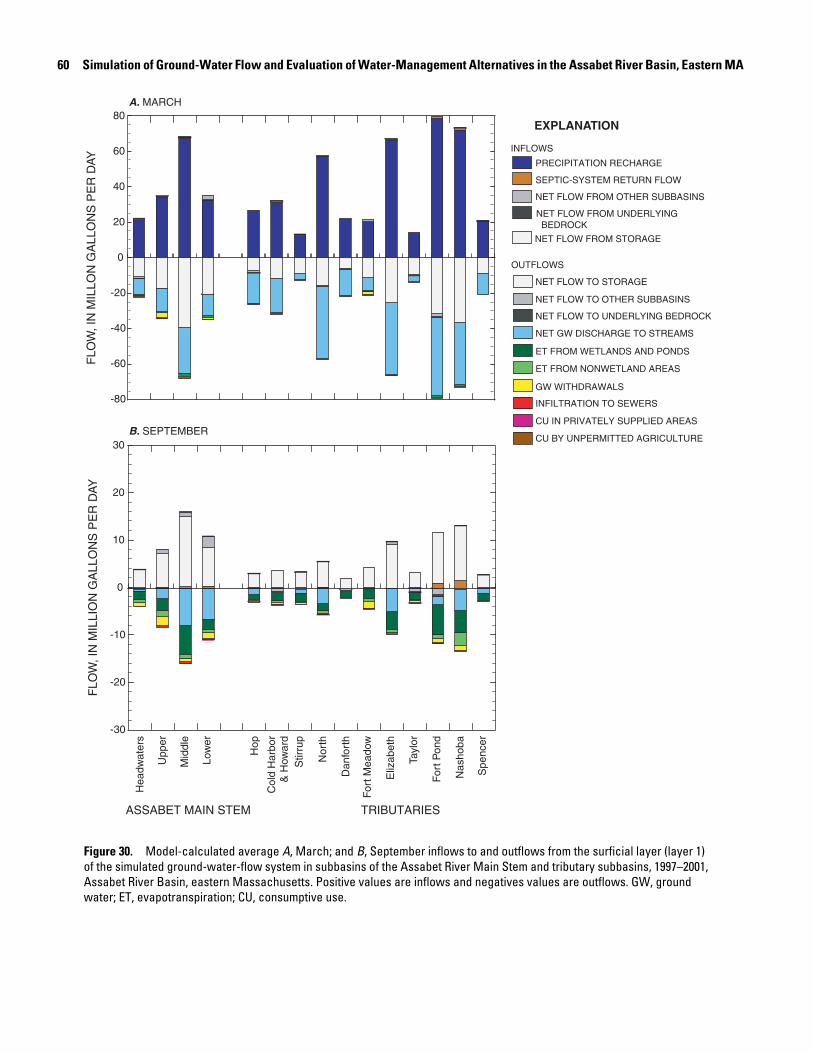
60 Simulation of Ground-Water Flow and Evaluation of Water-Management Alternatives in the Assabet River Basin, Eastern MA
Hea
dwat
ers
Upp
er
Mid
dle
Low
er
Hop
Col
d H
arbo
r &
How
ard
Nor
th
Dan
fort
h
For
t Mea
dow
Eliz
abet
h
Tayl
or
For
t Pon
d
Nas
hoba
Spe
ncer
Stir
rup
TRIBUTARIESASSABET MAIN STEM
FLO
W, I
N M
ILLO
N G
ALL
ON
S P
ER
DAY
A. MARCH80
40
20
-20
-60
-80
0
60
-40
NET FLOW FROM STORAGE
FLO
W, I
N M
ILLI
ON
GA
LLO
NS
PE
R D
AY
B. SEPTEMBER30
20
10
-10
-20
-30
0
NET FLOW TO OTHER SUBBASINS
PRECIPITATION RECHARGE
SEPTIC-SYSTEM RETURN FLOW
NET FLOW FROM OTHER SUBBASINS
NET FLOW FROM UNDERLYING BEDROCK
NET GW DISCHARGE TO STREAMS
ET FROM WETLANDS AND PONDS
ET FROM NONWETLAND AREAS
GW WITHDRAWALS
INFILTRATION TO SEWERS
CU IN PRIVATELY SUPPLIED AREAS
CU BY UNPERMITTED AGRICULTURE
EXPLANATION
INFLOWS
OUTFLOWS
NET FLOW TO UNDERLYING BEDROCK
NET FLOW TO STORAGE
Figure 30. Model-calculated average A, March; and B, September inflows to and outflows from the surficial layer (layer 1) of the simulated ground-water-flow system in subbasins of the Assabet River Main Stem and tributary subbasins, 1997–2001, Assabet River Basin, eastern Massachusetts. Positive values are inflows and negatives values are outflows. GW, ground water; ET, evapotranspiration; CU, consumptive use.
Simulation of Ground-Water Flow 61
Anthropogenic inflows and outflows to the surface-water-flow system (wastewater discharges and surface-water withdrawals) also accounted for larger fractions of total nonstorm streamflow in the main stem Assabet subbasins in September (fig. 31B) than annually or in March (figs. 23 and 31A). In September, wastewater accounted for on average 55, 32, and 20 percent of model-calculated nonstorm streamflow out of the Assabet Main Stem Upper, Middle, and Lower subbasins, respectively, which is at least twice the fraction of flow that is wastewater on an annual average basis. At its maximum, immediately downstream of the Westborough Regional Wastewater Treatment Facility (stream mile 1.04, fig. 32), wastewater accounted for 93 percent of average September model-calculated nonstorm streamflow in the Assabet River. In March, when overall flows were much higher, wastewater accounted for only 14, 8, and 5 percent of nonstorm streamflow out of the Assabet Main Stem Upper, Middle, and Lower subbasins, respectively (fig. 31A). Surface-water withdrawals, although larger percentages of total flows in September than annually, remained insignificant fractions of total model-calculated nonstorm streamflow in the main stem Assabet River (fig. 31B).
Model-calculated nonstorm streamflows at selected sites, when converted to cubic feet per second per square mile, can be compared to minimum streamflow requirements for habitat protection (fig. 33). Minimum streamflow requirements to maintain aquatic habitat recently were investigated for sites in Massachusetts, including six sites in the Assabet River Basin (Armstrong and others, 2004; Parker and others, 2004; table 16). Median values of 0.21 and 0.18 ft3/s/mi2 were deter-mined for the low-flow period (R2Cross and wetted-perimeter methods, fig. 33), and a median value of 0.87 ft3/s/mi2 was determined for the high-flow period (R2Cross method) at 10 riffle sites in the Assabet and adjacent Charles River Basins; these values also bracketed the interquartile range of mean monthly flows for July, August, and September at several nearby streamflow-gaging stations with relatively unaltered flow (Parker and others, 2004). The minimum streamflow requirements determined with these two methods represent flows needed to provide a minimum water depth and velocity in the stream channel to maintain a healthy habitat for fluvial fish (Armstrong and others, 2001; Parker and others, 2004).
NET GW DISCHARGE TO STREAMS FROM UPSTREAM AND TRIBUTARIES
NET GW DISCHARGE TO STREAMS
WASTEWATER DISCHARGE UPSTREAM
WASTEWATER DISCHARGE IN SUBBASIN
SW WITHDRAWALS UPSTREAM
SW WITHDRAWALS IN SUBBASIN
EXPLANATION
B. SEPTEMBER50
40
20
10
30
0
-10Assabet MS Head
Assabet MS Upper
Assabet MS Middle
Assabet MS Lower
A. MARCH350
300
250
150
100
50
200
0
-50Assabet MS Head
Assabet MS Upper
Assabet MS Middle
Assabet MS Lower
FLO
W, I
N M
ILLI
ON
GA
LLO
NS
PE
R D
AY
Figure 31. Model-calculated components of average A, March; and B, September nonstorm streamflow in subbasins of the Assabet River Main Stem (MS), eastern Massachusetts. SW, surface water; GW, ground water. Surface-water withdrawals in September of 0.12, 0.12, and 0.16 million gallons per day from the Upper, Middle, and Lower subbasins, respectively, are too small to be apparent at this scale.
62 Simulation of Ground-Water Flow and Evaluation of Water-Management Alternatives in the Assabet River Basin, Eastern MA
TOTAL FLOW, 1997–2001
EXPLANATION
0 2 141210864 323028262422201816
TOTAL FLOW, SCENARIO 1
TOTAL FLOW, SCENARIO 2
WASTEWATER, 1997–2001
WASTEWATER, SCENARIO 2
STREAM MILE, DOWNSTREAM OF A1 IMPOUNDMENT
FLO
W, I
N C
UB
IC F
EE
T P
ER
SE
CO
ND
500
400
300
100
200
0
450
350
250
150
50
Hop
Bro
ok
Col
d H
arbo
r an
d H
owar
d B
rook
s
Nor
th B
rook
Stir
rup
Bro
ok
Nas
hoba
Bro
ok
Spe
ncer
Bro
ok
Eliz
abet
h B
rook
Tayl
or B
rook
For
t Mea
dow
Bro
ok
Dan
fort
h B
rook
80
60
40
20
0
70
50
30
10
Hop
Bro
ok
Col
d H
arbo
r an
d H
owar
d B
rook
s
Nor
th B
rook
Stir
rup
Bro
ok
Nas
hoba
Bro
ok
Spe
ncer
Bro
ok
Eliz
abet
h B
rook
Tayl
or B
rook
For
t Mea
dow
Bro
ok
Dan
fort
h B
rook
A. MARCH
B. SEPTEMBER
1 2 3 4 5
1 2
3
4 5
Figure 32. Model-calculated average A, March and B, September total nonstorm streamflow and the component of streamflow that originated as wastewater, for existing conditions (1997–2001) and two hypothetical scenarios of altered withdrawals and discharges in the Assabet River Basin, eastern Massachusetts. Numbers show locations of wastewater-treatment facility (WWTF) discharges: 1, Westborough WWTF; 2, Marlborough WWTF; 3, Hudson WWTF; 4, Maynard WWTF; 5, MCI Concord WWTF.
Model-calculated mean monthly nonstorm streamflows under existing conditions in September (in most cases the lowest-flow month of the annual cycle) at the outlets of about half the tributary subbasins were above the median minimum stream-flow requirements for low flows for Assabet and Charles River Basin sites (0.18 or 0.21 ft3/s/mi2; fig. 33; Parker and others, 2004). Model-calculated mean September nonstorm streamflow for Cold Harbor and Howard, Danforth, Fort Meadow, Taylor,
and Fort Pond Brook subbasins were lower than the low-flow minimum streamflow requirement; these include subbasins where withdrawals and other flow alterations were 10 to 25 percent of total flows. At five of the six sites in the Assabet River Basin where minimum streamflow requirements were determined, model-calculated mean September nonstorm streamflow was above or near the minimum streamflow requirements for low-flow conditions (table 16).
Simulation of Ground-Water Flow 63
Hea
dwat
ers
Upp
er
Mid
dle
Low
er
ASSABET MAIN STEM TRIBUTARIES
FLO
W, I
N C
UB
IC F
EE
T P
ER
SE
CO
ND
PE
R S
QU
AR
E M
ILE
A. ANNUAL
Hop
Col
d H
arbo
r&
How
ard
Nor
th
Dan
fort
h
For
t Mea
dow
Eliz
abet
h
Tayl
or
For
t Pon
d
Nas
hoba
Spe
ncer
Stir
rup
B. MARCH
C. SEPTEMBER
2.5
2.0
1.0
0
0.5
1.5
4.5
3.5
1.5
0
0.5
2.5
1.0
2.0
3.0
4.0
1.6
1.2
0.4
0
0.8
0.2
0.6
1.0
1.4
TOTAL BASIN
1997–2001
SCENARIO 1
SCENARIO 2
EXPLANATION
MINIMUM STREAMFLOW REQUIREMENT
R2CROSS METHOD, LOW FLOW
R2CROSS METHOD, HIGH FLOW
WETTED-PERIMETER METHOD, SUMMER LOW FLOW
Figure 33. Model-calculated average A, annual; B, March; and C, September nonstorm streamflow from subbasins of the Assabet River Main Stem, eastern Massachusetts, and tributaries for comparison with minimum streamflow requirements for the protection of aquatic habitat. Minimum streamflow requirements from Parker and others (2004).
64 Simulation of Ground-Water Flow and Evaluation of Water-Management Alternatives in the Assabet River Basin, Eastern MA
1 Min
imum
str
eam
flow
req
uire
men
t bas
ed o
n hy
drau
lic m
odel
for
one
str
eam
-cha
nnel
cro
ss s
ecti
on o
nly.
2 Str
eam
cha
nnel
at r
iffl
e si
te w
as a
con
stru
cted
cha
nnel
.
Tabl
e 16
. M
odel
-cal
cula
ted
mea
n m
onth
ly n
onst
orm
stre
amflo
ws
for A
ugus
t and
Sep
tem
ber a
t site
s fo
r com
paris
on w
ith m
inim
um s
tream
flow
requ
irem
ents
for h
abita
t pr
otec
tion,
Ass
abet
Riv
er B
asin
, eas
tern
Mas
sach
uset
ts.
[Min
imum
str
eam
flow
req
uire
men
t fo
r ha
bita
t pr
otec
tion
: fro
m G
.W. P
arke
r, U
.S. G
eolo
gica
l Sur
vey,
wri
tten
com
mun
., 20
04. f
t3 /s/
mi2 ,
cub
ic f
oot p
er s
econ
d pe
r sq
uare
mil
e; m
i2 , s
quar
e m
ile]
Stat
ion
num
ber
Stat
ion
nam
eD
rain
age
area
(mi2 )
Min
imum
str
eam
flow
re
quir
emen
t for
ha
bita
t pro
tect
ion
(ft3 /s
/mi2 )
Mod
el-c
alcu
late
d no
n-st
orm
str
eam
flow
(f
t3 /s/m
i2 )
R2Cr
oss
met
hod
Wet
ted-
perim
eter
m
etho
d
1997
–200
1Sc
enar
io 1
Scen
ario
2
Hig
h flo
wLo
w
flow
Ann
ual
Mar
chSe
ptem
ber
Ann
ual
Mar
chSe
ptem
ber
Ann
ual
Mar
chSe
ptem
ber
0109
6015
Ass
abet
Riv
er, F
ishe
r St
reet
, W
estb
orou
gh6.
81.
010.
070.
050.
752.
110.
080.
942.
290.
230.
742.
100.
09
0109
6701
Col
d H
arbo
r B
rook
, Che
rry
Stre
et, N
orth
boro
ugh1
5.1
.69
.05
.26
1.36
3.24
.21
1.43
3.35
.26
1.35
3.23
.20
0109
6853
Dan
fort
h B
rook
, Rou
te 8
5,
Hud
son
5.1
2.13
.30
.51
1.12
3.29
.06
1.14
3.30
.07
1.12
3.28
.06
0109
6877
Fort
Mea
dow
Bro
ok, S
hay
Stre
et, H
udso
n5.
01.
51.4
5.3
5.8
91.
65.3
6.9
81.
76.4
3.8
51.
61.3
3
0109
6945
Eliz
abet
h B
rook
off
Whi
te P
ond
Roa
d, S
tow
18.7
.55
.34
.18
1.38
3.26
.40
1.41
3.27
.43
1.38
3.26
.40
0109
7380
Nas
hoba
Bro
ok,C
omm
onw
ealth
A
venu
e, W
est C
onco
rd2
48.0
.14
.10
.11
1.06
2.54
.20
1.06
2.54
.19
1.05
2.53
.19
Simulation of Ground-Water Flow 65
Several factors complicate the comparison of model-calculated flows with minimum streamflow requirements. Model-calculated flows may under- or overestimate actual average monthly flows at measurement sites. For example, model calibration data indicated that mean monthly flows during the low-flow period were overestimated by the model at sites in Elizabeth and North Brooks; estimated flow values were equal to 0.24 and 0.17 ft3/s/mi2, respectively, at partial-record measurement sites (Appendix 2), as compared to model-calculated values of 0.39 and 0.29 ft3/s/mi2. Also, the median minimum streamflow requirements are based on site-specific values that are variable. For example, minimum streamflow requirements for low-flow conditions determined with the R2Cross method varied from 0.05 to 0.45 ft3/s/mi2 for the six sites in the Assabet River Basin (table 16). This variability may result partly from differences in stream-channel materials, flow alterations in the basin, or other sources. Therefore, minimum flows to maintain fluvial habitat may vary naturally among subbasins, and along stream reaches within subbasins. Model-calculated flows are monthly averages of nonstorm flow. A mean September model-calculated flow that is at or near the minimum streamflow requirement may represent mean daily flows that are below the minimum streamflow requirement about half the time. Conversely, stormwater flows augment mean daily flows during some of this time. Finally, application of minimum streamflow requirements, such as determined by methods like these, for comparison with measured or model-calculated flows or for regulatory purposes would take into account the natural variability within a month and between years (Armstrong and others, 2004)
Model Limitations
The steady-state and transient flow models of the Assabet River Basin provide a regional-scale simulation of ground-water flow in the stratified glacial aquifers in the study area. As with all mathematical models of natural systems, the simplifica-tions and assumptions incorporated into the models cause limitations in their appropriate uses and to the interpretations of simulation results.
The ground-water-flow models simulate flows and water levels in surface-water features only to the extent that they represent discharge areas or boundaries for the ground-water system. Flows in simulated streams, therefore, do not include the direct runoff component of streamflow, but represent only the component of flow that originated as ground-water discharge (base flow), plus any augmentations resulting from wastewater discharge. Although delineation of storm flow and base flow conceptually is simple, runoff and the response of the hydrologic system to precipitation events are complicated and variable, such that in practice distinguishing between storm runoff and base flow is difficult. The simulated surface-water features represent a simplified version of the surface-water-flow system. The models do not simulate the hydraulics of the surface-water system, such as storage provided by impound-
ments and wetlands. Although these effects are in many cases short-term, they may affect the monthly average flows simu-lated by the ground-water-flow models. Another simplification of the surface-water system is the use of a fixed value, representing average conditions, for stream stage; this approach may lead to inaccuracies in flow rates between aquifers and streams, particularly during periods of high flow or around impoundments. Finally, wetlands are simulated in a simple way that may not adequately describe their roles and the variability in their function in the hydrologic system. For example, the seasonal effect of wetlands on streamflows, as areas of water loss through evapotranspiration during the growing season, is simulated. The role of wetlands as drains during high-flow months, however, is probably not adequately simulated, because only mapped stream channels are simulated as areas in wetlands where ground-water can discharge to the surface-water system. More information about the regional-scale function of wetlands in hydrologic systems like the Assabet River Basin, and alternative approaches for simulating them, are needed in order to more accurately simulate the role of wetlands in the basin.
Ground-water flow through till and bedrock also is simplified greatly in the Assabet River Basin models. Ground water in fractured bedrock can have a widely variable area of recharge and discharge. Water withdrawals from bedrock aquifers can be simulated, and their effects on hydrologic fluxes, including streamflows, in the basin can be determined in a general way. However, the simulated locations of contributing areas for bedrock withdrawals may differ from actual contrib-uting areas if flow patterns in the bedrock differ substantially from near-surface flow patterns. The models can be modified, however, to incorporate site-specific information about flow patterns and contributing areas for specific withdrawals, as was done for the existing models (Lyford and others, 2003) for the Maynard bedrock supply wells.
Unsaturated-zone processes are not simulated in the ground-water-flow model. Storage and flow in the unsaturated zone affect the timing of ground-water recharge and affect ground-water-level fluctuations. Lack of detailed knowledge about unsaturated-zone processes and the inability to account for them in the model may affect the calibration results. These effects probably are more significant for transient model results than for steady-state results, because unsaturated-zone processes would be expected to influence the timing of recharge.
Temporal and spatial scales also limit model use and accuracy. Hydrologic processes and hydraulic stresses were represented in the transient models as monthly averages. Simulation results are monthly average ground-water levels and flows. The models were not intended to be used to simulate changes at time scales, such as daily values, which substantially may exceed or fall below monthly average values. Spatial data available at the regional scale also limit model accuracy. For example, horizontal and vertical variations in hydraulic properties at the scale of subbasins or depositional packages
66 Simulation of Ground-Water Flow and Evaluation of Water-Management Alternatives in the Assabet River Basin, Eastern MA
were not simulated because of a lack of available data. The spatial resolution of the simulation results was limited by the area of the 200×200-ft grid cell. Water withdrawals, discharges, and streamflow and water-level observations were averaged within grid cells, and their exact locations were approximated by the centers of the cells in which these fluxes occurred.
Evaluation of Ground-Water-Management Alternatives
The ground-water-flow models developed in this study can be used to evaluate the response of the ground-water-flow system, and consequent effects on streamflow, that result from changes in water-management practices or hydrologic condi-tions in the Assabet River Basin. Increased water withdrawals or discharges, alternative pumping schedules for existing withdrawals, land disposal of treated wastewater, sewering, or stormwater recharge are examples of water-management practices that may be simulated. Altered hydrologic conditions that could be simulated include drought conditions or conditions of altered recharge that may result, for example, from land-use changes.
Two approaches were used to investigate alternative water-management practices in the Assabet River Basin. Both approaches use the transient flow model. First, the flow model was used to determine the effects of increased withdrawals and discharges in several hypothetical scenarios. These scenarios represented possible changes in water use in the basin or water-management practices that could mitigate potential adverse effects of increased water withdrawals and (or) wastewater discharges. Second, the flow model was used in conjunction with optimization techniques. This approach was used to quantify possible increases in streamflow that could be obtained by optimizing water withdrawals in an area of the basin where demands on water resources are high. Both hypothetical scenarios and optimization analyses were defined through consultation with the TAC.
Simulation of Altered Withdrawals and Discharges
Three scenarios of altered withdrawals and discharges were tested. In the first scenario (S1), water flows and stresses associated with human management of the hydrologic system were eliminated. In the second scenario (S2), water withdrawals and discharges were increased to rates currently allowed by State and Federal permits. In a third set of scenarios (S3A–D), wastewater discharge at hypothetical ground-water discharge sites was simulated. Results of the scenarios were evaluated with respect to changes in model-calculated nonstorm streamflow relative to existing (1997–2001) conditions.
Simulation of No Water Management
In S1, water withdrawals and wastewater discharges were set to zero. Recharge rates representing septic-system return flow, consumptive use in privately supplied areas, consumptive use by unpermitted agriculture, and infiltration to sewers also were set to zero. All other stresses and properties, including recharge from precipitation and evapotranspiration of ground water, remained the same as were used in the calibrated transient model. Detailed water budgets for the entire Assabet River Basin and subbasins for S1 are provided in table 15 and Appendix 2.
On an average annual basis, model-calculated nonstorm streamflows in tributaries and at the outlet of the Assabet Main Stem Headwaters subbasin were greater in most cases in S1 than under simulated existing (1997–2001) conditions (table 17). Increases relative to model-calculated 1997–2001 flows ranged from 2 percent, in the Elizabeth Brook subbasin, to 44 percent, in the Fort Meadow Brook subbasin. In most subbasins, increases in model-calculated flows resulted from a combination of decreased withdrawals and decreased infiltra-tion to sewers, the relative importance of which varied among subbasins (fig. 34). Decreased withdrawals contributed most to the increases in model-calculated streamflows in the Assabet Main Stem Headwaters, Cold Harbor and Howard Brooks, Stirrup Brook, Fort Meadow Brook, and Taylor Brook subbasins. In the Hop Brook and Danforth Brook subbasins, decreased infiltration to sewers contributed most to increases in model-calculated streamflows. Decreases in withdrawals and infiltration to sewers were offset in many subbasins by decreases in septic-system return flow (fig. 34), which was an inflow to the aquifer and augmented streamflow under simulated existing conditions. In the Fort Pond Brook and Nashoba Brook subbasins, with primarily public water supply and private disposal, decreases in septic-system return flow were nearly equal or greater than decreases in withdrawals or other outflows, such that model-calculated streamflows in these subbasins were less or about the same in S1 than under simulated existing conditions. In Elizabeth Brook, where private water supply and disposal serve most of the population, the small streamflow increase resulted mostly from decreased consumptive use (fig. 34). In the North and Spencer Brook subbasins, with no public-water withdrawals but with public and private disposal, decreases in consumptive use and septic-system return flow balanced such that streamflow changes were small. In a few subbasins, there also were relatively large changes in flows to or from adjacent subbasins that resulted from the elimination of large withdrawals near subbasin boundaries in S1 (fig. 34).
Along the main stem Assabet River downstream of the Headwaters subbasin (and downstream of the Westborough Wastewater Treatment Facility), model-calculated flows were less in S1 than under simulated existing conditions (fig. 24 and table 17). At outlets of the Assabet River Main Stem subbasins,
Evaluation of Ground-Water-Management Alternatives 67
flow reductions ranged from 2 to 3 percent on an annual average basis, and resulted primarily from the elimination of wastewater discharges to the river. These reductions in wastewater discharge, which augment flow in the river under existing conditions, were offset partly by decreases in water withdrawals and infiltration to sewers, which deplete flow under existing conditions, and increased flow from tributaries.
Changes in mean monthly model-calculated flows in S1 relative to simulated existing conditions varied during the annual cycle and among subbasins, depending on the variable monthly rates of withdrawals, infiltration to sewers, and other flows and on the response time of streamflow to these changes. Changes generally were smaller fractions of total model-
calculated nonstorm streamflow during March, when overall flows through the hydrologic system were high, and changes were larger fractions of total streamflow during September, during the low-flow period (table 17 and fig. 32). In March, increases in model-calculated nonstorm streamflow in tributaries ranged from less than 1 to about 20 percent. In September, increases ranged from 4 to more than 100 percent. In the Main Stem Assabet River, proportional decreases in streamflow in S1 relative to existing conditions were greatest downstream of the Westborough Wastewater Treatment Facility, resulting in decreases of more than 60 percent, and were least, about 7 percent, at the confluence with the Sudbury River (fig. 32).
Table 17. Model-calculated nonstorm streamflow from subbasins in the Assabet River Basin, eastern Massachusetts, for existing conditions (1997–2001) and two scenarios of altered water-management practices.
Subbasin
Model-calculated nonstorm streamflow (cubic foot per second)
1997–2001 Scenario 1 Scenario 2
Annual March September Annual March September Annual March September
Assabet River
Main Stem Headwaters 5.06 14.33 0.53 6.37 15.57 1.58 5.04 14.24 0.62Main Stem Upper 50.12 113.0 16.89 45.52 107.57 11.04 52.56 116.27 19.44Main Stem Middle 113.01 254.38 37.97 109.16 248.72 32.69 113.92 255.59 39.56Main Stem Lower 216.17 482.13 68.94 212.87 476.26 63.81 217.21 483.57 70.79
Tributaries to Assabet River
Hop Brook 10.28 26.73 2.15 10.84 27.71 2.65 9.24 25.20 1.66Cold Harbor and
Howard Brooks11.65 29.96 .49 12.65 31.20 1.27 11.34 29.60 .25
Stirrup Brook 2.86 5.37 1.10 3.21 5.81 1.13 2.63 5.08 .99North Brook 23.93 62.20 5.01 24.08 62.18 5.18 23.67 61.81 4.83Danforth Brook 7.79 23.45 .45 8.10 23.80 .59 7.75 23.41 .44
Fort Meadow Brook 4.73 11.43 .43 6.79 13.62 2.46 4.20 10.83 .01Elizabeth Brook 26.51 61.85 7.83 26.96 62.15 8.33 26.51 61.85 7.83Taylor Brook 2.47 4.80 .33 3.04 5.44 .71 2.41 4.74 .30Fort Pond Brook 50.92 122.34 9.56 50.87 122.21 9.23 50.34 121.69 9.14Nashoba Brook 25.24 54.32 6.96 24.70 53.09 6.80 25.17 54.27 6.90Spencer Brook 7.31 17.77 1.50 7.19 17.62 1.45 7.36 17.84 1.56
68 Simulation of Ground-Water Flow and Evaluation of Water-Management Alternatives in the Assabet River Basin, Eastern MA
Hea
dwat
ers
Upp
er
Mid
dle
Low
er
Hop
Col
d H
arbo
ran
d H
owar
d
Nor
th
Dan
fort
h
For
t Mea
dow
Eliz
abet
h
Tayl
or
For
t Pon
d
Nas
hoba
Spe
ncer
Stir
rup
ASSABET MAIN STEM TRIBUTARIES
CH
AN
GE
IN F
LOW
, IN
MIL
LIO
N
GA
LLO
NS
PE
R D
AY
EVAPOTRANSPIRATION FROM NONWETLAND AREAS
FLOW TO OR FROM OTHER SUBBASINS OR BEDROCK
SEPTIC-SYSTEM RETURN FLOW
WASTEWATER DISCHARGE TO STREAMS
STREAMFLOW FROM UPSTREAM AND TRIBUTARIES
WITHDRAWALS
INFILTRATION TO SEWERS
CONSUMPTIVE USE BY UNPERMITTED AGRICULTURE
EXPLANATION
CONSUMPTIVE USE IN PRIVATE- SUPPLY AREAS
A. 6
4
2
-2
-4
-6
0
-8
+0.85 (26%)
-3.0 (9%)
-2.5 (3%)
-2.1 (2%)
B.
+0.36 (5%)
+0.65 (9%)
+0.23 (12%)
+0.10 (<1%)
+0.20 (4%)
+1.3 (44%)
+0.29 (2%) +0.37
(23%)
-0.04 (<1%) -0.35
(2%)
-0.08 (2%)
2.0
1.5
1.0
-0.5
-1.0
-1.5
0.0
-2.0
0.5
Figure 34. Model-calculated changes, relative to simulated 1997–2001 conditions, in average annual inflows to and outflows from the surficial layer (layer 1) of the simulated ground-water-flow system in subbasins of the A, Assabet River Main Stem; and B, tributary subbasins, in a hypothetical scenario of no water management (scenario 1) in the Assabet River Basin, eastern Massachusetts. Numbers are net changes in model-calculated non-storm streamflow relative to existing conditions, in million gallons per day and percent (%); <, value is less than value shown.
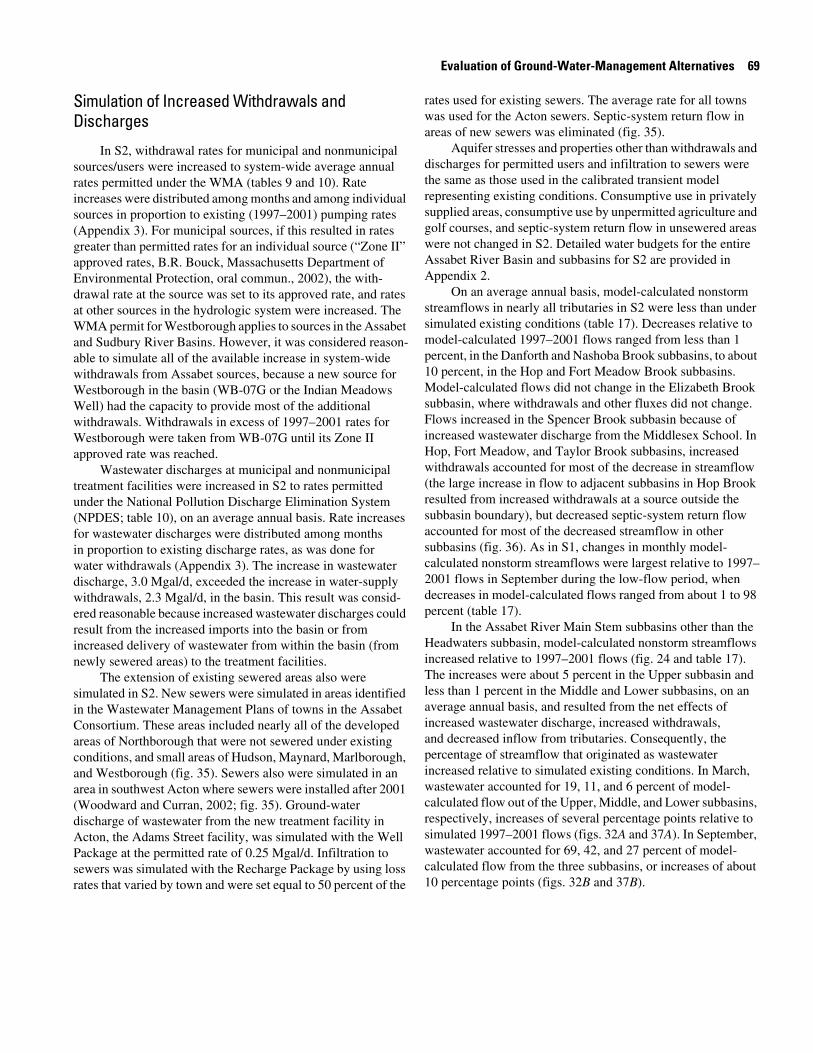
Evaluation of Ground-Water-Management Alternatives 69
Simulation of Increased Withdrawals and Discharges
In S2, withdrawal rates for municipal and nonmunicipal sources/users were increased to system-wide average annual rates permitted under the WMA (tables 9 and 10). Rate increases were distributed among months and among individual sources in proportion to existing (1997–2001) pumping rates (Appendix 3). For municipal sources, if this resulted in rates greater than permitted rates for an individual source (“Zone II” approved rates, B.R. Bouck, Massachusetts Department of Environmental Protection, oral commun., 2002), the with-drawal rate at the source was set to its approved rate, and rates at other sources in the hydrologic system were increased. The WMA permit for Westborough applies to sources in the Assabet and Sudbury River Basins. However, it was considered reason-able to simulate all of the available increase in system-wide withdrawals from Assabet sources, because a new source for Westborough in the basin (WB-07G or the Indian Meadows Well) had the capacity to provide most of the additional withdrawals. Withdrawals in excess of 1997–2001 rates for Westborough were taken from WB-07G until its Zone II approved rate was reached.
Wastewater discharges at municipal and nonmunicipal treatment facilities were increased in S2 to rates permitted under the National Pollution Discharge Elimination System (NPDES; table 10), on an average annual basis. Rate increases for wastewater discharges were distributed among months in proportion to existing discharge rates, as was done for water withdrawals (Appendix 3). The increase in wastewater discharge, 3.0 Mgal/d, exceeded the increase in water-supply withdrawals, 2.3 Mgal/d, in the basin. This result was consid-ered reasonable because increased wastewater discharges could result from the increased imports into the basin or from increased delivery of wastewater from within the basin (from newly sewered areas) to the treatment facilities.
The extension of existing sewered areas also were simulated in S2. New sewers were simulated in areas identified in the Wastewater Management Plans of towns in the Assabet Consortium. These areas included nearly all of the developed areas of Northborough that were not sewered under existing conditions, and small areas of Hudson, Maynard, Marlborough, and Westborough (fig. 35). Sewers also were simulated in an area in southwest Acton where sewers were installed after 2001 (Woodward and Curran, 2002; fig. 35). Ground-water discharge of wastewater from the new treatment facility in Acton, the Adams Street facility, was simulated with the Well Package at the permitted rate of 0.25 Mgal/d. Infiltration to sewers was simulated with the Recharge Package by using loss rates that varied by town and were set equal to 50 percent of the
rates used for existing sewers. The average rate for all towns was used for the Acton sewers. Septic-system return flow in areas of new sewers was eliminated (fig. 35).
Aquifer stresses and properties other than withdrawals and discharges for permitted users and infiltration to sewers were the same as those used in the calibrated transient model representing existing conditions. Consumptive use in privately supplied areas, consumptive use by unpermitted agriculture and golf courses, and septic-system return flow in unsewered areas were not changed in S2. Detailed water budgets for the entire Assabet River Basin and subbasins for S2 are provided in Appendix 2.
On an average annual basis, model-calculated nonstorm streamflows in nearly all tributaries in S2 were less than under simulated existing conditions (table 17). Decreases relative to model-calculated 1997–2001 flows ranged from less than 1 percent, in the Danforth and Nashoba Brook subbasins, to about 10 percent, in the Hop and Fort Meadow Brook subbasins. Model-calculated flows did not change in the Elizabeth Brook subbasin, where withdrawals and other fluxes did not change. Flows increased in the Spencer Brook subbasin because of increased wastewater discharge from the Middlesex School. In Hop, Fort Meadow, and Taylor Brook subbasins, increased withdrawals accounted for most of the decrease in streamflow (the large increase in flow to adjacent subbasins in Hop Brook resulted from increased withdrawals at a source outside the subbasin boundary), but decreased septic-system return flow accounted for most of the decreased streamflow in other subbasins (fig. 36). As in S1, changes in monthly model-calculated nonstorm streamflows were largest relative to 1997–2001 flows in September during the low-flow period, when decreases in model-calculated flows ranged from about 1 to 98 percent (table 17).
In the Assabet River Main Stem subbasins other than the Headwaters subbasin, model-calculated nonstorm streamflows increased relative to 1997–2001 flows (fig. 24 and table 17). The increases were about 5 percent in the Upper subbasin and less than 1 percent in the Middle and Lower subbasins, on an average annual basis, and resulted from the net effects of increased wastewater discharge, increased withdrawals, and decreased inflow from tributaries. Consequently, the percentage of streamflow that originated as wastewater increased relative to simulated existing conditions. In March, wastewater accounted for 19, 11, and 6 percent of model-calculated flow out of the Upper, Middle, and Lower subbasins, respectively, increases of several percentage points relative to simulated 1997–2001 flows (figs. 32A and 37A). In September, wastewater accounted for 69, 42, and 27 percent of model-calculated flow from the three subbasins, or increases of about 10 percentage points (figs. 32B and 37B).
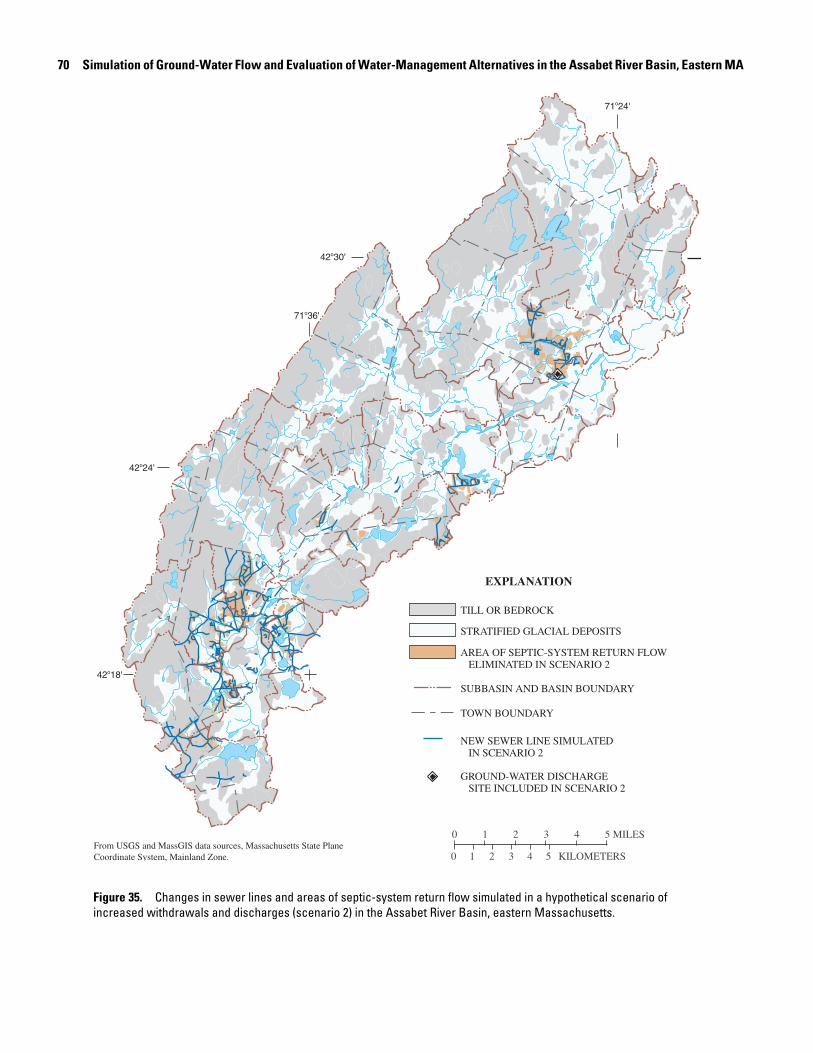
70 Simulation of Ground-Water Flow and Evaluation of Water-Management Alternatives in the Assabet River Basin, Eastern MA
STRATIFIED GLACIAL DEPOSITS
AREA OF SEPTIC-SYSTEM RETURN FLOW ELIMINATED IN SCENARIO 2
TILL OR BEDROCK
GROUND-WATER DISCHARGE SITE INCLUDED IN SCENARIO 2
NEW SEWER LINE SIMULATED IN SCENARIO 2
TOWN BOUNDARY
SUBBASIN AND BASIN BOUNDARY
EXPLANATION
71o36'
71o24'
42o18'
42o24'
42o30'
0 1 2 3 4 5 MILES
0 2 KILOMETERS41 3 5From USGS and MassGIS data sources, Massachusetts State Plane Coordinate System, Mainland Zone.
Figure 35. Changes in sewer lines and areas of septic-system return flow simulated in a hypothetical scenario of increased withdrawals and discharges (scenario 2) in the Assabet River Basin, eastern Massachusetts.
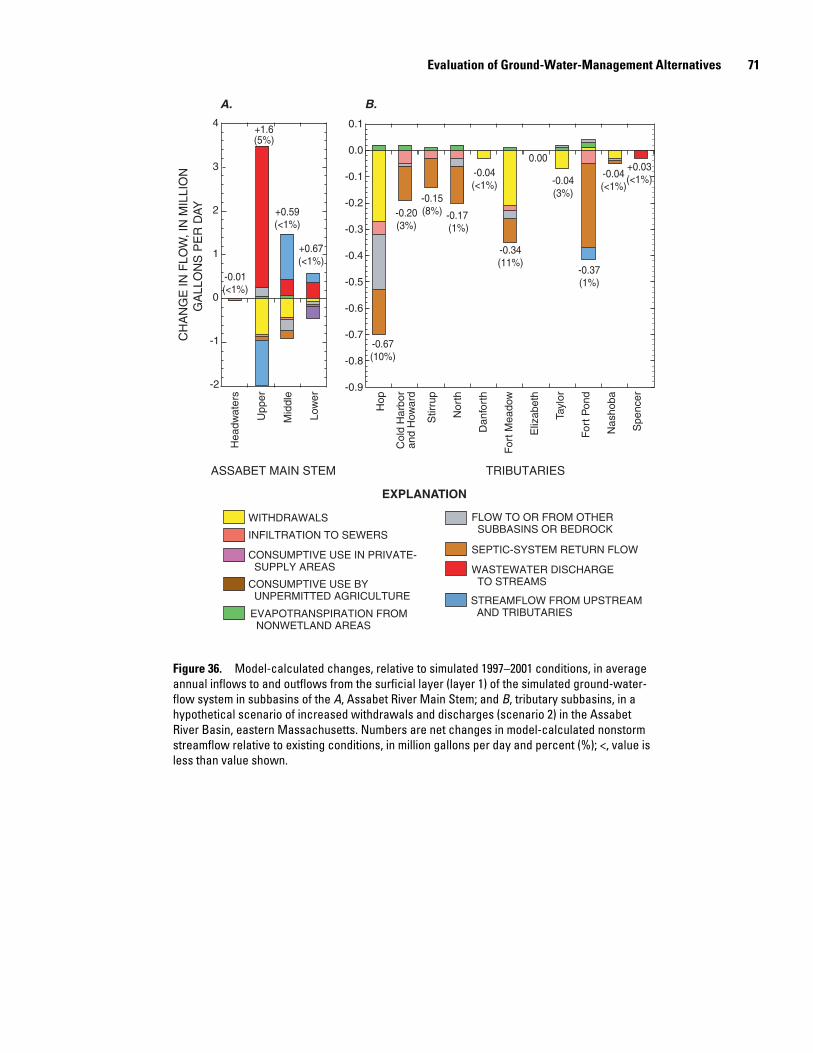
Evaluation of Ground-Water-Management Alternatives 71
CH
AN
GE
IN F
LOW
, IN
MIL
LIO
N
GA
LLO
NS
PE
R D
AY
4
3
1
0
-1
2
-2
-0.01 (<1%)
+1.6 (5%)
+0.67 (<1%)
-0.67 (10%)
-0.20 (3%)
-0.15 (8%) -0.17
(1%)
-0.34 (11%)
-0.04 (<1%) -0.04
(3%)
-0.37 (1%)
-0.04 (<1%)
+0.03 (<1%)
0.1
0.0
-0.1
-0.6
-0.7
-0.8
-0.4
-0.9
-0.5
-0.3
-0.2
A. B.
EVAPOTRANSPIRATION FROM NONWETLAND AREAS
FLOW TO OR FROM OTHER SUBBASINS OR BEDROCK
SEPTIC-SYSTEM RETURN FLOW
WASTEWATER DISCHARGE TO STREAMS
STREAMFLOW FROM UPSTREAM AND TRIBUTARIES
WITHDRAWALS
INFILTRATION TO SEWERS
CONSUMPTIVE USE BY UNPERMITTED AGRICULTURE
EXPLANATION
CONSUMPTIVE USE IN PRIVATE- SUPPLY AREAS
Hea
dwat
ers
Upp
er
Mid
dle
Low
er
Hop
Col
d H
arbo
ran
d H
owar
d
Nor
th
Dan
fort
h
For
t Mea
dow
Eliz
abet
h
Tayl
or
For
t Pon
d
Nas
hoba
Spe
ncer
Stir
rup
ASSABET MAIN STEM TRIBUTARIES
+0.59 (<1%)
0.00
Figure 36. Model-calculated changes, relative to simulated 1997–2001 conditions, in average annual inflows to and outflows from the surficial layer (layer 1) of the simulated ground-water-flow system in subbasins of the A, Assabet River Main Stem; and B, tributary subbasins, in a hypothetical scenario of increased withdrawals and discharges (scenario 2) in the Assabet River Basin, eastern Massachusetts. Numbers are net changes in model-calculated nonstorm streamflow relative to existing conditions, in million gallons per day and percent (%); <, value is less than value shown.
72 Simulation of Ground-Water Flow and Evaluation of Water-Management Alternatives in the Assabet River Basin, Eastern MA
B. SEPTEMBERA. MARCH
NET GW DISCHARGE TO STREAMS FROM UPSTREAM AND TRIBUTARIES
NET GW DISCHARGE TO STREAMS
WASTEWATER DISCHARGE UPSTREAM
WASTEWATER DISCHARGE IN SUBBASIN
SW WITHDRAWALS UPSTREAM
SW WITHDRAWALS IN SUBBASIN
EXPLANATION
350
300
250
150
100
50
200
0
-50Assabet MS Head
Assabet MS Upper
Assabet MS Middle
Assabet MS Lower
50
40
20
10
30
0
-10Assabet MS Head
Assabet MS Upper
Assabet MS Middle
Assabet MS LowerF
LOW
, IN
MIL
LIO
N G
ALL
ON
S P
ER
DAY
Figure 37. Model-calculated components of average A, March; and B, September nonstorm streamflow in subbasins of the Assabet River Main Stem (MS), in a hypothetical scenario of increased withdrawals and discharges (scenario 2) in the Assabet River Basin, eastern Massachusetts. SW, surface water; GW, ground water. Surface-water withdrawals in September of 0.15, 0.12, and 0.17 million gallons per day from the Upper, Middle, and Lower subbasins, respectively, are too small to be apparent at this scale.
In many subbasins, evapotranspiration from nonwetland areas decreased, contributing to a small increase in model-calculated nonstorm streamflow (Appendix 2). This process was simulated with the Evapotranspiration Package, and its rate varied with water levels. Therefore, lowered water levels resulting from increased withdrawals and decreased septic-system return flow in S2 were accompanied by less ET from nonwetland areas. Reduced ET from a wetland represents a change in its hydrologic budget that could be accompanied by other changes in the wetland, for example, in its vegetation. Because ET from wetland areas was simulated as a fixed loss rate, the effects of altered withdrawals and return flow on this process were not simulated in S2 or in S1.
Simulation of Ground-Water Discharge of Wastewater
Wastewater recharge to the ground-water flow system was simulated for four hypothetical ground-water discharge sites in the basin in S3A–D (fig. 38 and table 18). The four sites were chosen in consultation with the TAC from among those identi-fied in the Wastewater Management Plans of the Assabet Consortium towns. The sites were chosen in subbasins with relatively large water withdrawals, in areas of stratified glacial deposits, and, where possible, upstream of a site where mini-mum streamflow requirements for habitat protection were investigated (Parker and others, 2004); they included several
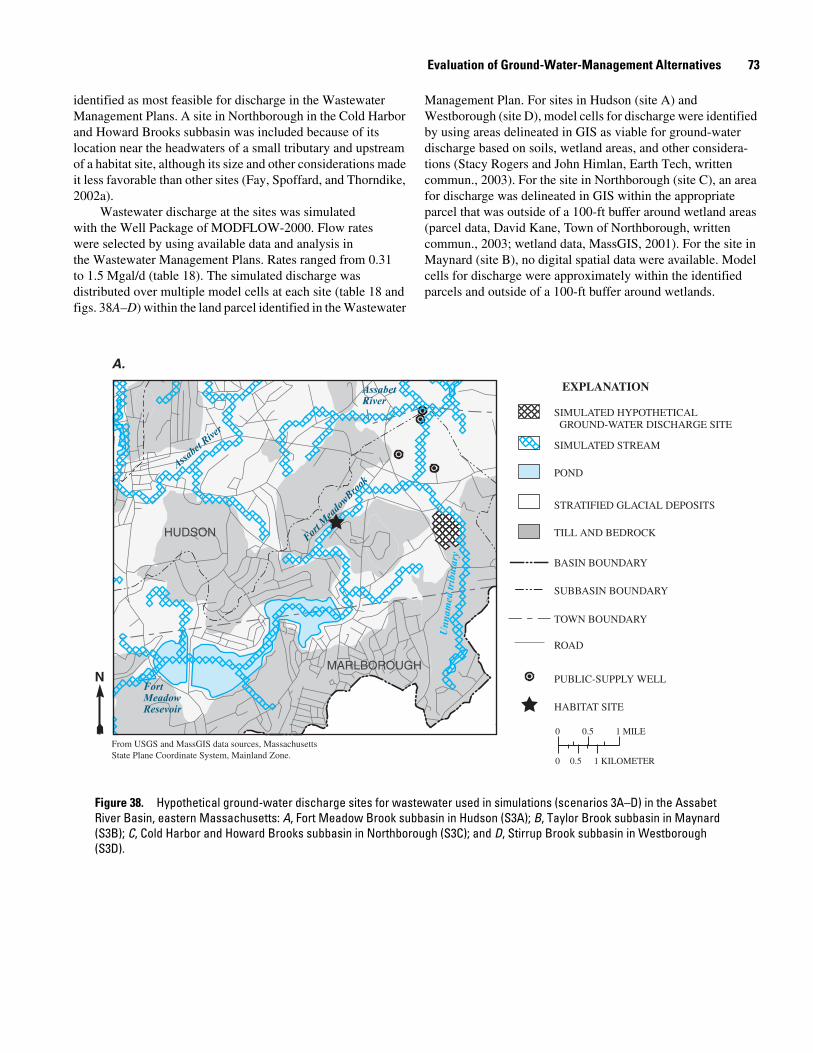
Evaluation of Ground-Water-Management Alternatives 73
identified as most feasible for discharge in the Wastewater Management Plans. A site in Northborough in the Cold Harbor and Howard Brooks subbasin was included because of its location near the headwaters of a small tributary and upstream of a habitat site, although its size and other considerations made it less favorable than other sites (Fay, Spoffard, and Thorndike, 2002a).
Wastewater discharge at the sites was simulated with the Well Package of MODFLOW-2000. Flow rates were selected by using available data and analysis in the Wastewater Management Plans. Rates ranged from 0.31 to 1.5 Mgal/d (table 18). The simulated discharge was distributed over multiple model cells at each site (table 18 and figs. 38A–D) within the land parcel identified in the Wastewater
Management Plan. For sites in Hudson (site A) and Westborough (site D), model cells for discharge were identified by using areas delineated in GIS as viable for ground-water discharge based on soils, wetland areas, and other considera-tions (Stacy Rogers and John Himlan, Earth Tech, written commun., 2003). For the site in Northborough (site C), an area for discharge was delineated in GIS within the appropriate parcel that was outside of a 100-ft buffer around wetland areas (parcel data, David Kane, Town of Northborough, written commun., 2003; wetland data, MassGIS, 2001). For the site in Maynard (site B), no digital spatial data were available. Model cells for discharge were approximately within the identified parcels and outside of a 100-ft buffer around wetlands.
HUDSON
MARLBOROUGH
Fort Meadow Resevoir
For
t Mea
dowBro
ok
Assabet River
Assabet
Riv
er
Un
nam
ed t
ribu
tary
A.
From USGS and MassGIS data sources, Massachusetts State Plane Coordinate System, Mainland Zone.
0 0.5 1 MILE
0 1 KILOMETER0.5
N
EXPLANATION
TOWN BOUNDARY
SIMULATED HYPOTHETICAL GROUND-WATER DISCHARGE SITE
SIMULATED STREAM
STRATIFIED GLACIAL DEPOSITS
TILL AND BEDROCK
BASIN BOUNDARY
SUBBASIN BOUNDARY
PUBLIC-SUPPLY WELL
POND
ROAD
HABITAT SITE
Figure 38. Hypothetical ground-water discharge sites for wastewater used in simulations (scenarios 3A–D) in the Assabet River Basin, eastern Massachusetts: A, Fort Meadow Brook subbasin in Hudson (S3A); B, Taylor Brook subbasin in Maynard (S3B); C, Cold Harbor and Howard Brooks subbasin in Northborough (S3C); and D, Stirrup Brook subbasin in Westborough (S3D).
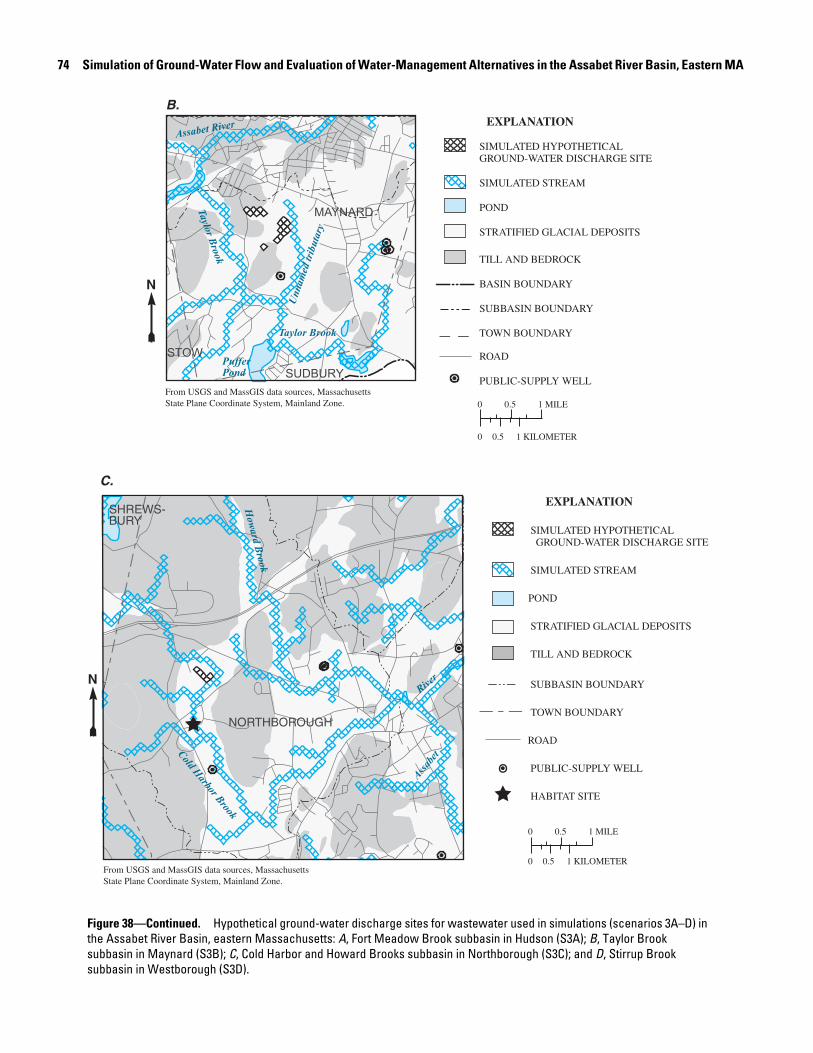
74 Simulation of Ground-Water Flow and Evaluation of Water-Management Alternatives in the Assabet River Basin, Eastern MA
SHREWS-BURY
NORTHBOROUGH
Cold H
arbor Brook
Ass
abet
How
ard
Bro
ok
0 0.5 1 MILE
0 1 KILOMETER0.5
RiverN
C.
From USGS and MassGIS data sources, Massachusetts State Plane Coordinate System, Mainland Zone.
EXPLANATION
TOWN BOUNDARY
SIMULATED HYPOTHETICAL GROUND-WATER DISCHARGE SITE
SIMULATED STREAM
POND
STRATIFIED GLACIAL DEPOSITS
TILL AND BEDROCK
SUBBASIN BOUNDARY
PUBLIC-SUPPLY WELL
ROAD
HABITAT SITE
N
MAYNARD
Taylo
r Bro
ok
PufferPond
Assabet River
Taylor Brook
SUDBURY
STOW
0 0.5 1 MILE
0 1 KILOMETER0.5
B.
Un
nam
ed tri
bu
tary
From USGS and MassGIS data sources, Massachusetts State Plane Coordinate System, Mainland Zone.
EXPLANATION
TOWN BOUNDARY
SIMULATED HYPOTHETICAL GROUND-WATER DISCHARGE SITE
SIMULATED STREAM
POND
STRATIFIED GLACIAL DEPOSITS
TILL AND BEDROCK
BASIN BOUNDARY
SUBBASIN BOUNDARY
PUBLIC-SUPPLY WELL
ROAD
Figure 38—Continued. Hypothetical ground-water discharge sites for wastewater used in simulations (scenarios 3A–D) in the Assabet River Basin, eastern Massachusetts: A, Fort Meadow Brook subbasin in Hudson (S3A); B, Taylor Brook subbasin in Maynard (S3B); C, Cold Harbor and Howard Brooks subbasin in Northborough (S3C); and D, Stirrup Brook subbasin in Westborough (S3D).
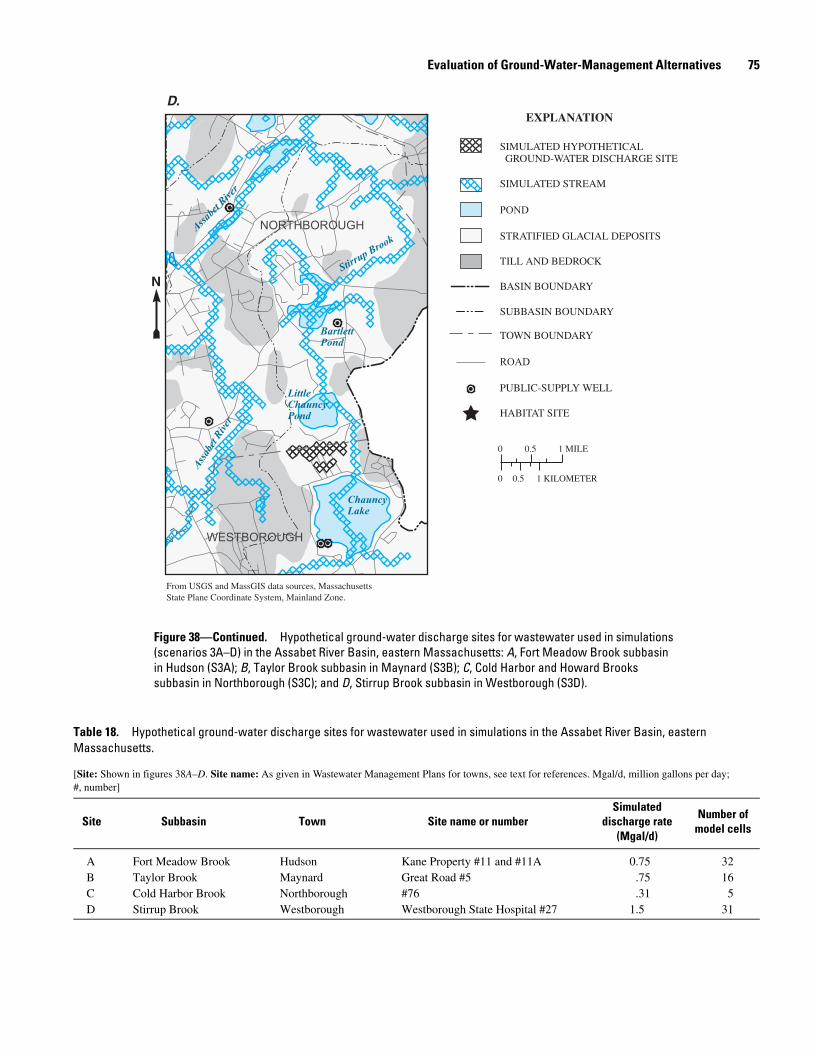
Evaluation of Ground-Water-Management Alternatives 75
N
NORTHBOROUGH
WESTBOROUGH
ChauncyLake
Ass
abet
Riv
er
LittleChauncyPond
Stirru
p Brook
Ass
abet
Riv
er
BartlettPond
0 0.5 1 MILE
0 1 KILOMETER0.5
D.
From USGS and MassGIS data sources, Massachusetts State Plane Coordinate System, Mainland Zone.
EXPLANATION
SIMULATED HYPOTHETICAL GROUND-WATER DISCHARGE SITE
SIMULATED STREAM
POND
STRATIFIED GLACIAL DEPOSITS
TILL AND BEDROCK
BASIN BOUNDARY
SUBBASIN BOUNDARY
TOWN BOUNDARY
PUBLIC-SUPPLY WELL
ROAD
HABITAT SITE
Figure 38—Continued. Hypothetical ground-water discharge sites for wastewater used in simulations (scenarios 3A–D) in the Assabet River Basin, eastern Massachusetts: A, Fort Meadow Brook subbasin in Hudson (S3A); B, Taylor Brook subbasin in Maynard (S3B); C, Cold Harbor and Howard Brooks subbasin in Northborough (S3C); and D, Stirrup Brook subbasin in Westborough (S3D).
Table 18. Hypothetical ground-water discharge sites for wastewater used in simulations in the Assabet River Basin, eastern Massachusetts.
[Site: Shown in figures 38A–D. Site name: As given in Wastewater Management Plans for towns, see text for references. Mgal/d, million gallons per day; #, number]
Site Subbasin Town Site name or numberSimulated
discharge rate (Mgal/d)
Number of model cells
A Fort Meadow Brook Hudson Kane Property #11 and #11A 0.75 32B Taylor Brook Maynard Great Road #5 .75 16C Cold Harbor Brook Northborough #76 .31 5D Stirrup Brook Westborough Westborough State Hospital #27 1.5 31
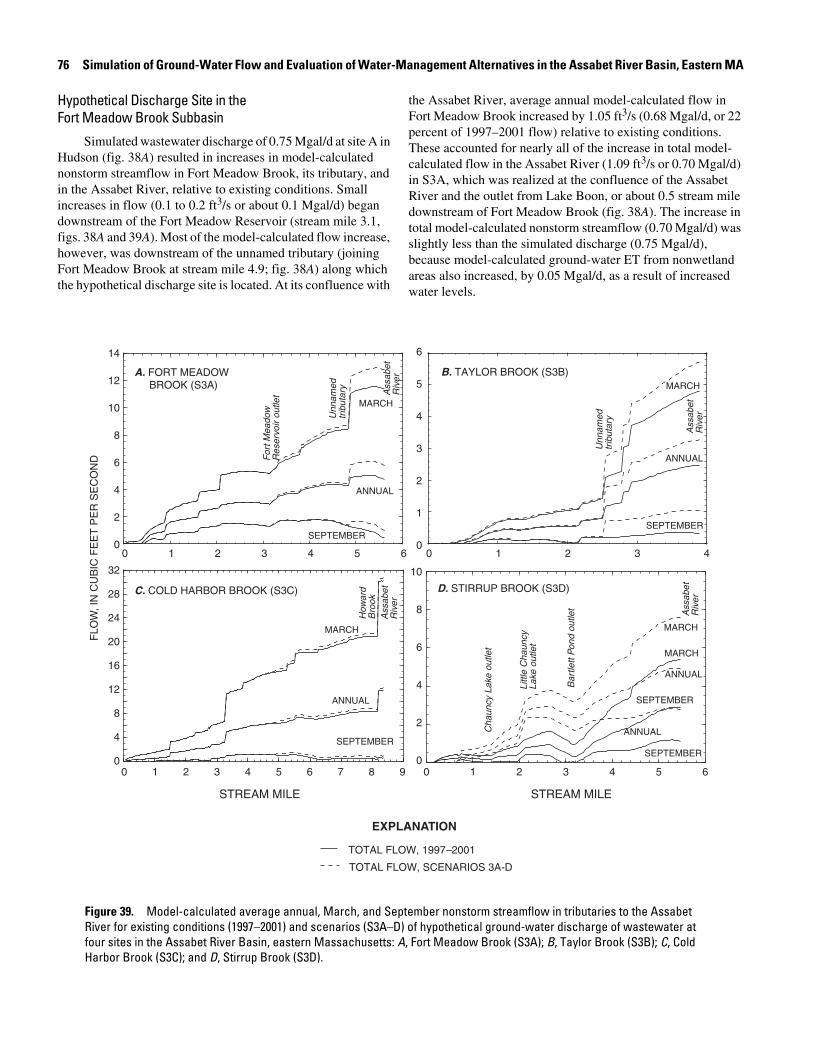
76 Simulation of Ground-Water Flow and Evaluation of Water-Management Alternatives in the Assabet River Basin, Eastern MA
Hypothetical Discharge Site in the Fort Meadow Brook Subbasin
Simulated wastewater discharge of 0.75 Mgal/d at site A in Hudson (fig. 38A) resulted in increases in model-calculated nonstorm streamflow in Fort Meadow Brook, its tributary, and in the Assabet River, relative to existing conditions. Small increases in flow (0.1 to 0.2 ft3/s or about 0.1 Mgal/d) began downstream of the Fort Meadow Reservoir (stream mile 3.1, figs. 38A and 39A). Most of the model-calculated flow increase, however, was downstream of the unnamed tributary (joining Fort Meadow Brook at stream mile 4.9; fig. 38A) along which the hypothetical discharge site is located. At its confluence with
the Assabet River, average annual model-calculated flow in Fort Meadow Brook increased by 1.05 ft3/s (0.68 Mgal/d, or 22 percent of 1997–2001 flow) relative to existing conditions. These accounted for nearly all of the increase in total model-calculated flow in the Assabet River (1.09 ft3/s or 0.70 Mgal/d) in S3A, which was realized at the confluence of the Assabet River and the outlet from Lake Boon, or about 0.5 stream mile downstream of Fort Meadow Brook (fig. 38A). The increase in total model-calculated nonstorm streamflow (0.70 Mgal/d) was slightly less than the simulated discharge (0.75 Mgal/d), because model-calculated ground-water ET from nonwetland areas also increased, by 0.05 Mgal/d, as a result of increased water levels.
STREAM MILE
0
2
14
12
10
8
6
4
0 2 64 531
For
t Mea
dow
R
eser
voir
outle
t
MARCH
ANNUAL
SEPTEMBER
TOTAL FLOW, 1997–2001
EXPLANATION
TOTAL FLOW, SCENARIOS 3A-D
0
2
4
3
1
MARCH
ANNUAL
SEPTEMBER
6
5
0 2 431
A. FORT MEADOW BROOK (S3A)
B. TAYLOR BROOK (S3B)
FLO
W, I
N C
UB
IC F
EE
T P
ER
SE
CO
ND
0 2 64 531 7 8 90
4
32
24
28
16
20
8
12
How
ard
Bro
ok
MARCH
ANNUAL
SEPTEMBER
C. COLD HARBOR BROOK (S3C)
STREAM MILE
0
2
10
8
6
4
0 2 64 531
Cha
uncy
Lak
e ou
tlet
MARCH
ANNUAL
SEPTEMBER
MARCH
ANNUAL
SEPTEMBER
Littl
e C
haun
cy
Lake
out
let
Bar
tlett
Pon
d ou
tlet
D. STIRRUP BROOK (S3D)
Unn
amed
tr
ibut
ary
Ass
abet
R
iver
Ass
abet
R
iver
Ass
abet
R
iver
Ass
abet
R
iver
Unn
amed
tr
ibut
ary
Figure 39. Model-calculated average annual, March, and September nonstorm streamflow in tributaries to the Assabet River for existing conditions (1997–2001) and scenarios (S3A–D) of hypothetical ground-water discharge of wastewater at four sites in the Assabet River Basin, eastern Massachusetts: A, Fort Meadow Brook (S3A); B, Taylor Brook (S3B); C, Cold Harbor Brook (S3C); and D, Stirrup Brook (S3D).
Evaluation of Ground-Water-Management Alternatives 77
Seasonally, model-calculated nonstorm streamflows in S3A increased more during high-flow periods than during low-flow periods, although the wastewater discharge rate was constant. Model-calculated flow in Fort Meadow Brook at its confluence with the Assabet River increased by 1.37 ft3/s (0.89 Mgal/d, or 12 percent of 1997–2001 flow) in March and by 0.58 ft3/s (0.38 Mgal/d, or 130 percent of 1997–2001 flow) in September (fig. 39A); corresponding increases were 1.46 ft3/s (0.94 Mgal/d) and 0.62 ft3/s (0.41 Mgal/d) for total flow in the Assabet River. The seasonal variation was caused by ground-water storage effects and by increased model-calculated ground-water ET, which was simulated in warm-weather months. Changes in ground-water ET ranged from 0.04 Mgal/d in October to 0.13 Mgal/d in June. The remainder of the seasonal variation in model-calculated flows resulted from changes in flows to and from storage. In September, the flow augmentation more than doubled model-calculated nonstorm streamflow out of the subbasin for 1997–2001, increasing flow from 0.07 to 0.16 ft3/s/mi2. This subbasin yield in S3A in September was about half the model-calculated yield under the scenario of no anthropogenic water management (S1). During other low-flow months, June through October, model-calculated flow out of the basin increased from 40 to 90 percent. At a site where minimum streamflow requirements for aquatic habitat were investigated (Parker and others, 2004), however, flow increases in S3A were small (0.05 ft3/s or 0.01 ft3/s/mi2), because the habitat site on Fort Meadow Brook was upstream of the confluence with the tributary along which the hypothetical ground-water discharge site was located.
Hypothetical Discharge Site in the Taylor Brook Subbasin
At site B in Maynard (fig. 38B), simulated wastewater discharge of 0.75 Mgal/d resulted in increases in model-calculated nonstorm streamflow in Taylor Brook, its tributary, and in the Assabet River, relative to existing conditions. Most of the increase in model-calculated flow was downstream of the unnamed tributary (joining Taylor Brook at stream mile 2.5; fig. 38B) along which the hypothetical discharge site was located. At its confluence with the Assabet River, model-calculated flow in Taylor Brook increased by 0.79 ft3/s (0.51 Mgal/d, or 32 percent of 1997–2001 flow), on an average annual basis. Model-calculated flow in the Assabet River increased by 0.82 ft3/s (0.55 Mgal/d) downstream of the impoundment near the Maynard/Acton town line (fig. 1; not shown on fig. 38B), about 2.3 stream miles downstream from Taylor Brook; increases downstream of the confluence of Taylor Brook with the Assabet River resulted from underflow of ground water, which discharged directly to the Assabet River, out of the subbasin. Increases in model-calculated ground-water ET, which averaged 0.20 Mgal/d annually and ranged from 0.13 Mgal/d in October to 0.54 Mgal/d in July, accounted for the difference between the wastewater discharge
and the increase in average annual streamflow. Increases in model-calculated streamflows relative to existing streamflows varied seasonally, but less than those in S3A. The relatively large increases in ground-water ET in S3B in warm-weather months were balanced by changes in storage. Increases in monthly average model-calculated nonstorm streamflow were 0.90 ft3/s (0.58 Mgal/d, or 19 percent of 1997–2001 flow) in March and 0.71 ft3/s (0.46 Mgal/d, or 210 percent of 1997–2001 flow) in September in Taylor Brook (fig. 38B), and increases were 0.93 ft3/s (0.60 Mgal/d) in March and 0.74 ft3/s (0.48 Mgal/d) in September in the Assabet River downstream of the Powdermill Impoundment. As with the scenario of wastewater discharge in the Fort Meadow Brook subbasin in S3A, discharge at the hypothetical site in the Taylor Brook subbasin substantially increased model-calculated low flows out of the subbasin, relative to existing conditions. Model-calculated nonstorm September streamflow in Taylor Brook, downstream of stream mile 2.4, about tripled, relative to existing conditions, and yield from the subbasin increased from 0.08 to 0.25 ft3/s/mi2; this flow was greater than the model-calculated flow in S1, with all anthropogenic withdrawals and discharges removed.
Hypothetical Discharge Site in the Cold Harbor and Howard Brooks Subbasins
Simulated wastewater discharge of 0.31 Mgal/d at site C in Northborough (fig. 38C) resulted in increases in model-calculated nonstorm streamflow in Cold Harbor Brook and the Assabet River, relative to existing conditions. The increase in model-calculated flow began at about stream mile 4.5 (fig. 39C), adjacent to the discharge site, and continued for about 1 mi farther downstream, where a maximum increase of 0.46 ft3/s (0.30 Mgal, or 4 percent of 1997–2001 flow) was attained on an average annual basis. Model-calculated streamflow in the Assabet River also increased by 0.46 ft3/s, downstream of its confluence with Cold Harbor and Howard Brooks, indicating that none of the simulated wastewater discharge left the Cold Harbor and Howard Brooks subbasin through ground-water underflow. Ground-water ET increased only slightly, by 0.01 Mgal/d, averaged annually. Monthly average model-calculated nonstorm streamflow in Cold Harbor Brook was augmented by about 0.46 ft3/s from January through June (March shown in fig. 39C). Increases in warm-weather months, during which ground-water ET increased by 0.02 to 0.1 Mgal/d, ranged from 0.36 to 0.43 ft3/s (0.24 to 0.28 Mgal/d). Changes in storage were small, probably because the discharge site is close to the stream and in an area where the stratified glacial deposits are thin. Although smaller than changes in S3A and S3B, the flow augmentations in S3C more than doubled model-calculated nonstorm streamflow out of the Cold Harbor and Howard Brook subbasin in low-flow months, relative to simulated existing conditions, increasing subbasin yield from 0.05 to 0.13 ft3/s/mi2 in September. At the habitat site
78 Simulation of Ground-Water Flow and Evaluation of Water-Management Alternatives in the Assabet River Basin, Eastern MA
along Cold Harbor Brook (fig. 38C), yield increased from 0.21 to 0.28 ft3/s/mi2 in September, higher than the yield in S1 (0.26 ft3/s/mi2, table 17), in which all anthropogenic with-drawals and discharges were removed. The yield in S3C at the habitat site also was higher than the minimum streamflow requirements determined at the site (Parker and others, 2004; table 16).
Hypothetical Discharge Site in the Stirrup Brook Subbasin
Simulated wastewater discharge of 1.5 Mgal/d at site 3D in Westborough (fig. 38D) resulted in increases in model-calculated nonstorm streamflow in Stirrup Brook and the Assabet River, relative to existing conditions. Model-calculated flow in Stirrup Brook was augmented from the outlet of Chauncy Lake to the confluence of Stirrup Brook with the Assabet River, with increases complete by the outlet from Bartlett Pond (fig. 39D). On an average annual basis, model-calculated flow in Stirrup Brook increased by a maximum of 2.04 ft3/s (1.32 Mgal/d, or 70 percent of 1997–2001 flow; fig. 39D). In the Assabet River, flow increased slightly (0.10 ft3/s or less) upstream of Stirrup Brook, but most of the 2.15 ft3/s (1.39 Mgal/d) increase in model-calculated flow resulted from inflow from Stirrup Brook and was down-stream of the confluence. Ground-water ET also increased, by 0.11 Mgal/d, averaged annually. Seasonally, changes in ET were smaller than changes to or from storage, which were more than 0.5 Mgal/d in some months. In September, model-calculated nonstorm streamflow in Stirrup Brook was augmented by about 1.67 ft3/s (1.08 Mgal/d), more than doubling model-calculated flow for existing conditions or for S1, in which all anthropogenic withdrawals and discharges were removed. Yield from the subbasin increased from 0.25 ft3/s/mi2 (existing conditions) to 0.63 ft3/s/mi2. It appears, therefore, that the simulated discharge in the Stirrup Brook subbasin would result in streamflows that are higher than would exist without any water management.
Summary of Scenarios of Ground-Water Discharge of Wastewater
The scenarios of hypothetical ground-water discharges indicate that, during the low-flow period in the four subbasins, streamflows would increase substantially in stream reaches downstream of the discharge sites. The flow increases, however, would not be as large as the constant discharge rate because of storage effects and increased ground-water ET in low-flow months. The effect of storage on streamflow augmen-tations that results from added inflows to the ground-water system was similar to results for the Upper Charles River Basin in eastern Massachusetts, in which a constant increased areal recharge was simulated (DeSimone and others, 2002). The importance of altered ground-water ET varied among
subbasins, and changes in ground-water ET would be better quantified with local-scale models that would more accurately simulate water-level changes near a discharge site than does a regional-scale model. Also, as in S1 and S2, the effects of changes in ET in wetlands that may accompany the altered hydrologic system near the discharge sites were not included in S3A–D, because wetland ET was simulated in the model as a fixed-rate loss that does not vary with changing water levels. The scenarios of hypothetical ground-water discharge (S3A–D) also indicated that streamflows in the Assabet River would increase, but in most cases the changes were small, 1 percent or less, relative to total streamflow. In S3D, a relatively large discharge (1.5 Mgal/d) was simulated near the headwaters of the basin. In this scenario, model-calculated September nonstorm streamflow in the Assabet River increased by 10 percent at the outlet of the Main Stem Upper subbasin and by 4 percent at the outlet of the Main Stem Middle subbasin, relative to simulated existing conditions. Consequently, because direct wastewater discharges to the river did not change in S3D, the wastewater fraction of model-calculated nonstorm streamflow decreased from 55 to 50 percent, at the outlet of the Main Stem Upper subbasin, and from 32 to 31 percent, at the outlet of the Main Stem Middle subbasin. These and other changes in the wastewater fraction of nonstorm streamflow assume that ground water discharged to the river, originating as wastewater recharged to ground water at the hypothetical disposal sites, was similar in quality to background ground-water discharge. The changes in S3D at the outlet of the Assabet Main Stem Upper and Middle subbasins were the largest changes in model-calculated flow in the Assabet River in the scenarios of hypothetical ground-water discharge. Under scenarios in which ground-water recharge of wastewater was accompanied by reductions in direct discharge of wastewater to the Assabet River, the wastewater fraction of nonstorm streamflow in the river would decrease relative to simulated changes in S3A–D.
Simulation-Optimization of Withdrawals, Discharge, and Streamflow Depletion
Municipal water-supply systems typically manage withdrawals from multiple wells that are in different tributary subbasins or along the Assabet River. Several towns also have identified one or more possible ground-water discharge sites for wastewater. Because the effects of specific withdrawals and discharges on streamflow vary temporally and spatially, these anthropogenic fluxes may be managed to minimize their potential adverse effect on streamflow in specific basins, which may be more stressed than others, or during particular times of year. Simulation-optimization methods were applied in the upper part of the Assabet River Basin to investigate water-management practices to meet such goals. In this area of the basin (Assabet Main Stem Upper subbasin and upstream areas), water withdrawals and wastewater discharges are high relative
Evaluation of Ground-Water-Management Alternatives 79
to total flows (fig. 23 and 31), and streamflow depletion in tributaries and along the main stem river adversely affects water quality. The analysis was applied to public-supply withdrawals and a hypothetical ground-water discharge in Westborough. Specifically, the analysis addressed the following question: can streamflow depletion in the Assabet River and its tributaries in this area of the basin be reduced relative to current conditions while also maintaining current public-supply withdrawals for Westborough?
Methods
The simulation-optimization approach relies on the ground-water-flow model to simulate the hydrologic response of the stream-aquifer system to applied stresses, such as water withdrawals and discharges. Optimization methods then are used to answer specific management questions about the applied stresses and hydrologic responses. The questions are formulated mathematically into a management model that consists of a set of equations and has three components: an objective function, decision variables, and constraints (Ahlfeld and Mulligan, 2000). The objective function represents the goal of the management process and is some quantity (a stress or response) that is maximized or minimized. The decision variables are the quantities to be determined, for example, withdrawal rates at supply wells. The constraints set limits (for example, maximum withdrawal rates) on the values of decision variables in the solution. More information about simulation-optimization methods for ground-water-resource management can be found in Ahlfeld and Mulligan (2000), Barlow and Dickerman (2001), and Eggleston (2004). An optimization software package, LINDO (Shrage, 1997), was used to solve the management problems posed in this study.
The management model is linked to the ground-water-flow model through a matrix of response coefficients (Gorelick and others, 1993; Ahlfeld and Mulligan, 2000). Response coefficients quantify the relation between an applied stress and the response of the hydrologic system to the stress at a specific observation point. Streamflow depletion is the response quantified in this study; stresses include pumping at supply wells and ground-water discharge. Response coefficients are calculated as:
, (3)
where
The response-matrix approach assumes a linear relation between aquifer stresses and hydrologic responses. This assumption allows multiple responses to be added or subtracted through superposition. Linearity is assumed with respect to the magnitude and the timing of the stress, such that response coefficients are assumed equal for all stresses or times of application in the annual cycle. When nonlinear responses to a stress occurs, for example, when a stream goes dry or a stress is close to a flow boundary, the linearity assumption may be a source of error (Eggleston, 2004). These errors, however, appear to be small in most cases (Barlow, 1997; Barlow and Dickerman, 2001; Eggleston, 2004). The fixed-transmissivity approach for the flow model used in this study eliminated one potential source of error from nonlinearity, the nonlinear response of the water table to changes in stress.
Simulation-Optimization of Withdrawals and Discharges in Westborough
Water was withdrawn for municipal supply in Westborough in 1997–2001 from six wells, and a new well was permitted recently (table 10 and fig. 14). The wells are in the Assabet Main Stem Headwaters (WB-01G, WB-02G, and WB-04G), Assabet Main Stem Upper (WB-03G, WB-07G), and Stirrup Brook (WB05, WB06) subbasins. A hypothetical ground-water discharge site for wastewater in the Stirrup Brook subbasin (GWD-D) also has been identified (Fay, Spoffard, and Thorndike, 2002a); this site was simulated in scenario S3D (table 18 and fig. 38D). The seven pumping wells and one discharge site are the stress sites included in the optimization analysis.
Response Coefficients
Response coefficients for stress sites in the study were determined by using the calibrated transient flow model, which simulates existing conditions (1997–2001). The response coefficients for the pumping wells and discharge site were obtained from model runs (one run per well or discharge site) in which flux rates were increased by 0.5 Mgal/d (wells) or 1.5 Mgal/d (discharge site) for 1 month. Response coefficients initially were determined for streamflow observation points at the outlets from the four Assabet subbasins and from three tributary subbasins—Hop Brook, Cold Harbor and Howard, and Stirrup Brooks (fig. 1). Streamflow responses at the Assabet Main Stem Middle and Lower subbasins were nearly the same as responses at the Main Stem Upper subbasin; therefore, streamflow responses at the Middle and Lower subbasins observation points are not reported and were not included in the optimization analysis. Streamflow depletions at the outlet of the Cold Harbor and Howard Brooks subbasin, which were unchanged by increased pumping or discharge at the Westborough sites, also were omitted. Response coefficients used in the analysis are given in table 19.
Ri,j,ts,tr is response coefficient at observation point j during month tr caused by a stress at well or discharge site i during month ts (dimensionless);
Qsdi,j,ts,tr is streamflow depletion at observation point j during month tr caused by a stress at well or discharge site i during month ts (ft3/d); and
Qwi,ts is stress at well or discharge site i during month ts (ft3/d).
Ri j ts tr,, ,Qsdi j ts tr,, ,
Qwi ts,-------------------------=
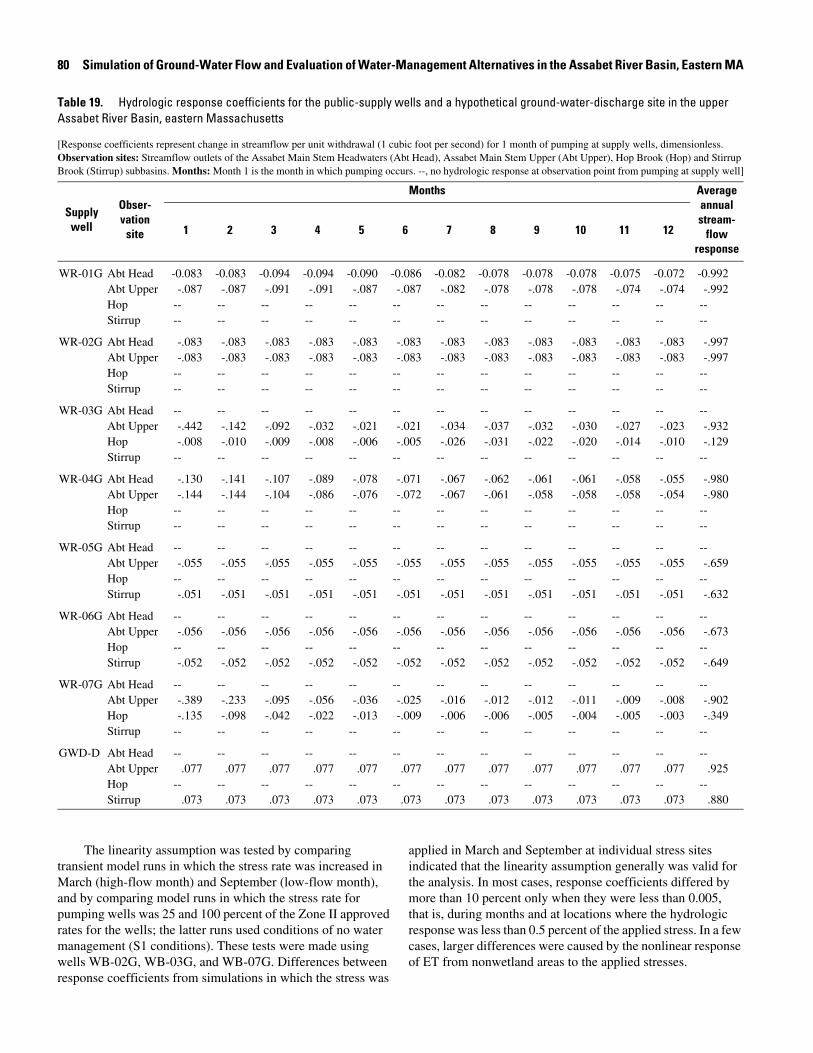
80 Simulation of Ground-Water Flow and Evaluation of Water-Management Alternatives in the Assabet River Basin, Eastern MA
Table 19. Hydrologic response coefficients for the public-supply wells and a hypothetical ground-water-discharge site in the upper Assabet River Basin, eastern Massachusetts
[Response coefficients represent change in streamflow per unit withdrawal (1 cubic foot per second) for 1 month of pumping at supply wells, dimensionless. Observation sites: Streamflow outlets of the Assabet Main Stem Headwaters (Abt Head), Assabet Main Stem Upper (Abt Upper), Hop Brook (Hop) and Stirrup Brook (Stirrup) subbasins. Months: Month 1 is the month in which pumping occurs. --, no hydrologic response at observation point from pumping at supply well]
Supply well
Obser-vation
site
Months Average annual stream-
flow response
1 2 3 4 5 6 7 8 9 10 11 12
WR-01G Abt Head -0.083 -0.083 -0.094 -0.094 -0.090 -0.086 -0.082 -0.078 -0.078 -0.078 -0.075 -0.072 -0.992Abt Upper -.087 -.087 -.091 -.091 -.087 -.087 -.082 -.078 -.078 -.078 -.074 -.074 -.992Hop -- -- -- -- -- -- -- -- -- -- -- -- --Stirrup -- -- -- -- -- -- -- -- -- -- -- -- --
WR-02G Abt Head -.083 -.083 -.083 -.083 -.083 -.083 -.083 -.083 -.083 -.083 -.083 -.083 -.997Abt Upper -.083 -.083 -.083 -.083 -.083 -.083 -.083 -.083 -.083 -.083 -.083 -.083 -.997Hop -- -- -- -- -- -- -- -- -- -- -- -- --Stirrup -- -- -- -- -- -- -- -- -- -- -- -- --
WR-03G Abt Head -- -- -- -- -- -- -- -- -- -- -- -- --Abt Upper -.442 -.142 -.092 -.032 -.021 -.021 -.034 -.037 -.032 -.030 -.027 -.023 -.932Hop -.008 -.010 -.009 -.008 -.006 -.005 -.026 -.031 -.022 -.020 -.014 -.010 -.129Stirrup -- -- -- -- -- -- -- -- -- -- -- -- --
WR-04G Abt Head -.130 -.141 -.107 -.089 -.078 -.071 -.067 -.062 -.061 -.061 -.058 -.055 -.980Abt Upper -.144 -.144 -.104 -.086 -.076 -.072 -.067 -.061 -.058 -.058 -.058 -.054 -.980Hop -- -- -- -- -- -- -- -- -- -- -- -- --Stirrup -- -- -- -- -- -- -- -- -- -- -- -- --
WR-05G Abt Head -- -- -- -- -- -- -- -- -- -- -- -- --Abt Upper -.055 -.055 -.055 -.055 -.055 -.055 -.055 -.055 -.055 -.055 -.055 -.055 -.659Hop -- -- -- -- -- -- -- -- -- -- -- -- --Stirrup -.051 -.051 -.051 -.051 -.051 -.051 -.051 -.051 -.051 -.051 -.051 -.051 -.632
WR-06G Abt Head -- -- -- -- -- -- -- -- -- -- -- -- --Abt Upper -.056 -.056 -.056 -.056 -.056 -.056 -.056 -.056 -.056 -.056 -.056 -.056 -.673Hop -- -- -- -- -- -- -- -- -- -- -- -- --Stirrup -.052 -.052 -.052 -.052 -.052 -.052 -.052 -.052 -.052 -.052 -.052 -.052 -.649
WR-07G Abt Head -- -- -- -- -- -- -- -- -- -- -- -- --Abt Upper -.389 -.233 -.095 -.056 -.036 -.025 -.016 -.012 -.012 -.011 -.009 -.008 -.902Hop -.135 -.098 -.042 -.022 -.013 -.009 -.006 -.006 -.005 -.004 -.005 -.003 -.349Stirrup -- -- -- -- -- -- -- -- -- -- -- -- --
GWD-D Abt Head -- -- -- -- -- -- -- -- -- -- -- -- --Abt Upper .077 .077 .077 .077 .077 .077 .077 .077 .077 .077 .077 .077 .925Hop -- -- -- -- -- -- -- -- -- -- -- -- --Stirrup .073 .073 .073 .073 .073 .073 .073 .073 .073 .073 .073 .073 .880
The linearity assumption was tested by comparing transient model runs in which the stress rate was increased in March (high-flow month) and September (low-flow month), and by comparing model runs in which the stress rate for pumping wells was 25 and 100 percent of the Zone II approved rates for the wells; the latter runs used conditions of no water management (S1 conditions). These tests were made using wells WB-02G, WB-03G, and WB-07G. Differences between response coefficients from simulations in which the stress was
applied in March and September at individual stress sites indicated that the linearity assumption generally was valid for the analysis. In most cases, response coefficients differed by more than 10 percent only when they were less than 0.005, that is, during months and at locations where the hydrologic response was less than 0.5 percent of the applied stress. In a few cases, larger differences were caused by the nonlinear response of ET from nonwetland areas to the applied stresses.
Evaluation of Ground-Water-Management Alternatives 81
Increased pumping or discharge at stress sites resulted in changes in ET from nonwetland areas and in changes in simulated discharge to streams. ET changed because this flux, simulated with the Evapotranspiration Package of MODFLOW-2000, varies with the depth of the simulated water level below land surface. The ET response is nonlinear, because ET occurs only in some months of the annual cycle, and its magnitude is linear with respect to the stress only when the simulated water level is between land surface and the specified extinction depth. To calculate monthly response coefficients for streamflow, the steady-state model first was used to determine the average annual change in ET, as a percentage of the applied stress (steady-state ET response coefficient). Monthly response coefficients for streamflow then were determined with the transient model. The monthly response coefficients then were adjusted to ensure a mass balance between withdrawals and the resulting streamflow depletions and ET changes (Barlow, 1997; Eggleston, 2004). The monthly response coefficients were scaled so that they summed to one minus the steady-state ET response coefficient (that is, equalled the steady-state streamflow depletion). This was done for locations sufficiently downstream of the stress site (pumping well or discharge site) where all depletion effects accumulated. At some locations, such as the Hop Brook observation point, the steady-state streamflow depletion and ET changes were less than the corresponding increased stress, because additional depletions were downstream of the observation point. In these cases, monthly response coefficients were scaled to the steady-state streamflow depletion. With this approach for scaling the streamflow response coefficients, the change in ET was assumed equal in all months of the annual cycle, and its nonlinearity was approximated as a linear response. This approach was reasonable because, for most stress sites, the ET response was a small fraction of the total hydrologic response (steady-state ET response coefficients were less than 0.1, or 10 percent of the applied stress). For two wells (WR-05G and WR-06G), the steady-state ET response was about 30 percent of the applied stress, indicating that temporal variations in the ET response probably were significant. However, response coefficients at these wells, which were adjacent to Chauncy Lake, were affected by lake storage, such that temporal variations in streamflow depletion, if any, were not well quantified.
Several of the pumping wells were adjacent to the A1 Impoundment or to Chauncy Lake. Response coefficients for streamflow depletion downstream of these lakes (Assabet Headwaters and Stirrup Brook observation points) resulting from 1 month of pumping were nearly uniform in all subsequent months of the annual cycle. This most likely resulted from the large storage capacity of the lakes, which dampens the effect of changes in upstream pumping on streamflow. A withdrawal of 0.5 Mgal/d, capturing water infiltrated from the lake or ground water that would discharge to it, would change the water level in the A1 Impoundment or Chauncy Lake by 0.1 in. or less. This
change was insufficient to alter the dynamics of simulated flow out of the lakes, which were controlled by total inflows, lake storage capacity, and in the model simulation, by specified stream elevations that correspond to the flow-control structure or other lake outlet. In actuality, the effect of withdrawals adjacent to the lakes on downstream streamflow may vary temporally to some extent. However, a more detailed represen-tation of the lakes, including the hydraulics of their storage and outflows, than that which can be obtained with the ground-water-flow model would be needed to quantify this variability. Response coefficients were set equal in each month of the annual cycle for three wells adjacent to the A1 Impoundment or Chauncy Lake where no consistent temporal variation was seen (WR-02G, WR-05G, and WR-06G). For two wells near the A1 impoundment (WR-01G and WR-04G), response coefficients were indicative of the slight temporal variation apparent in modeling results (table 19).
Response coefficients for the ground-water discharge site also were calculated as uniform throughout the annual cycle, scaled to one minus the steady-state ET response (table 19). This approach was used because the ground-water discharge at the hypothetical site was simulated at a constant rate. Under dynamic equilibrium, the effect of a constant discharge on streamflow is constant throughout the annual cycle, except for the monthly variation in ET. The monthly variation in ET was not simulated because the ET effect is small, relative to the discharge (table 19), and because of the possible inaccuracies in results produced by the regional-scale model, as described for ground-water-discharge scenarios (S3A–D).
Finally, the response coefficients for nearly all wells and locations were small (less than 0.03 or 3 percent of the applied stress) more than 12 months after the pumping month. These small response coefficients are affected strongly by numerical errors in simulation results, such as round-off errors. Therefore, response coefficients for only the first 12 months were used. Their sum was scaled up to the steady-state streamflow-depletion response (one minus the steady-state ET response). This approach was not used for the response to pumping at WR-03G at the Hop Brook observation point. Response to pumping at this well at Hop Brook peaked in the ninth month after the pumping month, and continued for several months thereafter. Because the transient flow model simulates dynamic equilibrium, response coefficients for months 13-22 could be added to coefficients for months 1-10 to obtain the final response coefficients for this observation point and stress site.
Management-Model Application
The goal of the management model was to maximize ground-water discharge to streams in the Westborough area, while maintaining public-supply withdrawals for the town at or above existing (1997–2001) levels. Streamflow depletion is of greatest concern for water-quality, habitat, and other considera-tions during the warm weather, low-flow months. The objective
82 Simulation of Ground-Water Flow and Evaluation of Water-Management Alternatives in the Assabet River Basin, Eastern MA
function, therefore, was formulated to minimize streamflow depletion during the July, August, and September. Several formulations were made: (1) to minimize streamflow depletion during July, August, and September at the Assabet Main Stem Upper subbasin observation point, the downstream location where all effects from Westborough withdrawals accumulated; (2) to minimize streamflow depletion during July, August, and September at the Assabet Main Stem Headwaters subbasin observation point, upstream of the Westborough Wastewater Treatment Facility, where wastewater constitutes the greatest percentage of flow in the Assabet River, and at the Assabet Main Stem Upper subbasin observation point; and (3) to minimize streamflow depletion during July, August, and September at both observation points along the Assabet Main Stem and at observation points at the outlets of Hop and Stirrup Brooks. Solutions to these three objective functions were found with (OPT-1, OPT-2, and OPT-3) and without (OPT-4, OPT-5, and OPT-6) discharge at the hypothetical ground-water-discharge site.
Constraints on withdrawal rates at wells were applied: (1) to limit monthly average withdrawals at individual wells to the Zone II approved pumping rates; (2) to ensure that the sum of withdrawals at all sources in each month equaled or exceeded monthly average total withdrawals for Westborough for 1997–2001; and (3) to limit the sum of withdrawals at all sources in each month to the system-wide average annual withdrawal permitted to Westborough under the WMA. When the ground-water-discharge site was included, constraints were applied to limit the monthly average discharge rate to 1.5 Mgal/d in all months of the year. Constraints also were placed on streamflow depletion at the four observation points. Monthly average nonstorm streamflow was constrained in each month of the annual cycle to be greater or equal to the lesser of (1) the minimum streamflow requirement recommended by the U.S. Fish and Wildlife Service, 0.5 ft3/s/mi2 (Aquatic Base Flow or ABF; U.S. Fish and Wildlife Service, 1981), or (2) the simulated monthly average nonstorm streamflow for 1997–2001 conditions. Decision variables were monthly average pumping rates at the seven supply wells and, when included, the monthly average rate of ground-water discharge. All other hydrologic flows, including wastewater discharge to streams, septic-system return flow, and infiltration to sewers, were the same as in 1997–2001 conditions.
Small increases in streamflow in low-flow months (July through October) were obtained at the main stem Assabet River sites in solutions to all three management models without ground-water discharge (OPT1-3). The increases were about 0.4 to 0.5 ft3/s at the Headwaters subbasin observation point, and about 0.6 to 0.7 ft3/s at the Upper subbasin observation point, relative to 1997–2001 conditions (table 20). Although small in magnitude, this increase about doubled model-calculated flow at the Assabet Headwaters site in September
relative to simulated existing conditions. Flow increases at the Assabet Main Stem Upper subbasin observation point were slightly more in OPT-1 (when depletion at the Main Stem Upper site only was minimized) than in OPT-2 (when depletion at both Assabet River sites was minimized) or in OPT-3 (when depletion at Assabet River sites and Hop and Stirrup Brook sites was minimized). In Hop Brook, streamflow in low-flow months increased slightly, by less than 0.05 ft3/s. The streamflow increases were offset by streamflow decreases in high-flow months at the Assabet River Main Stem Upper and Hop Brook sites. Flows simulated at the Stirrup Brook site were the same as 1997–2001 flows.
Pumping rates in the solutions to OPT1-3 (fig. 40A–C) were similar in that (1) wells near ponds (WB-01G, WB-02G, WB-05G, and WB-06G) were pumped at high rates in the summer and (2) wells near streams (WB-03G and WB-07G) were pumped at high rates in the winter, spring, and fall. System-wide total withdrawals equalled average withdrawals during each month of 1997–2001, the minimum allowed. These patterns contrast with the average distribution of pumping among sources in 1997–2001, in which the proportions contributed by most sources to total system-wide withdrawals were similar most months of the year (fig. 40G). The inclusion of WB-07G in the management model (WB-07G was not active in 1997–2001) also is probably the reason why low flows in Hop Brook in OPT1-3 were similar to 1997–2001 flows. Withdrawals at WB-07G, which is adjacent to Hop Brook and the Assabet River, immediately affect streamflow (table 19), relative to withdrawals at other wells, which either are more distant from the river (WB-03G) or adjacent to and buffered by ponds (fig. 15). Solutions to the management model take advantage of the variable response of this well and other wells on streamflow, maximizing withdrawals at WB-07G until constrained by the Zone II approved limit of the well, or by the minimum allowed streamflow depletion at Hop Brook. The streamflow-depletion constraint at Hop Brook results in 1997–2001 flows in low-flow months in this tributary. In many cases in the solutions to OPT1-3, withdrawal rates at individual sources were at Zone II approved rates or were zero. These extreme changes in pumping rates may be unrealistic for some supply wells, such that the streamflow increases that result under solutions to OPT1-3 probably represent upper limits on flow augmentations that could be realized by management of existing sources, within the limitations of model error and assumptions. Also, although the pumping rates determined in OPT1-3 resulted in quantitatively the optimal solution to the objective functions that were posed, alternative pumping schemes may have yielded similar solutions in terms of minimized streamflow depletion. For example, multiple combinations of pumping at closely located wells, such as WB-01G, WB-02G, and WB-04G, may yield similar depletions in streamflow downstream of the wells.
Evaluation of Ground-Water-Management Alternatives 83
.
Tabl
e 20
. M
odel
-cal
cula
ted
aver
age
mon
thly
non
stor
m s
tream
flow
, 199
7–20
01, a
nd c
hang
es in
mon
thly
ave
rage
non
stor
m s
tream
flow
det
erm
ined
by
solu
tions
to m
anag
emen
t m
odel
s in
the
uppe
r Ass
abet
Riv
er B
asin
, eas
tern
Mas
sach
uset
ts.
[Non
stor
m s
trea
mfl
ows
dete
rmin
ed a
t str
eam
flow
-obs
erva
tion
site
s at
the
outle
ts o
f A
ssab
et M
ain
Stem
Hea
dwat
ers
(Ass
abet
Hea
d), A
ssab
et M
ain
Ste
m U
pper
(A
ssab
et U
pper
), H
op B
rook
, and
Sti
rrup
Bro
ok
Subb
asin
s. S
ubba
sin
loca
tions
sho
wn
in f
igur
e 1.
ft3 /
s, c
ubic
foo
t per
sec
ond]
Mon
th
Sim
ulat
ed m
onth
ly a
vera
ge n
onst
orm
stre
amflo
w, 1
997-
2001
(ft3 /s
)Ch
ange
in m
onth
ly a
vera
ge n
onst
orm
str
eam
flow
(ft3 /s
)
OPT-
1O
PT-2
OPT
-3
Ass
abet
H
ead
Ass
abet
U
pper
Hop
B
rook
Stir
rup
Bro
okA
ssab
et
Hea
dA
ssab
et
Upp
erH
op
Bro
okSt
irru
p B
rook
Ass
abet
H
ead
Assa
bet
Upp
erH
op
Bro
okSt
irrup
B
rook
Ass
abet
H
ead
Ass
abet
U
pper
Hop
B
rook
Stir
rup
Bro
ok
Janu
ary
5.01
52.1
211
.75
2.69
0.30
-0.5
9-0
.45
0.00
0.37
-0.5
6-0
.49
0.00
0.32
-0.5
8-0
.46
0.00
Febr
uary
7.81
69.8
016
.25
3.61
.34
-.65
-.46
.00
.42
-.64
-.41
.00
.36
-.59
-.45
.00
Mar
ch14
.33
113.
0026
.73
5.37
.32
-.21
-.25
.00
.40
-.02
-.21
.00
.34
-.14
-.23
.00
Apr
il16
.40
124.
0027
.72
6.70
.32
-.27
-.09
.00
.37
-.03
-.08
.00
.35
-.23
-.08
.00
May
7.86
65.8
510
.71
4.64
.35
-.23
-.03
.00
.39
-.13
-.02
.00
.38
-.20
-.02
.00
June
3.53
39.5
95.
992.
54.3
7.3
2.0
0.0
0.4
3-.
14.0
0.0
0.4
0.1
9.0
0.0
0Ju
ly1.
7024
.98
3.84
1.59
.39
.57
.02
.00
.46
.48
.01
.00
.42
.55
.02
.00
Aug
ust
1.03
19.4
42.
791.
22.4
0.7
1.0
3.0
0.4
7.6
7.0
1.0
0.4
3.7
1.0
2.0
0
Sept
embe
r.5
316
.89
2.15
1.10
.40
.76
.02
.00
.43
.74
.00
.00
.39
.73
.02
.00
Oct
ober
.96
22.4
53.
691.
28.3
5.6
9.0
0.0
0.3
8.7
1.0
0.0
0.3
4.6
7.0
0.0
0N
ovem
ber
1.72
30.0
75.
771.
77.3
0-.
07-.
28.0
0.3
5-.
03-.
28.0
0.3
0-.
07-.
28.0
0D
ecem
ber
2.55
35.2
76.
592.
07.2
7-.
49-.
44.0
0.3
3-.
46-.
47.0
0.2
9-.
48-.
45.0
0
Mon
th
Sim
ulat
ed m
onth
ly a
vera
ge n
onst
orm
str
eam
flow
, 199
7-20
01 (f
t3 /s)
Chan
ge in
mon
thly
ave
rage
non
stor
m s
trea
mflo
w (f
t3 /s)
OPT-
4O
PT-5
OPT
-6
Ass
abet
H
ead
Ass
abet
U
pper
Hop
B
rook
Stir
rup
Bro
okA
ssab
et
Hea
dA
ssab
et
Upp
erH
op
Bro
okSt
irru
p B
rook
Ass
abet
H
ead
Assa
bet
Upp
erH
op
Bro
okSt
irrup
B
rook
Ass
abet
H
ead
Ass
abet
U
pper
Hop
B
rook
Stir
rup
Bro
ok
Janu
ary
5.01
52.1
211
.75
2.69
0.99
1.81
-0.4
31.
611.
021.
81-0
.43
1.59
0.99
1.81
-0.4
51.
64Fe
brua
ry7.
8169
.80
16.2
53.
611.
001.
70-.
441.
611.
021.
71-.
441.
591.
001.
71-.
461.
64M
arch
14.3
311
3.00
26.7
35.
37.9
91.
92-.
301.
611.
012.
05-.
271.
59.9
92.
18-.
251.
64A
pril
16.4
012
4.00
27.7
26.
70.9
81.
95-.
131.
611.
002.
02-.
111.
59.9
82.
10-.
091.
64
May
7.86
65.8
510
.71
4.64
.98
2.58
-.04
1.61
1.00
2.60
-.04
1.59
.98
2.10
-.03
1.64
June
3.53
39.5
95.
992.
54.9
82.
75.0
01.
611.
002.
76.0
01.
59.9
82.
64.0
01.
64Ju
ly1.
7024
.98
3.84
1.59
.99
2.94
.02
1.61
1.00
2.94
.02
1.59
.99
2.87
.02
1.64
Aug
ust
1.03
19.4
42.
791.
22.9
93.
00.0
31.
611.
013.
00.0
31.
59.9
93.
02.0
31.
64
Sept
embe
r.5
316
.89
2.15
1.10
.99
3.05
.03
1.61
1.01
3.05
.02
1.59
.99
3.07
.02
1.64
Oct
ober
.96
22.4
53.
691.
28.9
83.
02.0
01.
611.
022.
92.0
01.
59.9
83.
04.0
01.
64N
ovem
ber
1.72
30.0
75.
771.
77.9
82.
33-.
251.
611.
022.
31-.
261.
59.9
82.
33-.
281.
64D
ecem
ber
2.55
35.2
76.
592.
07.9
91.
95-.
401.
611.
031.
94-.
401.
59.9
91.
94-.
441.
64
84 Simulation of Ground-Water Flow and Evaluation of Water-Management Alternatives in the Assabet River Basin, Eastern MA
WIT
HD
RA
WA
L O
R D
ISC
HA
RG
E R
ATE
, IN
MIL
LIO
N G
ALL
ON
S P
ER
DAY
0
0.4
0.6
1.0
1.4
1.8
1.6
1.2
0.8
0.2
J F M A M SJ J A O N D
MONTH
0
0.4
0.6
1.0
1.4
1.8
1.6
1.2
0.8
0.2
0
0.8
1.2
2.0
2.8
3.6
3.2
2.4
1.6
0.4
0
0.8
1.2
2.0
2.8
3.6
3.2
2.4
1.6
0.4
J F M A M SJ J A O N D
MONTH
0
0.4
0.6
1.0
1.4
1.8
1.6
1.2
0.8
0.2
G. 1997–2001
C. OPT3
F. OPT6
0
0.4
0.6
1.0
1.4
1.8
1.6
1.2
0.8
0.2
B. OPT2
E. OPT5
0
0.8
1.2
2.0
2.8
3.6
3.2
2.4
1.6
0.4
D. OPT4
A. OPT1
Well WB-01G
Well WB-02G
Well WB-03G
Well WB-04G
Well WB-05G
Well WB-06G
Well WB-07G
GROUND-WATER-DISCHARGE SITE
EXPLANATION
Figure 40. Monthly withdrawal and discharge rates for 1997–2001 and for the management-model applications (OPT1-6) for decreased streamflow depletion in the Assabet River and tributaries in low-flow months in the upper part of the Assabet River Basin, eastern Massachusetts: A, OPT1; B, OPT2; C OPT3; D, OPT4; E, OPT5; F, OPT6; and G, 1997–2001.
Summary 85
The effect of ET changes from increased pumping, as represented by response coefficients used in the optimization analysis, may be apparent in the results obtained for Stirrup Brook, WB-05G, and WB-06G (table 20). Wells in the Stirrup Brook subbasin were two of five wells upstream of lakes with response coefficients that were uniform or nearly uniform throughout the year. The ET response of the Stirrup Brook wells, however, was greater than that of other wells. Pumping at one of these wells, therefore, may have been preferred in the solution because it had less effect on downstream streamflow than pumping the same volume at another well, as defined by the scaled monthly response coefficients (table 19). This may explain why, in solutions to OPT1-3, one or the other of the two wells in the Stirrup Brook subbasin was pumped at or near its Zone II approved rate when other wells upstream of lakes were not pumping. As a result, pumping at WB-05G and WB-06G was maximized until the streamflow depletion constraint in Stirrup Brook, which limited depletion to the depletion occurring under 1997–2001 conditions in the low-flow months, was reached. Moreover, because the effects of pumping at WB-05G and WB-06G were the same in each month of the annual cycle, flow in low-flow months could not be augmented through decreased pumping (and, therefore, altered streamflow depletion) in high-flow months.
In solutions to management models with discharge at the hypothetical ground-water-discharge site (OPT4-6), stream-flow increased in low-flow months at both Assabet River sites and in Stirrup Brook (table 20). The increases were about 1 ft3/s at the Assabet Main Stem Headwaters subbasin observation point, about 3 ft3/s at the Assabet Main Stem Upper subbasin observation point, and about 1.6 ft3/s at the Stirrup Brook subbasin observation point, relative to 1997–2001 conditions (table 20). In all three solutions, ground-water discharge equalled the maximum allowable rate (1.5 Mgal/d of 2.3 ft3/s). Systemwide, pumping was nearly entirely from WB-05G, WB-06G, and WB-07G (figs. 40D–F). Withdrawals at WB-05G and WB-06G, in the Stirrup Brook subbasin, were offset by the ground-water discharge, and these wells were pumped at or near Zone II approved rates in the summer, and at lesser rates in the spring and fall. Withdrawals at WB-07G, with immediate effects in the adjacent Assabet River, were at or near Zone II approved rates in the high-flow winter months. Increased pumping at the Stirrup Brook wells, relative to 1997–2001 and OPT1-3, made reduced pumping possible at wells in the Assabet Main Stem Headwaters subbasin, resulting in the flow increases from this subbasin. As in OPT1-3, Hop Brook low flows changed little in OPT4-6 (table 20), and system-wide total withdrawals equalled average withdrawals in 1997–2001.
The optimization analysis indicates that streamflow in the Assabet River in the upper part of the basin could be increased by management of existing water-supply sources for Westborough, but by small amounts. The calculated increases would reduce the average percentage of total nonstorm streamflow in the river that is wastewater at the outlet of the Assabet Main Stem Upper subbasin (between Westborough and Marlborough Wastewater Treatment Facilities) by about
0.3 percent annually, by about 0.1 percent in an average March, and by about 2 percent in an average September, relative to 1997–2001 conditions. With discharge to the ground-water system at a hypothetical ground-water-discharge facility in Westborough included, the analysis indicates that flows could be increased by much larger amounts. Resulting decreases in the average wastewater component of nonstorm streamflow at the outlet of the Assabet Main Stem Upper subbasin would be about 1 percent annually, 0.3 percent in an average March, and about 8 percent in an average September. These reductions assumed that wastewater discharge to the river from existing treatment facilities was maintained at 1997–2001 rates. The management practices used in the solutions to optimization problems may be unrealistic for some supply wells, but could be modified with more detailed information. General management principles were illustrated in which withdrawals at wells adja-cent to streams are minimized in low-flow months, in favor of withdrawals at wells upstream of ponds or impoundments or at wells at greater distances from stream reaches where depletion is of concern. These principles also could be applied elsewhere in the basin.
Summary
Water-supply withdrawals and wastewater disposal in the Assabet River Basin in eastern Massachusetts alter the flow and water quality in the basin. Discharges of treated wastewater and streamflow depletion from ground-water withdrawals adversely affect water quality in the Assabet River, especially during low-flow months and in headwater areas. Streamflow depletion also contributes to loss of aquatic habitat in the tributaries of the river. Withdrawals and wastewater discharges are likely to increase, in response to rapid development in this area, where population increased by 15 percent on average, and by more than 30 percent in some towns, between 1990 and 2000. The purpose of the study described in this report, which was completed by the U.S. Geological Survey and the Massachusetts Department of Conservation and Recreation, was to determine the effects of the current and future with-drawals and discharges on water resources in the basin, and to evaluate the effects of water-management alternatives. Data were collected to better define water resources in the basin, numerical ground-water-flow models were developed and applied to simulate existing and future conditions and water-management alternatives in the basin, and a simulation-optimization approach was used to investigate the potential to reduce existing streamflow depletion.
Ground water occurs in three major units in the basin— stratified glacial deposits, glacial till, and bedrock. Most water withdrawals are from the stratified glacial deposits. These deposits are along tributary streams and the main stem Assabet River and are in close hydraulic connection with streams, ponds, and wetlands. The stratified glacial deposits typically are less than 75 ft thick, and average about 35 ft thick throughout
86 Simulation of Ground-Water Flow and Evaluation of Water-Management Alternatives in the Assabet River Basin, Eastern MA
the basin. Horizontal hydraulic conductivity of the stratified glacial deposits, as depth-weighted averages, ranged from about 50 to 110 ft/d, in three mapped transmissivity zones. Little data were available on other hydraulic properties of stratified glacial deposits, or hydraulic properties of till or bedrock in the basin, and these properties were estimated primarily from literature sources.
The Assabet River flows about 31 stream miles and drops about 200 ft in elevation through the basin. Seven dams impound the river, some of which back water up for several miles. Mean annual flow at a streamflow-gaging station in Maynard, MA, with a drainage area of about two-thirds of the basin, was 188 ft3/s from 1942–2000. The nonstorm component of streamflow (ground-water discharge or base flow plus wastewater discharge) was estimated at 82 percent of total flow, using an automated hydrograph separation method. Wastewater at the streamflow-gaging station was about 8 percent of total flow in 1997–2001, on an average annual basis. Ponds in the Assabet River Basin include instream ponds, impoundments, and kettle lakes. Wetlands are common, covering 3 percent of basin area in 1999. The wetlands potentially play an important, but variable and largely unknown, role in the regional hydrologic system in the basin.
Streamflow records at the Assabet River streamflow-gaging station and at another long-term station in the basin on Nashoba Brook were used to estimate recharge rates in the basin, by using an automated hydrograph-displacement method. Estimated recharge rates from streamflow records were about 20 in/yr for long-term conditions for the 1997–2001 period. Using a water-balance method and climate data from nearby weather stations, estimated recharge rates were about 17 in/yr for long-term conditions for 1997–2001.
A detailed water budget for anthropogenic water flows in the basin was constructed with data from 1997–2001. Public-water supply served about 80 percent of the basin population and about half the basin area. Permitted water withdrawals averaged 9.9 Mgal/d. Most (95 percent) water withdrawals were for public supply and most (74 percent) were from ground-water sources. Water (2.4 Mgal/d) also was imported into the basin for public supply. Wastewater from about 50 percent of the basin population was treated at four facilities that discharge to the Assabet River. Wastewater discharges averaged 11 Mgal/d and included about 5.4 Mgal/d that originated from sources outside of the basin, such that the basin was a net importer of wastewater in 1997–2001. Wastewater disposal to groundwater through septic systems averaged 4.3 Mgal/d, and loss of ground water through infiltration to sewers averaged
2.6 Mgal/d. Consumptive use was estimated from seasonal patterns of water use in publicly supplied towns, and averaged 0.7 Mgal/d each in publicly and privately supplied areas.
Steady-state and transient ground-water-flow models were developed, by using MODFLOW-2000, that simulated flow in the stratified glacial deposits, glacial till, and underlying crystalline bedrock in the basin. Two layers were simulated with transmissivities that did not change with changing water levels. A detailed stream network, which included all perennial streams at the 1:25,000 scale, was simulated by using the Stream Package. A monthly time step was used to simulated the average annual cycle at dynamic equilibrium. The models were calibrated to 1997–2001 conditions of average annual (steady-state model) and monthly (transient model) water withdrawals and discharges, water levels, and nonstorm streamflow. Calibration data consisted of water levels and flows estimated for 1997–2001 at 20 observation wells, 2 kettle ponds, 2 continuous streamflow-gaging stations, and 18 partial-record flow-measurement sites. Water-level and flow estimates for 1997–2001 were made from monthly measurements during August 2001 to December 2002 by correlation of measurements with water levels and flows at nearby long-term observation sites and streamflow-gaging stations. Model parameters that were adjusted during calibration included recharge, hydraulic conductivity, storage properties, and evapotranspiration. The mean absolute water-level residual for the calibrated steady-state model was 3.67 ft, or less than 1 percent of the total relief of the simulated water table in the stratified glacial deposits or the entire model area. The mean water-level residual was 0.39 ft. The mean absolute flow residual for the calibrated steady-state model was 3.4 ft3/s, or 2 percent of the total range of estimated flows for 1997–2001. For the calibrated transient model, the mean absolute monthly flow residuals averaged 39 percent of monthly nonstorm streamflows.
Total flow through the simulated hydrologic system averaged 195 Mgal/d annually. Precipitation recharge was the dominant inflow and was simulated with rates of 28.2 in/yr for stratified glacial deposits and 22.5 in/yr for glacial till. Septic-system return flow (4.3 Mgal/d) accounted for 2 percent of total inflows annually. Ground-water discharge to streams was the primary outflow, but evapotranspiration of ground water from wetlands and nonwetland areas, which were simulated as areas of net water loss, were important components of the hydrologic system. Water-supply withdrawals (9.9 Mgal/d) and infiltration to sewers (2.6 Mgal/d) averaged 5 and 1.3 percent of total outflows; other anthropogenic losses averaged less than 1 percent of total outflows annually. Anthropogenic outflows were larger components of the hydrologic system in low-flow
Summary 87
months, averaging 12 percent of total outflows basinwide in September. Water budgets for individual tributary and main stem subbasins identified areas, such as Fort Meadow Brook and the Assabet Main Stem Headwaters subbasin, where anthropogenic flows were relatively large percentages (20 to 25 percent in September) of total outflows. Wastewater discharged to the Assabet River accounted for 23, 13, and 8 percent of total nonstorm streamflow (base flow plus wastewater discharge) out of the Assabet Main Stem Upper, Middle, and Lower subbasins, respectively, on an annual average basis, and 55, 32, and 20 percent, respectively, in an average September.
Model-calculated, nonstorm streamflows at selected sites can be compared to minimum streamflows required for the protection of aquatic habitat, which recently (2004) were investigated at six sites in the basin. Model-calculated, September nonstorm streamflow at the outlets of about half the tributary subbasins fell between upper and lower minimum streamflow requirements determined for sites in the Assabet and adjacent Charles River Basins. Model-calculated September nonstorm streamflow for Cold Harbor and Howard, Danforth, Fort Meadow, and Fort Pond Brook subbasins were lower than the lower minimum streamflow requirement of about 0.2 ft3/s/mi2; these include subbasins where withdrawals and other flow alterations were 10 to 25 percent of total flows. The comparison of model-calculated flows with minimum-streamflow requirements is complicated, however, by model calibration error, variability in requirements among sites, and temporal scale issues.
Water-management alternatives were evaluated by simulating hypothetical scenarios of altered withdrawals and discharges. A scenario with no water management quantified tributary and main stem nonstorm streamflows that would result without withdrawals, discharges, septic-system return flow, or consumptive use. In this scenario, tributary flows increased in most subbasins by 2 to 44 percent relative to simulated 1997–2001 conditions. The increases resulted mostly from variable combinations of decreased withdrawals and decreased infiltration to sewers. In subbasins with public-water supply and private disposal, streamflows were nearly unchanged, because decreased withdrawals were offset by decreased septic-system return flow. Total nonstorm streamflow in the Assabet River decreased slightly in this scenario, by 2 to 3 percent annually, because gains in ground-water discharge were offset by the elimination of wastewater discharges.
A second scenario quantified the effects on nonstorm streamflow of increasing withdrawals and discharges to currently permitted levels. In this scenario, tributary flows decreased in most subbasins, by less than 1 to 10 percent
relative to simulated 1997–2001 conditions. In the Assabet River, flows increased slightly (1 to 5 percent annually), and the percentage of wastewater in the river increased to 69, 42, and 27 percent of total nonstorm streamflow out of the Assabet Main Stem Upper, Middle, and Lower subbasins, respectively, in an average September.
A third set of scenarios quantified the effects of ground-water discharge of wastewater at four hypothetical sites in Hudson, Maynard, Northborough, and Westborough. Waste-water discharged at a constant rate that varied among sites from 0.3 to 1.5 Mgal/d increased simulated nonstorm streamflow in the tributary streams adjacent to the sites, and in downstream reaches of the Assabet River. In low-flow months, increases in tributary flows were less than the constant discharge rate because of storage effects and increased ground-water evapotranspiration. Average September flows, however, more than doubled in these scenarios relative to simulated 1997–2001 conditions in the tributaries adjacent to the discharge sites, Fort Meadow, Taylor, Cold Harbor, and Stirrup Brooks. Increases in Assabet River flows were small, with reductions in the waste-water component of flow in September of 5 percent or less; flows increased the most at the outlet of the Main Stem Upper subbasin in a scenario where a large volume of water was discharged near the headwaters of the river.
Simulation-optimization analysis also was used to evaluate water-management alternatives in the upper part of the basin to determine whether streamflow depletion could be reduced, relative to simulated 1997–2001 conditions, by management of monthly withdrawals, with and without ground-water discharge. Existing supply wells, one new well, and a hypothetical discharge site in Westborough were included in the analysis. Without ground-water discharge, simulated September nonstorm streamflow in the Assabet River about doubled at the outlet of the Main Stem Headwater subbasin, and increased by about 4 percent at the outlet of the Main Stem Upper subbasin. These increases were obtained by using sources upstream of lakes, which appeared to buffer the temporal effect of withdrawals, in low- and moderate-flow months and by using sources adjacent to streams, which immediately affected flows, in high-flow months. In optimi-zation problems that included ground-water discharge, simu-lated flows increased substantially, with increases of 18 percent at the outlet of the Main Stem Upper subbasin and more than doubling flow in Stirrup Brook. The general principles illustrated in the simulation-optimization analysis could be applied in other areas of the basin where streamflow depletion is of concern.
88 Simulation of Ground-Water Flow and Evaluation of Water-Management Alternatives in the Assabet River Basin, Eastern MA
Acknowledgments
The author thanks officials of Acton, Berlin, Bolton, Boxborough, Boylston, Concord, Grafton, Hudson, Littleton, Marlborough, Maynard, Northborough, Shrewsbury, Stow, Sudbury, Westborough, and Westford for their assistance with data compilation and the installation of the monitoring wells, and Susan Beede and Suzanne Flint of the Organization for the Assabet River for their help with data compilation and gage height measurements. Guidance on model development and scenarios was provided by the TAC, which included Jane Ceraso, Acton Water Department; Alan Cathcart, Town of Concord; Thomas Parece, Earth Tech; Jay Billings, Northeast Geoscience; Susan Beede and Suzanne Flint; Vicki Gartland, Massachusetts MADCR; Barbara Kickham, Stephen Hallem, and Margaret Webber, MADEP; David Pincumbe, U.S. Environmental Protection Agency; and Stephen Garabedian, USGS. Janet Radway Stone, USGS, Hartford, CT, analyzed the lithologic data and mapped aquifer geometry. Finally, the assistance of USGS colleagues Britt Stock, Carl Carlson, Peter Steeves, and Stephen Garabedian, in data collection, GIS analysis, model development, and model calibration was greatly appreciated.
References
ABB Environmental Services, 1996, Final supplemental site investigation report for study areas A3, A5, A10, A11, P5, P6, P9, P16, P23, P27, P28, P38, P41, P45, and P54, U.S. Army Sudbury Training Annex, Middlesex County, Massachusetts: Wakefield, MA, ABB Environmental Services, Inc., variously paged.
Ahlfeld, D.P., and Mulligan, A.E., 2000, Optimal management of flow in groundwater systems: San Diego, CA, Academic Press, 185 p.
Allen, W.B., Hahn, G.W., and Tuttle, C.R., 1963, Geohydro-logic data for the Upper Pawcatuck River Basin, Rhode Island: Rhode Island Water Resources Coordinating Board GWM-3, 1 sheet.
Armstrong, D.S., Parker, G.W., and Richards, T.A., 2004, Evaluation of methods for determining streamflow requirements for habitat protection at index gaging stations in southern New England, 2000–01: U.S. Geological Survey Water-Resources Investigations Report 03-4332, 101 p.
Armstrong, D.S., Richards, T.A., and Parker, G.W., 2001, Assessment of habitat, fish communities, and streamflow requirements for habitat protection, Ipswich River, Massachusetts, 1998–98: U.S. Geological Survey Water-Resources Investigations Report 01-4161, 72 p.
Barlow, P.M., 1997, Dynamic models for conjunctive management of stream-aquifer systems of the glaciated northeast: Storrs, CT, University of Connecticut, Ph.D. Thesis, 256 p.
Barlow, P.M., and Dickerman, D.C., 2001, Numerical-simulation and conjunctive-management models of the Hunt–Annaquatucket–Pettaquamscutt stream-aquifer system, Rhode Island: U.S. Geological Survey Professional Paper 1636, 79 p.
Bent, G.C., 1995, Streamflow, ground-water recharge and discharge, and characteristics of surficial deposits in Buzzards Bay Basin, Southeastern Massachusetts: U.S. Geological Survey Water-Resources Investigations Report 95-4234, 56 p.
Bent, G.C., 1999, Streamflow, base flow, and ground-water recharge in the Housatonic River Basin, western Massachusetts and parts of eastern New York and northwestern Connecticut: U.S. Geological Survey Water-Resources Investigations Report 98-4232, 68 p.
Brackley, R.A., and Hansen, B.P., 1985, Hydrology and water resources of the tributary basins to the Merrimack River from Salmon Brook to the Concord River, Massachusetts: U.S. Geological Survey Hydrologic Atlas HA-662, 2 sheets.
Bratton, Lisa, and Parker, G.W., 1995, Estimated availability of water resources from stratified-drift aquifers in the Concord River Basin, Massachusetts: U.S. Geological Survey Water-Resources Investigations Report 94-4256, 35 p.
Camp, Dresser, & McKee, 1990, Final report on groundwater testing program at the Howard Street well site, Town of Northborough, Massachusetts: Cambridge, MA, Camp, Dresser, & McKee, Inc., variously paged.
Camp, Dresser, & McKee, 2001, Marlborough, Massachusetts, Comprehensive wastewater management plan/ Environmental impact statement, Phase I—Needs Analysis: Cambridge, MA, Camp, Dresser, & McKee, Inc., variously paged.
Camp, Dresser, & McKee, 2002, Marlborough, Massachusetts, Comprehensive wastewater management plan/ Environmental impact statement, Phase II—Development and screening of alternatives: Cambridge, MA, Camp, Dresser, & McKee, Inc., variously paged.
Campbell, M.R., 1925, The physical features of central Massachusetts: U.S. Geological Survey Bulletin 760, p. 13–105.
Carter, Virginia, and Novitzki, R.P., 1988, Some comments on the relation between ground water and wetlands, in Hook, D.D., McKee, W.H., Jr., Smith, H.K., Gregory, J., Burrel, V.G., Jr., DeVoe, M.R., Sojka, R.E., Gilber, S., Banks, R., Stolzy, L.H., Brooks, C., Matthews, T.D., and Shear, T.H., The Ecology and Management of Wetlands, volume 1: Portland, OR, Timber Press, p. 68–97.
Cole, C.A., and Brooks, R.P., 2000, Patterns of wetland hydrology in the Ridge and Valley Province, Pennsylvania, USA: Wetlands, v. 20, no. 3, p. 438–447.
DeLima, Virginia, 1991, Stream-aquifer relations and yield of stratified-drift aquifers in the Nashua River Basin, Massachusetts: U.S. Geological Survey Water-Resources Investigations Report 88-4847, 47 p.
References 89
DeSimone, L.A., Walter, D.A., Eggleston, J.R., and Nimiroski, M.T., 2002, Simulation of ground-water flow and evaluation of water-management alternatives in the upper Charles River Basin, eastern Massachusetts: U.S. Geological Survey Water-Resources Investigations Report 02-4234, 94 p.
Dickerman, D.C., Trench, E.C.T., and Russell, J.P., 1990, Hydrogeology, water quality, and ground-water development alternatives in the lower Wood River ground-water reservoir: U.S. Geological Survey Water-Resources Investigations Report 89-4031, 109 p.
Dufresne-Henry, 1981, Report on continuous pumping test, Site—Test Well No. 14, Department of Public Works, Maynard, Massachusetts: Westford, MA, Dufresne-Henry, Inc., variously paged.
Dufresne-Henry, 1989, Town of Maynard, Final report, Infiltration/inflow study, Sewer system evaluation study: Westford, MA, Dufresne-Henry, Inc., variously paged.
Dufresne-Henry, 1993, Report on Conant II pumping test, Acton Water District, Acton, MA: Westford, MA, Dufresne-Henry, Inc., variously paged.
Dufresne-Henry, 1996, Report on Kennedy No. 1 and Marshall Wellfields Zone II delineation, Acton Water District, Acton, MA: Westford, MA, Dufresne-Henry, Inc., variously paged.
Dufresne-Henry, 1999, Request for site exam, Rockland Avenue wellfield: Westford, MA, Dufresne-Henry, Inc., variously paged.
Dufresne-Henry, 2001, Phase 1 Sewerage needs analysis, Comprehensive wastewater management plan, Maynard, Massachusetts: Westford, MA, Dufresne-Henry, Inc., variously paged.
Dufresne-Henry, 2002, Phase 2, Wastewater disposal alternatives, Comprehensive wastewater management plan, Maynard, Massachusetts: Westford, MA, Dufresne-Henry, Inc., variously paged.
Dysart, J.E., and Rheaume, S.J., 1999, Induced infiltration from the Rockaway River and water chemistry in a stratified-drift aquifer at Dover, New Jersey: U.S. Geological Survey Water-Resources Investigations Report 96-4068, 112 p.
Earth Tech, Inc., 2000a, Source water assessment program conceptual Zone II delineation Assabet Water Company wells, Stow, MA: January 2000, variously paged.
Earth Tech, 2000b Source water assessment program conceptual Zone II delineations Brigham Street and Crawford Street wells, Northborough Water Department, Northborough, MA: Concord, MA, Earth Tech, Inc., variously paged.
Earth Tech, 2000c, Source water assessment program conceptual Zone II delineation, Cranberry Well, Hudson Department of Public Works, Hudson, MA: Concord, MA, Earth Tech, Inc., variously paged.
Earth Tech, 2000d, Source water assessment program conceptual Zone II delineation Old Marlboro Road wells/ Great Road well, Maynard Department of Public Works, Water Division, Maynard, MA: Concord, MA, Earth Tech, Inc., variously paged.
Earth Tech, 2000e, Source water assessment program conceptual Zone II delineations Otis Street, Hopkinton Road and Morse Street wells, Westborough Water Department, Westborough, MA: Concord, MA, Earth Tech, Inc.,variously paged.
Earth Tech, 2001a, Comprehensive wastewater management plan and environmental impact report, Phase I—Needs analysis, Assabet Consortium: Concord, MA, Earth Tech, Inc., variously paged.
Earth Tech, 2001b, Comprehensive wastewater management plan and environmental impact report, Phase I—Needs analysis Concord, Massachusetts: Concord, MA, Earth Tech, Inc., variously paged.
Earth Tech, 2001c, Comprehensive wastewater management plan and environmental impact report, Phase I—Needs analysis, Hudson, Massachusetts: Concord, MA, Earth Tech, Inc., variously paged.
Earth Tech, 2001d, Comprehensive wastewater management plan and environmental impact report, Phase I—Needs analysis, Shrewsbury, Massachusetts: Concord, MA, Earth Tech, Inc., variously paged.
Earth Tech, 2001e, Comprehensive wastewater management plan and environmental impact report, Phase I—Needs analysis, Westborough, Massachusetts: Concord, MA, Earth Tech, Inc., variously paged
Earth Tech, 2002a, Comprehensive wastewater management plan and environmental impact report, Phase II— Development and screening of alternatives, Assabet Consortium: Concord, MA, Earth Tech, Inc., variously paged.
Earth Tech, 2002b, Comprehensive wastewater management plan and environmental impact report, Phase II— Development and screening of alternatives, Hudson, Massachusetts: Concord, MA, Earth Tech, Inc., variously paged.
Earth Tech, 2002c, Comprehensive wastewater management plan and environmental impact report, Phase II— Development and screening of alternatives, Westborough, Massachusetts: Concord, MA, Earth Tech, Inc., variously paged.
Earth Tech, 2002d, Comprehensive wastewater management plan and environmental impact report, Phase II— Development and screening of alternatives, Westborough Regional Wastewater Treatment Plant: Concord, MA, Earth Tech, Inc., variously paged.
Ecology and Environment, 1994, Phase II site investigations report, volume III of III, Appendices, Fort Devens Sudbury Training Annex, Massachusetts: Arlington, VA, Ecology and Environment, Inc., variously paged.
Eggleston, J.R., 2004, Evaluating strategies for balancing water use and streamflow reductions in the upper Charles River Basin, eastern Massachusetts: U.S. Geological Survey Water-Resources Investigations Report 03-4330, 85 p.
90 Simulation of Ground-Water Flow and Evaluation of Water-Management Alternatives in the Assabet River Basin, Eastern MA
Elassal, A.A., and Caruso, V.M., 1983, Digital elevation models, in McEwen, R.B., Witmer, R.E., and Ramey, B.S., eds., USGS Digital Cartographic Data Standards: U.S. Geological Survey Circular 895-B, 40 p.
ENSR International, 2001, SuAsCo Watershed Assabet River TMDL study phase one—Assessment final report: Westford, MA, ENSR International, Inc., variously paged.
ENSR International, 2004, SuAsCo Watershed Assabet River TMDL study phase two—Draft final report: Westford, MA, ENSR International, Inc., variously paged.
Epsilon Associates, 2000, Fab 17 expansion project, Mod 4 Water Management Act Application: Maynard, MA, Epsilon Associates, Inc., variously paged.
Epsilon Associates, 2002a, Quail Ridge Country Club Water Management Act application: Maynard, MA, Epsilon Associates, Inc., variously paged.
Epsilon Associates, 2002b, Water Management Act amendment to existing withdrawal permit 9P4-2-14-141.03: Maynard, MA, Epsilon Associates, Inc., variously paged.
Fay, Spofford, and Thorndike, 2001a, Town of Northborough, MA, Comprehensive wastewater management plan/ Environmental impact statement, Phase I—Needs Analysis: Burlington, MA, Fay, Spofford, and Thorndike, Inc., variously paged.
Fay, Spofford, and Thorndike, 2001b, Westborough Wastewater Treatment Plant, Comprehensive wastewater management plan/ Environmental impact statement, Phase I—Needs Analysis: Burlington, MA, Fay, Spofford, and Thorndike, Inc., variously paged.
Fay, Spofford, and Thorndike, 2002a, Town of Northborough, MA, Comprehensive wastewater management plan/ Environmental impact statement, Phase II—Development and screening of alternatives: Burlington, MA, Fay, Spofford, and Thorndike, Inc., variously paged.
Fay, Spofford, and Thorndike, 2002b, Town of Shrewsbury, MA, Comprehensive wastewater management plan/ Environmental impact statement, Phase II—Development and screening of alternatives: Burlington, MA, Fay, Spofford, and Thorndike, Inc., variously paged.
Geologic Services Corporation, 1984, Report of 2-1/2 inch diameter test well drilling and short term pump testing— 1983 program—Westborough, Massachusetts: Hudson, MA, Geologic Services Corporation, Inc., variously paged.
Geologic Services Corporation, 1985, Report on 8-inch test well construction and prolonged pump test site #31-83, Chauncy Lake, Westborough, Massachusetts: Hudson, MA, Geologic Services Corporation, Inc., variously paged.
Geologic Services Corporation, 1987, Comprehensive evaluation of Chauncy Lake test well site, Westborough, Massachusetts, volume 1: Hudson, MA, Geologic Services Corporation, Inc., variously paged.
Geologic Services Corporation, 1989, 2 1/2-inch exploratory test well program 1987–1989, Westborough, Massachusetts: Hudson, MA, Geologic Services Corporation, Inc., variously paged.
Geologic Services Corporation, 1995a, Source final report Indian Meadows well site, Westborough, Massachusetts: Hudson, MA, Geologic Services Corporation, Inc., variously paged.
Geologic Services Corporation, 1995b, Report on the delineation of the Zone II recharge area Chauncy Lake well sites, Westborough, Massachusetts: Hudson, MA, Geologic Services Corporation, Inc., variously paged.
Geologic Services Corporation, 1996, Report on the installation and testing of two 24 inch x 48 inch gravel packed wells, Chauncy Lake well sites, Westborough, Massachusetts: Hudson, MA, Geologic Services Corporation, Inc., variously paged.
Geologic Services Corporation, 2000, Report on the installation and testing of a 24 x 48 inch gravel packed well at the Indian Meadows well site, Westborough, Massachusetts, Hudson, MA, Geologic Services Corporation, Inc., variously paged.
Geoscience Consultants, 1988, Report on results of the aquifer test at the Executive Center supply well, Boxborough, Massachusetts: Geoscience Consultants, Inc., variously paged.
GeoTrans, 2001, Phase I remedial investigation data report, W.R. Grace Superfund Site, Acton, Massachusetts: Harvard, MA, GeoTrans, Inc., variously paged.
Goldberg-Zoino & Associates, 1985, Lawsbrook aquifer contamination study: Newton, MA, Goldberg-Zoino & Associates, Inc., variously paged.
Goldberg, Zoino, Dunnicliff & Associates, 1980a, Groundwater investigation, Assabet Well Field, Acton, Massachusetts, volume I of II: Newton, MA, Goldberg, Zoino, Dunnicliff & Associates, 79 p.
Goldberg, Zoino, Dunnicliff & Associates, 1980b, Groundwater investigation Assabet Well Field, Acton, Massachusetts, volume II of II: Newton, MA, Goldberg, Zoino, Dunnicliff & Associates, variously paged.
Goldsmith, Richard, 1991a, Stratigraphy of the Nashoba Zone, eastern Massachusetts—An enigmatic terrane, in Hatch., N.L., Jr., ed., The bedrock geology of Massachusetts: U.S. Geological Survey Professional Paper 1366-E-J, p. F1–F22.
Goldsmith, Richard, 1991b, Structural and metamorphic history of eastern Massachusetts, in Hatch., N.L., Jr., ed., The bedrock geology of Massachusetts: U.S. Geological Survey Professional Paper 1366-E-J, p. H1–H63.
Gordon, N.D., McMahon, T.A., and Finlayson, B.L., 1992, Stream hydrology—An introduction for ecologists: New York, John Wiley and Sons, 526 p.
Gorelick, S.M., Freeze, R.A., Donahue, David, and Keely, J.F., 1993, Groundwater contamination—Optimal capture and containment: Boca Rotan, FL, Lewis Publishers, 385 p.
Hamon, W.R., 1961, Estimating potential evapotranspiration: Proceedings of the America Society of Civil Engineers, Journal of the Hydraulic Division, v. 87, no. HY3, p. 107–120.
References 91
Hansen, W.R., 1956, Geology and mineral resources of the Hudson and Maynard Quadrangles, Massachusetts: U.S. Geological Survey Bulletin 1038, 104 p.
Harbaugh, A.W., Banta, E.R., Hill, M.C., and McDonald, M.G., 2000, MODFLOW-2000, the U.S. Geological Survey modular ground-water model—User guide to modularization concepts and the ground-water flow process: U.S. Geological Survey Open-File Report 00-92, 121 p.
Hill, M.C., 1998, Methods and guidelines for effective model calibration: U.S. Geological Survey Water-Resources Investigations Report 98-4005, 90 p.
Hill, M.C., Banta, E.R., Harbaugh, A.W., and Anderman, E.R., 2000, MODFLOW-2000, the U.S. Geological Survey modular ground-water model—User guide to the observa-tion, sensitivity, and parameter-estimation processes and three post-processing programs: U.S. Geological Survey Open-File Report 00-184, 209 p.
Hirsch, R.M., 1982, A comparison of four streamflow record extension techniques: Water Resources Research, v. 18, no. 4, p. 1081–1088.
HMM Associates, 1987, Acorn Park final environmental impact report, Acton, Massachusetts: Concord, MA, HMM Associates, Inc., variously paged.
Horn, M.A., 2000, Method for estimating water use and interbasin transfers of freshwater and wastewater in an urbanized basin: U.S. Geological Survey Water-Resources Investigations Report 99-4287, 34 p.
Hunt, R.J., Krabbenhoft, D.P., and Anderson, M.P., 1996, Groundwater inflow measurements in wetland systems: Water Resources Research, v. 32, no. 3, p. 495–507.
Jahns, R.H., 1953, Surficial geologic map of the Ayer Quadrangle, Massachusetts: U.S. Geological Quadrangle Map GQ-21.
Johnson, A.I., 1967, Specific yield—Compilation of specific yields for various materials: U.S. Geological Survey Water-Supply Paper 1662-D, 74 p.
Keystone Environmental Resources, 1991, Summary of the shallow boring/deep overburden investigation, Hocomonco Pond: Monroeville, PA, Keystone Environmental Resources, Inc., variously paged.
Kontis, A.L., Randall, A.D., and Mazzaferro, D.L., in press, Regional hydrology and simulation of flow of stratified drift aquifers in the glaciated northeastern United States: U.S. Geological Survey Professional Paper 1415C.
Koteff, Carl, 1963, Glacial lakes near Concord, Massachusetts: U.S. Geological Survey Professional Paper 475-C, p. C142–C144.
Koteff, Carl, 1966, Surficial geologic map of the Clinton Quadrangle, Worcester County, Massachusetts: U.S. Geological Quadrangle Map GQ-567.
Lumb, A.M., and Kittle, J.L., Jr., 1995, Users manual for METCMP, a computer program for the interactive computation of meteorologic time series: Unpublished U.S. Geological Survey Report, 88 p.
Lyford, F.P., Carlson, C.S., and Hansen, B.P., 2003, Delineation of water sources for public-supply wells in three fractured-bedrock aquifer systems in Massachusetts: U.S. Geological Survey Water-Resources Investigations Report 02-4290, 113 p.
Massachusetts Department of Environmental Protection, 2000, Golf course water use policy: Boston, MA, Massachusetts Department of Environmental Protection, Policy #BRP/BWM/PeP-P00-4.
Massachusetts Department of Environmental Protection, 2003, Massachusetts Year 2002 integrated list of waters, Part 2— Final listing of individual categories of waters: Boston, MA, Massachusetts Department of Environmental Protection, variously paged.
Massachusetts Division of Employment and Training, 2003, Current employment statistics (CES 790) series, accessed February 2003 at URL http://www.detma.org/lmi/lmi.htm
Massachusetts Technology Collaborative, 1998, The I-495 regional overview, November 1998, accessed March 2001 at URL http://www.mtpc/org/495solutions/495reports.htm
Massachusetts Technology Collaborative, 1999, 495 water and sewer task force, January 1999, accessed March 2001, at URL http://www.mtpc/org/495solutions/495reports.htm
MassGIS, 2001, MassGIS datalayer descriptions and guide to user services: Boston, MA, Commonwealth of Massachusetts, Executive Office of Environmental Affairs, 214 p.
Masterson, J.P., and Barlow, P.M., 1997, Effects of simulated ground-water pumping and recharge on ground-water flow in Cape Cod, Martha’s Vineyard, and Nantucket Island Basins, Massachusetts: U.S. Geological Survey Water-Supply Paper 2447, 79 p.
Masterson, J.P., Walter, D.A., and LeBlanc, D.R., 1998, Delineation of contributing areas to selected public-supply wells, Western Cape Cod, Massachusetts: U.S. Geological Survey Water-Resources Investigations Report 98-4237, 45 p.
McCulley, Frick & Gilman, 1997, Phase I environmental site assessment and limited subsurface investigation, 10 Bearfoot Road, Northborough, Massachusetts: Wallace, ID, McCulley, Frick & Gilman, variously paged.
Melvin, R.L., de Lima, Virginia, and Stone, B.D., 1992, The stratigraphy and hydraulic properties of till in southern New England: U.S. Geological Survey Open-File Report 91-481, 53 p.
Metcalf & Eddy, 1994, City-wide groundwater exploration study for the City of Marlborough, Massachusetts: Wakefield, MA, Metcalf & Eddy, Inc., variously paged.
Mitsch, W.J., and Gosselink, J.G., 1993, Wetlands (2d ed.): New York, Van Nostrand Reinhold, 722 p.
Moench, A.G., Garabedian, S.P., and LeBlanc, D.R., 2000, Estimation of hydraulic parameters from an unconfined aquifer test conducted in a glacial outwash deposit, Cape Cod, Massachusetts: U.S. Geological Survey Open-File Report 00-485, 139 p.
92 Simulation of Ground-Water Flow and Evaluation of Water-Management Alternatives in the Assabet River Basin, Eastern MA
Morris, D.A., and Johnson, A.I., 1967, Summary of hydrologic and physical properties of rock and soil materials, as analyzed by the hydrologic laboratory of the U.S. Geological Survey 1948-60: U.S. Geological Survey Water-Supply Paper 1839-D, 42 p.
Motts, W.S., and O’Brien, A.L., 1981, Geology and hydrology of wetlands in Massachusetts: Amherst, MA, Water Resources Research Center, University of Amherst, MA, 147 p.
National Oceanic and Atmospheric Administration, 2002, National Climate Data Center, Climate Data Online, accessed November 2002 at URL http://cdo.ncdc.noaa.gov/ CDO/cdo
Organization for the Assabet River, 2003a, Assabet River Streamwatch, accessed September 2003 at URL http://www.assabetriver/org/streamwatch
Organization for the Assabet River, 2003b, Upper Assabet Riverway Plan—Concord, MA, January 2003, accessed September 2003 at URL: http://ww.assabetriver.org/news/ urarplan.html
Parker, G.W., Armstrong, D.S., and Richards, T.A., 2004, Comparison of methods for habitat protection at selected sites on the Assabet and Charles Rivers, eastern Massachusetts: U.S. Geological Survey Scientific Investigations Report 2004-5092, 72 p.
Penman, H.L., 1948, Natural evaporation from open water, bare soil, and grass: Proceedings of the Royal Society of London, ser. A., v. 193, no. 1032, p. 120–145.
Perlmutter, N.M., 1962, Ground-water geology and hydrology of the Maynard area, Massachusetts: U.S. Geological Survey Water-Supply Paper 1539-E, 69 p.
Pollock, S.J., and Fleck, W.B., 1964, Assabet River Basin: U.S. Geological Survey Basic-Data Report No. 8, Ground-Water Series, 45 p.
Pollock, S.J., Farrell, D.F., and Caswell, W.W., 1969, Water resources of the Assabet River Basin, central Massachusetts: U.S. Geological Survey Hydrologic Atlas HA-312, 1 sheet.
Prince, K.R., Franke, O.L., and Reilly, T.E., 1988, Quantitative assessment of the shallow ground-water flow system associated with Connetquot Brook, Long Island, New York: U.S. Geological Survey Water-Supply Paper 2309, 28 p.
Prudic, D.E., 1989, Documentation of a computer program to simulate stream-aquifer relations using a modular, finite-difference, ground-water flow model: U.S. Geological Survey Open-File Report 88-729, 113 p.
Randall, A.D., 2001, Hydrogeologic framework of stratified-drift aquifers in the glaciated northeastern United States: U.S. Geological Survey Professional paper 1415-B, 179 p.
Randall, A.D., Francis, R.M., Frimpter, M.H., and Emery, J.M., 1988, Northeastern Appalachians, in Back, William, Rosenshein, J.S., and Seaber, P.R., Hydrogeology: Boulder, CO, The Geological Society of America, The Geology of North America, v. O-2, p. 177–187.
Randall, A.D., Thomas, M.P., Thomas, C.E., Jr., and Baker, J.A., 1966, Water resources inventory of Connecticut, part 1, Quinnebaug River Basin: Connecticut Water Resources Bulletin 8, 99 p.
Richardson, L.E., 1964, Concord River: Barre, MA, Barre Publishers, 74 p.
Ries, K.G., III, 1993, Estimation of low-flow duration discharges in Massachusetts: U.S. Geological Survey Open-File Report 93-38, 59 p.
Ries, K.G., III, 1994, Development and application of generalized-least-squares regression models to estimate low-flow duration discharges in Massachusetts: U.S. Geological Survey Water-Resources Investigations Report 94-4155, 33 p.
Ries, K.G., III, 1999, Streamflow measurements, basin charac-teristics, and streamflow statistics for low-flow partial record stations operated in Massachusetts from 1989 through 1996: U.S. Geological Survey Water-Resources Investigations Report 99-4006, 162 p.
Ries, K.G., III, and Friesz, P. J., 2000, Methods for estimating low-flow statistics for Massachusetts streams: U.S. Geological Survey Water-Resources Investigations Report 00-4136, 81 p.
Rizzo Associates, 1990, Aquifer pump test report Bay State Circuits, Inc., Northboro, Massachusetts: Framingham, MA, Rizzo Associates, Inc., variously paged.
Rorabaugh, M.I., 1964, Estimating changes in bank storage and ground-water contribution to streamflow: International Association of Scientific Hydrology, Publication 63, p. 352–363.
Rosenshein, J.S., 1968, Hydrologic characteristics and sustained yield of principal ground-water units, Potowomut–Wickford area, Rhode Island: U.S. Geological Survey Water-Supply Paper 1775, 38 p.
Rosenshein, J.S., 1988, Alluvial valleys, in Back, William, Rosenshein, J.S., and Seaber, P.R., Hydrogeology: Boulder, CO, The Geological Society of America, The Geology of North America, v. O-2, p. 177–187.
Rutledge, A.T., 1993, Computer programs for describing the recession of ground-water discharge and for estimating mean ground-water recharge and discharge from streamflow records: U.S. Geological Survey Water-Resources Investigations Report 93-4121, 45 p.
References 93
Rutledge, A.T., 1998, Computer programs for describing the recession of ground-water discharge and for estimating mean ground-water recharge and discharge from streamflow records—Update: U.S. Geological Survey Water-Resources Investigations Report 98-4148, 43 p.
Rutledge, A.T., 2000, Considerations for the use of the RORA program to estimate ground-water recharge from streamflow records: U.S. Geological Survey Open-File Report 00-156, 44 p.
SAS Institute, 1993, SAS/ETS Users Guide, Version 6 (2d ed.): Cary, NC, SAS Institute, Inc., 1,022 p.
Sasaki Associates, 1989, Marlborough groundwater investi-gation, Metropolitan Corporate Center, Marlborough, Massachusetts: Watertown, MA, Sasaki Associates, Inc., variously paged.
Schrage, L.E., 1997, Optimization modeling with LINDO (5th ed.): Pacific Grove, CA, Brooks/Cole Publishing Company, 470 p.
Shaw, C.E., 1969, Surficial geologic map of the Shrewsbury Quadrangle, Worcester County, Massachusetts: U.S. Geological Quadrangle Map GQ-794.
Socolow. R.S., Girouard, G.G., and Ramsbey, L.R., 2003, Water resources data Massachusetts and Rhode Island Water Year 2002: U.S. Geological Survey Water-Data Report MA-RI-02-1, 339 p.
Socolow. R.S., Leighton, C.R., Whitley, J.F., and Ventetuolo, D.J., 2002, Water resources data Massachusetts and Rhode Island Water Year 2001: U.S. Geological Survey Water-Data Report MA-RI-01-1, 307 p.
Stone, J.R., and Dickerman, D.C., 2002, Surficial materials map of the Big River Area, Central Rhode Island: U.S. Geological Survey Water-Resources Investigations Report 01-4169, 1 p.
Stone, J.R., Shafer, J.P., London, E.H., DiGiacomo-Cohen, Mary, Lewis, R.S., and Thompson, W.B., 1998, Quaternary geologic map of Connecticut and Long Island Sound Basin: U.S. Geological Survey Open-File Report 98-371, 69 p.
Thornthwaite, C.W., and Mather, J.R., 1957, Instructions and tables for computing potential evapotranspiration and the water balance: Centerton, NJ, Drexel Institute of Technology, Publications in Climatology, v. 10, no. 3.
Tiedeman, C.R., Goode, D.J., and Hsieh, P.A., 1997, Numerical simulation of ground-water flow through glacial deposits and crystalline bedrock in the Mirror Lake area, Grafton County, New Hampshire: U.S. Geological Survey Professional Paper 1572, 50 p.
U.S. Census Bureau, 2003, American Factfinder Census 2000 data sets accessed January 2003 at http://factfinder.census.gov
U.S. Department of Housing and Urban Development, 1978, Flood insurance study, Town of Maynard, Massachusetts, Middlesex County: Federal Insurance Administration, 19 p.
U.S. Department of Housing and Urban Development, 1979a, Flood insurance study, Town of Stow, Massachusetts, Middlesex County: Federal Insurance Administration, February 1979, 21 p.
U.S. Department of Housing and Urban Development, 1979b, Flood insurance study, Town of Hudson, Massachusetts, Middlesex County: Federal Insurance Administration, June 1979, 26 p.
U.S. Department of Housing and Urban Development, 1979c, Flood insurance study, Town of Northborough, Massachusetts, Worcester County: Federal Insurance Administration.
U.S. Department of Housing and Urban Development, 1979d, Flood insurance study, Town of Westborough, Massachusetts, Worcester County: Federal Insurance Administration, 22 p.
U.S. Department of Housing and Urban Development, 1979e, Flood insurance study, Town of Berlin, Massachusetts, Worcester County: Federal Insurance Administration, 21 p.
U.S. Department of Housing and Urban Development, 1979f, Flood insurance study, Town of Bolton, Massachusetts, Worcester County: Federal Insurance Administration, 21 p.
U.S. Department of Housing and Urban Development, 1981, Flood insurance study, City of Marlborough, Massachusetts, Middlesex County: Federal Insurance Administration, 18 p.
U.S. Department of Housing and Urban Development, 1982a, Flood insurance study, Town of Harvard, Massachusetts, Worcester County: Federal Insurance Administration, 25 p.
U.S. Department of Housing and Urban Development, 1982b, Flood insurance study, Town of Littleton, Massachusetts, Middlesex County: Federal Insurance Administration, 21 p.
U.S. Department of Housing and Urban Development, 1982c, Flood insurance study, Town of Westford, Massachusetts, Middlesex County: Federal Insurance Administration, 21 p.
U.S. Department of Housing and Urban Development, 1988a, Flood insurance study, Town of Acton, Massachusetts, Middlesex County: Federal Insurance Administration, 29 p.
U.S. Department of Housing and Urban Development, 1988b, Flood insurance study, Town of Carlisle, Massachusetts, Middlesex County: Federal Insurance Administration, 24 p.
U.S. Department of Housing and Urban Development, 1988c, Flood insurance study, Town of Concord, Massachusetts, Middlesex County: Federal Insurance Administration, 33 p.
94 Simulation of Ground-Water Flow and Evaluation of Water-Management Alternatives in the Assabet River Basin, Eastern MA
U.S. Department of Housing and Urban Development, 1999, Flood insurance study, Town of Boxborough, Massachusetts, Middlesex County: Federal Insurance Administration, 19 p.
U.S. Fish and Wildlife Service, 1981, Interim regional policy for New England stream flow recommendations: New Corner, MA, U.S. Fish and Wildlife Service, 3 p.
Veihmeyer, F.J., Evapotranspiration, 1964 in Chow, V.T., ed., Handbook of applied hydrology: New York, McGraw-Hill, p. 11-1 to 11-38.
Walsh, G.J., 2001, Bedrock geology in the vicinity of the Rockland Avenue well site, Maynard, Massachusetts: U.S. Geological Survey Open-File Report 01-354, 15 p.
Weston & Sampson Engineers, 1997, Report on Zone II analysis: Peabody, MA, Weston & Sampson Engineers, Inc., variously paged.
Whitman & Howard, Inc., 1986, Test well and pumping test report, Chestnut Street aquifer, Hudson, Massachusetts: Wellesley, MA, Whitman & Howard, Inc., variously paged.
Whitman & Howard, 1987a, Groundwater monitoring program at the Cranberry Well, Hudson, Massachusetts: Wellesley, MA, Whitman & Howard, Inc., variously paged.
Whitman & Howard, 1987b, Report on contamination correction study, Chestnut Street municipal well and Kane municipal well, Hudson, Massachusetts, volume I: Wellesley, MA, Whitman & Howard, Inc., variously paged.
Whitman & Howard, 1987c, Report on contamination correction study, Chestnut Street municipal well and Kane municipal well, Hudson, Massachusetts, volume II: Wellesley, MA, Whitman & Howard, Inc., variously paged.
Winter, T.C., Harvey, J.W., Franke, O.L., and Alley, W.M., 1998, Ground water and surface water—A single resource: U.S. Geological Survey Circular 1139, 79 p.
Winter, T.C., Rosenberry, D.O., and Sturrock, A.M., 1995, Evaluation of 11 equations for determining evaporation for a small lake in the north central United States: Water Resources Research, v. 31, no. 4, p. 983–993.
Woodward & Curran, 2002, Comprehensive water resources management plan, Acton, Massachusetts: Dedham, MA, Woodward & Curran, Inc., variously paged.
Zen, E-an, editor, and Goldsmith, Richard, Ratcliffe, N.M., Robinson, Peter, and Stanley, R.S., compilers, 1983, Bedrock geologic map of Massachusetts: U.S. Geological Survey, 3 sheets, scale 1:250,000.