Embed Size (px)
Citation preview
Simulation of Cold Roll Forming of Steel Panels
Fei-chin Jan
University of Pittsburgh May 2000
ABSTRACT
This project uses LS-DYNA to simulate the rolling deformation of a flat steel
sheet into a panel of particular shape. The process involves the gradual deformation of
the steel sheet by passing it through a series of rollers at a constant speed. Each of these
sets of rollers is oriented at a slightly different angle to incrementally increase the
deformation of the sheet until the desired geometry is obtained in the panel. Since the
sheet could be going through several different sets of rollers at the same time, the
deformation process is very complex and highly non-linear. During this process, the
sheet metal panel undergoes plastic deformation and develops residual stresses. Some of
the problems encountered with these panels include waviness surface, undesirable local
deformation at the front (head) of the panel and excessive spring back of the end of the
panel (tail). These problems are also observed in the results from the simulation and
methods to minimize their effect are investigated. Other issues encountered in the
simulation include the contact mechanism between the moving panel and a moving roller,
effect of roller size and placement, panel thickness, panel speed and roller friction. An
adaptive mesh was used to efficiently mesh the plate and rollers at critical locations. The
results obtained should help improve both the simulation process and the actual cold-roll-
forming-process especially when new or different metals are being introduced.
INTRODUCTION
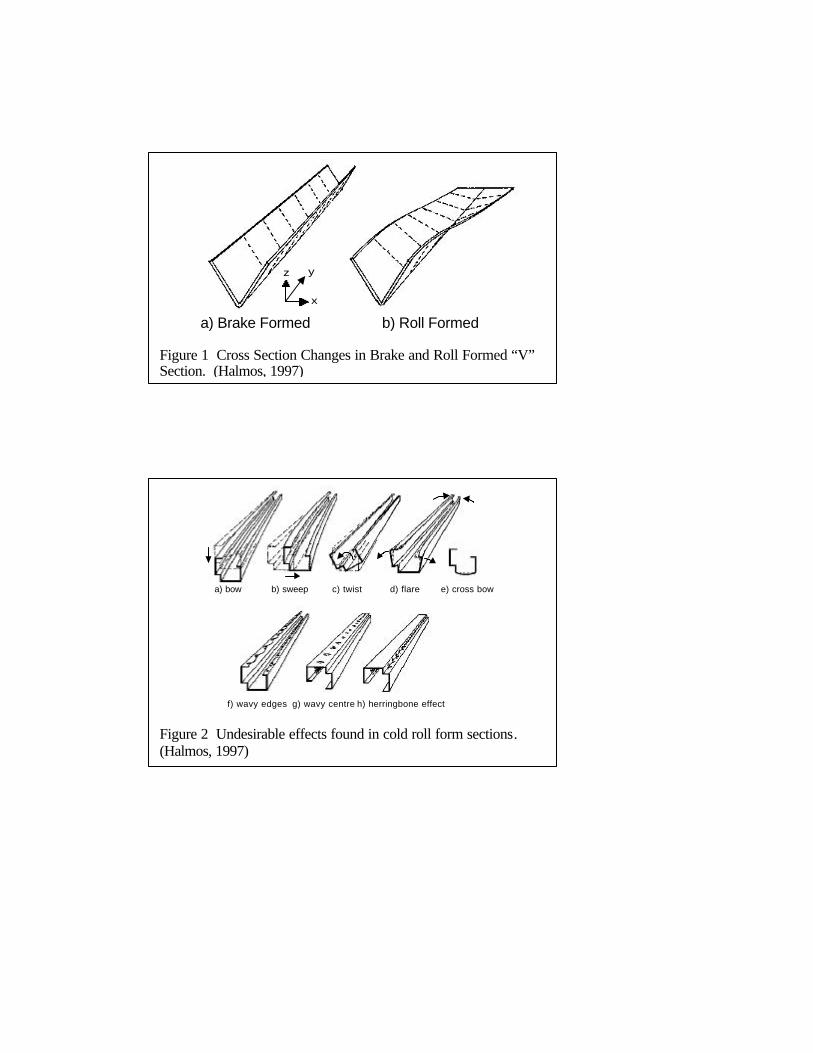
Cold forming processes are classified as brake forming or roll forming. Both
processes are performed at room temperature with no heating of the material. In the
brake forming process, the deformation of the whole panel is accomplished
simultaneously in one step (see Figure 1-a), while in the cold roll forming process; the
panel is gradually deformed using a piece-wise approach. The cross sections of roll
formed panel will not be the same along the length of the panel during the rolling process
(see Figure 1-b). A complex pattern of forming may produce considerable residual
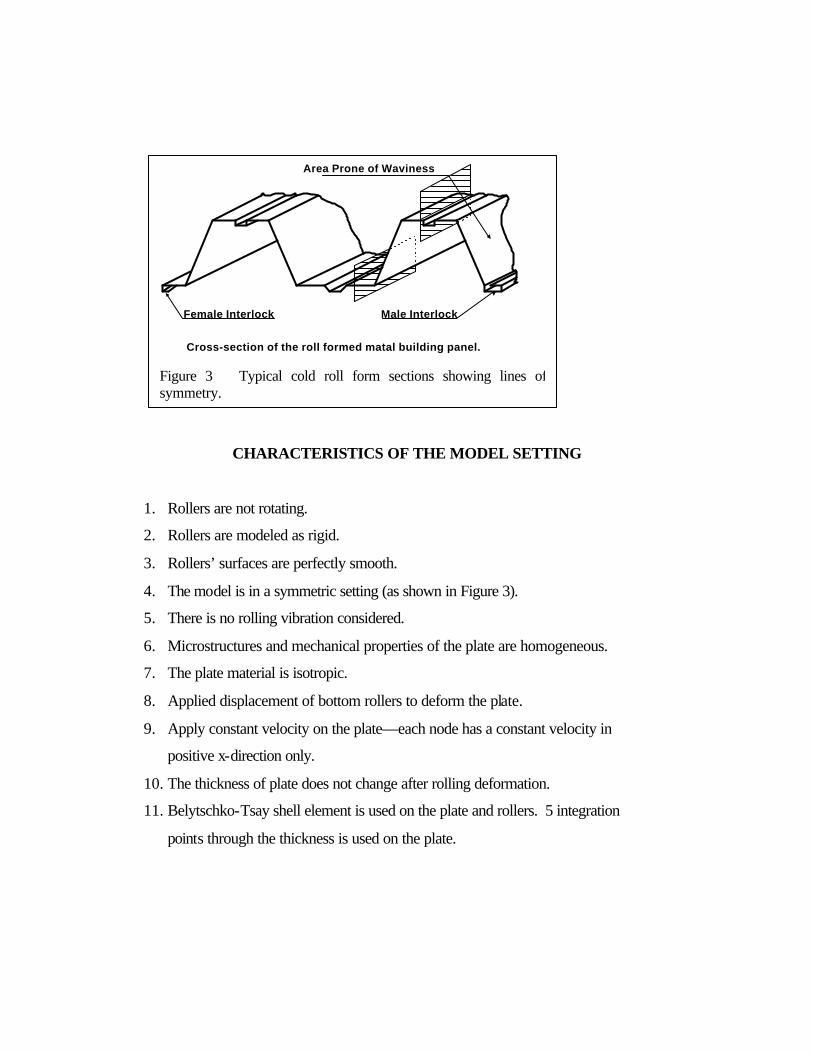
stresses on the panel (will be explained in the following). Some of the defects observed
are shown in Figure 2. (Halmos, 1997)
The goal of this project is to simulate and analyze the cold roll forming process
using LS-DYNA. The research is focused on investigating the wavy center formed after
the cold rolling process by using explicit Finite Element Analysis (FEA) techniques.
After the cold rolling process, a sheet metal panel has permanent deformation and
residual stresses. Excessive defects make the panels unacceptable commercially to
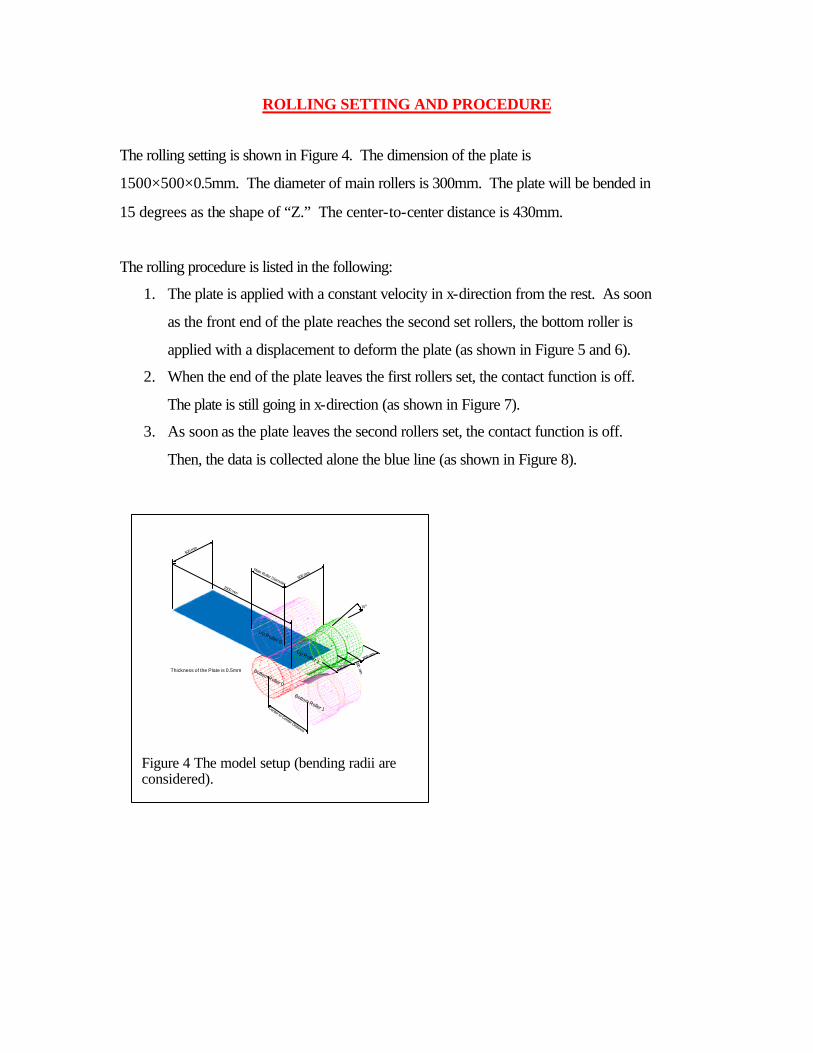
manufactures. The wavy effect is generated on the slope surface (as shown in Figure 3).
The symmetric setting will be used in the roller setup simulation (as shown in Figure 3).
a) bow b) sweep c) twist d) flare e) cross bow
f) wavy edges g) wavy centre h) herringbone effect
Figure 2 Undesirable effects found in cold roll form sections. (Halmos, 1997)
a) Brake Formed b) Roll Formedx
yz
Figure 1 Cross Section Changes in Brake and Roll Formed “V” Section. (Halmos, 1997)
CHARACTERISTICS OF THE MODEL SETTING
1. Rollers are not rotating.
2. Rollers are modeled as rigid.
3. Rollers’ surfaces are perfectly smooth.
4. The model is in a symmetric setting (as shown in Figure 3).
5. There is no rolling vibration considered.
6. Microstructures and mechanical properties of the plate are homogeneous.
7. The plate material is isotropic.
8. Applied displacement of bottom rollers to deform the plate.
9. Apply constant velocity on the plate—each node has a constant velocity in
positive x-direction only.
10. The thickness of plate does not change after rolling deformation.
11. Belytschko-Tsay shell element is used on the plate and rollers. 5 integration
points through the thickness is used on the plate.
Area Prone of Waviness
Female Interlock Male Interlock
Cross-section of the roll formed matal building panel.
Figure 3 Typical cold roll form sections showing lines of symmetry.
ROLLING SETTING AND PROCEDURE
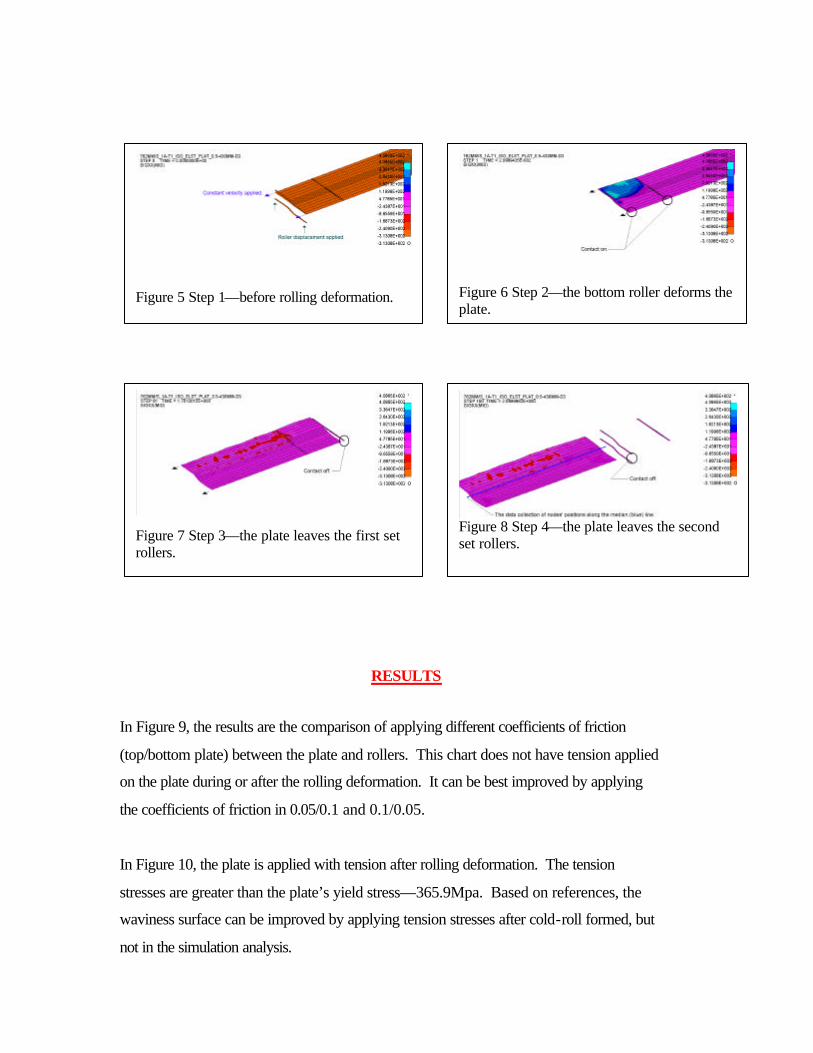
The rolling setting is shown in Figure 4. The dimension of the plate is
1500×500×0.5mm. The diameter of main rollers is 300mm. The plate will be bended in
15 degrees as the shape of “Z.” The center-to-center distance is 430mm.
The rolling procedure is listed in the following:
1. The plate is applied with a constant velocity in x-direction from the rest. As soon
as the front end of the plate reaches the second set rollers, the bottom roller is
applied with a displacement to deform the plate (as shown in Figure 5 and 6).
2. When the end of the plate leaves the first rollers set, the contact function is off.
The plate is still going in x-direction (as shown in Figure 7).
3. As soon as the plate leaves the second rollers set, the contact function is off.
Then, the data is collected alone the blue line (as shown in Figure 8).
Main Roller Diameter
Center to Center Distance
1500 mm
500 mm
15o
500 mm
200 mm
200 mm
100 mmThickness of the Plate is 0.5mm
Up Roller 0
Bottom Roller 0
Up Roller 1
Bottom Roller 1
Figure 4 The model setup (bending radii are considered).
RESULTS
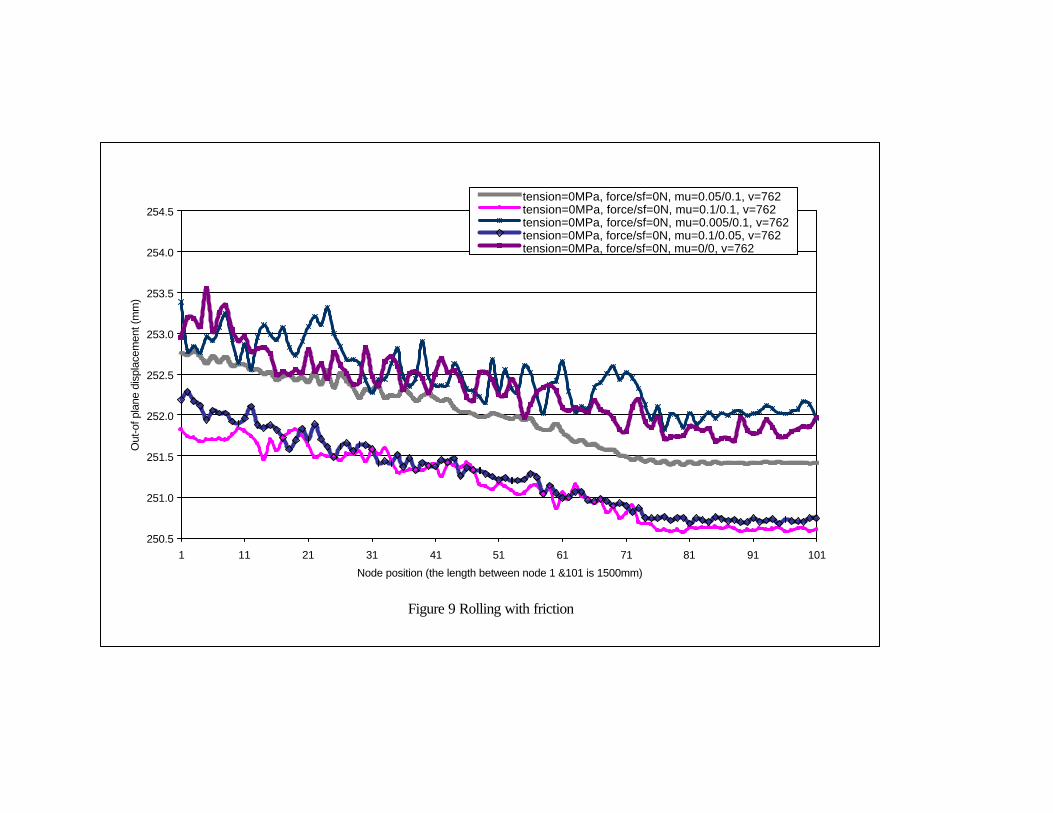
In Figure 9, the results are the comparison of applying different coefficients of friction
(top/bottom plate) between the plate and rollers. This chart does not have tension applied
on the plate during or after the rolling deformation. It can be best improved by applying
the coefficients of friction in 0.05/0.1 and 0.1/0.05.
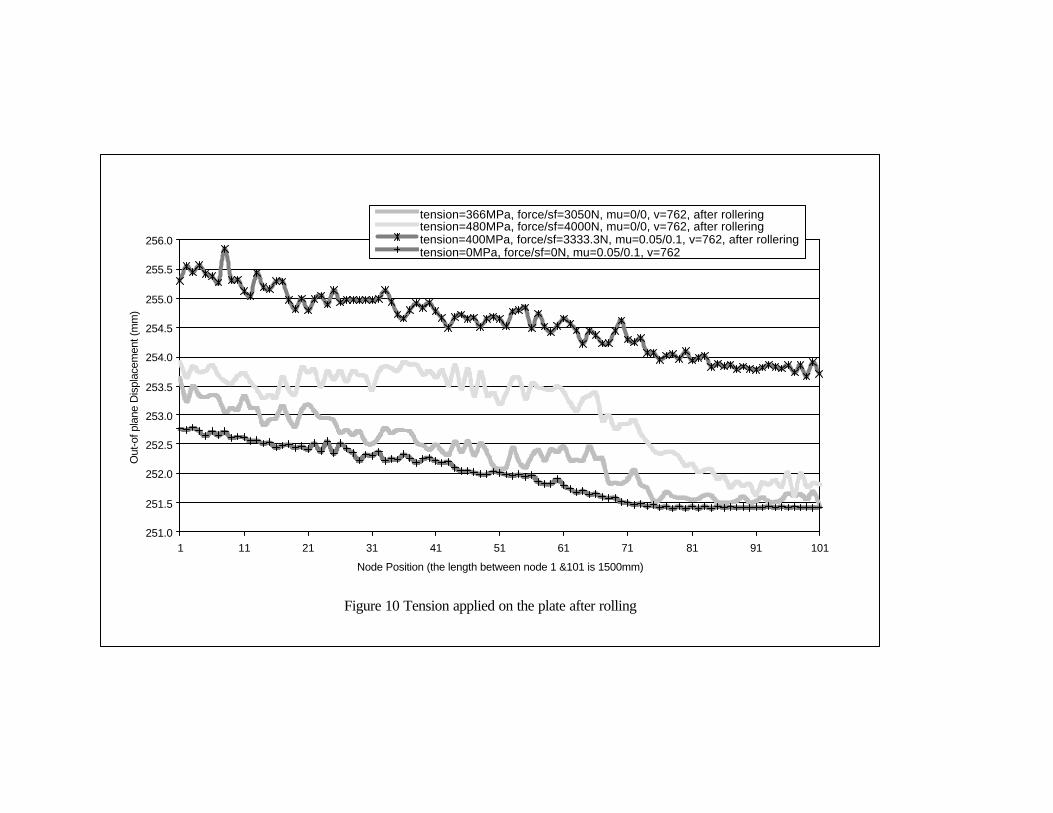
In Figure 10, the plate is applied with tension after rolling deformation. The tension
stresses are greater than the plate’s yield stress—365.9Mpa. Based on references, the
waviness surface can be improved by applying tension stresses after cold-roll formed, but
not in the simulation analysis.
Figure 5 Step 1—before rolling deformation. Figure 6 Step 2—the bottom roller deforms the plate.
Figure 7 Step 3—the plate leaves the first set rollers.
Figure 8 Step 4—the plate leaves the second set rollers.

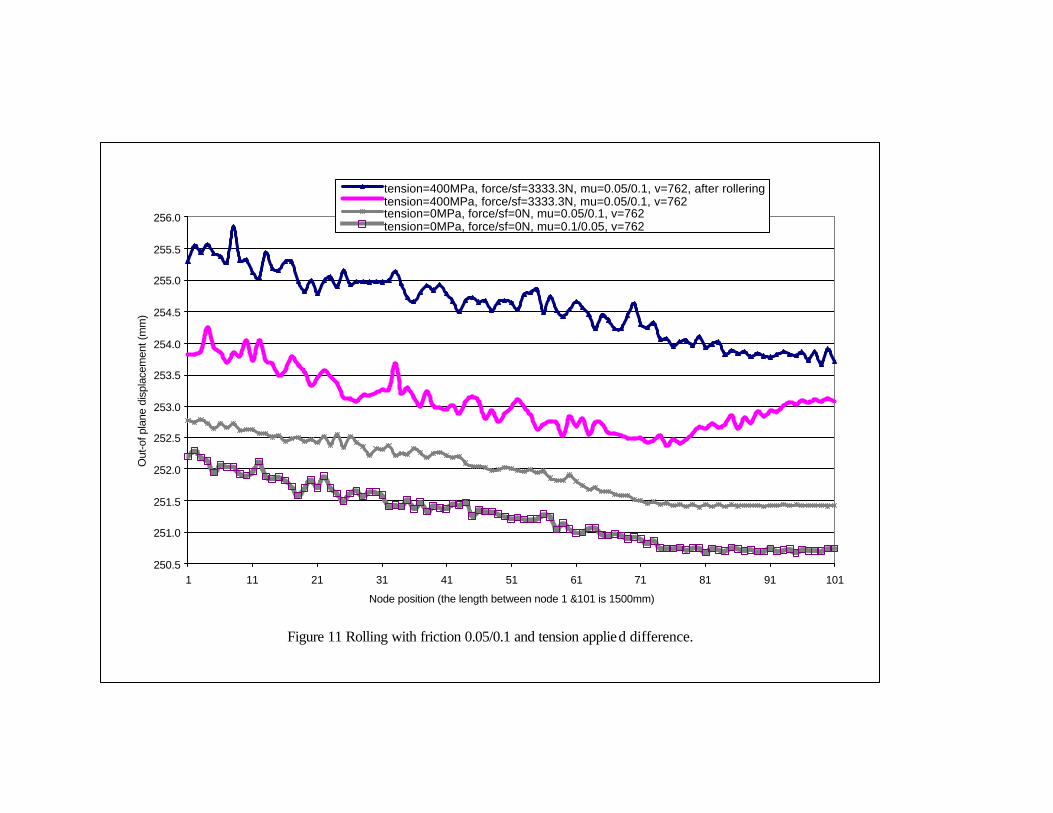
In Figure 11, it is the comparison of the applied tension which is added on the plate
during and after the rolling deformation with the best setting of coefficients of friction—
0.1/0.05 and 0.05/0.1. No any result found in this respect yet, so more investigation is
needed.
250.5
251.0
251.5
252.0
252.5
253.0
253.5
254.0
254.5
1 11 21 31 41 51 61 71 81 91 101Node position (the length between node 1 &101 is 1500mm)
Out
-of p
lane
dis
plac
emen
t (m
m)
tension=0MPa, force/sf=0N, mu=0.05/0.1, v=762tension=0MPa, force/sf=0N, mu=0.1/0.1, v=762tension=0MPa, force/sf=0N, mu=0.005/0.1, v=762tension=0MPa, force/sf=0N, mu=0.1/0.05, v=762tension=0MPa, force/sf=0N, mu=0/0, v=762
Figure 9 Rolling with friction
251.0
251.5
252.0
252.5
253.0
253.5
254.0
254.5
255.0
255.5
256.0
1 11 21 31 41 51 61 71 81 91 101
Node Position (the length between node 1 &101 is 1500mm)
Out
-of p
lane
Dis
plac
emen
t (m
m)
tension=366MPa, force/sf=3050N, mu=0/0, v=762, after rolleringtension=480MPa, force/sf=4000N, mu=0/0, v=762, after rolleringtension=400MPa, force/sf=3333.3N, mu=0.05/0.1, v=762, after rolleringtension=0MPa, force/sf=0N, mu=0.05/0.1, v=762
Figure 10 Tension applied on the plate after rolling
250.5
251.0
251.5
252.0
252.5
253.0
253.5
254.0
254.5
255.0
255.5
256.0
1 11 21 31 41 51 61 71 81 91 101
Node position (the length between node 1 &101 is 1500mm)
Out
-of p
lane
dis
plac
emen
t (m
m)
tension=400MPa, force/sf=3333.3N, mu=0.05/0.1, v=762, after rolleringtension=400MPa, force/sf=3333.3N, mu=0.05/0.1, v=762tension=0MPa, force/sf=0N, mu=0.05/0.1, v=762tension=0MPa, force/sf=0N, mu=0.1/0.05, v=762
Figure 11 Rolling with friction 0.05/0.1 and tension applied difference.
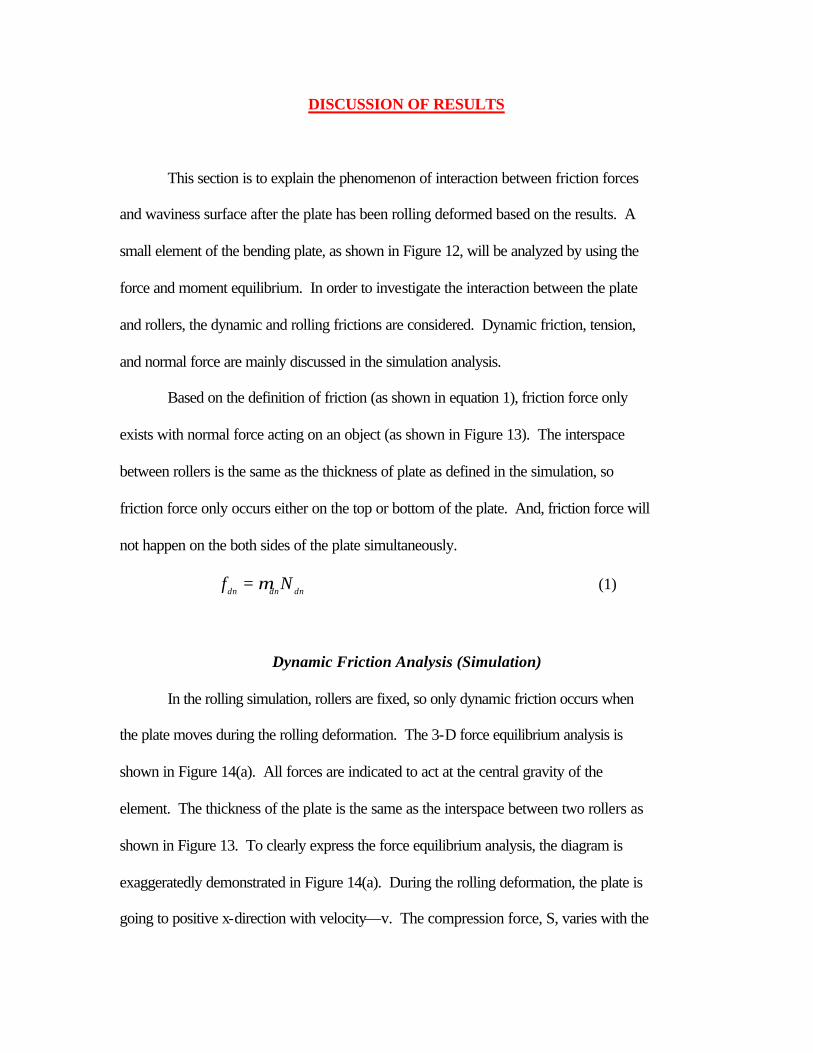
DISCUSSION OF RESULTS
This section is to explain the phenomenon of interaction between friction forces
and waviness surface after the plate has been rolling deformed based on the results. A
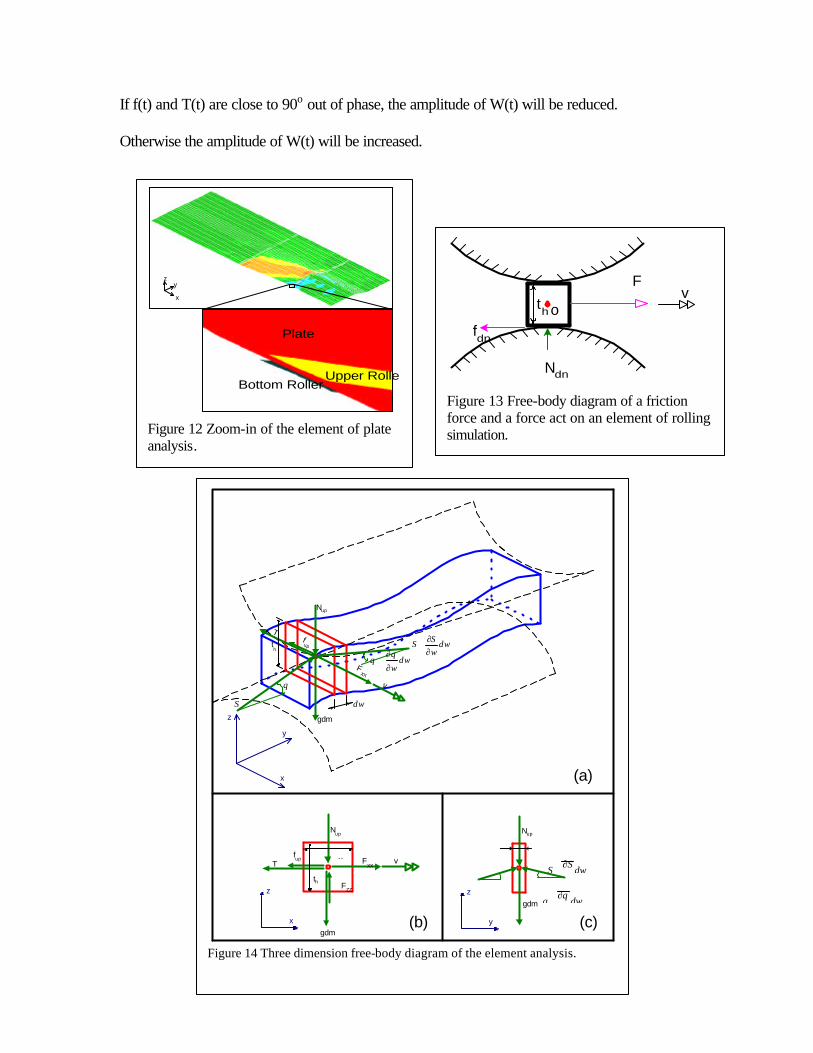
small element of the bending plate, as shown in Figure 12, will be analyzed by using the
force and moment equilibrium. In order to investigate the interaction between the plate
and rollers, the dynamic and rolling frictions are considered. Dynamic friction, tension,
and normal force are mainly discussed in the simulation analysis.
Based on the definition of friction (as shown in equation 1), friction force only
exists with normal force acting on an object (as shown in Figure 13). The interspace
between rollers is the same as the thickness of plate as defined in the simulation, so
friction force only occurs either on the top or bottom of the plate. And, friction force will
not happen on the both sides of the plate simultaneously.
dndndnNf µ= (1)
Dynamic Friction Analysis (Simulation)
In the rolling simulation, rollers are fixed, so only dynamic friction occurs when
the plate moves during the rolling deformation. The 3-D force equilibrium analysis is
shown in Figure 14(a). All forces are indicated to act at the central gravity of the
element. The thickness of the plate is the same as the interspace between two rollers as
shown in Figure 13. To clearly express the force equilibrium analysis, the diagram is
exaggeratedly demonstrated in Figure 14(a). During the rolling deformation, the plate is
going to positive x-direction with velocity—v. The compression force, S, varies with the
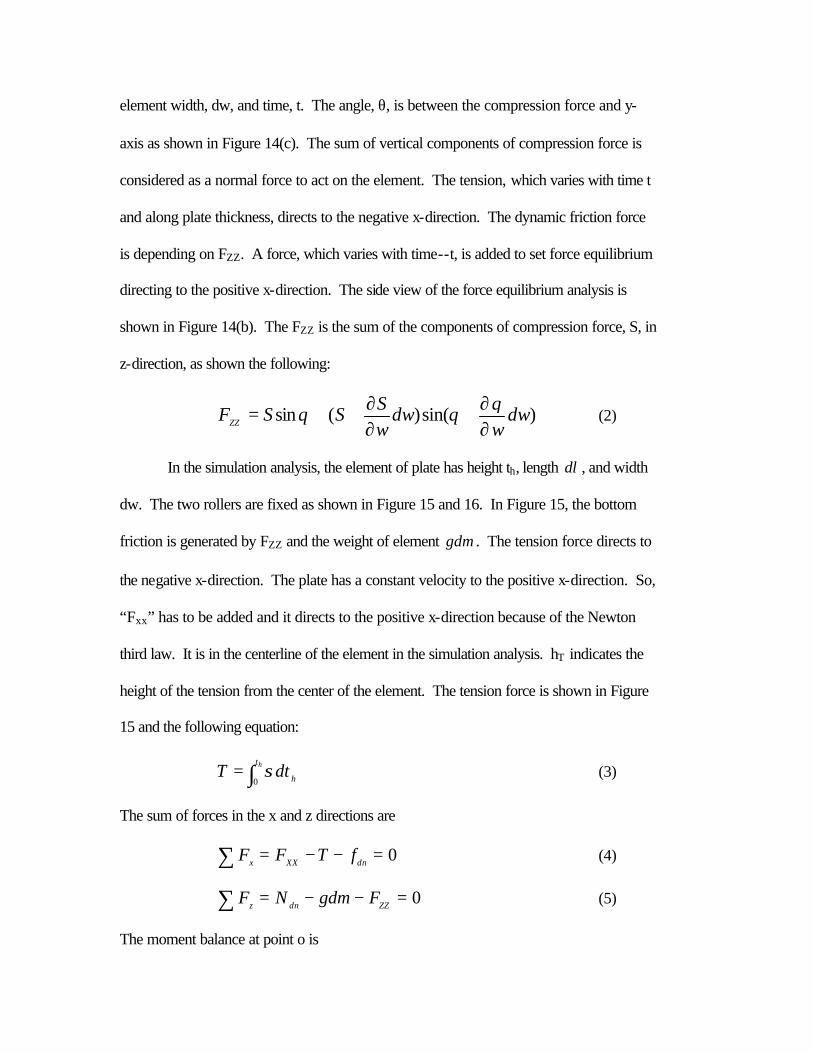
element width, dw, and time, t. The angle, θ, is between the compression force and y-
axis as shown in Figure 14(c). The sum of vertical components of compression force is
considered as a normal force to act on the element. The tension, which varies with time t
and along plate thickness, directs to the negative x-direction. The dynamic friction force
is depending on FZZ. A force, which varies with time--t, is added to set force equilibrium
directing to the positive x-direction. The side view of the force equilibrium analysis is
shown in Figure 14(b). The FZZ is the sum of the components of compression force, S, in
z-direction, as shown the following:
)sin()(sin dww
dwwS
SSFZZ ∂
∂+∂∂++= θθθ (2)
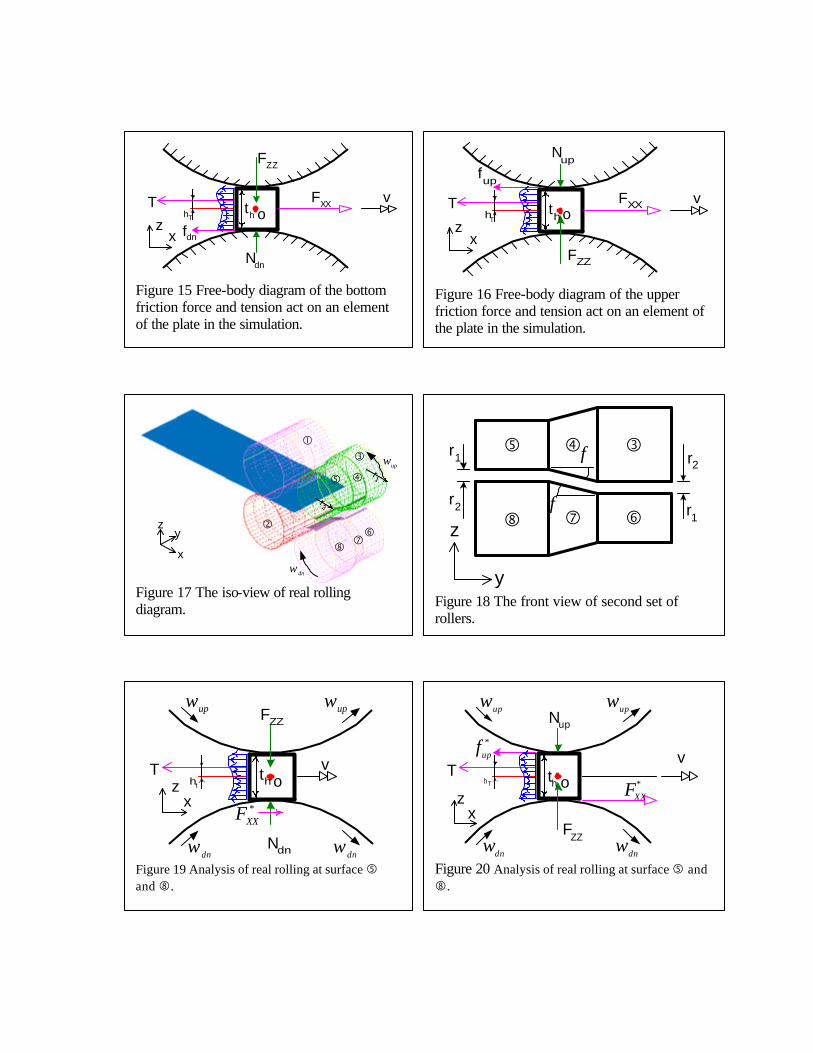
In the simulation analysis, the element of plate has height th, length dl , and width
dw. The two rollers are fixed as shown in Figure 15 and 16. In Figure 15, the bottom
friction is generated by FZZ and the weight of element gdm . The tension force directs to
the negative x-direction. The plate has a constant velocity to the positive x-direction. So,
“Fxx” has to be added and it directs to the positive x-direction because of the Newton
third law. It is in the centerline of the element in the simulation analysis. hT indicates the
height of the tension from the center of the element. The tension force is shown in Figure
15 and the following equation:
∫= ht
hdtT
0σ (3)
The sum of forces in the x and z directions are
0=−−=∑ dnXXxfTFF (4)
0=−−=∑ ZZdnzFgdmNF (5)
The moment balance at point o is
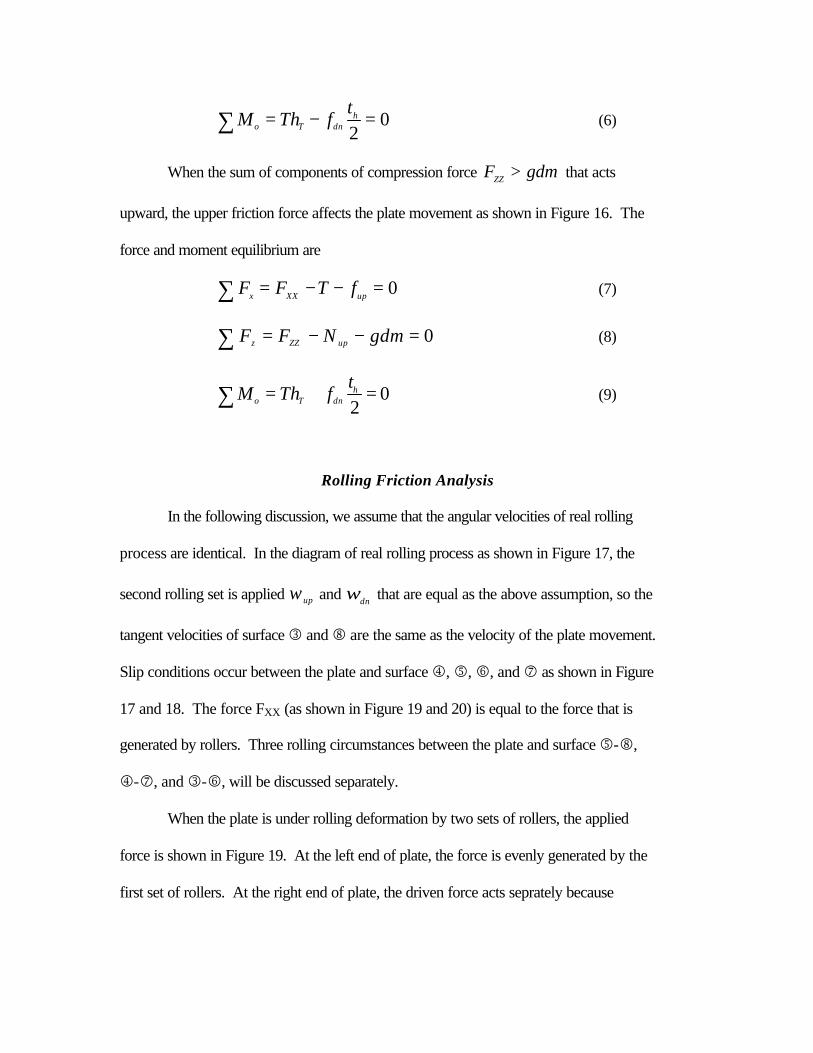
02
=−=∑ hdnTo
tfThM (6)
When the sum of components of compression force gdmFZZ
> that acts
upward, the upper friction force affects the plate movement as shown in Figure 16. The
force and moment equilibrium are
0=−−=∑ upXXxfTFF (7)
0=−−=∑ gdmNFF upZZz (8)
02
=+=∑ hdnTo
tfThM (9)
Rolling Friction Analysis
In the following discussion, we assume that the angular velocities of real rolling
process are identical. In the diagram of real rolling process as shown in Figure 17, the
second rolling set is applied upω and dn
ω that are equal as the above assumption, so the
tangent velocities of surface 3 and 8 are the same as the velocity of the plate movement.
Slip conditions occur between the plate and surface 4, 5, 6, and 7 as shown in Figure
17 and 18. The force FXX (as shown in Figure 19 and 20) is equal to the force that is
generated by rollers. Three rolling circumstances between the plate and surface 5-8,
4-7, and 3-6, will be discussed separately.
When the plate is under rolling deformation by two sets of rollers, the applied
force is shown in Figure 19. At the left end of plate, the force is evenly generated by the
first set of rollers. At the right end of plate, the driven force acts seprately because
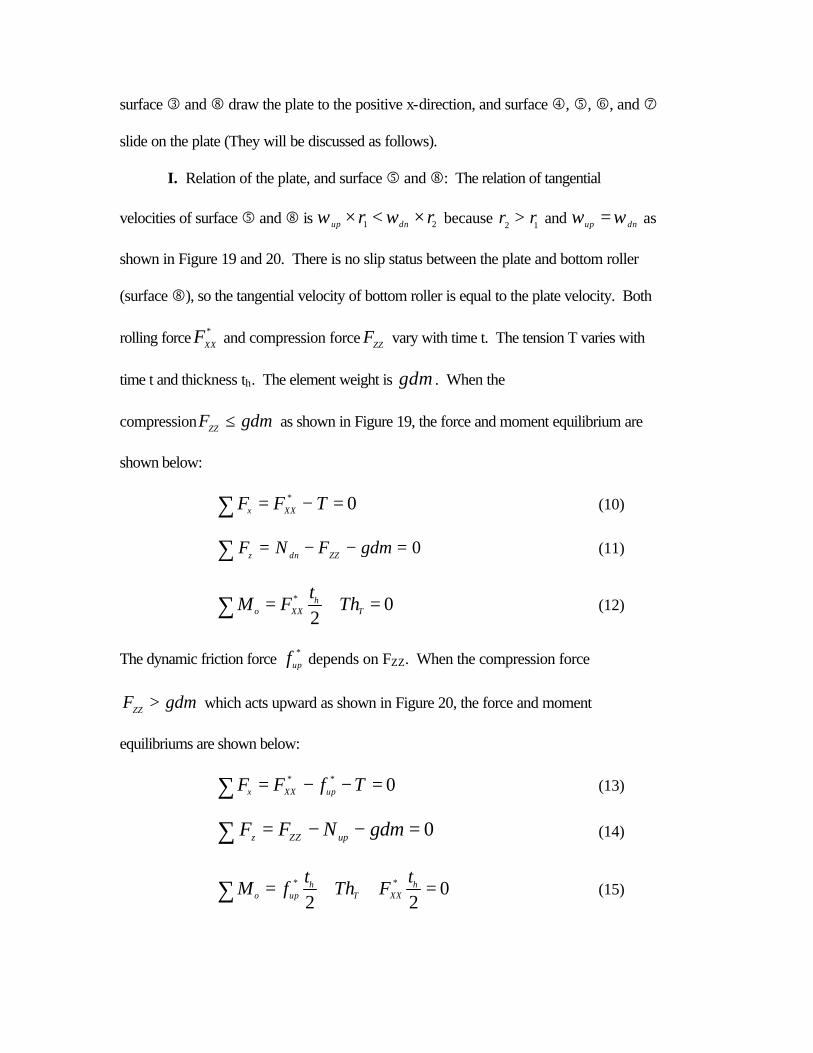
surface 3 and 8 draw the plate to the positive x-direction, and surface 4, 5, 6, and 7
slide on the plate (They will be discussed as follows).
I. Relation of the plate, and surface 5 and 8: The relation of tangential
velocities of surface 5 and 8 is 21 rr dnup ×<× ωω because 12 rr > and dnup ωω = as
shown in Figure 19 and 20. There is no slip status between the plate and bottom roller
(surface 8), so the tangential velocity of bottom roller is equal to the plate velocity. Both
rolling force *
XXF and compression force
ZZF vary with time t. The tension T varies with
time t and thickness th. The element weight is gdm . When the
compression gdmFZZ
≤ as shown in Figure 19, the force and moment equilibrium are
shown below:
0* =−=∑ TFF XXx (10)
0=−−=∑ gdmFNFZZdnz
(11)
02
* =+=∑ Th
XXo Tht
FM (12)
The dynamic friction force *
upf depends on FZZ. When the compression force
gdmFZZ
> which acts upward as shown in Figure 20, the force and moment
equilibriums are shown below:
0** =−−=∑ TfFF upXXx (13)
0=−−=∑ gdmNFF upZZz (14)
022
** =++=∑ hXXT
hupo
tFTh
tfM (15)
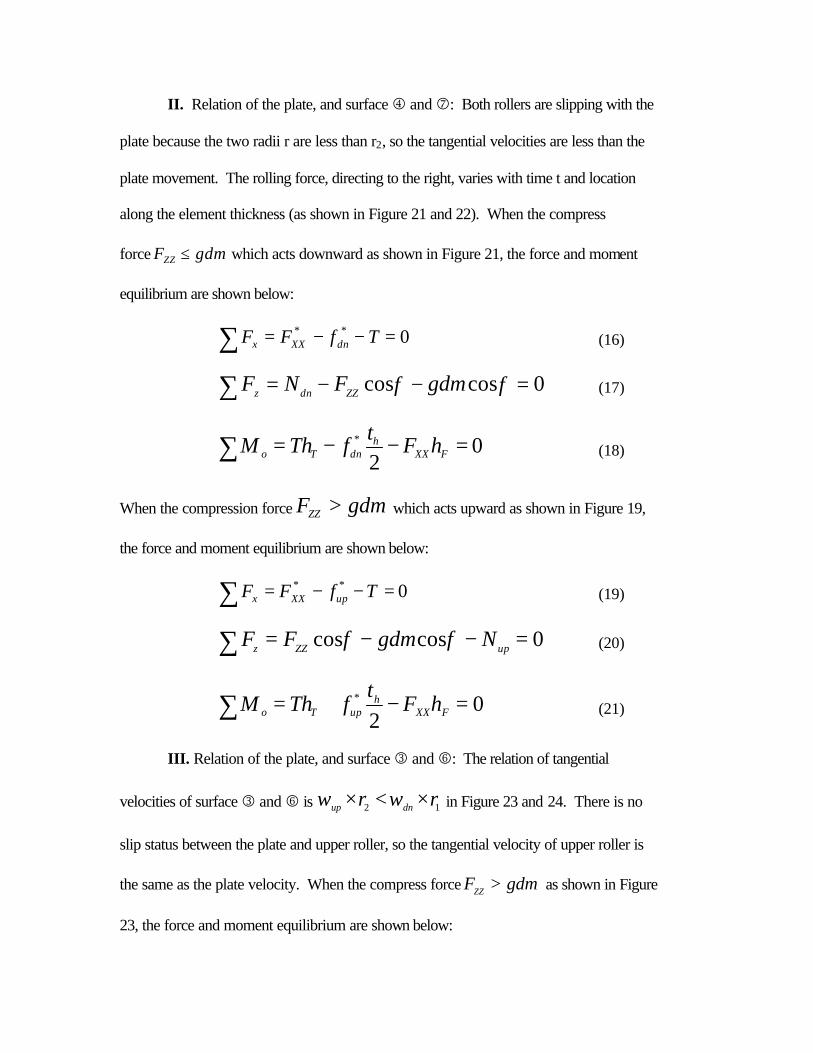
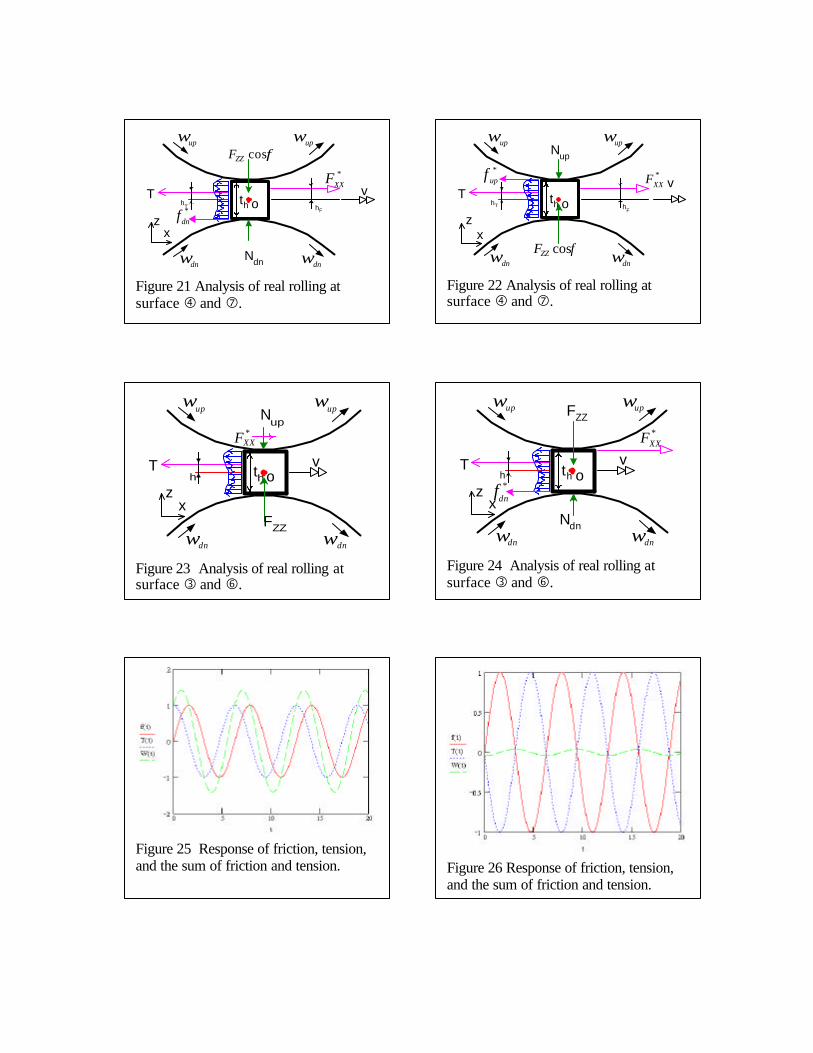
II. Relation of the plate, and surface 4 and 7: Both rollers are slipping with the
plate because the two radii r are less than r2, so the tangential velocities are less than the
plate movement. The rolling force, directing to the right, varies with time t and location
along the element thickness (as shown in Figure 21 and 22). When the compress
force gdmFZZ ≤ which acts downward as shown in Figure 21, the force and moment
equilibrium are shown below:
0** =−−=∑ TfFF dnXXx (16)
0coscos =−−=∑ φφ gdmFNF ZZdnz (17)
02
* =−−=∑ FXXh
dnTo hFt
fThM (18)
When the compression force gdmFZZ > which acts upward as shown in Figure 19,
the force and moment equilibrium are shown below:
0** =−−=∑ TfFF upXXx (19)
0coscos =−−=∑ upZZz NgdmFF φφ (20)
02
* =−+=∑ FXXh
upTo hFt
fThM (21)
III. Relation of the plate, and surface 3 and 6: The relation of tangential
velocities of surface 3 and 6 is 12 rr dnup ×<× ωω in Figure 23 and 24. There is no
slip status between the plate and upper roller, so the tangential velocity of upper roller is
the same as the plate velocity. When the compress force gdmFZZ
> as shown in Figure
23, the force and moment equilibrium are shown below:
0* =−=∑ TFF XXx (22)
0=−−=∑ gdmNFF upZZz (23)
02
* =−=∑ hXXTo
tFThM (24)
When the compression force gdmFZZ
≤ which acts downward as shown in Figure 24,
the force and moment equilibrium are shown below:
0** =−−=∑ TfFF dnXXx (25)
0=−−=∑ gdmFNFZZdnz
(26)
022
* =−−=∑ hXX
hdnTo
tF
tfThM (27)
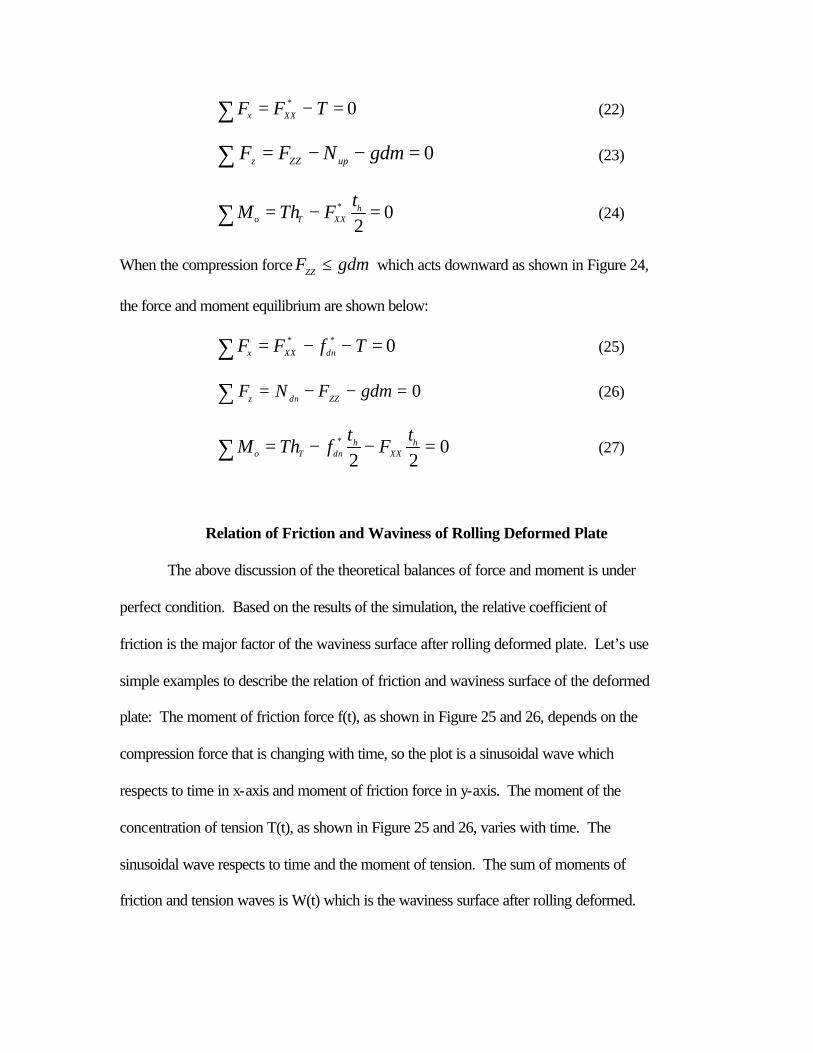
Relation of Friction and Waviness of Rolling Deformed Plate
The above discussion of the theoretical balances of force and moment is under
perfect condition. Based on the results of the simulation, the relative coefficient of
friction is the major factor of the waviness surface after rolling deformed plate. Let’s use
simple examples to describe the relation of friction and waviness surface of the deformed
plate: The moment of friction force f(t), as shown in Figure 25 and 26, depends on the
compression force that is changing with time, so the plot is a sinusoidal wave which
respects to time in x-axis and moment of friction force in y-axis. The moment of the
concentration of tension T(t), as shown in Figure 25 and 26, varies with time. The
sinusoidal wave respects to time and the moment of tension. The sum of moments of
friction and tension waves is W(t) which is the waviness surface after rolling deformed.
If f(t) and T(t) are close to 90o out of phase, the amplitude of W(t) will be reduced.
Otherwise the amplitude of W(t) will be increased.
Upper RollerBottom Roller
Plate
x
yz
Figure 12 Zoom-in of the element of plate analysis.
Ndn
vF
fdn
oth
Figure 13 Free-body diagram of a friction force and a force act on an element of rolling simulation.
x
y
z
Nup
fup
T
FXX
v
gdm
Nup
gdm
FZZ
Nup
fupT F
XXv
gdmx
z z
y
(a)
(b) (c)
dww
SS
∂∂+
dww∂
∂+ θθ
θ
S dw
th
dww
SS
∂∂+
θ
S
dw
th
dl
dww∂
∂+
θθ
Figure 14 Three dimension free-body diagram of the element analysis.
upω
dnω
r1
r2
�
�
�
� �
� � � x
yz
Figure 17 The iso-view of real rolling diagram.
Ndn
FZZ
vFXX
fdn
TothhT
xz
Figure 15 Free-body diagram of the bottom friction force and tension act on an element of the plate in the simulation.
Nup
FZZ
vFXX
fup
TothhT
xz
Figure 16 Free-body diagram of the upper friction force and tension act on an element of the plate in the simulation.
r2
r2
r1
r1
� � �
� � �
y
φ
φz
Figure 18 The front view of second set of rollers.
Ndn
vT
upω upω
dnω
dnω
oth
FZZ
ht
xz
*XXF
Figure 19 Analysis of real rolling at surface � and �.
th
Nup
vT
upω
upω
dnω
dnω
*
upf
ohT
FZZ
xz
*
XXF
Figure 20 Analysis of real rolling at surface � and �.
th
Ndn
vT
upω upω
dnω dnω
*dnf
ohT hF
*XXF
xz
φcosZZF
Figure 21 Analysis of real rolling at surface � and �.
th
Nup
vT
upω upω
dnω dnω
*upf
ohT hF
xz
*XXF
φcosZZF
Figure 22 Analysis of real rolling at surface � and �.
Nup
vT
upω
upω
dnω dnω
*XXF
oh th
xz
FZZ
Figure 23 Analysis of real rolling at surface � and �.
Ndn
vT
upω upω
dnω dnω
*XXF
oh th*
dnf
xz
FZZ
Figure 24 Analysis of real rolling at surface � and �.
Figure 25 Response of friction, tension, and the sum of friction and tension.
Figure 26 Response of friction, tension, and the sum of friction and tension.
CONCLUSION & FUTURE WORK
As references have shown, the applied tension will improve the waviness of the plate
surface, however, it is not so in the findings of my simulation. This means that more
investigation into this aspect is needed. Moreover, the measurements of the ratios of
coefficient friction needs to be done.
For future work, springback and bending radii measurements need to be considered as
well. Based on the discussion of results, solid element should be applied on the plate and
the rollers should be set rotating for more advanced analysis.
REFERENCE Altan, T., Gegel, H. L., & Oh, S. I. (1983). Metal Forming: Fundamentals and Applications. Metals Park, OH: Carnes Publication Services, Inc. Altan, T., Kobayashi, S., & Oh, S. I. (1989). Metal Forming and the Finite-Element Method. New York, NY: Oxford University Press. Bauld, N.R. (1986). Mechanics of Materials. Boston, MA: PWS Publishers. P632. Baxter, H. L. & Betts, W. H. (1990). Rolls Used in Today’s Rolling Mills-- Rolls for the Metalworking Industries. A Publication of the Iron and Steel Society, Inc.: Warrendale, PA. (p23-p30) Caddell, R. M. & Hosfort, W. F. (1993). Metal Forming Mechanics and Metallurgy. Englewood Cliff, NJ: Prentice-Hall, Inc. Chaudhry, S., Wang, S.P., & Wertheimer, T.B. Comparison between the static implicit and dynamic explicit methods for FEM simulation of sheet forming processes. http://www.marc.com. Chen, W. & Saleeb, A. F. (1994). Constitutive Equations for Engineering Materials (Volume 1). New York, NY: Elsevier Science B.V. (p150-p157) Dobrev, A. & Halmos, G. T. Roll Design. Charlotte, NC: FMA’s Roll Forming Conference 1997. Dong, C. (1998). Deformation Mechanics in Cold-Roll-Formed Wide Profiles. M. S. Project. University of Pittsburgh. Donmez, O. E. (1997). Inelastic Deformation of Metals Using Finite Element Method. M. S. Project. University of Pittsburgh.
Dowing, N. E. (1993). Mechanical Behavior of Materials. Upper Saddle River, New Jersey: Prentice-Hall, Inc. (p148-p150) Eibe, W. W. (1990). History of the Development of Rolling Mills and Their Rolls—Rolls for the Metalworking Industries. A Publication of the Iron and Steel Society, Inc.: Warrendale, PA. (p1-p22) Halmos, G. T. (1997). Roll Forming HSLA Steels. Charlotte, NC: FMA’s Roll Forming Conference 1997. Halmos, G. T. (1997). Roll Forming to Tight Tolerances. Charlotte, NC: FMA’s Roll Forming Conference 1997. Halmos, G. T. (1997). Selecting the Right Material for Roll Forming and Brake Forming. Charlotte, NC: FMA’s Roll Forming Conference 1997. Hira, T., Abe, H. & Nakagawa, K. (1979). Effect of the Mechanical Properties of Steel Sheet on Web-Buckling Behavior in the Cold Roll-Forming of Sliding Board. Journal of the Japanese Society of Technology and Plasticity, Vol. 20, No. 225 pp. 933-939. Miyamato, Y. & Hawa, S. (1991). Effect of Tensile Flow Properties of Titanium Sheets on web-Buckling Behavior in Cold Roll-Forming of Wide Profiles. ISIJ International, Vol. 31 No. 8, pp. 863-869. Ona, H. & Jimma, T. (1994). Prevention of Shape Defects in the Cold-Roll Forming Process of Wide Profiles. Bulletin of Precision Machinery and Electronics, Tokyo Institute of Technology, No. 53, pp. 1-13. Roberts, W. L. (1978). Cold Rolling of Steel. New York, NY: Marcel Dekker, Inc. Taylor, R. L. & Zienkiewicz, O. C. (1988). The Finite Element Method (4th ed). Lodon, UK: McGraw-Hill Book Company. Roberts, W. L. (1990). The Rolling Process Mechanical Engineering Explanation— Rolls for the Metalworking Industries. A Publication of the Iron and Steel Society, Inc.: Warrendale, PA. (p31-p54) Schuler GmbH (1998). Metal Forming Handbook. Berling, Germany: Springer-Verlag. (p373-p388) Wang, C. T. (1993). Mechanics of Bending, Flanging, and Deep Drawing and a Computer-Aided Modeling System for Predictions of Strain, Fracture, Wrinkling and Springback in Sheet Metal Forming. Ph.D Dissertation. Ohio State University. Wu, H. C. (1999). Analytical and Numerical Investigation of Sheet Metal Bending, Flanging and Hemming. M.S. Thesis. Ohio State University.