Embed Size (px)
Citation preview
1
SIMULATION OF CELL GROWTH
IN HIGH-PRESSURE FOAM INJECTION MOLDING
Chongda Wang1, Vahid Shaayegan
1, Sejin Han
2, Franco Costa
3, Chul B. Park
1
1 - Microcellular Plastics Manufacturing Laboratory, Department of Mechanical and Industrial
Engineering, University of Toronto, 5 King’s College Road, Toronto, Ontario, Canada M5S 3G8
2 - Autodesk, Inc. 2353 North Triphammer Road, Ithaca, NY 14850, USA
3 - Autodesk, Inc. 259-261 Colchester Rd., Kilsyth, VIC. 3137, Australia
Abstract
In this work, the prediction of final cell size of high-
pressure foam injection molded parts has been attempted.
An in-situ visualization technique was used to capture
real-time cell growth data from high-pressure foam
injection molding experiments conducted with PS and
CO2. The simulated cell growth profile was compared
with experimental measurements. For the PS/CO2 system,
quantitative agreement (over 80%) between predicted and
measured growth profile were achieved. With the
validated simulation, the effect of cooling history on final
cell size and cell size distribution was investigated. It is
shown that in high-pressure foam injection during which
all the gate nucleated cells are dissolved, final
morphology is characterized by having large cells in the
center and smaller cells near the skin.
Introduction
Parts produced by foam injection molding (FIM) are
utilized in many industries such as automotive,
construction, aerospace, sports and etc. Light-weighting,
geometry accuracy, short production cycles and other
countless advantages bring FIM a substantial amount of
attention from industry and academia. In spite of its
flourish, FIM has been recognized as a highly complex
unsteady process due to its cyclically interrupted
plasticization and gas mixing, and the number of variables
involved yet have to be controlled. As a result, when it
comes to the designing of a suitable foam morphology
tailored a specific application, engineers have to go
through a large number of painstaking experiments and
optimization to reach the desired morphology. Such
iterative process is not only time, labor, and material
consuming, but also inevitably increases production costs
and more importantly protract time to market (TTM). One
of the solutions is computer simulation and prediction.
Bubble growth modeling has been studied by a
number of researchers [1-9]. Amon and Denson
introduced the Cell Model which describes the growth of
closely spaced bubbles with limited gas concentration [1].
They assumed that each cell is surrounded by a thin shell
of Newtonian fluid with limited gas concentration only
from which the bubble can absorb gas molecules.
Afremanesh and Advani adopted the cell model and more
importantly took the viscoelasticity of the shell into
account [2]. The viscoelastic fluid was represented by the
quasi-linear, upper-convected Maxwell model. Moreover,
they compared the growth results obtained by finding the
concentration gradient via explicitly solving advection-
diffusion partial derivative equation (PDE) against finding
it using a fitted polynomial concentration profile.
Consequently, they concluded it is necessary to solve the
diffusion PDE with proper boundary conditions. Ramesh
et al. applied the cell model in the simulation of batch
foaming [3]. They compared the difference in predicting
growth profile using between Power-law based model
(Newtonian fluid) and Maxwell based model (viscoelastic
fluid). Without an in-situ visualization batch foaming
chamber, they quenched their sample in liquid nitrogen at
different timings of bubble growth and performed SEM
on the fractured surface. Their results showed that growth
equations derived with viscoelastic model offer more
accuracy in predicting final bubble size when compared
with a pure Newtonian model. Leung and et al. also
simulated the bubble growth in batch foaming process [4].
Using the Maxwell viscoelastic solution and solving the
diffusion equation, more importantly, incorporating
Sanchez-Lacombe equation of state (SL-EOS), they were
able to not only accurately predict the growth profile but
also that of bubbles nucleated at different timings.
Amon and Denson also attempted to simulate the
bubble growth in low-pressure FIM (LP-FIM) with the
help of a visualized cavity [5]. They obtained good
qualitative agreement between experimental and model-
predicted results, but quantitative discrepancies were
shown between them. They believed that the negligence
of melt elasticity and bubble coalescence in low-pressure
FIM (LP-FIM) were the main contributions to the
discrepancy. Moreover, due to hardware limitations, they
were unable to obtain real-time growth data. Afremanesh
et al. also simulated bubble growth in a highly viscous
solution in LP-FIM, furthermore, they considered the
pressure variations at the different thickness of the mold
cavity [6]. They reported growth profile and foam density
in normalized dimensionless form. They demonstrated
larger bubble size in the melt front and smaller bubbles
SPE ANTEC® Anaheim 2017 / 2525
2
near the gate which is consistent with experimental
findings in other literature. Han et al. employed the cell
model and described the viscosity of the solution with
modified Cross-WLF equation [7]. Even though they
assumed second-order polynomial concentration profile,
they were able to predict the cell size distribution along
the thickness of the cavity.
All these works have significantly contributed to the
understanding of bubble growth phenomena in different
foaming process. Nonetheless, most of the FIM bubble
growth simulations either were not validated with
experimental data or neglected the melt elasticity. In this
work, a bubble growth simulation in HP-FIM was
performed based on the Cell Model using transient
pressure and temperature data, material properties that
vary with temperature, pressure, and gas concentration.
More importantly, the simulation of cell growth is
validated by conducting visualized HP-FIM experiments.
Theory
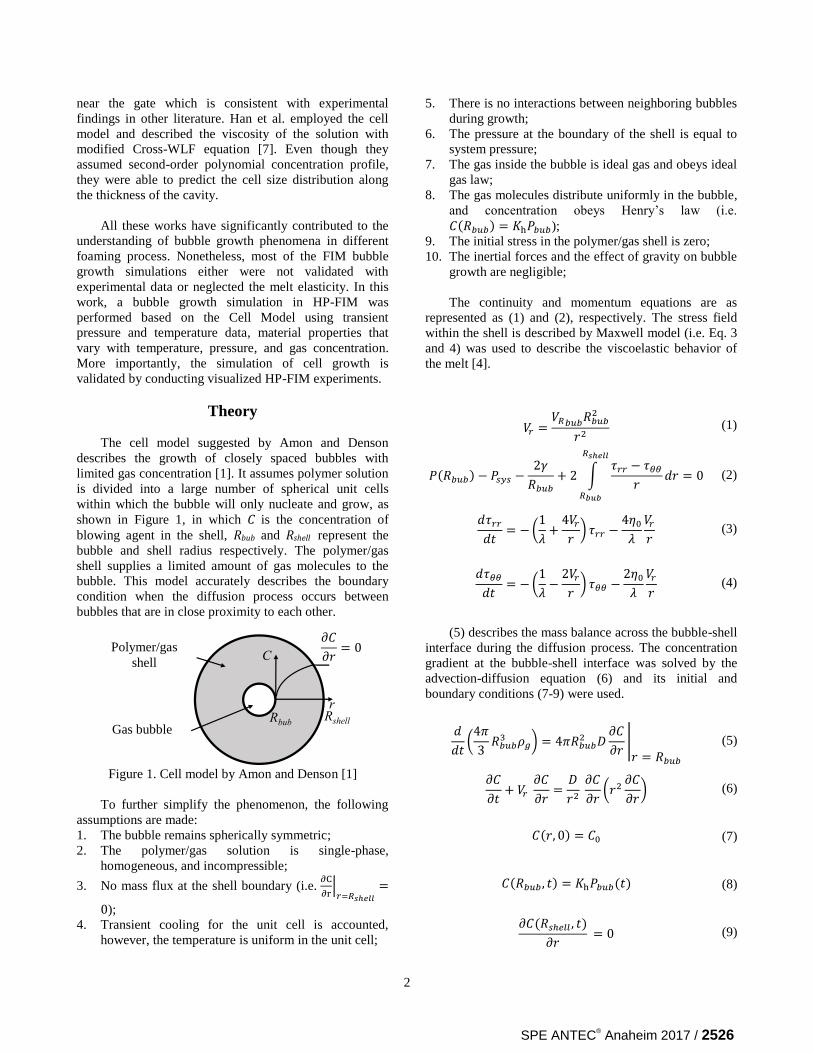
The cell model suggested by Amon and Denson
describes the growth of closely spaced bubbles with
limited gas concentration [1]. It assumes polymer solution
is divided into a large number of spherical unit cells
within which the bubble will only nucleate and grow, as
shown in Figure 1, in which C is the concentration of
blowing agent in the shell, Rbub and Rshell represent the
bubble and shell radius respectively. The polymer/gas
shell supplies a limited amount of gas molecules to the
bubble. This model accurately describes the boundary
condition when the diffusion process occurs between
bubbles that are in close proximity to each other.
Figure 1. Cell model by Amon and Denson [1]
To further simplify the phenomenon, the following
assumptions are made:
1. The bubble remains spherically symmetric;
2. The polymer/gas solution is single-phase,
homogeneous, and incompressible;
3. No mass flux at the shell boundary (i.e.
|
);
4. Transient cooling for the unit cell is accounted,
however, the temperature is uniform in the unit cell;
5. There is no interactions between neighboring bubbles
during growth;
6. The pressure at the boundary of the shell is equal to
system pressure;
7. The gas inside the bubble is ideal gas and obeys ideal
gas law;
8. The gas molecules distribute uniformly in the bubble,
and concentration obeys Henry’s law (i.e. ( ) );
9. The initial stress in the polymer/gas shell is zero;
10. The inertial forces and the effect of gravity on bubble
growth are negligible;
The continuity and momentum equations are as
represented as (1) and (2), respectively. The stress field
within the shell is described by Maxwell model (i.e. Eq. 3
and 4) was used to describe the viscoelastic behavior of
the melt [4].
(1)
( )
∫
(2)
(
)
(3)
(
)
(4)
(5) describes the mass balance across the bubble-shell
interface during the diffusion process. The concentration
gradient at the bubble-shell interface was solved by the
advection-diffusion equation (6) and its initial and
boundary conditions (7-9) were used.
(
)
|
(5)
(
) (6)
( ) (7)
( ) ( ) (8)
( )
(9)
r
C
Rbub Rshell
Polymer/gas
mixture shell
Gas bubble
𝜕𝐶
𝜕𝑟 Polymer/gas
shell
Gas bubble
SPE ANTEC® Anaheim 2017 / 2526
3
The models of material properties were adopted from
[4, 13-15] for surface tension, diffusion coefficient,
relaxation time, and zero-shear viscosity, respectively.
(1-9) constitute the mathematical description of the
bubble growth based on cell model. The system of the
governing equations is nonlinear and coupled [8, 9].
Therefore, the equations were solved by explicit finite
difference and 4th
order Runge-Kutta method in
accordance with [4].
Experimental
A 50-ton Arburg ALLROUNDER 270/320C
injection molding machine, equipped with Trexel Mucell
technology, was used to carry out HP-FIM experiments.
Moreover, the fix mold platen is a visualization mold that
consists of a prism, three fused silica windows. Imaging
equipment includes a CV M10 camera from JAI,
equipped with a Navitar magnifying lens. A detailed
description of the visualization setup can be found in [10].
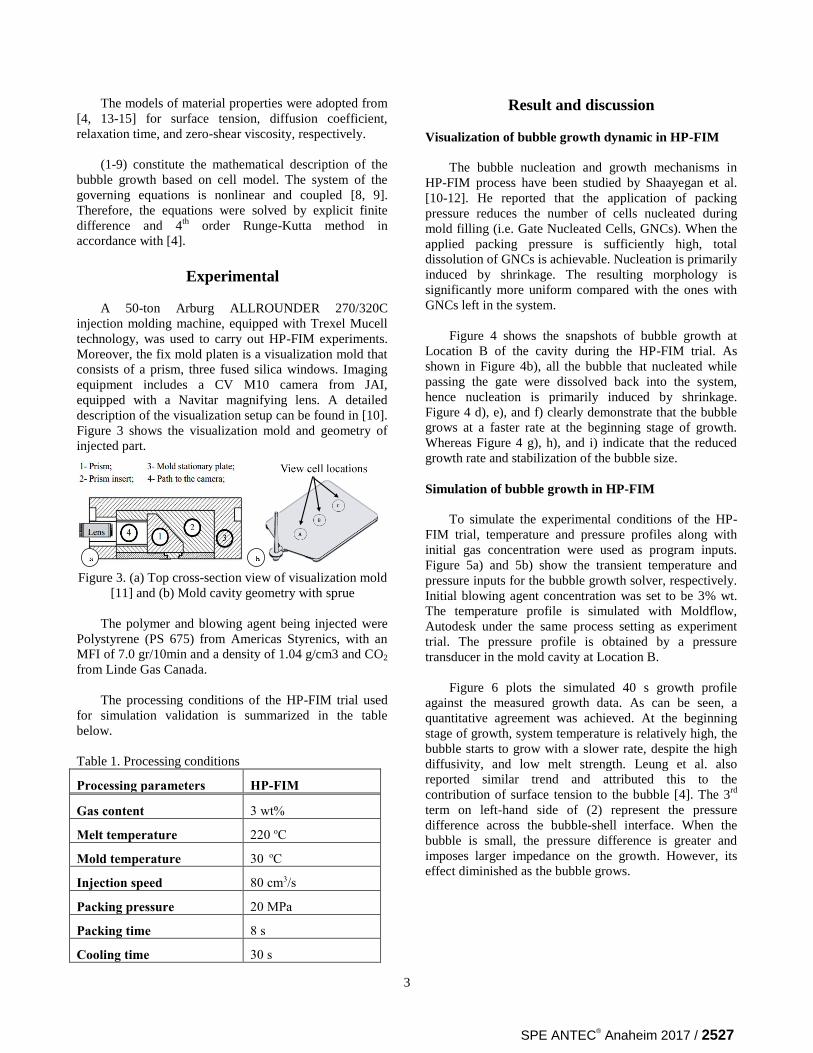
Figure 3 shows the visualization mold and geometry of
injected part.
Figure 3. (a) Top cross-section view of visualization mold
[11] and (b) Mold cavity geometry with sprue
The polymer and blowing agent being injected were
Polystyrene (PS 675) from Americas Styrenics, with an
MFI of 7.0 gr/10min and a density of 1.04 g/cm3 and CO2
from Linde Gas Canada.
The processing conditions of the HP-FIM trial used
for simulation validation is summarized in the table
below.
Table 1. Processing conditions
Processing parameters HP-FIM
Gas content 3 wt%
Melt temperature 220 oC
Mold temperature 30 oC
Injection speed 80 cm3/s
Packing pressure 20 MPa
Packing time 8 s
Cooling time 30 s
Result and discussion
Visualization of bubble growth dynamic in HP-FIM
The bubble nucleation and growth mechanisms in
HP-FIM process have been studied by Shaayegan et al.
[10-12]. He reported that the application of packing
pressure reduces the number of cells nucleated during
mold filling (i.e. Gate Nucleated Cells, GNCs). When the
applied packing pressure is sufficiently high, total
dissolution of GNCs is achievable. Nucleation is primarily
induced by shrinkage. The resulting morphology is
significantly more uniform compared with the ones with
GNCs left in the system.
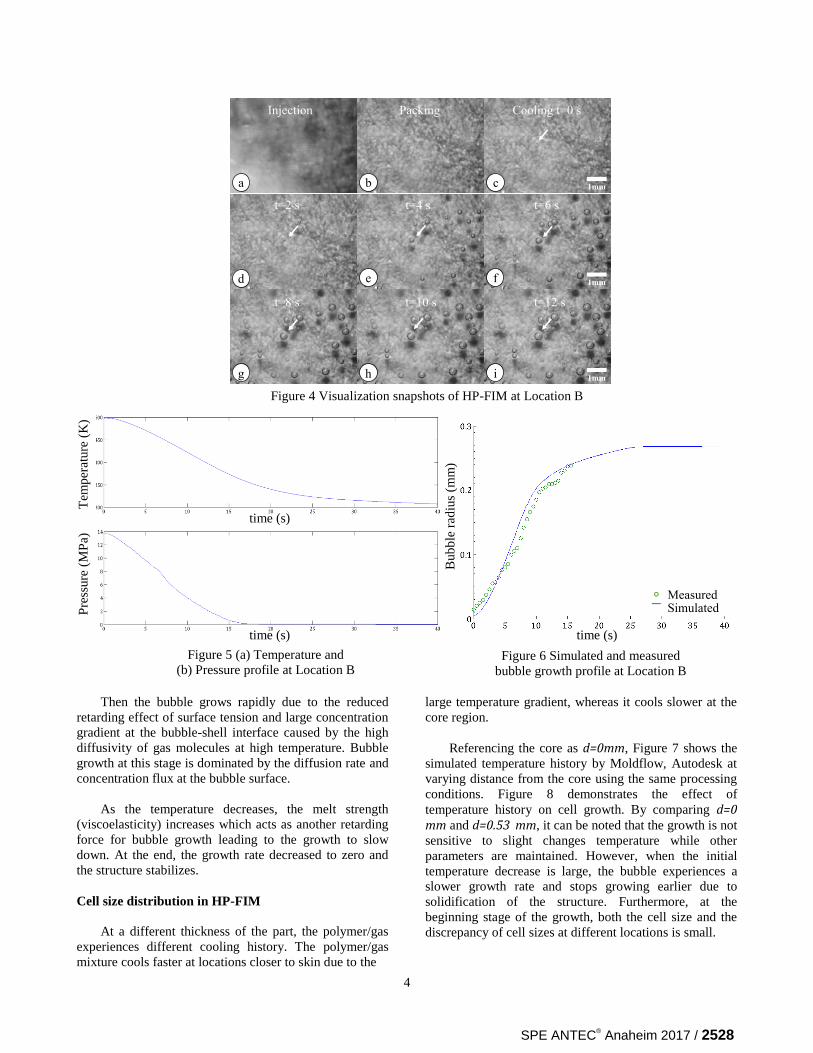
Figure 4 shows the snapshots of bubble growth at
Location B of the cavity during the HP-FIM trial. As
shown in Figure 4b), all the bubble that nucleated while
passing the gate were dissolved back into the system,
hence nucleation is primarily induced by shrinkage.
Figure 4 d), e), and f) clearly demonstrate that the bubble
grows at a faster rate at the beginning stage of growth.
Whereas Figure 4 g), h), and i) indicate that the reduced
growth rate and stabilization of the bubble size.
Simulation of bubble growth in HP-FIM
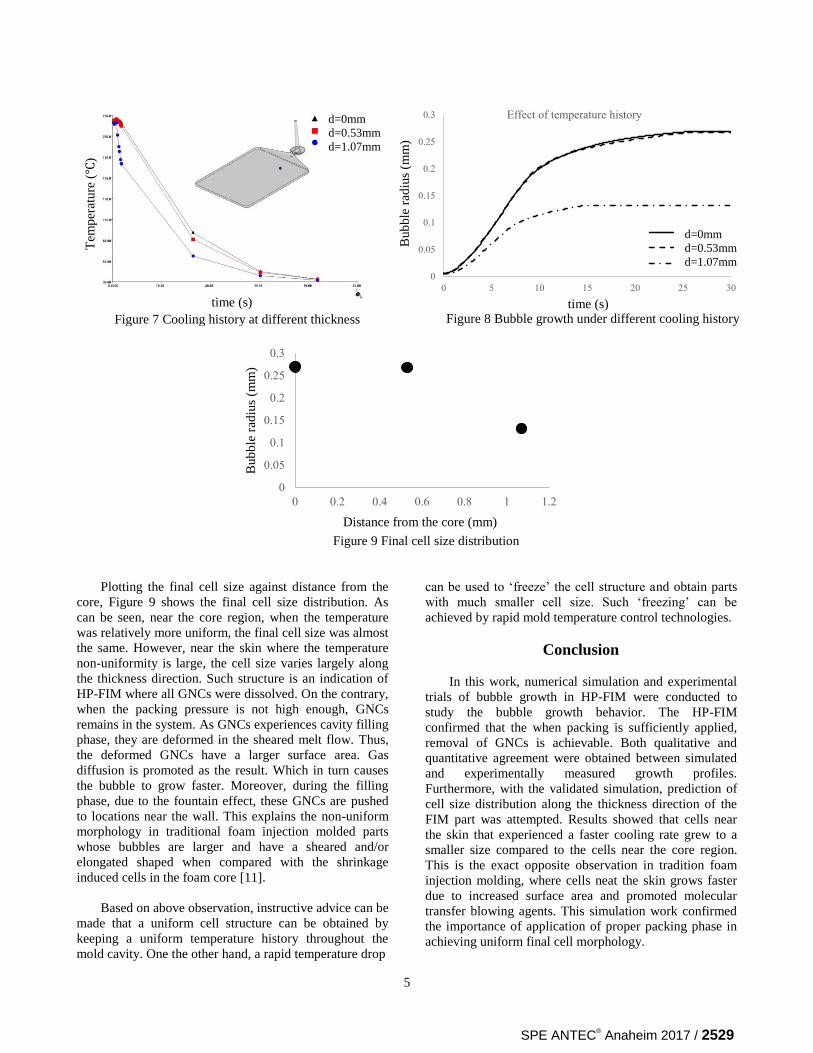
To simulate the experimental conditions of the HP-
FIM trial, temperature and pressure profiles along with
initial gas concentration were used as program inputs.
Figure 5a) and 5b) show the transient temperature and
pressure inputs for the bubble growth solver, respectively.
Initial blowing agent concentration was set to be 3% wt.
The temperature profile is simulated with Moldflow,
Autodesk under the same process setting as experiment
trial. The pressure profile is obtained by a pressure
transducer in the mold cavity at Location B.
Figure 6 plots the simulated 40 s growth profile
against the measured growth data. As can be seen, a
quantitative agreement was achieved. At the beginning
stage of growth, system temperature is relatively high, the
bubble starts to grow with a slower rate, despite the high
diffusivity, and low melt strength. Leung et al. also
reported similar trend and attributed this to the
contribution of surface tension to the bubble [4]. The 3rd
term on left-hand side of (2) represent the pressure
difference across the bubble-shell interface. When the
bubble is small, the pressure difference is greater and
imposes larger impedance on the growth. However, its
effect diminished as the bubble grows.
SPE ANTEC® Anaheim 2017 / 2527
4
Then the bubble grows rapidly due to the reduced
retarding effect of surface tension and large concentration
gradient at the bubble-shell interface caused by the high
diffusivity of gas molecules at high temperature. Bubble
growth at this stage is dominated by the diffusion rate and
concentration flux at the bubble surface.
As the temperature decreases, the melt strength
(viscoelasticity) increases which acts as another retarding
force for bubble growth leading to the growth to slow
down. At the end, the growth rate decreased to zero and
the structure stabilizes.
Cell size distribution in HP-FIM
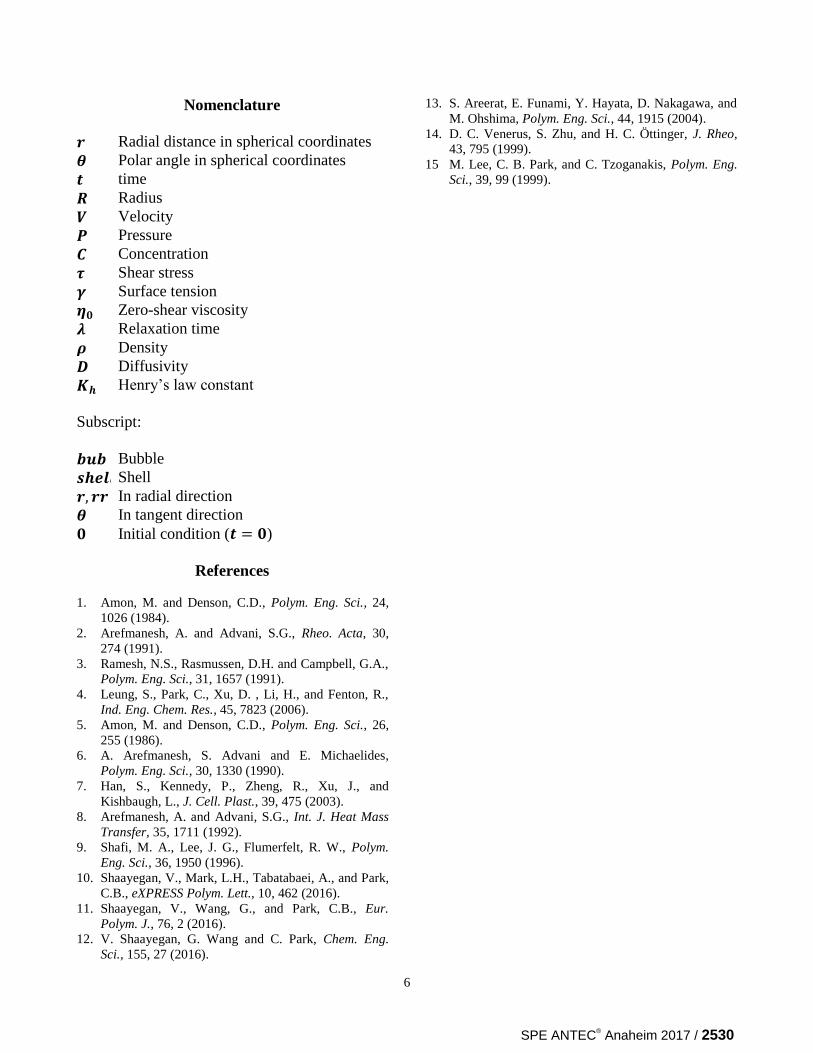
At a different thickness of the part, the polymer/gas
experiences different cooling history. The polymer/gas
mixture cools faster at locations closer to skin due to the
large temperature gradient, whereas it cools slower at the
core region.
Referencing the core as d=0mm, Figure 7 shows the
simulated temperature history by Moldflow, Autodesk at
varying distance from the core using the same processing
conditions. Figure 8 demonstrates the effect of
temperature history on cell growth. By comparing d=0 mm and d=0.53 mm, it can be noted that the growth is not
sensitive to slight changes temperature while other
parameters are maintained. However, when the initial
temperature decrease is large, the bubble experiences a
slower growth rate and stops growing earlier due to
solidification of the structure. Furthermore, at the
beginning stage of the growth, both the cell size and the
discrepancy of cell sizes at different locations is small.
PackingInjection Cooling t=0 s
t=27.315 s
a b c
d e f
g h i
t=2 s
t=8 s
t=4 s t=6 s
t=10 s t=12 s
1mm
1mm
1mm
Figure 4 Visualization snapshots of HP-FIM at Location B
SimulatedMeasured
Bubble growth profile at location B
Figure 6 Simulated and measured
bubble growth profile at Location B
Figure 5 (a) Temperature and
(b) Pressure profile at Location B
Tem
per
ature
(K
) P
ress
ure
(M
Pa)
B
ub
ble
rad
ius
(mm
)
time (s)
time (s) time (s)
SPE ANTEC® Anaheim 2017 / 2528
5
Plotting the final cell size against distance from the
core, Figure 9 shows the final cell size distribution. As
can be seen, near the core region, when the temperature
was relatively more uniform, the final cell size was almost
the same. However, near the skin where the temperature
non-uniformity is large, the cell size varies largely along
the thickness direction. Such structure is an indication of
HP-FIM where all GNCs were dissolved. On the contrary,
when the packing pressure is not high enough, GNCs
remains in the system. As GNCs experiences cavity filling
phase, they are deformed in the sheared melt flow. Thus,
the deformed GNCs have a larger surface area. Gas
diffusion is promoted as the result. Which in turn causes
the bubble to grow faster. Moreover, during the filling
phase, due to the fountain effect, these GNCs are pushed
to locations near the wall. This explains the non-uniform
morphology in traditional foam injection molded parts
whose bubbles are larger and have a sheared and/or
elongated shaped when compared with the shrinkage
induced cells in the foam core [11].
Based on above observation, instructive advice can be
made that a uniform cell structure can be obtained by
keeping a uniform temperature history throughout the
mold cavity. One the other hand, a rapid temperature drop
can be used to ‘freeze’ the cell structure and obtain parts
with much smaller cell size. Such ‘freezing’ can be
achieved by rapid mold temperature control technologies.
Conclusion
In this work, numerical simulation and experimental
trials of bubble growth in HP-FIM were conducted to
study the bubble growth behavior. The HP-FIM
confirmed that the when packing is sufficiently applied,
removal of GNCs is achievable. Both qualitative and
quantitative agreement were obtained between simulated
and experimentally measured growth profiles.
Furthermore, with the validated simulation, prediction of
cell size distribution along the thickness direction of the
FIM part was attempted. Results showed that cells near
the skin that experienced a faster cooling rate grew to a
smaller size compared to the cells near the core region.
This is the exact opposite observation in tradition foam
injection molding, where cells neat the skin grows faster
due to increased surface area and promoted molecular
transfer blowing agents. This simulation work confirmed
the importance of application of proper packing phase in
achieving uniform final cell morphology.
0
0.05
0.1
0.15
0.2
0.25
0.3
0 0.2 0.4 0.6 0.8 1 1.2
0
0.05
0.1
0.15
0.2
0.25
0.3
0 5 10 15 20 25 30
Cel
l ra
diu
s (m
m)
time (s)
Effect of temperature history
d=0mm
d=0.53mm
d=1.07mm
d=0mm
d=0.53mm
d=1.07mm
Tem
per
atu
re (
)
time (s)time (s)
Bub
ble
rad
ius
(mm
)
time (s)
Tem
per
ature
(℃
)
Figure 7 Cooling history at different thickness Figure 8 Bubble growth under different cooling history
Distance from the core (mm)
Bub
ble
rad
ius
(mm
)
Figure 9 Final cell size distribution
d=0mm
d=0.53mm
d=1.07mm
d=0mm
d=0.53mm
d=1.07mm
SPE ANTEC® Anaheim 2017 / 2529
6
Nomenclature
Radial distance in spherical coordinates
Polar angle in spherical coordinates
time
Radius
Velocity
Pressure
Concentration
Shear stress
Surface tension
Zero-shear viscosity
Relaxation time
Density
Diffusivity
Henry’s law constant
Subscript:
Bubble
Shell
In radial direction
In tangent direction
Initial condition ( )
References
1. Amon, M. and Denson, C.D., Polym. Eng. Sci., 24,
1026 (1984).
2. Arefmanesh, A. and Advani, S.G., Rheo. Acta, 30,
274 (1991).
3. Ramesh, N.S., Rasmussen, D.H. and Campbell, G.A.,
Polym. Eng. Sci., 31, 1657 (1991).
4. Leung, S., Park, C., Xu, D. , Li, H., and Fenton, R.,
Ind. Eng. Chem. Res., 45, 7823 (2006).
5. Amon, M. and Denson, C.D., Polym. Eng. Sci., 26,
255 (1986).
6. A. Arefmanesh, S. Advani and E. Michaelides,
Polym. Eng. Sci., 30, 1330 (1990).
7. Han, S., Kennedy, P., Zheng, R., Xu, J., and
Kishbaugh, L., J. Cell. Plast., 39, 475 (2003).
8. Arefmanesh, A. and Advani, S.G., Int. J. Heat Mass
Transfer, 35, 1711 (1992).
9. Shafi, M. A., Lee, J. G., Flumerfelt, R. W., Polym.
Eng. Sci., 36, 1950 (1996).
10. Shaayegan, V., Mark, L.H., Tabatabaei, A., and Park,
C.B., eXPRESS Polym. Lett., 10, 462 (2016).
11. Shaayegan, V., Wang, G., and Park, C.B., Eur.
Polym. J., 76, 2 (2016).
12. V. Shaayegan, G. Wang and C. Park, Chem. Eng.
Sci., 155, 27 (2016).
13. S. Areerat, E. Funami, Y. Hayata, D. Nakagawa, and
M. Ohshima, Polym. Eng. Sci., 44, 1915 (2004).
14. D. C. Venerus, S. Zhu, and H. C. Öttinger, J. Rheo,
43, 795 (1999).
15 M. Lee, C. B. Park, and C. Tzoganakis, Polym. Eng.
Sci., 39, 99 (1999).
SPE ANTEC® Anaheim 2017 / 2530