Embed Size (px)
Citation preview
Environmental Engineering and Management Journal November 2014, Vol.13, No. 11, 2743-2748
http://omicron.ch.tuiasi.ro/EEMJ/
“Gheorghe Asachi” Technical University of Iasi, Romania
SIMULATION OF BUILDING RENOVATION’S RETURN
IN ENERGY PLUS
Emese Bánóczy1, Péter Tamás Szemes1, Péter Korondi2
1University of Debrecen, Faculty of Engineering, Department of Electrical Engineering and Mechatronics, 2-4 Ótemető Street, Debrecen, Hungary
2Budapest University of Technology and Economics, Faculty of Mechanical Engineering, Department of Mechatronics, Optics and Mechanical Engineering Informatics
Abstract The Electrical Engineering and Mechatronics Department has developed a Building Mechatronics Research Center, where professors and researchers engage in several projects regarding the energy consumption of buildings, which are focused on the importance of the economic return of building modernizations via simulations. In this article, the prevalent energetic modernization of buildings and their payback period in Hungary are introduced. Key words: economic return, energetic modernization of buildings, Energy Plus, Net Present Value, payback period Received: February, 2014; Revised final: October, 2014; Accepted: October, 2014
Author to whom all correspondence should be addressed: e-mail: [email protected]
1. Introduction Currently, reducing the use of fossil fuels is a
serious problem. The solution to this problem is sought for by researchers, engineers and economics experts. The members of the European Union implemented several strategies to reduce the energy consumption and the CO2 emissions and to increase the efficiency of the extent and use of systems.
The most significant energy consumer is the building sector. This fact is particularly true in Hungary because most of the buildings were built before the 1980s.
In the University of Debrecen, Faculty of Engineering, Electrical Engineering and Mechatronics Department, explorations are underway regarding renewable energy systems, reducing energy consumption and intelligent buildings to address the energy use of buildings. In this article, the economic return of energetic modernization of buildings is analyzed.
2. Experimental In this section, the methodology for analyzing
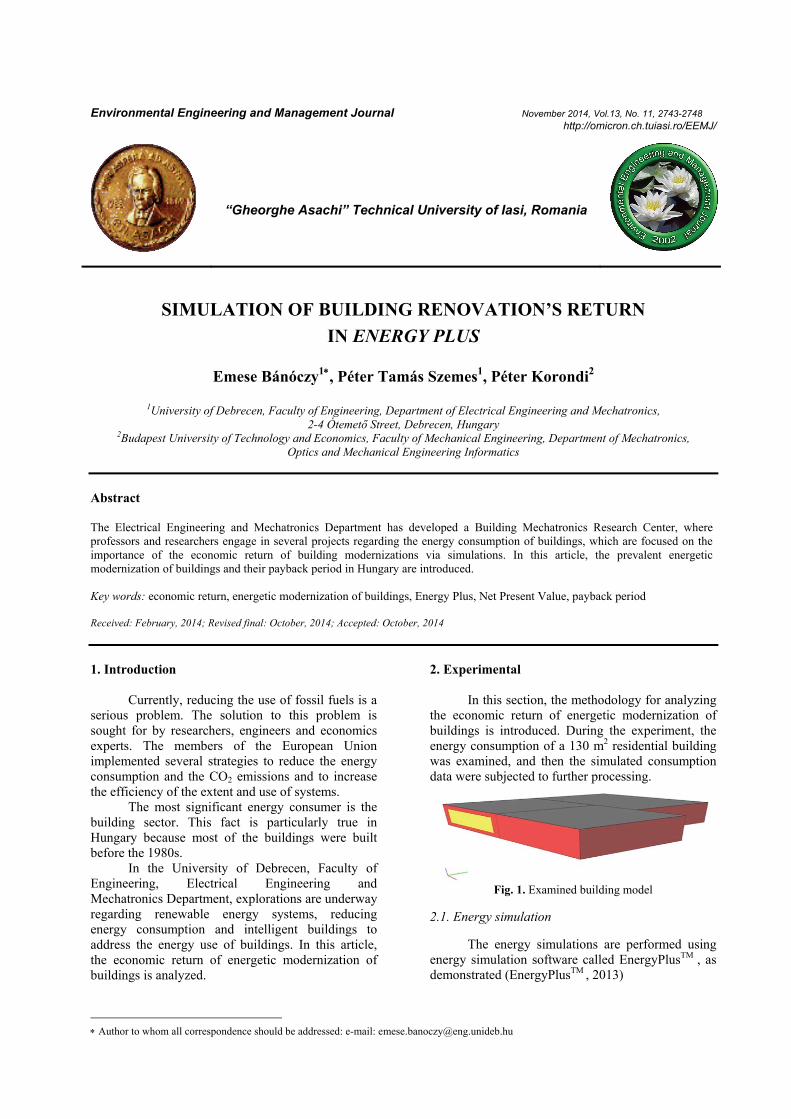
the economic return of energetic modernization of buildings is introduced. During the experiment, the energy consumption of a 130 m2 residential building was examined, and then the simulated consumption data were subjected to further processing.
Fig. 1. Examined building model
2.1. Energy simulation
The energy simulations are performed using energy simulation software called EnergyPlusTM , as demonstrated (EnergyPlusTM , 2013)

Bánóczy et al./Environmental Engineering and Management Journal 13 (2014), 11, 2743-2748
2744
The simulation interval is set to one year to allow us to investigate both a summer cooling period and a winter heating period. During the study, several energetic modernizations were examined in two different cities in Hungary: Debrecen and Szombathely. In this article, the simulation results for Debrecen are presented. Two built-in models transformed according to the Hungarian practice (such as special days, latitude and longitude, time zone, elevation, and weather file).
The above-mentioned models are composed of the following components. Fig. 2 shows the model, which contains only a furnace. Using this model, several energetic modernizations were simulated, such as wall insulation, heating and cooling system replacement, as demonstrated (Aviza et al., 2013; Bizzarri et al., 2006; Heo, 2011;
Kumbaroglu et al., 2012). The results of these simulations are presented in the results and discussion section.
Fig. 3 shows a furnace with a heat pump system. The basic concept is similar, but in the second model, the main heating part is a heat pump, and the heating coil is only supplemental as demonstrated (Lund et al., 2004)
Parametric analyses of these various cases (versions) of the models are produced using jEPlus software after running the basic EnergyPlus simulation. This process is available in EnergyPlus as well, but in this case, the use of jEPlus was more practical, as demonstrated (Zhang 2009; Zhang and Korolija 2010). Table 1 presents the parameters of these versions.
Fig. 2. First examined model (only furnace)
Fig. 3. Second examined model (heat pump and furnace)
Table 1. Examined energetic modernization versions of the study
Version Heating facility Wall insulation thickness [m] Version 1 (V1) Furnace 0 Version 2 (V2) Furnace 0.06 Version 3 (V3) Furnace 0.08 Version 4 (V4) Furnace 0.1 Verion 5 (V5) Furnace 0.12 Version 6 (V6) Heat pump (air to air) 0 Version 7 (V7) Heat pump (air to air) 0.06 Version 8 (V8) Heat pump (air to air) 0.08 Version 9 (V9) Heat pump (air to air) 0.1
Version 10 (V10) Heat pump (air to air) 0.12

Simulation of building renovation’s return in energy plus
2745
2.2. Economic analysis
In the economic analysis, the Net Present
Value (NPV henceforth) methodology is used, as demonstrated (Arshad, 2012; Illés, 2007, 2012). The calculation is performed as the difference between the annual incomes and the annual expenses. Here, the annual income denotes the savings due to the energetic modernization measures. The annual expense denotes the charges in the electricity and gas annual consumption. The result is the annual increment. By discounting and then summing these annual increments during of the experiment, the eventual result is obtained. The NPV helps to make a decision about a project: whether to accomplish it or which project provides the greatest annual increment. The value set of the NPV can be a negative value, zero, or positive value. If the NPV is a non-negative value, the implementation of the project is economical.
In Debrecen, the supplier of electricity is EON Ltd., and the supplier of gas is TIGÁZ Ltd. The gross charge of annual electricity consumption (GCAEC hereafter) is described by Eq. (1), and the gross charge of annual gas consumption (GCAGC hereafter) is described by Eq. (2).
HUFSRkWhECkWh
HUFUPVATGCAEC (1)
HUFSRMJECMJ
HUFUPVATGCAGC (2)
where:VAT: value-added tax; UP: unit price; EC: energy consumption; SR: Standard rate
In Hungary, the value of gas-electricity equivalent is 3; i.e., 1 unit of electricity is equivalent to 3 units of gas. The energy consumption consists of the two above-mentioned parts: the electricity consumption and gas consumption. The savings are calculated with the difference between the new state’s energy consumption in HUF and the basic state’s energy consumption in HUF.
3. Results and discussion
In this part of the article, the simulated data
regarding the energy consumption and the calculated data regarding the economic payment are presented. Table 2 presents the data regarding the difference of the investment costs and the difference of one-year savings with different insulation thicknesses. The upper triangle (green) of the matrix presents the above-mentioned investment costs, and the lower triangle (orange) of the matrix presents the achievable savings during one year. The matrix helps to make decisions regarding the investment by comparing the annual savings and the costs of this energetic modernization. Negative values mean no savings because the insulation.
Fig. 4 shows the annual energy consumption (total, electricity and gas) in GJ units. For versions 1-6, the electricity is nearly constant, and for versions 7-10 the electricity consumption decreases. In the all cases, the gas consumption varies significantly. In versions 6-10, total energy consumption decreases significantly. In version 6 the electricity consumption increases, while gas consumption decreases. In versions 7-10 the consumption of total energy, electricity and gas decreases because wall insulation. Consequently, the total energy consumption decreases compared with the basic state. The best condition is available for version 10.
Fig. 5 shows the percentage change of different annual energy consumption (total, gas, electricity) values in HUF compared with the basic state. The decrease in the gas and electricity and therefore the decrease in the total energy consumption are found in versions 2-5.
Versions 6-10 exhibit remarkable reduction of the thermal energy. In these cases, significant thermal energy can be saved, while the electricity consumption remains nearly the same. In these versions, the total energy savings are also achieved. However, for version 6, the annual electricity consumption even exceeds the basic state, the annual total energy consumption is less than in basic state (V1).
Fig. 6 shows the rate of savings and investments in different cases. The ratio will be greater if the savings are increasing or if the investments are decreasing. The results indicate that in all versions savings are generated, but versions 9 and 8 are the best choices because the rate of these cases is the greatest.
Fig. 7 shows the payback period for cases 2-10 over 15 years. Every energetic modernization measure of the examined investments results in savings. Versions 7-10 show a return between the sixth and seventh years. Version 6 clears its cost in the ninth year, respectively. Version 3 shows a return between the tenth and eleventh years. The other versions clear their costs after the twelfth year.
4. Conclusions
In practice in Hungary, the price of one unit of
gas energy is less expensive than electricity because the gas and electricity equivalent of the heat pump can work economically if the seasonal average COP value is greater than 3. Because the more effective engineering systems (mainly the heating and cooling systems), the net energy demand changes significantly.
The payback period of the wall insulation investment is approximately 10-12 years without fenestration replacement. The payback period of heating system replacement only is 9 year. This modernization scenario corresponds to the requisite building energy use, which will be implemented in 2020.

Bánóczy et al./Environmental Engineering and Management Journal 13 (2014), 11, 2743-2748
2746
Table 2. Investment costs and savings matrix
Insulation thickness [m]
0 m 0.06 m 0.08 m 0.1 m 0.12 m
0 m x 624 288 HUF 661 448 HUF 698 608 HUF 735 768 HUF
0.06 m 70 239 HUF x 37 160 HUF 74 320 HUF 111 480 HUF
0.08 m 83 302 HUF 13 064 HUF x 37 160 HUF 74 320 HUF
0.1 m 79 276 HUF 9 037 HUF -4 027 HUF x 37 160 HUF
0.12 m 81 726 HUF 11 488 HUF -1 506 HUF 2 450 HUF x
Fig. 4. Annual energy consumptions of the examined versions
Fig. 5. Percentage change in annual energy consumptions

Simulation of building renovation’s return in energy plus
2747
Fig. 6. The rate of savings and investments for the different cases
Fig. 7. Payback period of versions 2-10
Acknowledgments The work is supported by the TÁMOP-4.2.2.A-11/1/KONV-2012-0041 project. The project is co-financed by the European Union and the European Social Fund.
References Arshad A., (2012), Net Present Value is better than Internal
Rate of Return, Interdisciplinary Journal Of Contemporary Research in Business, 4, 211-219.
Aviza D., Turskis Z., Volvaciovas R., (2013), Correlation analysis of thermo-insulation layer thickness and its payback period of the typical pitched roof detail, Procedia Engineering, 57, 120-126.
Bizzarri G., Morini G. L., (2006), New technologies for an effective energy retrofit of hospitals, Applied Thermal Engineering, 26, 161-169.
EnergyPlusTM, (2013), EnergyPlus Engineering Reference - The Reference to Energy Plus Calculations, 867-1008, On line at:
http://apps1.eere.energy.gov/buildings/energyplus/pdfs/engineeringreference.pdf.
Heo Y., (2011) Bayesian calibration of building energy models for energy retrofit decision-making under uncertainty, Dissertation, Georgia Institute of Technology, On line at: https://smartech.gatech.edu/bitstream/handle/1853/42878/Heo_Yeonsook_201112_phd.pdf.
Illés M., (2007), Scientific problems of modern approach of net present value, Club of Economics in Miskolc, TMP, 4, 29-35.
Illés M., (2012), Transforming the net present value for a comparable one, Club of Economics in Miskolc TMP, 8, 24-32.
Kumbaroglu G., Madkener R., (2012), Evaluation of economically optimal retrofit investment options for energy savings in buildings, Energy and Buildings, 49, 327-334.
Lund J., Sanner B., Rybach L., Curtis R., Hellström G., (2004), Geothermal (Ground-source) heat pumps, A

Bánóczy et al./Environmental Engineering and Management Journal 13 (2014), 11, 2743-2748
2748
world overview, GHC Bulletin, On line at: https://pure.ltu.se/portal/files/2200656/art1.pdf
Zhang Y., (2009), Parallel’ Energyplus and the Development of a Parametric Analysis Tool, IBPSA BS2009, 27-30 July 2009, Glasgow, UK, On line at: http://www.ibpsa.org/proceedings/BS2009/BS09_1382_1388.pdf
Zhang Y., Korolija I., (2010) Performing Complex Parametric Simulations With Jeplus, SET2010 – 9th International Conference on Sustainable Energy Technologies, 24-27 August, Shanghai, China, On line at: http://www.ibpsa.org/proceedings/BS2009/BS09_1382_1388.pdf