Embed Size (px)
Citation preview
DOI: http://dx.doi.org/10.1590/1980-5373-MR-2018-0564Materials Research. 2019; 22(2): e20180564
Simulation of an Injection Process Using a CAE Tool: Assessment of Operational Conditions and Mold Design on the Process Efficiency
Diego Alves de Mirandaa* , André Lourenço Nogueirab
Received: August 12, 2018; Revised: November 06, 2018; Accepted: November 23, 2018
The present work developed an experimental and simulation study to evaluate the influence of some operational conditions and mold design on the efficiency of an injection process used to produce polystyrene parts. The software SolidWorks Plastic was used to simulate the injection process and assess the performance of the mold considering the absence and the presence of venting. Experimental results obtained by varying the injection pressure, injection temperature as well as the mold temperature were used to validate the simulation data generated considering both mold designs. The findings revealed air entrapment at the end of the mold cavity and low process efficiency when the mold was operated with no venting, regardless the processing conditions. Simulation results indicated a remarkable increase of the process efficiency when vents were included on the parting line of the mold. In addition, the range of processing conditions which led to the highest process efficiency was virtually identified and tested in the real modified mold (with venting system). The findings revealed that the injection cycle time reduced in approximately 35% and the waste generation diminished from 65% to less than 1% when venting was included in the mold design and the optimal operational conditions were used.
Keywords: Injection molding, polystyrene, simulation, air entrapment, venting.
*e-mail: [email protected]
1. IntroductionIn the last decades, the consumption of thermoplastics has
grown according to the demand for innovative products and due to the increase in the development of parts and components for the automotive, household and furniture industries1. The constant growth of the worldwide consumption of plastics products made by injection molding, associated with the strong market competition, has motivated engineers and researchers to sought to optimize the processing conditions aiming to reduce costs and enhance the quality of the product2.
Nowadays, engineering projects are capable to guarantee high precision in the manufacturing of injection molds mainly due to the availability of computational tools capable to simulate the injection process of thermoplastics3. The usage of CAE (Computer Aided Engineering) packages can lead to results that remarkably contribute for the suitable manufacture of injection molds4. The computational analysis using commercial software is a strategy more and more accepted and applied by the plastics transforming industries before the manufacturing of injection molds. Computational simulation of injection processes is a powerful tool that can be used to identify and correct mistakes in injection molds as well as to include new characteristics to the product in the phase of the project. In this way, the designers are able to develop new ways to manufacture injection molds with extremely
high precision5. The numerical simulation of the filling process in injection molding is a valuable tool for the project engineer to predict potential defects and optimize the process6. Engineers can also virtually evaluate alternative materials without physically use the real material and compromise the machine time available for production7. Therefore, it is possible to reduce the risks of mistakes in the manufacturing of the mold, avoid injection problems and minimize the costs associated to the production of the mold2,8. Moreover, simulations can also be useful to optimize the project of the mold and the processing parameters, leading to better quality processes and products. Although the inherent advantages, only a few companies in the field of plastics processing and mold manufacturing use computational simulation. One factor that inhibits the wide spreading of computational simulation by such industries is the cost of the software license. The more accurate are the desired simulation results, the more expensive is the software and more complex is the setting up of the physics of the problem, mainly in packages based on computational fluid dynamics techniques.
At the academic filed, many studies regarding the use of computational simulation of injection processes were developed and can be found in the literature. Kim and Turng published a topical review regarding the development of 3D CAE simulations for injection molding7. The authors stated that computer simulation is an efficient and cost-effective tool to analyze the complicated physical phenomena involved
aDepartamento de Engenharia Mecânica, Universidade da Região de Joinville - UNIVILLE, 89288-385, São Bento do Sul, SC, Brasil
bDepartamento de Engenharia Química, Programa de Pós-Graduação em Engenharia de Processos, Universidade da Região de Joinville - UNIVILLE, 89219-710, Joinville, SC, Brasil
Miranda et al.2 Materials Research
in injection molding when compared with the experimental approach of trial and error.
Moayyedian analyzed the influence of an elliptical cross-sectional shape of the runner system on the behavior of an injection molding process by using the package SolidWorks Plastic9. As reported by the authors, it was possible to reduce the waste (25%) and the cycle time (2.5%) when compared to the traditional round cross section. In another study, Huszar used the Moldflow Insight’s “Fill+Pack+Warpage” analysis sequence to investigate the molding characteristics with a partially symmetrical and hollow geometry using four potential gates locations10. According to the authors, the simulations revealed that the careful selection of materials and the gate location can optimize the mold design and minimize the production of waste and the energy costs. Oliaei employed the Autodesk Moldflow to minimize warpage and volumetric shrinkage for three different biodegradable polymeric systems11. The authors concluded that such problems are significantly influenced by the melting temperature, cooling temperature and packing time. Guerrier used the software Moldex 3D Solid R13 with the model Cross WLF to understand the influence of processing parameters on the filling process during the injection molding of ABS (acrylonitrile-butadiene-styrene) and PC (polycarbonate)12. The authors could compare the evolution of the simulated filling front with the real one by using a special mold containing a glass window.
Among the distinct problems that may appear when the mold is under operation, the air trapped inside the mold is of major relevance. According to Kapila, the problem of gas entrapment is related to the air that remains retained inside the mold cavities, once the air cannot suitably escape through the mold vents or inserts as the polymer front flows across the cavities13. This problem occurs mostly at the end of the mold cavities, leading to an inefficient filling by the polymer. Consequently, the parts produced might present voids or incomplete regions, bubbles inside the polymer parts, short shot or even superficial defects as stains or burned marks. Such authors used the Moldflow software (version 2013) to simulate the behavior of the injection molding of an ABS part by varying the size and location of two different gates. They studied the effect of such parameters on the air entrapment, clamp force and fill time. According to the findings, the authors reported that the air trapped depend upon the type and size of the gate at the point of filling. Kumar and Nagaraja used a plastic flow adviser software to simulate the process varying some operating parameters aiming to optimize the process and reduce problems associated to the quality of the injected parts14. After simulating the process under distinct conditions, experimental tests were performed in the designed mold with the optimized gate location. The experimental results proved that the optimization of the gate location through simulation tests improved the process performance, leading to a reduction of the filling time, shrinkage and air
entrapment. Tada used the injection molding CAE system PLANETS to perform 3D simulations of the filling flow behavior into micro and nanosurface features by comparing the numeric results with experimental data15. As observed by the authors, the simulation and experimental results showed the possibility of the occurrence of air entrapment in the filling stage. Moreover, the air trapped showed to have a strong interaction with the replication shape.
Griffiths stated that one important design solution for reducing air entrapment is venting, ideally located at the mold split lines16. The researchers proposed an experimental setup to monitor the air flow behavior during the filling stage of a microinjection molding by using a microelectromechanical gas sensor mounted inside the mold cavities. The findings showed that the maximum air flow, the air flow over time and the injection speed are the most influential parameters on the air evacuation from the cavity during the filling stage. In this case, the air evacuation was improved by raising the speed of the polymer entering the cavity due to the increase of the maximum air flow rate. In addition, it was possible to reduce the resistance to the air evacuation by increasing the temperature of the melt polymer and tool temperature. As a consequence, an increase of the flow length was achieved.
As observed, different experimental and mathematical approaches and distinct CAE software can be used to investigate the characteristics of injection molding processes. The present work used a relatively low-cost CAE software (SolidWorks Plastic), associated to an experimental study, to evaluate the influence of operational conditions and mold design on the efficiency of an injection process used to produce polystyrene parts. Firstly, the mold was designed with no venting to evaluate the process performance by varying three different operational parameters (injection pressure and temperature, and mold temperature). Then, computational simulations were performed to assess the model capability to reproduce the process behavior under distinct operational conditions. In the second step, simulations and experimental runs considering venting in the mold design were performed and the results were compared with those generated with the mold with no venting system. Based on the obtained results, the optimal range of operational conditions could be determined, improving the process efficiency.
2. Materials and Methods
The methodology applied in this work was divided into two steps. The first one comprises an analysis of the product, exploring the main aspects involved in the initial phase of the project of the product to be manufactured by injection molding. In the second step, the experimental methodologies, as well as the simulation procedures adopted to study the injection process of GPPS parts are comprehensively presented.
3Simulation of an Injection Process Using a CAE Tool: Assessment of Operational Conditions and Mold Design on the Process Efficiency
2.1 Product and mold project
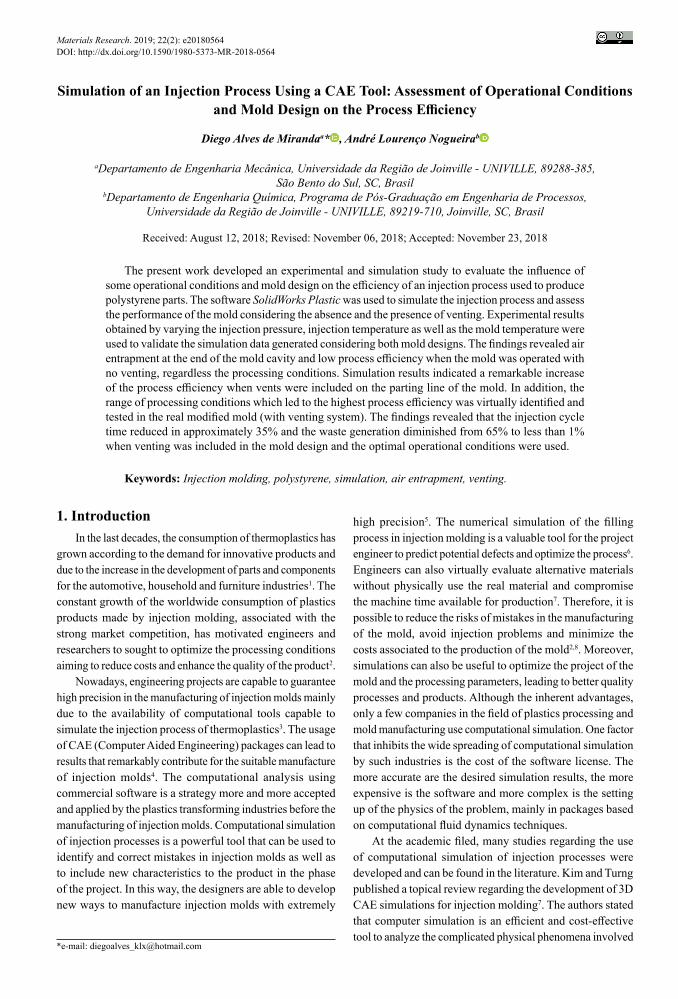
The product used as a case study in this work is a cup with a twisted geometry. The complete project of such cup was executed in the CAD (Computer Aided Design) SolidWorks (version 2016). An image of the product model and the real product are shown in Figure 1. The General Purpose Polystyrene (GPPS 1921 from Innova, Brazil) was the material selected to inject the product (cup) due to its excellent processability, transparency and good fluidity even when submitted to fast injection cycles17. The values of the main physical and processing parameters of the GPPS used in this work, according to the manufacturer of the resin, are presented in Table 1.
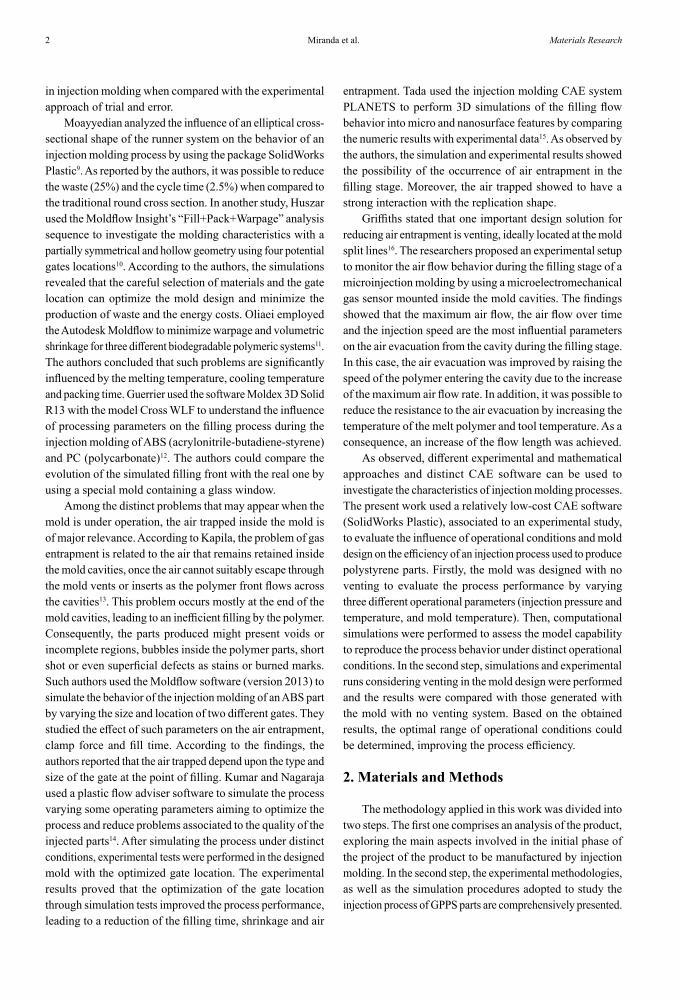
According to the product project, the volume of each cup is 66.56 cm3, which lead to an injected mass of 71.75 g, considering the density value of the GPPS shown in Table 1. The mold, manufactured with steel P-20, is composed by two cavities, and the total injection volume and mass are 133.12 cm3 and 143.50 g, respectively (Figure 2). Figures 2.a and 2.b presented de details of the virtual and real mold cavities. As observed in Figure 2.c, the melt polymer enters the mold cavities by the bottom part of the product through the injection gates located at the central point of the inferior cavity. Two mold designs were evaluated in the study: the first one did not consider the use of air vents (venting system), as seen in Figure 2; the second mold design took into account for the presence of a venting system composed of channels
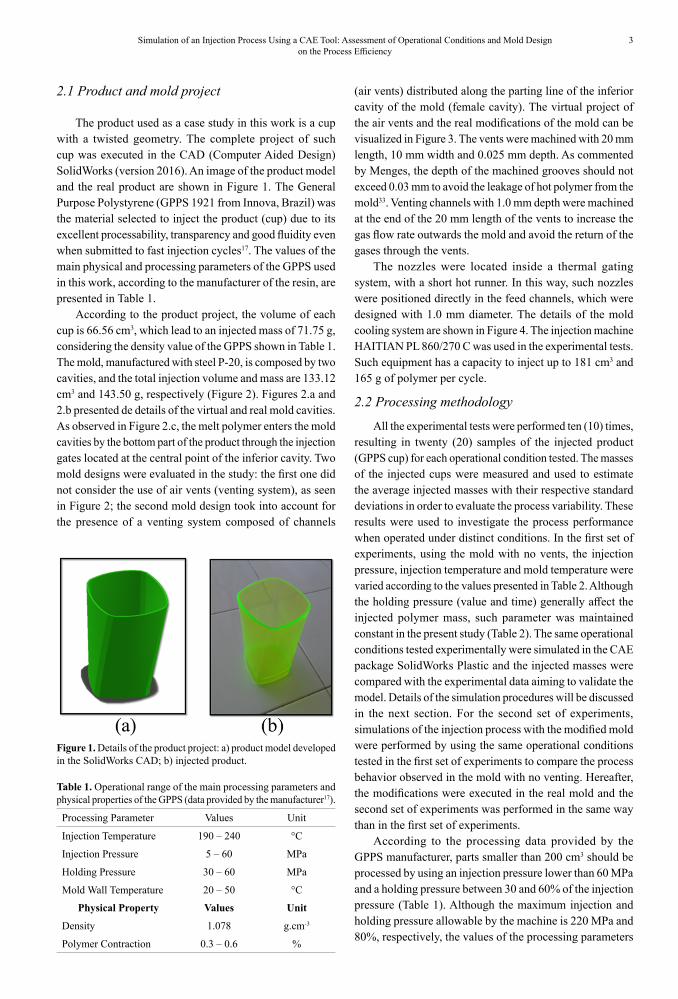
(air vents) distributed along the parting line of the inferior cavity of the mold (female cavity). The virtual project of the air vents and the real modifications of the mold can be visualized in Figure 3. The vents were machined with 20 mm length, 10 mm width and 0.025 mm depth. As commented by Menges, the depth of the machined grooves should not exceed 0.03 mm to avoid the leakage of hot polymer from the mold33. Venting channels with 1.0 mm depth were machined at the end of the 20 mm length of the vents to increase the gas flow rate outwards the mold and avoid the return of the gases through the vents.
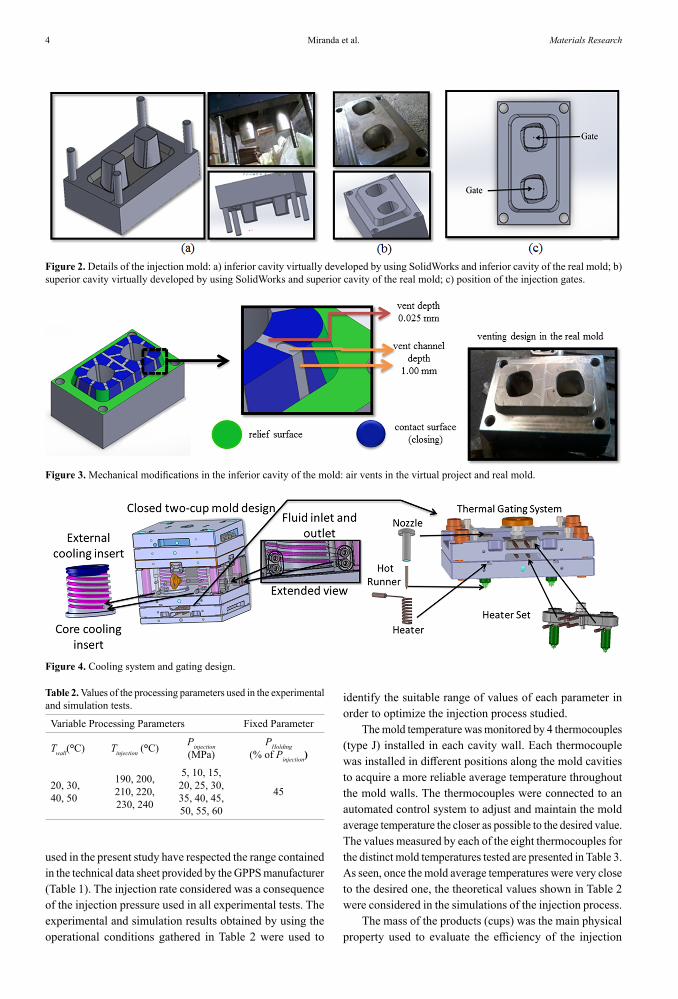
The nozzles were located inside a thermal gating system, with a short hot runner. In this way, such nozzles were positioned directly in the feed channels, which were designed with 1.0 mm diameter. The details of the mold cooling system are shown in Figure 4. The injection machine HAITIAN PL 860/270 C was used in the experimental tests. Such equipment has a capacity to inject up to 181 cm3 and 165 g of polymer per cycle.
2.2 Processing methodology
All the experimental tests were performed ten (10) times, resulting in twenty (20) samples of the injected product (GPPS cup) for each operational condition tested. The masses of the injected cups were measured and used to estimate the average injected masses with their respective standard deviations in order to evaluate the process variability. These results were used to investigate the process performance when operated under distinct conditions. In the first set of experiments, using the mold with no vents, the injection pressure, injection temperature and mold temperature were varied according to the values presented in Table 2. Although the holding pressure (value and time) generally affect the injected polymer mass, such parameter was maintained constant in the present study (Table 2). The same operational conditions tested experimentally were simulated in the CAE package SolidWorks Plastic and the injected masses were compared with the experimental data aiming to validate the model. Details of the simulation procedures will be discussed in the next section. For the second set of experiments, simulations of the injection process with the modified mold were performed by using the same operational conditions tested in the first set of experiments to compare the process behavior observed in the mold with no venting. Hereafter, the modifications were executed in the real mold and the second set of experiments was performed in the same way than in the first set of experiments.
According to the processing data provided by the GPPS manufacturer, parts smaller than 200 cm3 should be processed by using an injection pressure lower than 60 MPa and a holding pressure between 30 and 60% of the injection pressure (Table 1). Although the maximum injection and holding pressure allowable by the machine is 220 MPa and 80%, respectively, the values of the processing parameters
Figure 1. Details of the product project: a) product model developed in the SolidWorks CAD; b) injected product.
Table 1. Operational range of the main processing parameters and physical properties of the GPPS (data provided by the manufacturer17).
Processing Parameter Values Unit
Injection Temperature 190 – 240 °C
Injection Pressure 5 – 60 MPa
Holding Pressure 30 – 60 MPa
Mold Wall Temperature 20 – 50 °C
Physical Property Values Unit
Density 1.078 g.cm-3
Polymer Contraction 0.3 – 0.6 %
Miranda et al.4 Materials Research
identify the suitable range of values of each parameter in order to optimize the injection process studied.
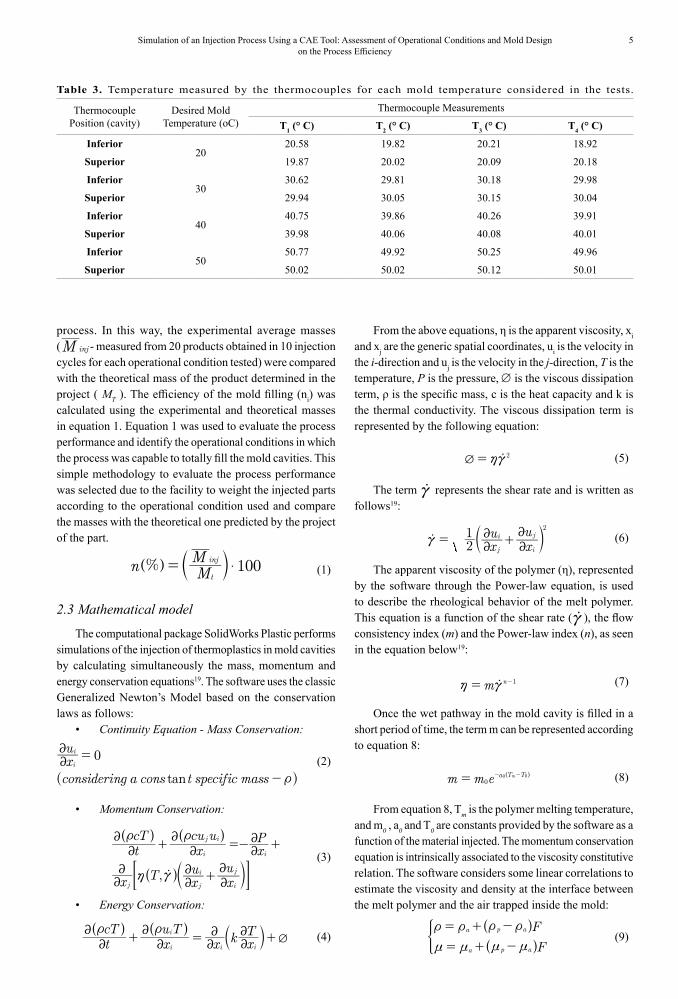
The mold temperature was monitored by 4 thermocouples (type J) installed in each cavity wall. Each thermocouple was installed in different positions along the mold cavities to acquire a more reliable average temperature throughout the mold walls. The thermocouples were connected to an automated control system to adjust and maintain the mold average temperature the closer as possible to the desired value. The values measured by each of the eight thermocouples for the distinct mold temperatures tested are presented in Table 3. As seen, once the mold average temperatures were very close to the desired one, the theoretical values shown in Table 2 were considered in the simulations of the injection process.
The mass of the products (cups) was the main physical property used to evaluate the efficiency of the injection
Figure 2. Details of the injection mold: a) inferior cavity virtually developed by using SolidWorks and inferior cavity of the real mold; b) superior cavity virtually developed by using SolidWorks and superior cavity of the real mold; c) position of the injection gates.
Figure 3. Mechanical modifications in the inferior cavity of the mold: air vents in the virtual project and real mold.
Figure 4. Cooling system and gating design.
Table 2. Values of the processing parameters used in the experimental and simulation tests.
Variable Processing Parameters Fixed Parameter
Twall(°C) Tinjection (°C) Pinjection(MPa)
PHolding(% of Pinjection)
20, 30, 40, 50
190, 200, 210, 220, 230, 240
5, 10, 15, 20, 25, 30, 35, 40, 45, 50, 55, 60
45
used in the present study have respected the range contained in the technical data sheet provided by the GPPS manufacturer (Table 1). The injection rate considered was a consequence of the injection pressure used in all experimental tests. The experimental and simulation results obtained by using the operational conditions gathered in Table 2 were used to
5Simulation of an Injection Process Using a CAE Tool: Assessment of Operational Conditions and Mold Design on the Process Efficiency
process. In this way, the experimental average masses ( M inj - measured from 20 products obtained in 10 injection cycles for each operational condition tested) were compared with the theoretical mass of the product determined in the project ( MT ). The efficiency of the mold filling (ni) was calculated using the experimental and theoretical masses in equation 1. Equation 1 was used to evaluate the process performance and identify the operational conditions in which the process was capable to totally fill the mold cavities. This simple methodology to evaluate the process performance was selected due to the facility to weight the injected parts according to the operational condition used and compare the masses with the theoretical one predicted by the project of the part.
(1)
2.3 Mathematical model
The computational package SolidWorks Plastic performs simulations of the injection of thermoplastics in mold cavities by calculating simultaneously the mass, momentum and energy conservation equations19. The software uses the classic Generalized Newton’s Model based on the conservation laws as follows:
• Continuity Equation - Mass Conservation:
(2)
• Momentum Conservation:
(3)
• Energy Conservation:
(4)
From the above equations, η is the apparent viscosity, xi and xj are the generic spatial coordinates, ui is the velocity in the i-direction and uj is the velocity in the j-direction, T is the temperature, P is the pressure, ∅ is the viscous dissipation term, ρ is the specific mass, c is the heat capacity and k is the thermal conductivity. The viscous dissipation term is represented by the following equation:
(5)
The term co represents the shear rate and is written as follows19:
(6)
The apparent viscosity of the polymer (η), represented by the software through the Power-law equation, is used to describe the rheological behavior of the melt polymer. This equation is a function of the shear rate (co ), the flow consistency index (m) and the Power-law index (n), as seen in the equation below19:
(7)
Once the wet pathway in the mold cavity is filled in a short period of time, the term m can be represented according to equation 8:
(8)
From equation 8, Tm is the polymer melting temperature, and m0 , a0 and T0 are constants provided by the software as a function of the material injected. The momentum conservation equation is intrinsically associated to the viscosity constitutive relation. The software considers some linear correlations to estimate the viscosity and density at the interface between the melt polymer and the air trapped inside the mold:
(9)
%n MM
100t
inj$=Q TV Y
tanxu
considering a cons t specific mass
0i
i
22
t
=
-R W
,
tcT
xcu u
xP
x Txu
xu
i
j i
i
j j
i
i
j
22
22
22
22
22
22
t t
h c
+ =- +
+o
Q
Q T
QV
V
V
Y# &
tcT
xu T
x k xT
i
i
i i22
22
22
22
Qt t
+ = +Q Q TV V Y
2Q hc= o
xu
xu
21
j
i
i
j2
22
22
c = +o T Y
m n 1h c= -o
m m e a T T0
m0 0= - -Q V
F
F
a p a
a p a
t t t t
n n n n
= + -
= + -
VVG
Table 3. Temperature measured by the thermocouples for each mold temperature considered in the tests.
Thermocouple Position (cavity)
Desired Mold Temperature (oC)
Thermocouple Measurements
T1 (° C) T2 (° C) T3 (° C) T4 (° C)
Inferior20
20.58 19.82 20.21 18.92
Superior 19.87 20.02 20.09 20.18
Inferior30
30.62 29.81 30.18 29.98
Superior 29.94 30.05 30.15 30.04
Inferior40
40.75 39.86 40.26 39.91
Superior 39.98 40.06 40.08 40.01
Inferior50
50.77 49.92 50.25 49.96
Superior 50.02 50.02 50.12 50.01
Miranda et al.6 Materials Research
In equation 9, ρa and µa are the specific mass and the dynamic viscosity of the air, while ρp and µp are the specific mass and dynamic viscosity of the polymer. The function representing the volumetric fraction phase F is defined by the following transport equation:
(10)
Equation 10 determines the displacement of the interface positions between the air and the melt polymer, and the volumetric fraction function F assumes the following values depending on the position of the interface:
(11)
Once the density and the dynamic viscosity of the air phase are much smaller than the same physical properties of the polymer, it is assumed that the interfacial tension has no relevant effects over the flow. In this way, the superficial tension at the interface region is neglected and the air flow in the empty region of the mold is considered to behave as an incompressible flow. Moreover, it is assumed that the air can escape from the mold without restrictions, assuming that venting exists, and the pressure over the interface is considered almost the same of the atmospheric one. Therefore, in the numerical analysis, the air is substituted by a pseudo-fluid with physical properties greater than the real ones. It is important to point out that the numerical resolution over the whole computational domain considers the following conditions:
• the influence of the air trapped is not considered once the pressure and velocities are not computed and coupled to the fluid flow because the flow is considered incompressible;
• the model is not able to precisely solve multiphase problems;
• in order to indicate the most probable points in the cavity at which air entrapment is possible to occur, the software performs a statistical analysis just after the computation of the polymer flow throughout the cavity with all temperature and pressure gradients defined. This analysis takes into account the results obtained in the simulations, the gap between the mold walls as well as the polymer pathway, besides the last points at which the polymer stopped to flow.
The mathematical model composed by equations 2 to 11 was solved by the software using the finite element method (FEM). The formulations for such equations are presented in the study published by Hétu20.
2.4 Simulation procedures
Computational simulations of the GPPS injection were performed considering only one mold cavity by using the CAE
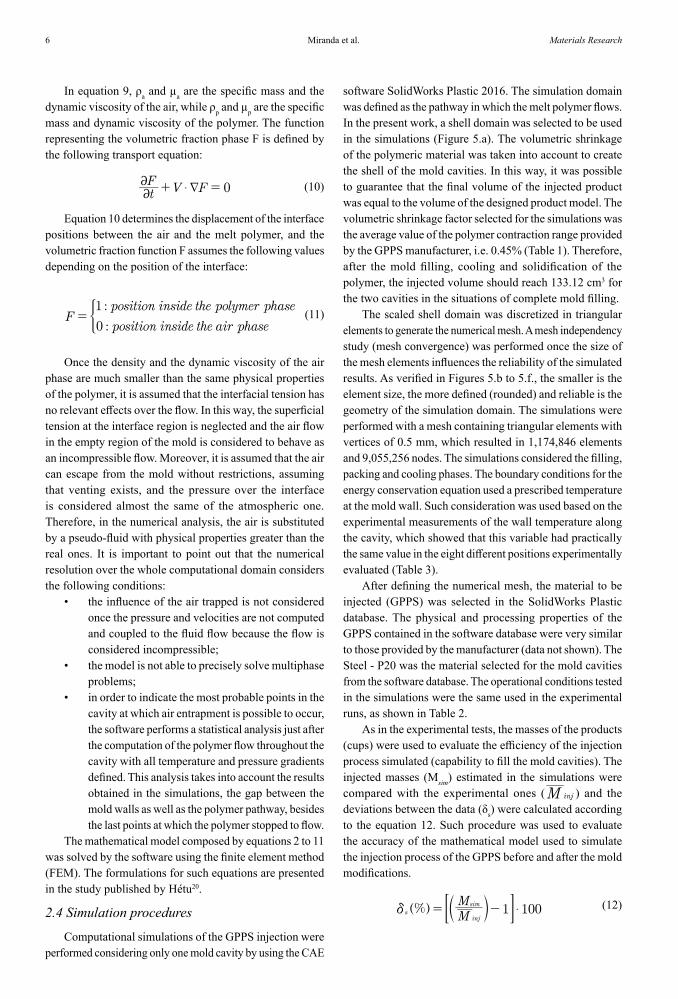
software SolidWorks Plastic 2016. The simulation domain was defined as the pathway in which the melt polymer flows. In the present work, a shell domain was selected to be used in the simulations (Figure 5.a). The volumetric shrinkage of the polymeric material was taken into account to create the shell of the mold cavities. In this way, it was possible to guarantee that the final volume of the injected product was equal to the volume of the designed product model. The volumetric shrinkage factor selected for the simulations was the average value of the polymer contraction range provided by the GPPS manufacturer, i.e. 0.45% (Table 1). Therefore, after the mold filling, cooling and solidification of the polymer, the injected volume should reach 133.12 cm3 for the two cavities in the situations of complete mold filling.
The scaled shell domain was discretized in triangular elements to generate the numerical mesh. A mesh independency study (mesh convergence) was performed once the size of the mesh elements influences the reliability of the simulated results. As verified in Figures 5.b to 5.f., the smaller is the element size, the more defined (rounded) and reliable is the geometry of the simulation domain. The simulations were performed with a mesh containing triangular elements with vertices of 0.5 mm, which resulted in 1,174,846 elements and 9,055,256 nodes. The simulations considered the filling, packing and cooling phases. The boundary conditions for the energy conservation equation used a prescribed temperature at the mold wall. Such consideration was used based on the experimental measurements of the wall temperature along the cavity, which showed that this variable had practically the same value in the eight different positions experimentally evaluated (Table 3).
After defining the numerical mesh, the material to be injected (GPPS) was selected in the SolidWorks Plastic database. The physical and processing properties of the GPPS contained in the software database were very similar to those provided by the manufacturer (data not shown). The Steel - P20 was the material selected for the mold cavities from the software database. The operational conditions tested in the simulations were the same used in the experimental runs, as shown in Table 2.
As in the experimental tests, the masses of the products (cups) were used to evaluate the efficiency of the injection process simulated (capability to fill the mold cavities). The injected masses (Msim) estimated in the simulations were compared with the experimental ones ( M inj ) and the deviations between the data (δs) were calculated according to the equation 12. Such procedure was used to evaluate the accuracy of the mathematical model used to simulate the injection process of the GPPS before and after the mold modifications.
(12)%MM
1 100sinj
sim$d = -Q TV Y# &
tF V F 0$2
2d+ =
:
:F
position inside the polymer phase
position inside the air phase
1
0= G
7Simulation of an Injection Process Using a CAE Tool: Assessment of Operational Conditions and Mold Design on the Process Efficiency
3. Results and Discussion
The results are presented and discussed in this section according to the design of the mold, i.e. before and after its modifications. Firstly, the experimental and simulation results obtained with the mold with no venting system are shown. Hereafter, the experimental and simulation results generated with the modified mold (considering air vents) are displayed and discussed.
3.1 First set of experimental runs: mold with no venting system
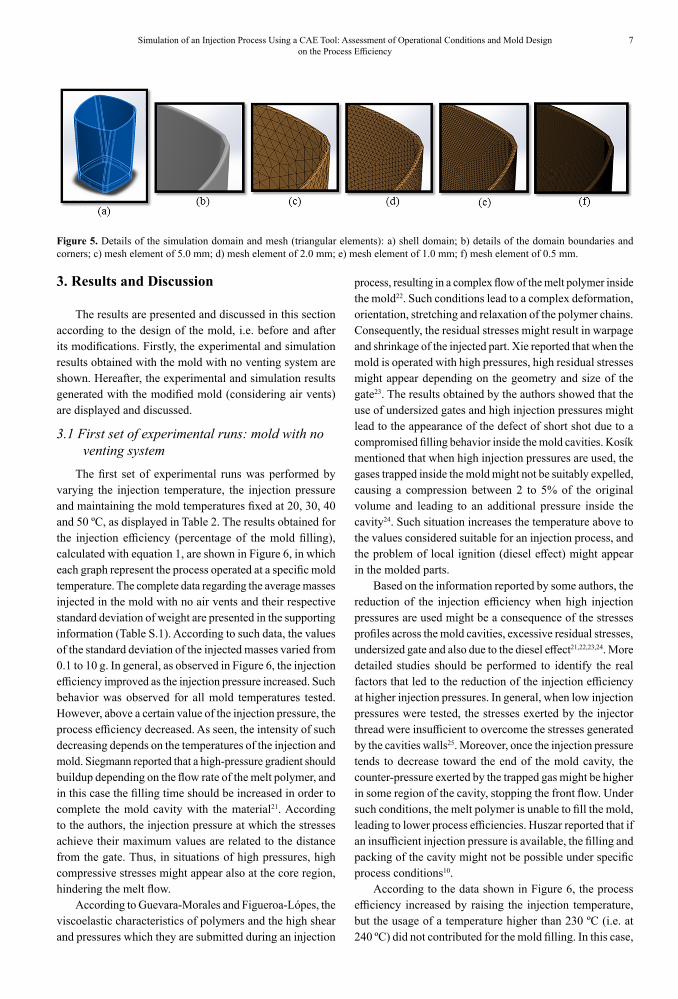
The first set of experimental runs was performed by varying the injection temperature, the injection pressure and maintaining the mold temperatures fixed at 20, 30, 40 and 50 ºC, as displayed in Table 2. The results obtained for the injection efficiency (percentage of the mold filling), calculated with equation 1, are shown in Figure 6, in which each graph represent the process operated at a specific mold temperature. The complete data regarding the average masses injected in the mold with no air vents and their respective standard deviation of weight are presented in the supporting information (Table S.1). According to such data, the values of the standard deviation of the injected masses varied from 0.1 to 10 g. In general, as observed in Figure 6, the injection efficiency improved as the injection pressure increased. Such behavior was observed for all mold temperatures tested. However, above a certain value of the injection pressure, the process efficiency decreased. As seen, the intensity of such decreasing depends on the temperatures of the injection and mold. Siegmann reported that a high-pressure gradient should buildup depending on the flow rate of the melt polymer, and in this case the filling time should be increased in order to complete the mold cavity with the material21. According to the authors, the injection pressure at which the stresses achieve their maximum values are related to the distance from the gate. Thus, in situations of high pressures, high compressive stresses might appear also at the core region, hindering the melt flow.
According to Guevara-Morales and Figueroa-Lópes, the viscoelastic characteristics of polymers and the high shear and pressures which they are submitted during an injection
process, resulting in a complex flow of the melt polymer inside the mold22. Such conditions lead to a complex deformation, orientation, stretching and relaxation of the polymer chains. Consequently, the residual stresses might result in warpage and shrinkage of the injected part. Xie reported that when the mold is operated with high pressures, high residual stresses might appear depending on the geometry and size of the gate23. The results obtained by the authors showed that the use of undersized gates and high injection pressures might lead to the appearance of the defect of short shot due to a compromised filling behavior inside the mold cavities. Kosík mentioned that when high injection pressures are used, the gases trapped inside the mold might not be suitably expelled, causing a compression between 2 to 5% of the original volume and leading to an additional pressure inside the cavity24. Such situation increases the temperature above to the values considered suitable for an injection process, and the problem of local ignition (diesel effect) might appear in the molded parts.
Based on the information reported by some authors, the reduction of the injection efficiency when high injection pressures are used might be a consequence of the stresses profiles across the mold cavities, excessive residual stresses, undersized gate and also due to the diesel effect21,22,23,24. More detailed studies should be performed to identify the real factors that led to the reduction of the injection efficiency at higher injection pressures. In general, when low injection pressures were tested, the stresses exerted by the injector thread were insufficient to overcome the stresses generated by the cavities walls25. Moreover, once the injection pressure tends to decrease toward the end of the mold cavity, the counter-pressure exerted by the trapped gas might be higher in some region of the cavity, stopping the front flow. Under such conditions, the melt polymer is unable to fill the mold, leading to lower process efficiencies. Huszar reported that if an insufficient injection pressure is available, the filling and packing of the cavity might not be possible under specific process conditions10.
According to the data shown in Figure 6, the process efficiency increased by raising the injection temperature, but the usage of a temperature higher than 230 ºC (i.e. at 240 ºC) did not contributed for the mold filling. In this case,
Figure 5. Details of the simulation domain and mesh (triangular elements): a) shell domain; b) details of the domain boundaries and corners; c) mesh element of 5.0 mm; d) mesh element of 2.0 mm; e) mesh element of 1.0 mm; f) mesh element of 0.5 mm.
Miranda et al.8 Materials Research
Figure 6. Injection efficiencies obtained with the original mold (no venting system) by varying the injection pressure and temperature for distinct situations of mold temperatures: a) 20 ºC; b) 30 ºC; c) 40 ºC; d) 50 ºC.
too high injection temperatures resulted in a reduction of the injected masses, which can be related to the decrease of the polymer density. Therefore, less polymer mass is charged in the screw antechamber. In other words, increasing too much the system temperature lowered the polymer mass available for injection. In addition, increasing the temperature of the melt polymer also decreases the viscosity of the material, thus the inner resistance of the polymer to deformation falls and the flow length increases even at a constant injection pressure. While the inner resistance might dominate the flow length at low temperatures, the same behavior might be expected at too high injection temperatures due to a higher deformation rate and, consequently, the development of high stresses in core flow. At high temperatures, the entrapped and compressed hot air, which is in the cavity before the polymer enters, might disrupt the flow of the melt polymer due to excessive shear stresses, leading to an incomplete mold filling and, in some cases, to the diesel effect (dieseling)26. Lopez verified that the increase of the injection temperature
only resulted in a reduction of the injected mass in the first half of the mold27. The opposite behavior was observed in the second half of the cavity. In contrast to such findings, the authors reported that the references used by them stated that an increase in the injection temperature might lead to a reduction of the injected mass.
Regarding the mold temperatures, the findings shown in Figures 6.a to 6.c revealed that the injected masses increased by raising the mold temperature from 20 to 40 ºC. As reported by Chen, the higher are the temperatures close to the mold walls, the smaller is the heat flow between the molten polymer and the mold walls, resulting in a hot polymer less viscous in these regions28. A consequence of this phenomenon is the reduction of the frozen layer thickness, which contributes to an easier flow of the molten polymer toward the final boundary of the mold cavities. When the mold temperature raised from 40 to 50 ºC (Figure 6.d), the injection efficiency decreased. In fact, rising the mold temperature lowers the residual stresses, minimizing problems such as shrinkage.
9Simulation of an Injection Process Using a CAE Tool: Assessment of Operational Conditions and Mold Design on the Process Efficiency
But, if too high mold temperatures are used in the processes, the growth of the frozen layer reduces and the remaining cross section for polymer flow becomes thicker. This should reduce the flow front velocity and the stresses generated inside the melt polymer. Nevertheless, the decrease of the polymer viscosity due to a higher temperature along the cross section might compete with this phenomenon. Such behavior may lead to the arising of residual stresses in the polymer flow due to high shear rate values associated with the reduction of the molten polymer viscosity, as in the case of too high injection temperatures29,30. Another factor that should be considered in this analysis is the constant and slow cooling of the melt polymer. In this case, the higher temperature of the polymer in the solidification phase was followed by an increase in the density of the material, reducing the injected mass31. As stated by Hassan, the raising of the holding pressure time during the cooling phase is a strategy that might overcome this problem, providing an injected part with a higher weight31,32.
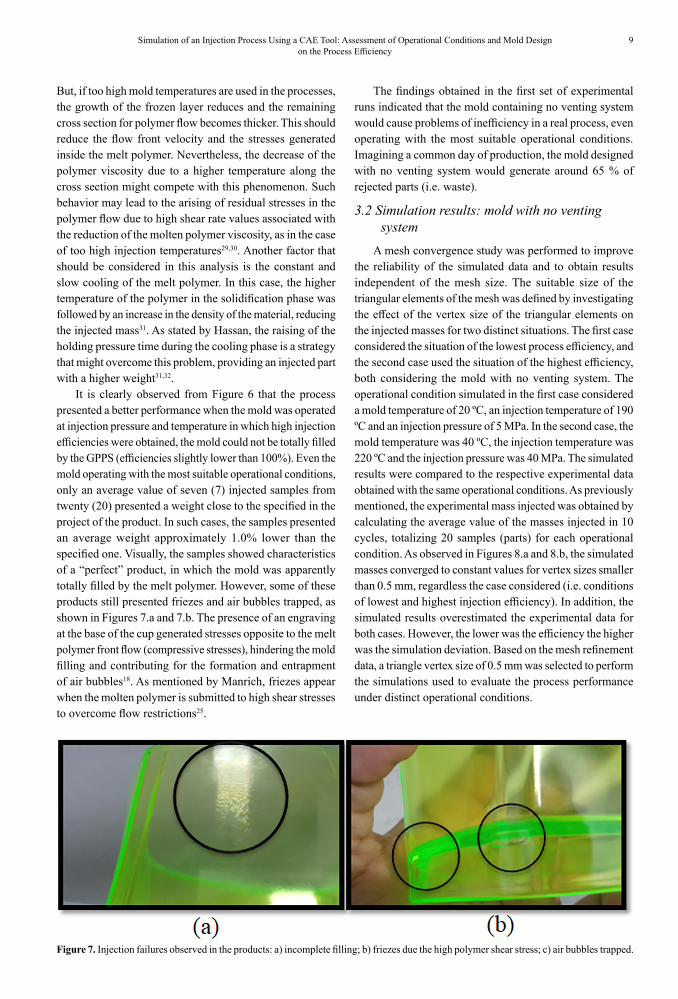
It is clearly observed from Figure 6 that the process presented a better performance when the mold was operated at injection pressure and temperature in which high injection efficiencies were obtained, the mold could not be totally filled by the GPPS (efficiencies slightly lower than 100%). Even the mold operating with the most suitable operational conditions, only an average value of seven (7) injected samples from twenty (20) presented a weight close to the specified in the project of the product. In such cases, the samples presented an average weight approximately 1.0% lower than the specified one. Visually, the samples showed characteristics of a “perfect” product, in which the mold was apparently totally filled by the melt polymer. However, some of these products still presented friezes and air bubbles trapped, as shown in Figures 7.a and 7.b. The presence of an engraving at the base of the cup generated stresses opposite to the melt polymer front flow (compressive stresses), hindering the mold filling and contributing for the formation and entrapment of air bubbles18. As mentioned by Manrich, friezes appear when the molten polymer is submitted to high shear stresses to overcome flow restrictions25.
Figure 7. Injection failures observed in the products: a) incomplete filling; b) friezes due the high polymer shear stress; c) air bubbles trapped.
The findings obtained in the first set of experimental runs indicated that the mold containing no venting system would cause problems of inefficiency in a real process, even operating with the most suitable operational conditions. Imagining a common day of production, the mold designed with no venting system would generate around 65 % of rejected parts (i.e. waste).
3.2 Simulation results: mold with no venting system
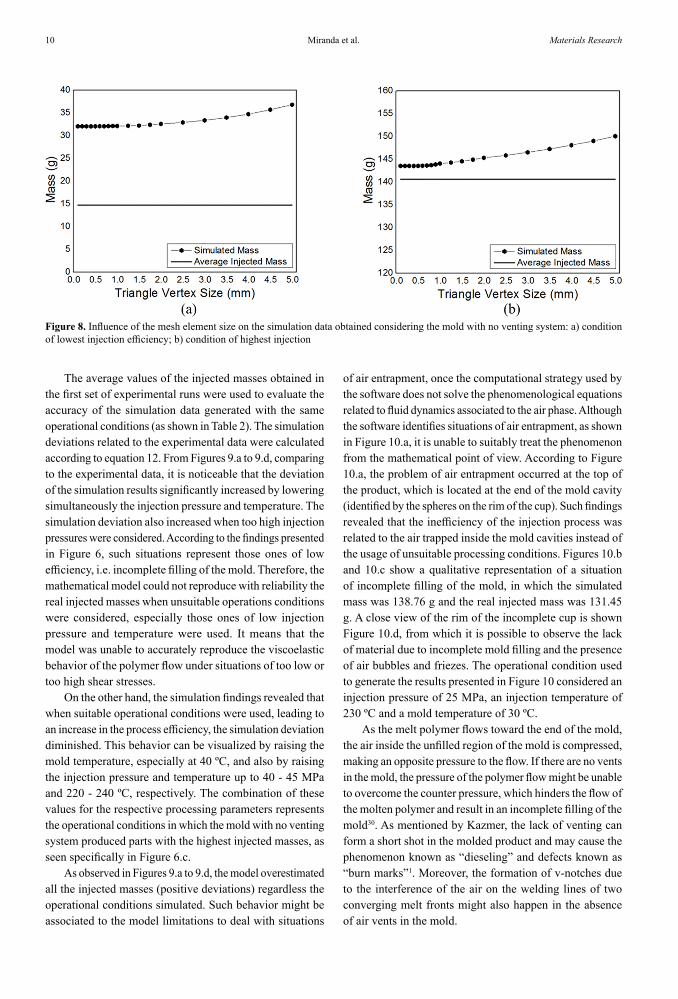
A mesh convergence study was performed to improve the reliability of the simulated data and to obtain results independent of the mesh size. The suitable size of the triangular elements of the mesh was defined by investigating the effect of the vertex size of the triangular elements on the injected masses for two distinct situations. The first case considered the situation of the lowest process efficiency, and the second case used the situation of the highest efficiency, both considering the mold with no venting system. The operational condition simulated in the first case considered a mold temperature of 20 ºC, an injection temperature of 190 ºC and an injection pressure of 5 MPa. In the second case, the mold temperature was 40 ºC, the injection temperature was 220 ºC and the injection pressure was 40 MPa. The simulated results were compared to the respective experimental data obtained with the same operational conditions. As previously mentioned, the experimental mass injected was obtained by calculating the average value of the masses injected in 10 cycles, totalizing 20 samples (parts) for each operational condition. As observed in Figures 8.a and 8.b, the simulated masses converged to constant values for vertex sizes smaller than 0.5 mm, regardless the case considered (i.e. conditions of lowest and highest injection efficiency). In addition, the simulated results overestimated the experimental data for both cases. However, the lower was the efficiency the higher was the simulation deviation. Based on the mesh refinement data, a triangle vertex size of 0.5 mm was selected to perform the simulations used to evaluate the process performance under distinct operational conditions.
Miranda et al.10 Materials Research
Figure 8. Influence of the mesh element size on the simulation data obtained considering the mold with no venting system: a) condition of lowest injection efficiency; b) condition of highest injection
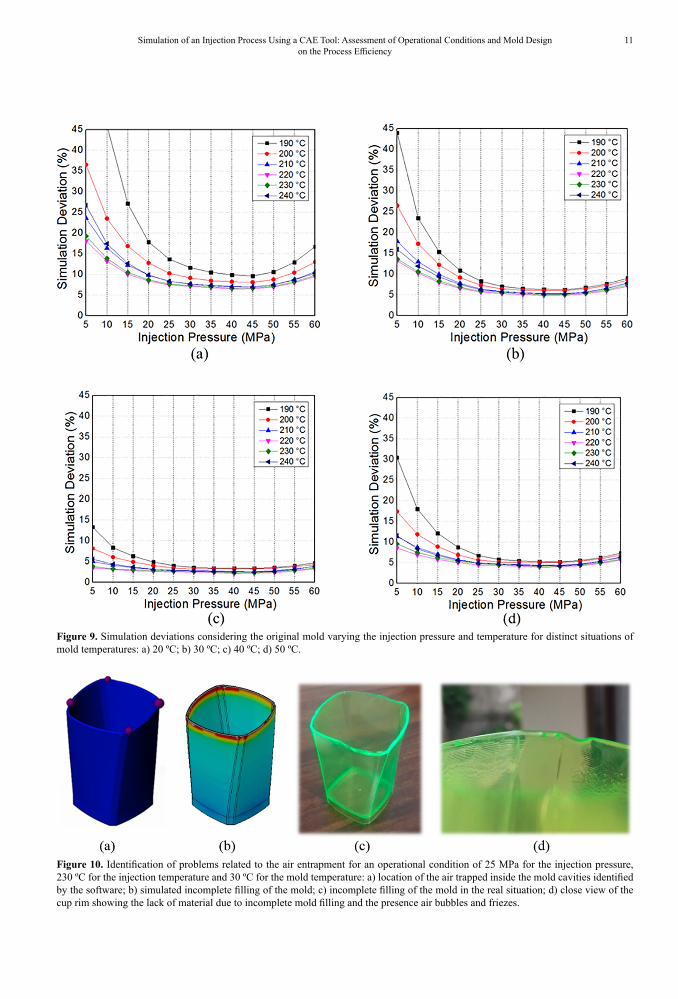
The average values of the injected masses obtained in the first set of experimental runs were used to evaluate the accuracy of the simulation data generated with the same operational conditions (as shown in Table 2). The simulation deviations related to the experimental data were calculated according to equation 12. From Figures 9.a to 9.d, comparing to the experimental data, it is noticeable that the deviation of the simulation results significantly increased by lowering simultaneously the injection pressure and temperature. The simulation deviation also increased when too high injection pressures were considered. According to the findings presented in Figure 6, such situations represent those ones of low efficiency, i.e. incomplete filling of the mold. Therefore, the mathematical model could not reproduce with reliability the real injected masses when unsuitable operations conditions were considered, especially those ones of low injection pressure and temperature were used. It means that the model was unable to accurately reproduce the viscoelastic behavior of the polymer flow under situations of too low or too high shear stresses.
On the other hand, the simulation findings revealed that when suitable operational conditions were used, leading to an increase in the process efficiency, the simulation deviation diminished. This behavior can be visualized by raising the mold temperature, especially at 40 ºC, and also by raising the injection pressure and temperature up to 40 - 45 MPa and 220 - 240 ºC, respectively. The combination of these values for the respective processing parameters represents the operational conditions in which the mold with no venting system produced parts with the highest injected masses, as seen specifically in Figure 6.c.
As observed in Figures 9.a to 9.d, the model overestimated all the injected masses (positive deviations) regardless the operational conditions simulated. Such behavior might be associated to the model limitations to deal with situations
of air entrapment, once the computational strategy used by the software does not solve the phenomenological equations related to fluid dynamics associated to the air phase. Although the software identifies situations of air entrapment, as shown in Figure 10.a, it is unable to suitably treat the phenomenon from the mathematical point of view. According to Figure 10.a, the problem of air entrapment occurred at the top of the product, which is located at the end of the mold cavity (identified by the spheres on the rim of the cup). Such findings revealed that the inefficiency of the injection process was related to the air trapped inside the mold cavities instead of the usage of unsuitable processing conditions. Figures 10.b and 10.c show a qualitative representation of a situation of incomplete filling of the mold, in which the simulated mass was 138.76 g and the real injected mass was 131.45 g. A close view of the rim of the incomplete cup is shown Figure 10.d, from which it is possible to observe the lack of material due to incomplete mold filling and the presence of air bubbles and friezes. The operational condition used to generate the results presented in Figure 10 considered an injection pressure of 25 MPa, an injection temperature of 230 ºC and a mold temperature of 30 ºC.
As the melt polymer flows toward the end of the mold, the air inside the unfilled region of the mold is compressed, making an opposite pressure to the flow. If there are no vents in the mold, the pressure of the polymer flow might be unable to overcome the counter pressure, which hinders the flow of the molten polymer and result in an incomplete filling of the mold30. As mentioned by Kazmer, the lack of venting can form a short shot in the molded product and may cause the phenomenon known as “dieseling” and defects known as “burn marks”1. Moreover, the formation of v-notches due to the interference of the air on the welding lines of two converging melt fronts might also happen in the absence of air vents in the mold.
11Simulation of an Injection Process Using a CAE Tool: Assessment of Operational Conditions and Mold Design on the Process Efficiency
Figure 9. Simulation deviations considering the original mold varying the injection pressure and temperature for distinct situations of mold temperatures: a) 20 ºC; b) 30 ºC; c) 40 ºC; d) 50 ºC.
Figure 10. Identification of problems related to the air entrapment for an operational condition of 25 MPa for the injection pressure, 230 ºC for the injection temperature and 30 ºC for the mold temperature: a) location of the air trapped inside the mold cavities identified by the software; b) simulated incomplete filling of the mold; c) incomplete filling of the mold in the real situation; d) close view of the cup rim showing the lack of material due to incomplete mold filling and the presence air bubbles and friezes.
Miranda et al.12 Materials Research
3.3 Mold considering a venting system: simulation and experimental results
According to the experimental and simulated results, there were regions in the mold in which the thermoplastic faced difficulties to flow, leading to an incomplete filling of the cavities (inefficient injection). The simulation results indicated that the main reason for such behavior was the air trapped at the top rim of the cup (end part of the mold cavity) that hindered the flow of the melt polymer throughout the mold.
In order to overcome this problem and improve the injection efficiency, venting was proposed to be executed on the parting line of the original mold. In this way, the gas contained in the unfilled region of the cavity would be released outwards the mold as the polymer front advances toward the end of the cavity. Consequently, it was expected that the melt polymer flows easily inside the mold cavities up to their complete filling1,30,33. As the mathematical model used to simulate the behavior of the mold with no venting reproduced reasonably well the real process, the modifications were firstly executed in the virtual project of the mold using the software SolidWorks. Then, simulations with the modified mold were performed using the package SolidWorks Plastic to evaluate the impact of the venting system in the process performance. All the operational conditions presented in Table 2 were simulated and the results demonstrated an increase of the injected masses (results not shown). Once the simulated findings showed an improvement of the process performance, the vents were machined in the real mold and a second set of experimental tests was carried out. The complete data regarding the average masses injected with the modified mold and their respective standard deviations of weight are presented in the supporting information (Table S.2). According to such data, the standard deviation of the injected masses drastically reduced from 101 - 10-1 g for the original mold (with no venting) to 10-2 - 10-3 g when using the modified mold (with venting). The experimental results obtained with the modified mold operating with the same conditions tested in the original mold (shown in Table 2) are depicted in Figure 11.
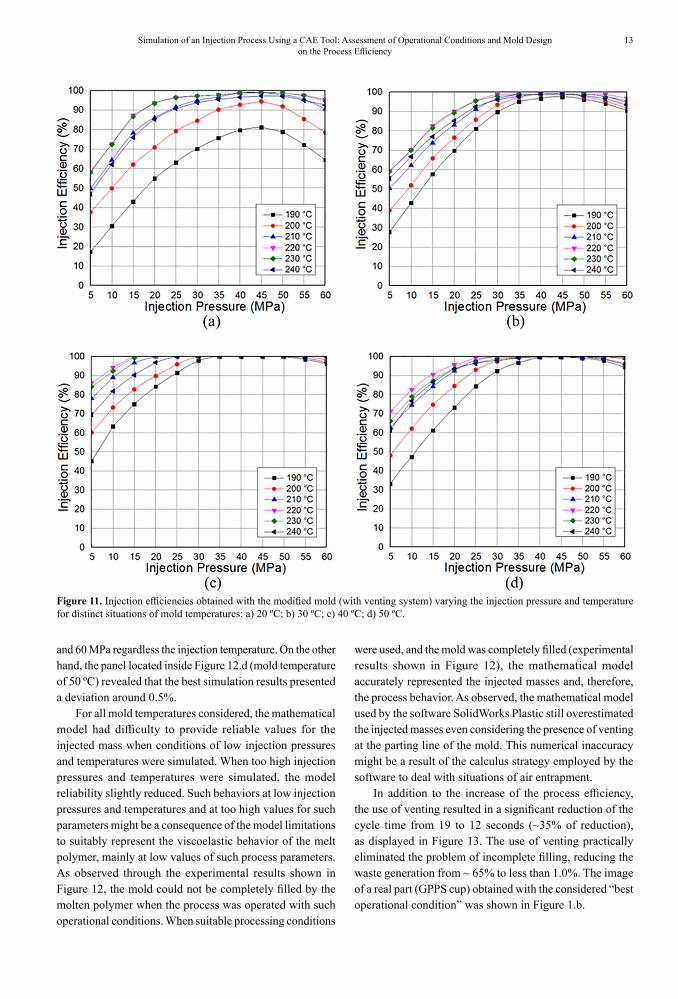
Although the results displayed in Figure 11 showed that the process efficiencies obtained with mold temperatures of 20 and 30 ºC were higher than those obtained with the same conditions in the mold without vents (Figures 6.a and 6.b), the efficiencies values were still low. Nevertheless, there was a significant improvement of the injection efficiency by raising the mold temperature to 40 and 50 ºC if the results are compared to those ones obtained with the original mold (Figures 6.c and 6.d). For both mold temperatures (40 and 50ºC), it was possible to completely fill the mold with the melt polymer, leading to injection efficiencies of 100%. Observing the results for the mold temperature of 40 ºC, it is noticeable that the mold could be completely filled with hot polymer in a wide range of injection pressures and temperatures. The
range of such values reduced when the mold was operated at 50 ºC, but it was still possible to produce parts with good quality, specifically between 40 and 50 MPa. Such findings proved that the problem of low efficiency, characterized by an incomplete mold filling, could be overcome by machining air vents on the parting line of the mold. According to Kazmer, venting is frequently neglected in mold design until molding trials indicate inadequacies related to venting, as the case of the mold studied in this work1.
The difficulties to completely fill the mold with melt polymer in the situations of low mold temperatures (20 and 30 ºC), mainly when injection pressures and temperatures were too low or too high, are a consequence of unsuitable operational conditions. Low mold temperatures contributed to a high heat exchange between the melt polymer and the mold wall, thickening the frozen layer and narrowing the flow pathway of the hot polymer28. If an insufficient injection pressure is used, the filling and packing of the cavity may not be possible under certain operational conditions10. Moreover, when low pressures are used, the velocity of the flow front is also low, allowing a faster solidification of the polymer. This phenomenon raises the frozen layer thickness and, in the worst case, may result in an incomplete filling of the mold due to a premature cooling and solidification of the polymer at the inner flow34.
The injection efficiency was low when using too high injection pressures and temperatures in a similar way that one verified in the situations using the mold with no venting. Such results may suggest that the venting might have not been well designed. At high injection pressures and/or temperatures, the flow front velocity increases and the filling time should reduce. In this case, the air trapped might had not enough time to escape from the cavity and the counter pressure due to the trapped gas hindered the advance of the melt polymer toward the end of the mold cavity. Consequently, lower masses were injected when compared to the masses injected with intermediate pressures and temperatures. In such specific conditions (too high injection pressures and/or temperatures), the filling and/or the packing time should be increased as an attempt to improve the injection efficiency by expulsing all the air trapped in the mold.
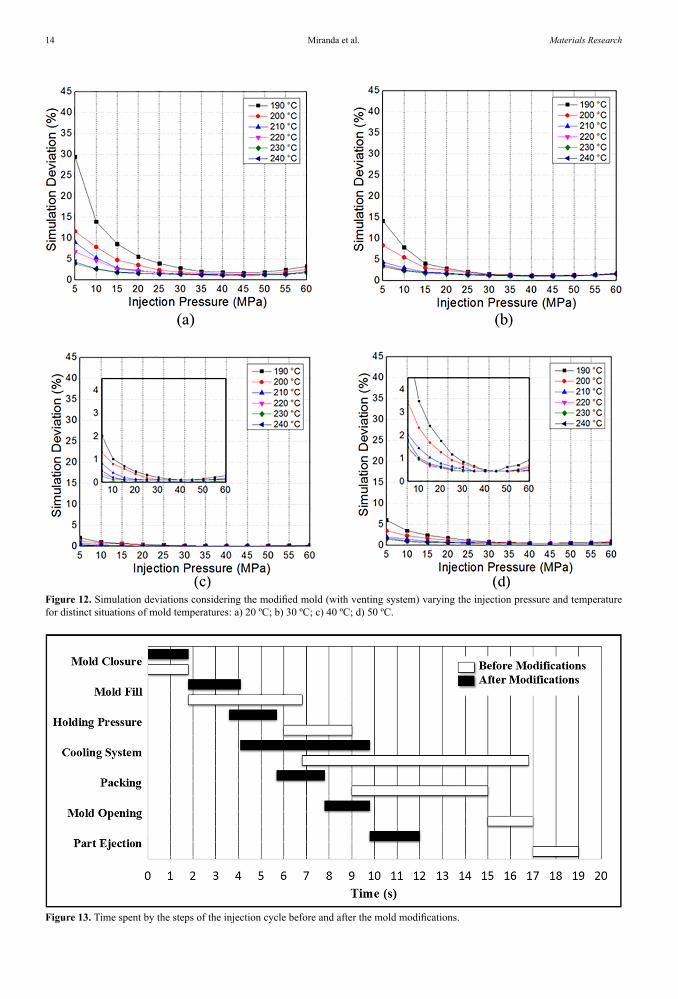
By comparing the simulation deviation of the injected masses considering the original and the modified mold (Figures 9 and 12, respectively), it possible to observe that there was an increase of the capability of the mathematical model to predict the injected masses when the simulations were performed with the mold with a venting system. As seen in Figure 12, there was a reduction of the simulation deviation by increasing the mold temperature from 20 to 40 ºC. When the mold temperature increased from 40 to 50 ºC, the mathematical model diminished its capability to predict the injected masses. As seen in the panel located inside Figure 12.c (mold temperature of 40 ºC), the simulation deviations were very low (~ 0.1%) in the range between 20
13Simulation of an Injection Process Using a CAE Tool: Assessment of Operational Conditions and Mold Design on the Process Efficiency
Figure 11. Injection efficiencies obtained with the modified mold (with venting system) varying the injection pressure and temperature for distinct situations of mold temperatures: a) 20 ºC; b) 30 ºC; c) 40 ºC; d) 50 ºC.
and 60 MPa regardless the injection temperature. On the other hand, the panel located inside Figure 12.d (mold temperature of 50 ºC) revealed that the best simulation results presented a deviation around 0.5%.
For all mold temperatures considered, the mathematical model had difficulty to provide reliable values for the injected mass when conditions of low injection pressures and temperatures were simulated. When too high injection pressures and temperatures were simulated, the model reliability slightly reduced. Such behaviors at low injection pressures and temperatures and at too high values for such parameters might be a consequence of the model limitations to suitably represent the viscoelastic behavior of the melt polymer, mainly at low values of such process parameters. As observed through the experimental results shown in Figure 12, the mold could not be completely filled by the molten polymer when the process was operated with such operational conditions. When suitable processing conditions
were used, and the mold was completely filled (experimental results shown in Figure 12), the mathematical model accurately represented the injected masses and, therefore, the process behavior. As observed, the mathematical model used by the software SolidWorks Plastic still overestimated the injected masses even considering the presence of venting at the parting line of the mold. This numerical inaccuracy might be a result of the calculus strategy employed by the software to deal with situations of air entrapment.
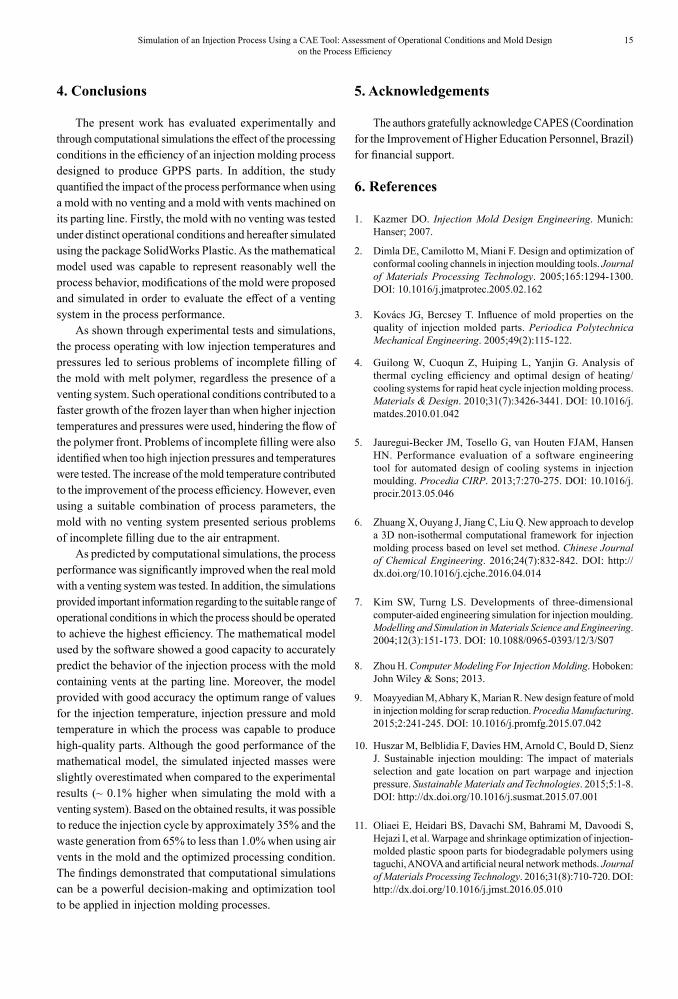
In addition to the increase of the process efficiency, the use of venting resulted in a significant reduction of the cycle time from 19 to 12 seconds (~35% of reduction), as displayed in Figure 13. The use of venting practically eliminated the problem of incomplete filling, reducing the waste generation from ~ 65% to less than 1.0%. The image of a real part (GPPS cup) obtained with the considered “best operational condition” was shown in Figure 1.b.
Miranda et al.14 Materials Research
Figure 12. Simulation deviations considering the modified mold (with venting system) varying the injection pressure and temperature for distinct situations of mold temperatures: a) 20 ºC; b) 30 ºC; c) 40 ºC; d) 50 ºC.
Figure 13. Time spent by the steps of the injection cycle before and after the mold modifications.
15Simulation of an Injection Process Using a CAE Tool: Assessment of Operational Conditions and Mold Design on the Process Efficiency
4. Conclusions
The present work has evaluated experimentally and through computational simulations the effect of the processing conditions in the efficiency of an injection molding process designed to produce GPPS parts. In addition, the study quantified the impact of the process performance when using a mold with no venting and a mold with vents machined on its parting line. Firstly, the mold with no venting was tested under distinct operational conditions and hereafter simulated using the package SolidWorks Plastic. As the mathematical model used was capable to represent reasonably well the process behavior, modifications of the mold were proposed and simulated in order to evaluate the effect of a venting system in the process performance.
As shown through experimental tests and simulations, the process operating with low injection temperatures and pressures led to serious problems of incomplete filling of the mold with melt polymer, regardless the presence of a venting system. Such operational conditions contributed to a faster growth of the frozen layer than when higher injection temperatures and pressures were used, hindering the flow of the polymer front. Problems of incomplete filling were also identified when too high injection pressures and temperatures were tested. The increase of the mold temperature contributed to the improvement of the process efficiency. However, even using a suitable combination of process parameters, the mold with no venting system presented serious problems of incomplete filling due to the air entrapment.
As predicted by computational simulations, the process performance was significantly improved when the real mold with a venting system was tested. In addition, the simulations provided important information regarding to the suitable range of operational conditions in which the process should be operated to achieve the highest efficiency. The mathematical model used by the software showed a good capacity to accurately predict the behavior of the injection process with the mold containing vents at the parting line. Moreover, the model provided with good accuracy the optimum range of values for the injection temperature, injection pressure and mold temperature in which the process was capable to produce high-quality parts. Although the good performance of the mathematical model, the simulated injected masses were slightly overestimated when compared to the experimental results (~ 0.1% higher when simulating the mold with a venting system). Based on the obtained results, it was possible to reduce the injection cycle by approximately 35% and the waste generation from 65% to less than 1.0% when using air vents in the mold and the optimized processing condition. The findings demonstrated that computational simulations can be a powerful decision-making and optimization tool to be applied in injection molding processes.
5. Acknowledgements
The authors gratefully acknowledge CAPES (Coordination for the Improvement of Higher Education Personnel, Brazil) for financial support.
6. References
1. Kazmer DO. Injection Mold Design Engineering. Munich: Hanser; 2007.
2. Dimla DE, Camilotto M, Miani F. Design and optimization of conformal cooling channels in injection moulding tools. Journal of Materials Processing Technology. 2005;165:1294-1300. DOI: 10.1016/j.jmatprotec.2005.02.162
3. Kovács JG, Bercsey T. Influence of mold properties on the quality of injection molded parts. Periodica Polytechnica Mechanical Engineering. 2005;49(2):115-122.
4. Guilong W, Cuoqun Z, Huiping L, Yanjin G. Analysis of thermal cycling efficiency and optimal design of heating/cooling systems for rapid heat cycle injection molding process. Materials & Design. 2010;31(7):3426-3441. DOI: 10.1016/j.matdes.2010.01.042
5. Jauregui-Becker JM, Tosello G, van Houten FJAM, Hansen HN. Performance evaluation of a software engineering tool for automated design of cooling systems in injection moulding. Procedia CIRP. 2013;7:270-275. DOI: 10.1016/j.procir.2013.05.046
6. Zhuang X, Ouyang J, Jiang C, Liu Q. New approach to develop a 3D non-isothermal computational framework for injection molding process based on level set method. Chinese Journal of Chemical Engineering. 2016;24(7):832-842. DOI: http://dx.doi.org/10.1016/j.cjche.2016.04.014
7. Kim SW, Turng LS. Developments of three-dimensional computer-aided engineering simulation for injection moulding. Modelling and Simulation in Materials Science and Engineering. 2004;12(3):151-173. DOI: 10.1088/0965-0393/12/3/S07
8. Zhou H. Computer Modeling For Injection Molding. Hoboken: John Wiley & Sons; 2013.
9. Moayyedian M, Abhary K, Marian R. New design feature of mold in injection molding for scrap reduction. Procedia Manufacturing. 2015;2:241-245. DOI: 10.1016/j.promfg.2015.07.042
10. Huszar M, Belblidia F, Davies HM, Arnold C, Bould D, Sienz J. Sustainable injection moulding: The impact of materials selection and gate location on part warpage and injection pressure. Sustainable Materials and Technologies. 2015;5:1-8. DOI: http://dx.doi.org/10.1016/j.susmat.2015.07.001
11. Oliaei E, Heidari BS, Davachi SM, Bahrami M, Davoodi S, Hejazi I, et al. Warpage and shrinkage optimization of injection-molded plastic spoon parts for biodegradable polymers using taguchi, ANOVA and artificial neural network methods. Journal of Materials Processing Technology. 2016;31(8):710-720. DOI: http://dx.doi.org/10.1016/j.jmst.2016.05.010
Miranda et al.16 Materials Research
12. Guerrier P, Tosello G, Hattel JH. Flow visualization and simulation of the filling process during injection molding. CIRP Journal of Manufacturing Science and Technology. 2017;16:12-20. DOI: http://dx.doi.org/10.1016/j.cirpj.2016.08.002
13. Kapila A, Singh K, Arora G, Agarwal N. Effect of varying gate size on the air traps in injection molding. International Journal of Current Engineering and Technology. 2015;5(1):161-166.
14. Kumar KRY, Nagaraja R. Significance of mold filling analysys for finding optimal gate location in injection molding process for bobbin. International Journal of Scientific and Research Publications. 2014;4(4):1-8.
15. Tada K, Fukuzawa D, Watanabe A, Ito H. Numerical simulation for flow behavior on micro- and nanomoulding. Plastics Rubber and Composites. 2010;39(7):321-326. DOI: 10.1179/174328910X12777566997252
16. Griffiths CA, Dimov SS, Scholz S, Tosello G. Cavity air flow behavior during filling in microinjection molding. Journal of Manufacturing Science and Engineering. 2011;133(6):1-10. DOI: 10.1115/1.400333
17. Innova. Data sheet of General Purpose Polystyrene. (GPPS - 1921). Available from: <http://www.innova.com.br/arquivos/documentos/produtos/PT-anvisa-gpps-1921-pdf-56687793a19b8.pdf>. Access in: 10/12/2018.
18. Goodship V. Troubleshooting Injection Moulding. Shawbury: Rapra; 2004.
19. Abdullanhi AA, Choudhury IA, Azuddin M. Effect of runner dimensions on cavity filling in micro-injection moulding for defect-free parts. ARPN Journal of Engineering and Applied Sciences. 2016;11(12):7788-7793.
20. Hétu JF, Gao DM, Garcia-Rejon A, Salloum G. 3D finite element method for the simulation of the filling stage in injection molding. Polymer Engineering & Science. 1998;38(2):223-236.
21. Siegmann A, Buchman A, Kenig S. Residual stresses in polymers III: The influence of injection-molding process conditions. Polymer Engineering & Science. 1982;22(9):560-568.
22. Guevara-Morales A, Figueroa-Lópes U. Residual stresses in injection molded products. Journal of Materials Science. 2014;49(13):4399-4415. DOI: 10.1007/s10853-014-8170-y
23. Xie P, Guo F, Jiao Z, Ding Y, Yang W. Effect of gate size on the melt filling behavior and residual stress of injection molded parts. Materials & Design. 2014;53:366-372. DOI: http://dx.doi.org/10.1016/j.matdes.2013.06.071
24. Košík M, Likavčan L, Bílik J, Martinkovič M. Diesel effect problem solving during injection moulding. Journal Slovakia University Technology. 2014;22:97-102.
25. Manrich S. Processamento de Termoplásticos. São Paulo: Artliber; 2013.
26. Postawa P, Kwiatkowski D. Residual stress distribution in injection molded parts. Journal of Achievements in Materials and Manufacturing Engineering. 2006;18(1-2):171-174.
27. López A, Aisa J, Martinez A, Mercado D. Injection moulding parameters influence on weight quality of complex parts by means of DOE application: Case study. Measurement. 2016;90:349-356. DOI: http://dx.doi.org/10.1016/j.measurement.2016.04.072
28. Chen SC, Chien RD, Lin SH, Lin MC, Chang JA. Feasibility evaluation of gas-assisted heating for mold surface temperature control during injection molding process. International Communications in Heat and Mass Transfer. 2009;36(8):806-812. DOI: 10.1016/j.icheatmasstransfer.2009.06.007
29. Pina-Estany J, Colominas C, Fraxedas J, Llobet J, Perez-Murano F, Puigoriol-Forcada JM, et al. A statistical analysis of nanocavities replication applied to injection moulding. International Communications in Heat and Mass Transfer. 2017;81:131-140. DOI: http://dx.doi.org/10.1016/j.icheatmasstransfer.2016.11.003
30. Kulkarni S. Robust Process Development and Scientific Molding - Theory and Practice. Munich: Hanser; 2010.
31. Hassan H, Regnier N, Arquis E, Defaye G. Effect of cooling channels position on the shrinkage of plastic material during injection molding. In: 19ème Congrès Français de Mécanique; 2009 Aug 24-28; Marseille, France. 6 p.
32. Hassan H, Regnier N, Le Bot C, Defaye G. 3D Study of cooling system effect on the heat transfer during polymer injection molding. International Journal of Thermal Sciences. 2010;49(1):161-169. DOI: 10.1016/j.ijthermalsci.2009.07.006
33. Menges G, Michaeli W, Mohren P. How to make injection molds. Munich: Hanser; 2001.
34. Sobachkin A, Dumnov G. Numerical basis of cad-embedded CFD. In: NAFEMS World Congress; 2013 Jun 9-12; Salzburg, Austria. 20 p.
Supplementary material
The following online material is available for this article:
Table S1. Table S2.


![[E-book] Diesel Fuel Injection System Simulation](https://img.pdfslide.us/doc/110x75/547ee70ab37959a22b8b5531/e-book-diesel-fuel-injection-system-simulation.jpg)