Embed Size (px)
Citation preview
Agricultural and Biosystems EngineeringPublications Agricultural and Biosystems Engineering
1994
Simulation of Ambient-air Drying of Fungicide-treated, High-moisture Corn in IowaSulaiman A. Al-YahyaKing Saud University
Carl J. BernIowa State University, [email protected]
Manjit K. MisraIowa State University, [email protected]
Follow this and additional works at: http://lib.dr.iastate.edu/abe_eng_pubs
Part of the Agriculture Commons, and the Bioresource and Agricultural Engineering Commons
The complete bibliographic information for this item can be found at http://lib.dr.iastate.edu/abe_eng_pubs/458. For information on how to cite this item, please visit http://lib.dr.iastate.edu/howtocite.html.
This Article is brought to you for free and open access by the Agricultural and Biosystems Engineering at Iowa State University Digital Repository. Ithas been accepted for inclusion in Agricultural and Biosystems Engineering Publications by an authorized administrator of Iowa State UniversityDigital Repository. For more information, please contact [email protected].
SIMULATION OF AMBIENT-AIR DRYING OF FUNGICIDE-
TREATED, HIGH-MOISTURE CORN IN IOWA
S. A. Al-Yahya, C. J. Bern, M. K. Misra
ABSTRACT. Twenty-six years ofDes Moines, Iowa, weather data were used in a computer simulation of ambient air drying offungi-resistant and fungi-susceptible corn hybrids treated with Rovral® fungicide. Drying of 20 and 24% moisture corn harvested 15 October was simulated. Compared with the susceptible corn hybrid (DF20xDF12) under the same conditions, the resistant corn hybrid (FR35xFR20) had lower airflow requirements and used less fan energy Rovral fungicide-treated corn had a lower rate of grain deterioration, required lower airflow rates, and used less fan energy than untreated corn. Keywords. Corn, Fungicides, Grain drying. Simulation,
Steele et al. (1969) studied deterioration of high-moisture com under aeration and measured effects of grain moisture content, grain storage temperature, and mechanical damage. These
researchers developed an equation for predicting CO2 evolution, their indicator of deterioration, at standard and constant conditions of 15.5° C (60° F), 25% moisture, and when 30% of the kernels had mechanical damage. They also developed multipliers for moisture, temperature, and mechanical damage for use under other than standard conditions. From their results, they concluded that when com has evolved over 7.35 g of C02/kg of dry matter (which corresponds to a loss of 0.5% of the original dry matter), its U.S. grade will drop one grade number due to mold damaged kemels. Wilcke et al. (1993) reported a drop from U.S. grade no. 1 to nos. 4 or 6 by the time combine-harvested com with 25% mechanical damage reached 0.5% dry matter loss.
Thompson (1972) used results of Steele (1967) to predict the amount of CO2 produced under the aforementioned "standard" conditions:
required to produce 7.32 g/kg of CO2 is predicted from the expression:
y - 1.3[ exp (0.006t) -1 ] + 0.015t (1)
where y = g of CO2 produced kilogram of dry matter t = time (h) Under standard conditions, when t = 230 h, then y =
7.32 g/kg, which is the end of the com's allowable storage time. If other than the standard conditions exist, the time
Article has been reviewed and approved for publication by the Food and Process Engineering Inst, of ASAE.
Journal Paper J-14633 of the Iowa Agriculture and Home Economics Experiment Station, Ames, Iowa. Project No. 2813. Research supported by Rhone-Poulenc Ag. Co. and the Iowa Agriculture and Home Economics Experiment Station.
The authors are Sulaiman A. Al-Yahya, ASAE Member Engineer, Assistant Professor, Agricultural Engineering Dept., King Saud University, Buraydh, Qassim, Saudi Arabia; Carl J. Bern, ASAE Fellow Engineer, Professor, and Manjit K. Misra, ASAE Member Engineer, Professor, Dept. of Agricultural and Biosystems Engineering, Iowa State University, Ames.
t==(230)M^MtMd (2)
where Mjjj = moisture multiplier M^ = temperature multiplier M(i = damage multiplier
Thompson (1972) developed equations for each multiplier for specific ranges of moisture and temperature, based on data from Steele (1967).
Ambient-air com drying is a slow (three to six weeks), in-storage drying process usually carried out within a cylindrical bin equipped with a full perforated floor and a positive-pressure, electric motor-driven fan. Because the process extends through most of the corn's allowable storage time, the com can be at risk of spoilage during natural air drying. Fungicide treatment at harvest has the potential to reduce spoilage risk by extending the com's allowable storage time (Al-Yahya et al., 1993; Wilcke et al., 1993; White et al., 1988).
Computer simulation models of ambient-air drying have been used to predict minimum airflow needed to dry com without excessive dry matter loss (Thompson, 1972; Morey et al., 1976; Van Ee, 1980; Wilcke, 1985; Stroshine and Yang, 1990). Procedures to account for harvest date, location, moisture content, weather data, com mechanical damage level, and variety have been developed, but none of the models account for effects of fungicide treatment.
Stroshine and Yang (1990) modified the model developed by Thompson (1972) and used it to investigate the effects of kemel mechanical damage and hybrid traits on 22% moisture com aerated at 2.23 m^/min-Mg (2.0 cfm/bu). To do this, hybrid multiplier, Mj , was added to equation 2. They developed hybrid multipliers, which account for a hybrid's resistance or susceptibility to storage fungi, using the data of Friday (1987) and Friday et al. (1989). Friday quantified the storage fungi resistance of several corn hybrids by use of CO2 evolution measurements on stored samples. Of hybrids tested, DF20XDF12 was susceptible and FR35xFR20 was most resistant to storage fungi.
VOL. 37(5): 1555-1560
Transactions of the ASAE
© 1994 American Society of Agricultural Engineers 0001-2351 / 94/ 3705-1555 1555
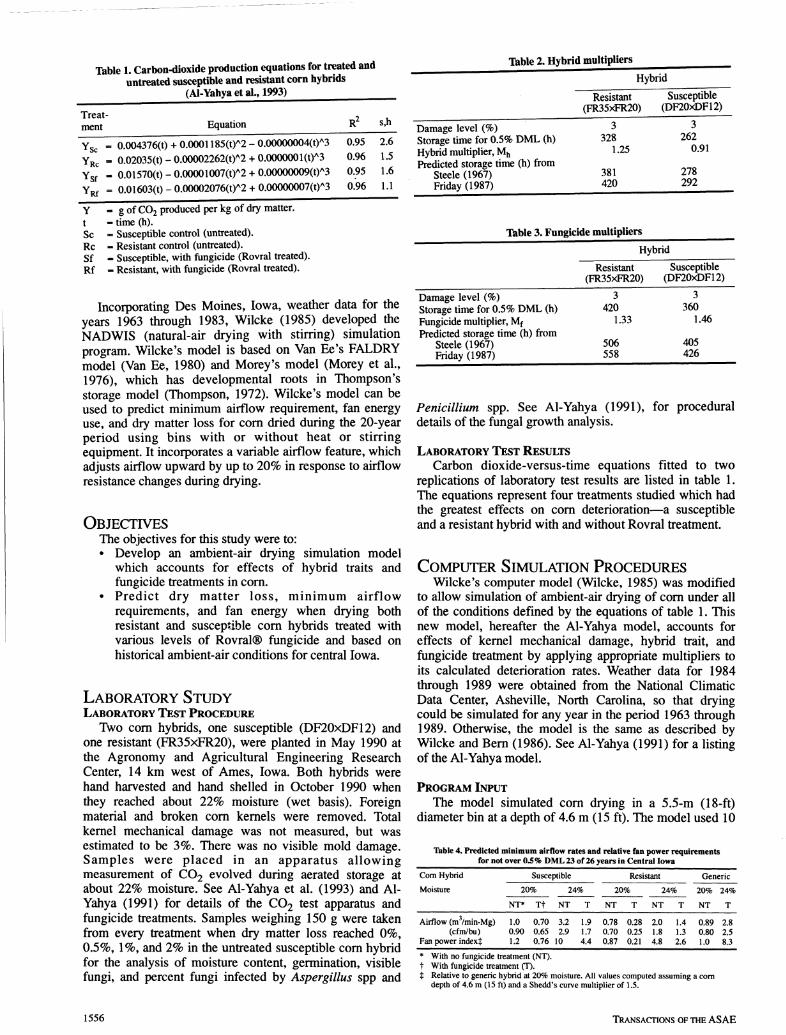
Table 1. Carbon-dioxide production equations for treated and untreated susceptible and resistant corn hybrids
(Al-Yahya et al., 1993)
T^ble 2. Hybrid multipliers
Treatment Equation R^ s,h
Ysc YRC
Ysf YRf
0.004376(t) + 0.0001185(1^2 - 0.00000004(t)^3 0.95 2.6 . 0.02035(t)-0.00002262(tr2 +0.00000010^3 0.96 1.5 . 0.01570(t)-0.00001007(tr2 + 0.00000009(tr3 0.95 1.6
= 0.01603(t) - 0.00002076(1^2 + 0.00000007(t)^3 0.96 1.1
Y = gofCOjproducedperkgof dry matter. t - time (h). Sc - Susceptible control (untreated). Re - Resistant control (untreated). Sf - Susceptible, with fungicide (Rovral treated). Rf - Resistant, with fungicide (Rovral treated).
Incorporating Des Moines, Iowa, weather data for the years 1963 through 1983, Wilcke (1985) developed the NADWIS (natural-air drying with stirring) simulation program. Wilcke's model is based on Van He's FALDRY model (Van Ee, 1980) and Morey's model (Morey et al., 1976), which has developmental roots in Thompson's storage model (Thompson, 1972). Wilcke's model can be used to predict minimum airflow requirement, fan energy use, and dry matter loss for com dried during the 20-year period using bins with or without heat or stirring equipment. It incorporates a variable airflow feature, which adjusts airflow upward by up to 20% in response to airflow resistance changes during drying.
OBJECTIVES The objectives for this study were to: • Develop an ambient-air drying simulation model
which accounts for effects of hybrid traits and fungicide treatments in com.
• Predict dry matter loss, minimum airflow requirements, and fan energy when drying both resistant and susceptible com hybrids treated with various levels of Rovral® fungicide and based on historical ambient-air conditions for central Iowa.
LABORATORY STUDY LABORATORY TEST PROCEDURE
Two com hybrids, one susceptible (DF20xDF12) and one resistant (FR35xFR20), were planted in May 1990 at the Agronomy and Agricultural Engineering Research Center, 14 km west of Ames, Iowa. Both hybrids were hand harvested and hand shelled in October 1990 when they reached about 22% moisture (wet basis). Foreign material and broken com kemels were removed. Total kemel mechanical damage was not measured, but was estimated to be 3%. There was no visible mold damage. Samples were placed in an apparatus allowing measurement of CO2 evolved during aerated storage at about 22% moisture. See Al-Yahya et al. (1993) and Al-Yahya (1991) for details of the CO2 test apparatus and fungicide treatments. Samples weighing 150 g were taken from every treatment when dry matter loss reached 0%, 0.5%, 1%, and 2% in the untreated susceptible com hybrid for the analysis of moisture content, germination, visible fungi, and percent fungi infected by Aspergillus spp and
Hybrid
Resistant Susceptible (FR35XFR20) (DF20xDF12)
Damage level (%) Storage time for 0.5% DML (h) Hybrid multiplier, M^ Predicted storage time (h) from
Steele (1967) Friday (1987)
3 328
1.25
381 420
3 262
0.91
278 292
Table 3. Fungicide multipliers
Hybrid
Damage level (%) Storage time for 0.5% DML (h) Fungicide multiplier, Mf Predicted storage time (h) from
Steele (1967) Friday (1987)
Resistant (FR35XFR20)
3 420
1.33
506 558
Susceptible (DF20XDF12)
3 360
1.46
405 426
Penicillium spp. See Al-Yahya (1991), for procedural details of the fungal growth analysis.
LABORATORY TEST RESULTS Carbon dioxide-versus-time equations fitted to two
replications of laboratory test results are listed in table 1. The equations represent four treatments studied which had the greatest effects on com deterioration—a susceptible and a resistant hybrid with and without Rovral treatment.
COMPUTER SIMULATION PROCEDURES Wilcke *s computer model (Wilcke, 1985) was modified
to allow simulation of ambient-air drying of com under all of the conditions defined by the equations of table 1. This new model, hereafter the Al-Yahya model, accounts for effects of kemel mechanical damage, hybrid trait, and fungicide treatment by applying appropriate multipliers to its calculated deterioration rates. Weather data for 1984 through 1989 were obtained from the National Climatic Data Center, Asheville, North Carolina, so that drying could be simulated for any year in the period 1963 through 1989. Otherwise, the model is the same as described by Wilcke and Bem (1986). See Al-Yahya (1991) for a Hsting of the Al-Yahya model.
PROGRAM INPUT
The model simulated com drying in a 5.5-m (18-ft) diameter bin at a depth of 4.6 m (15 ft). The model used 10
Table 4. Predicted minimum airflow rates and relative fan power requirements for not over 0.5% DML 23 of 26 years in Central Iowa
Com Hybrid
Moisture
Airflow (m /min-Mg) (cfm/bu)
Fan power indexj
Susceptible
20% 24%
NT* Tt NT T
1.0 0.70 3.2 1.9 0.90 0.65 2.9 1.7 1.2 0.76 10 4.4
Resistant
20% 24%
NT T NT T
0.78 0.28 2.0 1.4 0.70 0.25 1.8 1.3 0.87 0.21 4.8 2.6
Generic
20% 24%
NT T
0.89 2.8 0.80 2.5 1.0 8.3
* With no fungicide treatment (NT). t With fungicide treatment (T). $ Relative to generic hybrid at 20% moisture. All values computed assuming a com
depth of 4.6 m (15 ft) and a Shedd's curve multiplier of 1.5.
1556 TRANSACTIONS OF THE A S A E

Table 5a. Fan energy and dry matter loss for untreated 20% moisture generic, susceptible, and resistant com hybrids,
Table 5b. Finish dates for 20% moisture corn of generic, susceptible, and resistant com hybrids; 15 October harvest, Des Moines, Iowa*
Year 63 64 65 66 67 68 69 70 71 72 73 74 75 76 77 78 79 80 81 82 83 84 85 86 87 88
Mean
* Dry
15 (
Fan
GENt
47.1 51.5 49.3 45.5 46.6 49.3 44.4 45.5 57.5 61.2 44.9 47.1 44.9 49.8 45.5 48.2 43.3 37.8 46.0 50.9 53.1 49.8 49.8 53.7 52.6 47.1
48.5
October har vest,l>es
energy (kWh/t)
SUS^
55.2 62.4 57.4 50.2 55.9 58.1 53.1 53.8 68.1 71.7 53.1 56.6 53.1 48.8 55.2 54.5 51.6 45.2 53.1 62.4 63.4 59.9 60.6 64.8 63.4 57.2
57.3
RES§
40.3 37.2 39.1 78.3 36.4 38.3 34.9 34.9 42.9 38.3 34.5 36.4 35.7 30.7 36.4 37.6 33.0 30.3 37.6 39.1 37.2 38.0 37.2 40.6 39.5 37.2
38.5
Momes, lo wa*
Maximum Dry Matter Loss
GEN
0.45 0.50 0.35 0.29 0.19 0.33 0.20 0.35 0.58 0.49 0.33 0.36 0.36 0.22 0.38 0.35 0.39 0.24 0.25 0.30 0.48 0.51 0.47 0.56 0.34 0.25
0.37 23/2611
SUS
0.48 0.46 0.34 0.26 0.18 0.29 0.19 0.29 0.56 0.46 0.30 0.34 0.34 0.18 0.40 0.31 0.39 0.22 0.27 0.28 0.46 0.45 0.43 0.52 0.33 0.23
0.34 24/26
matter loss not over 0.5% at least 23 out of 26 years. t Generic hybrid, 2.2-kW input to fan motor; 0.89
(0.8-cfm/bu) initial airflow. t Susc eptible hybi rid, 2.95-kW input to fan motor;
RES
0.45 0.48 0.34 0.29 0.20 0.33 0.21 0.31 0.52 0.38 0.29 0.34 0.35 0.22 0.35 0.33 0.36 0.24 0.23 0.28 0.42 0.50 0.48 0.54 0.31 0.26
0.35 24/26
-m /min-Mg
1.0-m /min -Mg
Year
63 64 65 66 67 68 69 70 71 72 73 74 75 76 77 78 79 80 81 82 83 84 85 86 87 88
* Dry
GEN
N N N N N N N N N N N N N N N N N N N N N N N N N N
0/26t
Fall finish?
SUS
N N N N N N N N N N N N N N N N N N N N N N N N N N
0/26
RES
N N N N N N N N N N N N N N N N N N N N N N N N N N
0/26
Drying Finish Date
GEN
4/30 5/17 4/28 5/6 4/24 5/7 4/24 4/21 5/13 5/20 4/30 5/7 4/20 4/25 5/2 5/10 5/2 4/20 4/23 5/8 5/20 5/11 5/14 5/12 5/4 4/30
2/26$
SUS
4/22 5/10 4/18 4/23 4/18 4/28 4/17 4/15 5/3 5/20 4/22 4/30 4/12 4/12 4/26 4/28 4/25 4/14 4/18 5/2 5/14 5/6 5/10 5/7 4/29 4/26
1/26
matter loss not over 0.5% at least 23 out of 26 years. t Number of years with drying complete before winter. i Number of years with drying incomplete (simulation ceasec
20 May).
RES
5/19 5/20 5/10 5/19 5/4 5/17 5/4 4/29 5/20 5/20 5/7 5/16 5/1 5/3 5/14 5/20 5/9 4/30 5/6 5/17 5/20 5/19 5/20 5/20 5/11 5/11
7/26
ion
(0.9-cfm/bu) initial airflow. Resistant hybrid, 1.54-kW input to fan motor; 0.78-m^/min-Mg (0.7-cfm/bu) initial airflow. Number of years with dry-matter loss < 0.5%.
layers and a harvest date of 15 October for all runs. Simulations were completed for moistures of 20 and 24%. Many Iowa farmers harvest com at about 20% moisture for natural air drying. Wilcke (1985) stated that 24% is the practical moisture limit for ambient-air dried com in single-fill bins. An initial grain temperature of 10° C (50° F) was assumed to approximate the outdoor air temperature on the 15 October harvest date.
Fan input power was assumed constant through each run. Airflow was changed in 0.056-m^/min-Mg (0.05-cfm/bu) increments between mns. Only ambient-air drying was considered, so supplemental heat inputs were zero in all mns. Desired final average and maximum moisture values were 15.5% for all mns.
PREDICTION OF CO2 PRODUCTION The damage multiplier equation developed by Stroshine
and Yang (1990) using data from Steele (1967) was used to predict M^ for equation 2:
where d represents damage level (%). Hybrid multipliers were computed using data from
Al-Yahya et al. (1993) for resistant and susceptible hybrids. These multipliers were computed using the equation:
M,= (230) M^M^M,
(4)
Values of Mjj are listed in table 2 along with storage times for this study and those predicted using equations from Steele (1967) and Friday (1987). The Mj, values are averages of M^ calculated at 12-h intervals from t « 100 h to the 0.5% DML time. Times for the other studies were adjusted to conditions of the current study, i.e., 26° C (78.8° F) storage temperature, 21.6% com moisture, 3% mechanical damage. The Steele data were also adjusted to account for hybrid susceptibility and resistance using the Mj, values listed. For conditions when neither a resistant nor a susceptible hybrid was being considered, a generic hybrid condition (Mj, = 1) was assumed.
Fungicide multipliers were also computed using data from Al-Yahya et al. (1993) and equation 5:
Md=1.97e-00i99d (3) M, t (230) M^M^M,
(5)
VOL. 37(5): 1555-1560 1557
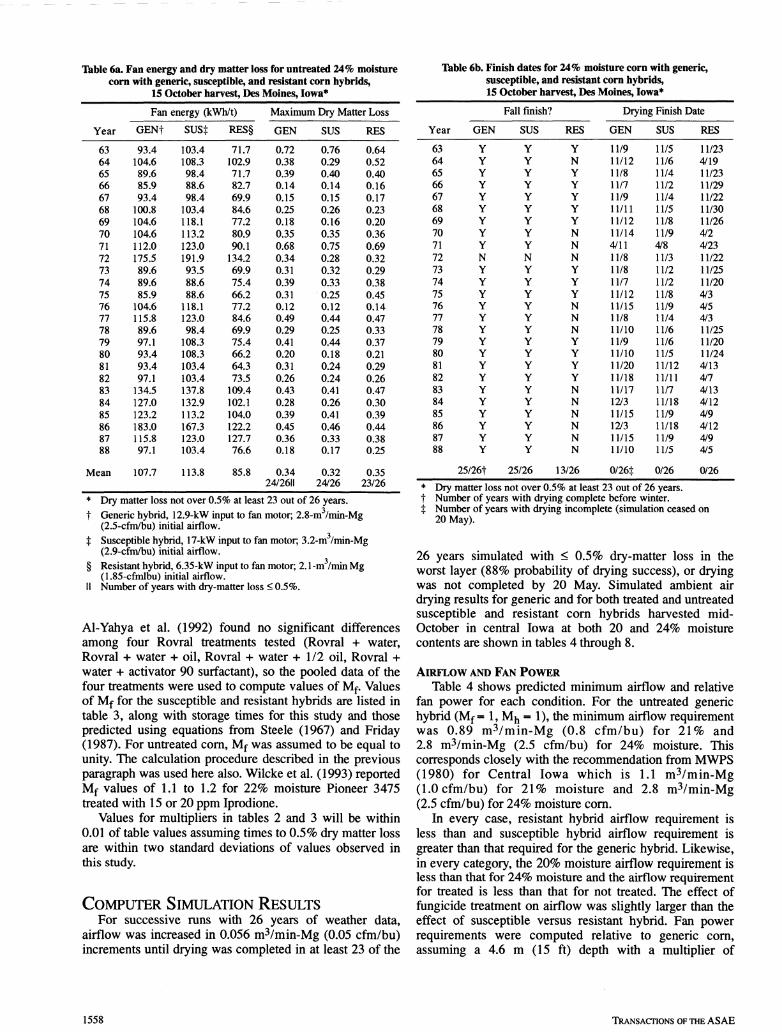
Table 6a. Fan energy and dry matter loss for untreated 24% moisture com with generic, susceptible, and resistant corn hybrids,
15 October harvest, Des Moines, Iowa'"
Table 6b. Finish dates for 24% moisture corn with generic, susceptible, and resistant com hybrids, 15 October harvest, Des Moines, Iowa*"
Year
63 64 65 66 67 68 69 70 71 72 73 74 75 76 77 78 79 80 81 82 83 84 85 86 87 88
Mean
Fan
GENt
93.4 104.6 89.6 85.9 93.4
100.8 104.6 104.6 112.0 175.5 89.6 89.6 85.9
104.6 115.8 89.6 97.1 93.4 93.4 97.1
134.5 127.0 123.2 183.0 115.8 97.1
107.7
energy (kWh/t)
sust 103.4 108.3 98.4 88.6 98.4
103.4 118.1 113.2 123.0 191.9 93.5 88.6 88.6
118.1 123.0 98.4
108,3 108.3 103.4 103.4 137.8 132.9 113.2 167.3 123.0 103.4
113.8
RES§
71.7 102.9 71.7 82.7 69.9 84.6 77.2 80.9 90.1
134.2 69.9 75.4 66.2 77.2 84.6 69.9 75.4 66.2 64.3 73.5
109.4 102.1 104.0 122.2 127.7 76.6
85.8
Maximum Dry Matter Loss
GEN SUS RES
0.72 0.76 0.38 0.29 0.39 0.40 0.14 0.14 0.15 0.15 0.25 0.26 0.18 0.16 0.35 0.35 0.68 0.75 0.34 0.28 0.31 0.32 0.39 0.33 0.31 0.25 0.12 0.12 0.49 0.44 0.29 0.25 0.41 0.44 0.20 0.18 0.31 0.24 0.26 0.24 0.43 0.41 0.28 0.26 0.39 0.41 0.45 0.46 0.36 0.33 0.18 0.17
0.34 0.32 24/2611 24/26
* Dry matter loss not over 0.5% at least 23 out of 26 years. t Generic hybrid, 12.9-kW input to fan motor; 2.8-m /min-:
(2.5-cfm/bu) initial airflow. t Susceptible hybrid, 17-kW i input to fan motor; 3.2-m /min
0.64 0.52 0.40 0.16 0.17 0.23 0.20 0.36 0.69 0.32 0.29 0.38 0.45 0.14 0.47 0.33 0.37 0.21 0.29 0.26 0.47 0.30 0.39 0.44 0.38 0.25
0.35 23/26
Mg
i-Mg
Year
63 64 65 66 67 68 69 70 71 72 73 74 75 76 77 78 79 80 81 82 83 84 85 86 87 88
GEN
Y Y Y Y Y Y Y Y Y N Y Y Y Y Y Y Y Y Y Y Y Y Y Y Y Y
25/26t
Fall finish?
SUS
Y Y Y Y Y Y Y Y Y N Y Y Y Y Y Y Y Y Y Y Y Y Y Y Y Y
25/26
RES
Y N Y Y Y Y Y N N N Y Y Y N N N Y Y Y Y N N N N N N
13/26
Drying Finish
GEN
11/9 11/12 11/8 11/7 11/9 11/11 11/12 11/14 4/11 11/8 11/8 11/7 11/12 11/15 11/8 11/10 11/9 11/10 11/20 11/18 11/17 12/3 11/15 12/3 11/15 11/10
0/26t
SUS
11/5 11/6 11/4 11/2 11/4 11/5 11/8 11/9 4 8 11/3 11/2 11/2 11/8 11/9 11/4 11/6 11/6 11/5 11/12 11/11 11/7 11/18 11/9 11/18 11/9 11/5
0/26
* Dry matter loss not over 0.5% at least 23 out of 26 years. t Number of years with drying complete before winter. t Number of years with drying incomplete (simulation ceas
20 May).
Date
RES
11/23 4/19 11/23 11/29 11/22 11/30 11/26 4 2 4/23 11/22 11/25 11/20 4/3 4/5 4/3 11/25 11/20 11/24 4/13 4/7 4/13 4 12 4/9 4/12 4/9 4/5
0/26
edon
(2.9-cfm/bu) initial airflow.
Resistant hybrid, 6.35-kW input to fan motor; 2.1 -m /min Mg (1.85-cfmlbu) initial airflow. Number of years with dry-matter loss < 0.5%.
Al-Yahya et al. (1992) found no significant differences among four Rovral treatments tested (Rovral + water, Rovral + water + oil, Rovral + water +1 /2 oil, Rovral + water + activator 90 surfactant), so the pooled data of the four treatments were used to compute values of Mf. Values of Mf for the susceptible and resistant hybrids are listed in table 3, along with storage times for this study and those predicted using equations from Steele (1967) and Friday (1987). For untreated com, Mf was assumed to be equal to unity. The calculation procedure described in the previous paragraph was used here also. Wilcke et al. (1993) reported Mf values of 1.1 to 1.2 for 22% moisture Pioneer 3475 treated with 15 or 20 ppm Iprodione.
Values for multipliers in tables 2 and 3 will be within 0.01 of table values assuming times to 0.5% dry matter loss are within two standard deviations of values observed in this study.
COMPUTER SIMULATION RESUUTS For successive runs with 26 years of weather data,
airflow was increased in 0.056 m^/min-Mg (0.05 cfm/bu) increments until drying was completed in at least 23 of the
26 years simulated with < 0.5% dry-matter loss in the worst layer (88% probability of drying success), or drying was not completed by 20 May. Simulated ambient air drying results for generic and for both treated and untreated susceptible and resistant com hybrids harvested mid-October in central Iowa at both 20 and 24% moisture contents are shown in tables 4 through 8.
AIRFLOW AND FAN POWER
Table 4 shows predicted minimum airflow and relative fan power for each condition. For the untreated generic hybrid (Mf = 1, M^ = 1), the minimum airflow requirement was 0.89 m3/min-Mg (0.8 cfm/bu) for 21% and 2.8 m^/min-Mg (2.5 cfm/bu) for 24% moisture. This corresponds closely with the recommendation from MWPS (1980) for Central Iowa which is 1.1 m^/min-Mg (1.0 cfm/bu) for 21% moisture and 2.8 m^/min-Mg (2.5 cfm/bu) for 24% moisture com.
In every case, resistant hybrid airflow requirement is less than and susceptible hybrid airflow requirement is greater than that required for the generic hybrid. Likewise, in every category, the 20% moisture airflow requirement is less than that for 24% moisture and the airflow requirement for treated is less than that for not treated. The effect of fungicide treatment on airflow was slightly larger than the effect of susceptible versus resistant hybrid. Fan power requirements were computed relative to generic com, assuming a 4.6 m (15 ft) depth with a multiplier of
1558 TRANSACTIONS OF THE ASAE

Table 7. Fan energy, dry matter loss and finish date for fiingicide-treated 20% moisture corn of susceptible and resistant corn hybrids;
15 October harvest; Des Moines*
Table 8. Fan energy, dry matter loss, and finish dates for fiingicide-treated 24% moisture com of susceptible and resistant com
hybrid; 15 October harvest; Des Moines, Iowa*
Year
63 64 65 66 67 68 69 70 71 72 73 74 75 76 77 78 79 80 81 82 83 84 85 86 87 88
Mean
Fan Energy (kWh/t)
SUSt RESt
34.3 31.4 35.9 31.4 32.7 33.3 31.4 32.0 36.2 32.4 31.4 32.0 32.0 27.5 32.7 31.7 29.8 27.5 23.9 34.0 31.4 32.4 31.4 34.3 34.6 34.0
32.0
4.3 3.9 4.5 3.9 4.5 4.2 4.5 4.5 4.5 4.1 4.2 4.0 4.5 3.9 4.1 4.0 4.5 4.5 4.5 4.3 3.9 4.1 3.9 4.3 4.5 4.3
4.3
Maximum Dry Matter Loss (%)
SUS RES
0.48 0.50 0.35 0.31 0.22 0.36 0.24 0,3? 0.53 0.38 0.31 0.38 0.38 0.25 0.36 0.35 0.37 0.27 0.26 0.30 0.43 0.51 0.50 0.58 0.34 0.30
0.37
0.52 0.50 0.42 0.28 0.29 0.35 0.36 0.39 0.49 0.28 0.38 0.41 0.52 0.41 0.34 0.34 0.37 0.37 0.46 0.29 0.35 0.48 0.43 0.51 0.39 0.35
0.40 23/26d 23/26
Fall finish?
SUS
N N N N N N N N N N N N N N N N N N N N N N N N N N
0/2611
RES
N N N N N N N N N N N N N N N N N N N N N N N N N N
0/26
Drying Finish Date
SUS
5/20 5/20 5/19 5/20 5/10 5/20 5/10 5/7 5/20 5/20 5/14 5/20 5/7 5/8 5/20 5/20 5/15 5/6 5/14 5/20 5/20 5/20 5/20 5/20 5/15 5/19
14/26^
RES
5/20 5/20 5/20 5/20 5/20 5/20 5/20 5/20 5/20 5/20 5/20 5/20 5/20 5/20 5/20 5/20 5/20 5/20 5/20 5/20 5/20 5/20 5/20 5/20 5/20 5/20
^ 26/26
Year
63 64 65 66 67 68 69 70 71 72 73 74 75 76 77 78 79 80 81 82 83 84 85 86 87 88
Mean
Fan Energy (kWh/t)
SUSt
68.1 103.8 71.3 73.0 66.5 82.7 73.0 77.8 87.6
121.6 74.6 71.3 61.6 69.7 82.7 68.1 71.3 63.2 64.8 77.8
100.5 100.5 100.5 113.5 115.1 71.3
82.0
RESt
56.5 77.2 58.3 57.4 58.3 63.7 57.4 58.3 70.9 78.1 58.3 61.0 58.3 53.8 60.1 62.8 59.2 47.6 53.0 70.0 67.3 66.4 67.3 72.7 71.8 60.1
62.5
Maximum Dry Matter Loss (%)
SUS RES
0.61 0.53 0.49 0.40 0.16 0.16 0.23 0.19 0.32 0.65 0.33 0.29 0.37 0.45 0.11 0.44 0.34 0.36 0.20 0.31 0.31 0.48 0.32 0.37 0.41 0.36 0.20
0.34
0.50 0.38 0.26 0.17 0.28 0.19 0.31 0.59 0.45 0.33 0.38 0.40 0.17 0.43 0.32 0.35 0.22 0.27 0.30 0.54 0.41 0.45 0.49 0.37 0.22
0.36 24'26§ 23/26
Fall finish?
SUS
Y N Y Y Y Y Y Y N N Y Y Y Y N N Y Y N N N N N N N Y
RES
N N N N N N N N N N N N N N N N N N N N N N N N N N
14/2611 0/26
Drying Finish Date
SUS
11/26 4/20 11/28 11/29 11/215 12/5 11/29 12/2 4/7 4/25 11/30 11/28 11/22 11/27 4 2 4/6 11/28 11/23 4/3 4/8 4/5 4^13 4^15 4/14 4/10 11/28
0/26#
RES
4^8 5/5 4/4 4/17 4/5 4/17 4 7 4 5 4/20 5/7 4/13 4/19 4/4 4/13 4/15 4/21 4/8 4/5 4/3 4/23 4/28 4/24 4/28 4/25 4/18 4/11
0/26
* Dry matter loss not over 0.5% at least 23 out of 26 years. Average of four Rovral fungicide treatments.
t Susceptible hybrid, 1.3-kW input to fan motor; 0.72-m^/min Mg
(0.65-cfm/bu) initial airflow. :|: Resistant hybrid, 0.15-kW input to fan motor; 0.28-m^/min-Mg
(0.25-cfm/bu) initial airflow. § Number of years with dry-matter loss < 0.5%. II Number of years with drying complete before winter. # Number of years with drying incomplete (simulation ceased on
Dry matter loss not over 0.5% at least 23 out of 26 years. Average of four Rovral fungicide treatments.
t Susceptible hybrid, 5.6 kW input to fan motor; 1.95 m^/min-Mg
(1.75 cfm/bu) initial airflow. t Resistant hybrid, 3.1 kW input to fan motor; 1.50 m /min-Mg (1.35 cfm/bu) initial airflow. § Number of years with dry-matter loss < 0.5%. II Number of years with drying complete before winter. # Number of years with drying incomplete (simulation ceased on
1.5 applied to Shedd's resistance to airflow data for shelled com (Shedd, 1953). This multiplier was applied to account for any packing and fine material effects.
ENERGY, DRY MATTER LOSS, AND FINISH DATE Tables 5 through 8 show fan energy, maximum dry
matter loss, and finish date for each of the 26 years simulated, for each of the 10 scenarios at their airflows as listed in table 4.
From these tables, note that: • Average maximum dry matter loss does not vary
much among the six scenarios. • At each moisture level, resistant com used the least
fan power, on average, followed by generic and susceptible.
• Fan energy for 24% moisture was two to 14 times that for 20% moisture, in comparable scenarios.
• Drying was never completed in the fall on the 20% moisture com and in some years was not completed by the 20 May cutoff. The susceptible hybrid, which required higher airflow, was most likely to be
finished by 20 May, followed by the generic and then resistant hybrid.
Extending allowable storage time by use of resistant hybrids and/or application of fungicide offers the possibility of safely storing 20 to 24% moisture com with aeration from harvest to mid-May in central Iowa.
USE OF SIMULATION RESULTS It is important to note that hybrid and fungicide effects
predicted in this simulation study are based on laboratory tests at about 22% moisture. These effects are assumed to be the same as the com dries down to 15% moisture. At these lower moistures, different fungi may be active, and effects may be different. Additional research is needed to determine the magnitude of differences.
CONCLUSIONS These conclusions can be drawn, based on computer
simulation incorporating 26 years of Des Moines, Iowa, weather data:
VOL. 37(5): 1555-1560 1559

Compared to a generic hybrid, the resistant hybrid required 20% lower airflow, 28% lower fan power, and 20% less fan energy, and the susceptible hybrid required 14% higher airflow, 22% higher fan power, and 12% more fan energy. Compared with untreated com, com treated with Rovral required on average 40% lower airflow, 54% less fan power, and 47% less fan energy.
REFERENCES Al-Yahya, S. A. 1991. Fungicide treatment of high-moisture com.
Unpub. Ph.D. diss., Iowa State Univ., Ames (No. 92-02336, Univ. Microfilms, Ann Arbor, Mich.).
Al-Yahya, S. A., C. J. Bem, M. K. Misra and T. B. Bailey. 1993. Carbon-dioxide evolution of fungicide-treated high-moisture com. Transactions oftheASAE 36(5): 1417-1422.
Friday, D. C. 1987. Evaluation of the effects of com hybrid and damage on the reliability and efficiency of low temperature drying. M.S. thesis, Purdue Univ., West Lafayette, Ind.
Friday, D. C, J. Tuite and R. Stroshine. 1989. Effect of hybrid and physical damage on mold development and carbon dioxide production during storage of high moisture shelled com. Cereal Chemistry 66:422-426.
Morey, R. V., H. A. Cloud and W. W. Nelson. 1976. Simulation of solar energy grain drying - Minnesota contribution. Final Report. ARS-ERDA Contract No. 12-14-3001-501.
Shedd, C. K. 1953. Resistance of grains and seeds to air flow. Agricultural Engineering 34(9):616-619.
Steele, J. L. 1967. Eteterioration of damaged shelled com as measured by carbon dioxide. Ph.D. thesis, Iowa State Univ., Ames (No. 68-2864, Univ. Microfilms, Ann Arbor, Mich.).
Steele, J. L., R. A. Saul and W. V. Hukill. 1969. Deterioration of shelled com as measured by carbon dioxide production. Transactions oftheASAE 12(5): 685-689.
Stroshine, L. R. and X. Yang. 1990. Effects of hybrid and grain damage on estimated dry matter loss for high-moisture shelled com. Transactions oftheASAE 33(4): 1291-1298.
MWPS. 1980. Low Temperature and Solar Grain Drying Handbook. MWPS-22. Ames: Midwest Plan Service, Iowa State Univ.
Thompson, T. L. 1972. Temporary storage of high-moisture shelled com using continuous aeration. Transactions of the ASAE 15(2):333-337.
Van Ee, G. R. 1980. A simulation study of com production and low-temperature drying for Central Iowa. Unpub. Ph.D. diss., Iowa State Univ., Ames (Library of Congress Card Number microfilm 80-19, 672).
White, D. G., G. C. Shove and W. H. Peterson. 1988. Fungicides reduce com drying and storage risks. ASAE Paper No. 88-6075. St. Joseph, Mich.: ASAE.
Wilcke, W. F. 1985. Natural-air com drying with stirring. Unpub. Ph.D. diss., Iowa State Univ., Ames (LCCN microfilm 86-04, 530).
Wilcke, W. F. and C. J. Bem. 1986. Natural-air com drying with stirring: II. Dryer performance. Transactions oftheASAE 29(3):860-867.
Wilcke, W. R, R. A. Meronuck, R. V. Morey, H. R Ng, J. R Lang, D. Jiang. 1993. Storage life of shelled com treated with a fungicide. Transactions oftheASAE 36(6): 1847-1854.
1560 TRANSACTIONS OF THE ASAE