Embed Size (px)
Citation preview
Opt Quant Electron (2012) 44:297–301DOI 10.1007/s11082-012-9564-1
Simulation method for LWIR radiation distribution usinga visual ray-tracer
Alexander Utz · Lutz Gendrisch · Dirk Weiler ·Stephan Kolnsberg · Holger Vogt
Received: 28 September 2011 / Accepted: 2 February 2012 / Published online: 15 February 2012© Springer Science+Business Media, LLC. 2012
Abstract Infrared cameras with passive, uncooled sensor chips utilize the longwave infra-red (LWIR) range of the electromagnetic spectrum with wavelengths between 8 and 14 µmfor image generation. The reason for this is that every object at room temperature is self-luminous at that wavelength. Therefore, every surface acts as a source of radiation in a LWIRscenario. To gain an impression and to model the effects and circumstances in an infraredscenario, a simulation method is required. In the visual domain this task is accomplished byray-tracing software, which allows the generation of synthetic images as well as the analysisof irradiance distribution in a given scene. In this paper a way to apply one of such ray-trac-ers to a LWIR scenario is demonstrated. A possible application of the proposed simulationmethod in test-system modelling and uncertainty analysis is also presented.
Keywords Infrared · Simulation · Ray-tracing · LWIR
1 Introduction
As is well known, the bulk of an object’s emitted radiation at room temperature is located inthe second atmospheric window with a wavelength range of 8 to 14 µm, which is called thelongwave infrared (LWIR) domain.
The spectral distribution Mλ of the emitted radiation is determined by an object’s temper-ature T and its emissivity ε (McCluney 1994):
Mλ(ε, T ) = ε ·λ2∫
λ1
2πhc2
λ5
(e
hcλkT − 1
)−1dλ.
A. Utz (B) · L. Gendrisch · D. Weiler · S. Kolnsberg · H. VogtFraunhofer Institute for Microelectronic Circuits and Systems (IMS),Finkenstraße 61, 47057 Duisburg, Germanye-mail: [email protected]:www.ims.fraunhofer.de
123

298 A. Utz et al.
The emissivity is a material dependent factor and in general a function of wavelength.An object with a wavelength-independent emissivity of one forms the perfect emitter and iscalled a black body. Due to the conservation of energy it is obvious that ε+ t +r = 1, where tis the transmissivity and r the reflectivity. Neglecting transmissive objects, we yield r = 1−ε.So every object in an LWIR scenario acts as a mixture of reflector and radiation source, wherethe ratio between emission and reflection is defined by the object’s emissivity. This is the maindifference between an infrared scenario and a visual scenario and must be considered whenattempting to model radiation distribution in an LWIR scenario. In the following sections wewill demonstrate how this task can be accomplished using a standard ray-tracing software,originally meant for lighting simulation and synthetic image generation, called RADIANCE.
2 Selection of a simulation tool
The following two conditions must be met by a simulation tool suitable for the simulation ofLWIR scenarios:
1. Physical correctness of the simulation results2. Emissive- and reflective properties of objects can be mixed
Physical correctness means that simulation results must meet physical conditions rather thanproducing “good looking” images. Furthermore, it must be possible to specify the intensi-ties of sources by physical units and quantities of radiance, i.e., W/(m2sr). The emission ofradiation of a certain object can then be calculated from its temperature and emissivity usingPlanck’s law. The second condition ensures that the mixed reflective-emissive properties ofan object in the LWIR domain can be considered.
The simulation of the propagation of light is done by analytical or numerical methodscalled ray-tracing and radiosity. Their general aim is to simulate the light- or radiation-distribution in a given scenario based on the physical laws of photometry and radiometry.In general, these laws are the same for the visual and the LWIR domain, except the abovementioned differences.
Previous work in this field has already demonstrated the use of ray-tracing algorithms forthe generation of synthetic IR images (Shor et al. 1990; Sheffer and Cathcart 1988; Stets et al.1988). The focus of these efforts was primarily to simulate large-scale scenes for militaryapplications like target recognition. Thus, the inclusion of atmospheric effects like absorptioninto the used model was a key aspect of the referenced work.
We show an approach which uses an existing ray-tracing software called RADIANCE,which fulfils the above mentioned conditions. This approach neglects effects from the atmo-sphere, which is suitable for small scale scenarios with distances in the order of only severalmeters. The advantage is that RADIANCE offers sophisticated ray-tracing and renderingalgorithms, which allow the accurate simulation of complex scenarios in a maintainableamount of time achieved by a mixed analytic/stochastic simulation algorithm. The physicalcorrectness in the visual domain has already been proven well (Grynberg 1989).
RADIANCE fulfils all the conditions specified above. It consists of a set of unix tools forscene generation, irradiance analysis and image rendering. It is licensed at no-cost and can bedownloaded from http://radsite.lbl.gov/radiance/. RADIANCE scene descriptions are madeof ASCII files which contain all definitions for materials, sources and geometric objects.It allows to mix-up two materials to generate a new one combining the features of bothbasic materials. At last a self-luminous material called glow is provided. Thus, all conditionsneeded for the simulation of LWIR scenarios are present.
123
Simulation method for LWIR radiation distribution 299
3 Generation of the scene description
The scene description, consisting of the various provided shapes, can be created manually orby a CAD tool. Converters from many CAD formats to the RADIANCE format are available.
LWIR materials can be created by mixing self-luminous with reflecting ones. The emis-sive part is handled by the glow material (http://radsite.lbl.gov/radiance). Its radiance levelsare given directly in radiometric units, i.e., W/(m2sr). An object’s radiance at a certain tem-perature T is given by Planck’s function. For T = 30◦C e.g., we yield M = 152.4W/(m2sr).Several material types with different reflective behaviours such as metal or plastic are pro-vided. The material definitions are as follows (http://radsite.lbl.gov/radiance):
void glow m_emmitt void plastic m_reflect void mixfunc lwir_mat0 0 4 m_emmitt m_reflect 0.95.0 0 04 152.4 152.4 152.4 0 5 1 1 1 0 0 0
The mixfunc material allows to mix-up two materials. So an LWIR material can be createdas shown from a reflecting (m_reflect) and an emitting (m_emmitt) material.
The floating-point argument 0.95 specifies the emissivity for the new material. This mate-rial can then be used to generate an LWIR scene using the RADIANCE scene definitionformat.
The obtained simulation results were validated by comparing them to analytical calcula-tions for some basic scenarios (Utz et al. 2011). The comparison showed that the differencebetween the simulated and calculated values is less than 1%. The simulation results showsome noise, which results from the use of monte carlo simulation methods.
4 Application in test-system modelling
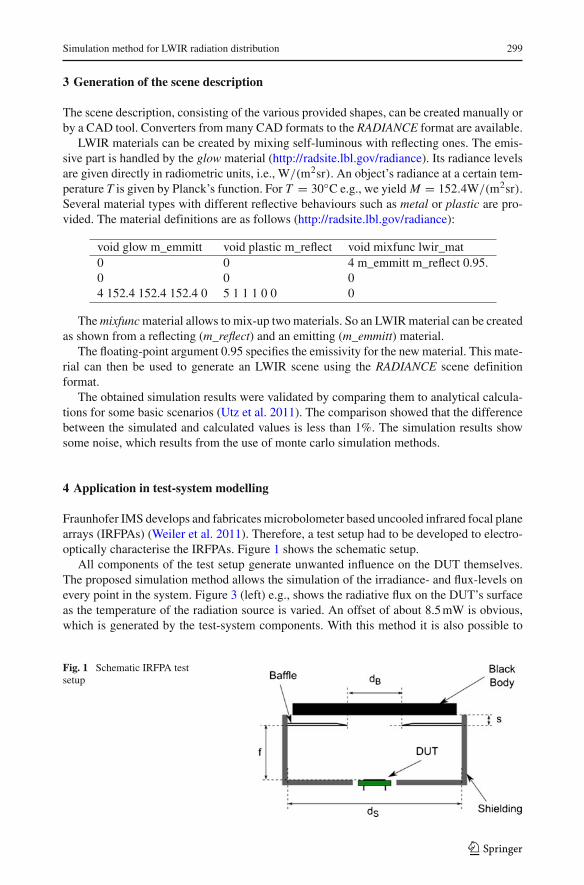
Fraunhofer IMS develops and fabricates microbolometer based uncooled infrared focal planearrays (IRFPAs) (Weiler et al. 2011). Therefore, a test setup had to be developed to electro-optically characterise the IRFPAs. Figure 1 shows the schematic setup.
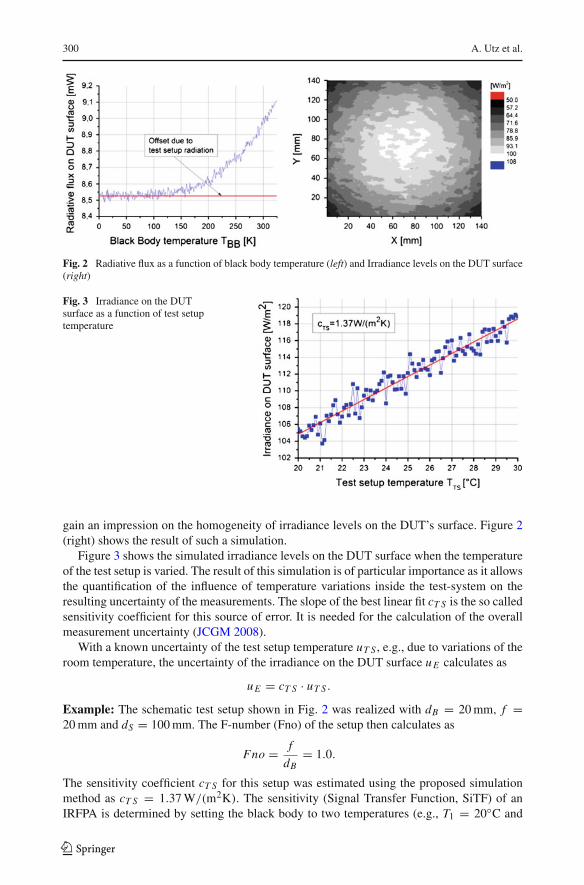
All components of the test setup generate unwanted influence on the DUT themselves.The proposed simulation method allows the simulation of the irradiance- and flux-levels onevery point in the system. Figure 3 (left) e.g., shows the radiative flux on the DUT’s surfaceas the temperature of the radiation source is varied. An offset of about 8.5 mW is obvious,which is generated by the test-system components. With this method it is also possible to
Fig. 1 Schematic IRFPA testsetup
123
300 A. Utz et al.
Fig. 2 Radiative flux as a function of black body temperature (left) and Irradiance levels on the DUT surface(right)
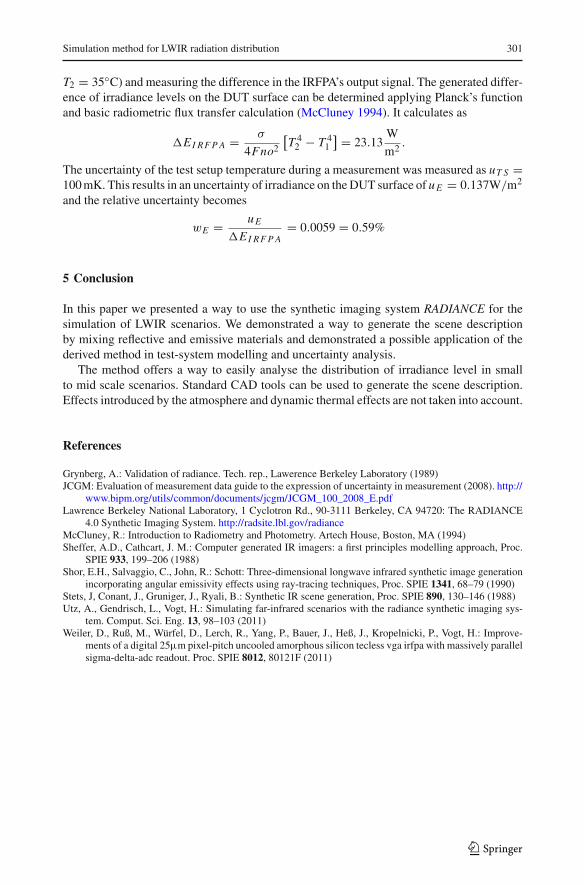
Fig. 3 Irradiance on the DUTsurface as a function of test setuptemperature
gain an impression on the homogeneity of irradiance levels on the DUT’s surface. Figure 2(right) shows the result of such a simulation.
Figure 3 shows the simulated irradiance levels on the DUT surface when the temperatureof the test setup is varied. The result of this simulation is of particular importance as it allowsthe quantification of the influence of temperature variations inside the test-system on theresulting uncertainty of the measurements. The slope of the best linear fit cT S is the so calledsensitivity coefficient for this source of error. It is needed for the calculation of the overallmeasurement uncertainty (JCGM 2008).
With a known uncertainty of the test setup temperature uT S , e.g., due to variations of theroom temperature, the uncertainty of the irradiance on the DUT surface uE calculates as
uE = cT S · uT S .
Example: The schematic test setup shown in Fig. 2 was realized with dB = 20 mm, f =20 mm and dS = 100 mm. The F-number (Fno) of the setup then calculates as
Fno = f
dB= 1.0.
The sensitivity coefficient cT S for this setup was estimated using the proposed simulationmethod as cT S = 1.37 W/(m2K). The sensitivity (Signal Transfer Function, SiTF) of anIRFPA is determined by setting the black body to two temperatures (e.g., T1 = 20◦C and
123
Simulation method for LWIR radiation distribution 301
T2 = 35◦C) and measuring the difference in the IRFPA’s output signal. The generated differ-ence of irradiance levels on the DUT surface can be determined applying Planck’s functionand basic radiometric flux transfer calculation (McCluney 1994). It calculates as
�EI RF P A = σ
4Fno2
[T 4
2 − T 41
] = 23.13W
m2 .
The uncertainty of the test setup temperature during a measurement was measured as uT S =100 mK. This results in an uncertainty of irradiance on the DUT surface of uE = 0.137W/m2
and the relative uncertainty becomes
wE = uE
�EI RF P A= 0.0059 = 0.59%
5 Conclusion
In this paper we presented a way to use the synthetic imaging system RADIANCE for thesimulation of LWIR scenarios. We demonstrated a way to generate the scene descriptionby mixing reflective and emissive materials and demonstrated a possible application of thederived method in test-system modelling and uncertainty analysis.
The method offers a way to easily analyse the distribution of irradiance level in smallto mid scale scenarios. Standard CAD tools can be used to generate the scene description.Effects introduced by the atmosphere and dynamic thermal effects are not taken into account.
References
Grynberg, A.: Validation of radiance. Tech. rep., Lawerence Berkeley Laboratory (1989)JCGM: Evaluation of measurement data guide to the expression of uncertainty in measurement (2008). http://
www.bipm.org/utils/common/documents/jcgm/JCGM_100_2008_E.pdfLawrence Berkeley National Laboratory, 1 Cyclotron Rd., 90-3111 Berkeley, CA 94720: The RADIANCE
4.0 Synthetic Imaging System. http://radsite.lbl.gov/radianceMcCluney, R.: Introduction to Radiometry and Photometry. Artech House, Boston, MA (1994)Sheffer, A.D., Cathcart, J. M.: Computer generated IR imagers: a first principles modelling approach, Proc.
SPIE 933, 199–206 (1988)Shor, E.H., Salvaggio, C., John, R.: Schott: Three-dimensional longwave infrared synthetic image generation
incorporating angular emissivity effects using ray-tracing techniques, Proc. SPIE 1341, 68–79 (1990)Stets, J, Conant, J., Gruniger, J., Ryali, B.: Synthetic IR scene generation, Proc. SPIE 890, 130–146 (1988)Utz, A., Gendrisch, L., Vogt, H.: Simulating far-infrared scenarios with the radiance synthetic imaging sys-
tem. Comput. Sci. Eng. 13, 98–103 (2011)Weiler, D., Ruß, M., Würfel, D., Lerch, R., Yang, P., Bauer, J., Heß, J., Kropelnicki, P., Vogt, H.: Improve-
ments of a digital 25µm pixel-pitch uncooled amorphous silicon tecless vga irfpa with massively parallelsigma-delta-adc readout. Proc. SPIE 8012, 80121F (2011)
123