Embed Size (px)
Citation preview
http://sim.sagepub.comSIMULATION
DOI: 10.1177/0037549707080605 2007; 83; 139 SIMULATION
Jim Martin and James Westall A Simulation Model of the DOCSIS Protocol
http://sim.sagepub.com/cgi/content/abstract/83/2/139 The online version of this article can be found at:
Published by:
http://www.sagepublications.com
On behalf of:
Society for Modeling and Simulation International (SCS)
can be found at:SIMULATION Additional services and information for
http://sim.sagepub.com/cgi/alerts Email Alerts:
http://sim.sagepub.com/subscriptions Subscriptions:
http://www.sagepub.com/journalsReprints.navReprints:
http://www.sagepub.com/journalsPermissions.navPermissions:
© 2007 Simulation Councils Inc.. All rights reserved. Not for commercial use or unauthorized distribution. at CLEMSON UNIV on August 7, 2007 http://sim.sagepub.comDownloaded from
A Simulation Model of the DOCSIS ProtocolJim MartinJames WestallSchool of ComputingClemson UniversityClemsonSouth Carolina 29634, [email protected]
The number of households and businesses using hybrid fiber coaxial cable networks for Internetaccess is rapidly approaching 40 million in the United States. The cable industry has standardizedon a single medium access control (MAC) and physical layer standard, the Data Over Cable ServiceInterface Specification (DOCSIS). The MAC layer of the emerging IEEE 802.16 broadband wirelessaccess standard is also based upon DOCSIS. Thus, the performance of DOCSIS is now and willremain a critical element in the overall performance of shared medium broadband access networks.Despite this fact, public domain tools that may be used to assess and improve the performance ofDOCSIS have been slow to emerge. To address this problem, we have implemented a simulationmodel of the DOCSIS MAC layer for the ‘ns’ network simulation tool. Due to the complexity of DOC-SIS and because the specifications are purposely incomplete, developing an accurate simulation isquite challenging. In this paper we present analytic and live network evidence that the simulationaccurately reflects the behavior of a DOCSIS network under a limited set of workloads.
Keywords: Simulation methods, broadband access, hybrid fiber coaxial cable networks, Data OverCable Service Interface Specification (DOCSIS), Transmission Control Protocol (TCP) performance
1. Introduction
Early cable broadband access networks employed propri-etary protocols. Performance was characterized by highlyasymmetric channel capacities and high loss rates due topoor channel signal-to-noise properties [1, 2]. The deploy-ment of hybrid fiber coaxial (HFC) systems pushed fibercloser to the endpoints and greatly improved performance.In the late 1990s the cable industry developed a set of stan-dards, collectively referred to as Data-Over-Cable ServiceInterface Specification (DOCSIS), for transmitting dataover HFC cable networks [3, 4]. The DOCSIS standardsdefine the physical and MAC layers and also address se-curity, operations system support (OSS), equipment inter-faces, and equipment validation. Standard protocols, bet-ter performing equipment, and competitive pricing havefueled the steady growth of broadband cable.
SIMULATION, Vol. 83, Issue 2, February 2007 139–155c� 2007 The Society for Modeling and Simulation InternationalDOI: 10.1177/0037549707080605Figures 1–3, 6–15 appear in color online: http://sim.sagepub.com
According to a Pew survey, nearly 65% of adults inthe United States access the Internet at least once eachday [5]. The study also indicates that there are 66 millionhouseholds equipped with broadband access, and that ap-proximately 54% of these households use cable. Advance-ments in the technology driving HFC cable networks con-tinue. Sophisticated modulation techniques augmentedwith channel bonding will increase data rates from thecurrent tens of Mbps to hundreds of Mbps in both the up-stream and downstream directions.
When compared with other emerging network tech-nologies, (e.g. ad-hoc and sensor networks), there is littlepublished research on the subject of modern cable net-works. There are two main reasons for this. First, dueto complexity and cost, there are no open source DOC-SIS platforms that are available to researchers. Second,in contrast to the Internet community where academicresearchers can introduce new protocols or protocol en-hancements through the IETF’s RFC process, the HFC ca-ble and Worldwide Interoperability for Microwave Access(WiMAX) standards are developed in members-only in-dustry consortiums. The net result is that the evolution ofDOCSIS is being directed by industry with little involve-ment of academia. As a first step in enabling the academic
Volume 83, Number 2 SIMULATION 139
© 2007 Simulation Councils Inc.. All rights reserved. Not for commercial use or unauthorized distribution. at CLEMSON UNIV on August 7, 2007 http://sim.sagepub.comDownloaded from
Martin and Westall
community to participate in the evaluation and evolutionof DOCSIS, we have developed a simulation model of theDOCSIS MAC protocol for the popular ‘ns’ network sim-ulator tool [6]1.
The challenges of performing simulation-based studiesof complex systems are well known. It has been arguedthat research based solely on simulation lacks credibility[7]. Recent publications note that wireless research is par-ticularly sensitive to physical layer assumptions [8–11].The authors of [9] indicate that the choice of appropriateexperimental scenarios is just as crucial as the use of validchannel models.
We encountered significant challenges in develop-ing the DOCSIS simulation. The behavior of the sys-tem is quite sensitive to parameter selection, and thespecification leaves significant room for implementationdecisions, leaving key parameter selection decisions to thecable system operator. Thus the number of “correct” real-izations of DOCSIS is nearly limitless, and the process of“validating” a simulator for all of them unending.
These issues motivated the study reported in this pa-per. While our overall research agenda is to participatein the continued evolution of DOCSIS to better supportcurrent and next generation shared medium access net-works, our objectives in this paper are limited and two-fold. The first is to describe those operational elementsof the DOCSIS protocols that are modeled in our simula-tion. The second is to demonstrate that the performanceof a set of selected workloads on the simulated system isconsistent with the performance observed on operationalHFC networks. Aspects of this research are applicableto 802.16 (WiMAX) networks as its channel allocationmechanism is also DOCSIS-based. Differences betweenthe HFC physical layer and WiMAX physical layer pre-vent results from being directly compared. Nevertheless,the methodology we describe to validate a wired DOC-SIS network model can be applied for a WiMAX networkmodel. In future work, we intend to extend our simulationmodel for WiMAX. The focus of this paper, however, ison HFC networks.
The remainder of this paper is organized as follows.In Section 2 we describe essential elements of the DOC-SIS MAC protocol. Section 3 surveys related work. Thedesign of the simulator and those elements of DOCSISthat it supports are discussed in Section 4. Our approachto validation and insights gained in the validation processfollow in Section 5, and we conclude in Section 6.
2. Background
Early packet radio networks using MAC protocols suchas slotted Aloha operated well at low loads but did notscale with increased load [12, 13]. Reservation schemes
1. The ‘ns’ DOCSIS simulation model is available at http://people.clemson.edu/�jmarty/docsis.html.
and hybrid schemes based on random access reservationmechanisms and time division multiple access (TDMA)have been shown to provide improved performance at highloads. The DOCSIS protocol is a derivation of the AlohaReservation protocol which managed bandwidth in a dis-tributed manner using the slotted Aloha request mecha-nism [14]. Frames are divided into equal length slots, oneof which is designated as a “reservation slot”. The reser-vation slot is further divided into smaller mini-slots. A sta-tion with data to send broadcasts a request during a ran-domly selected reservation mini-slot. If the reservation issuccessful, the station learns the slot(s) it was allocatedand transmits its data using the allocated slots. Subsequentcellular-based packet radio networks as well as many ofthe wireless Asynchronous Transfer Mode (ATM) propos-als were based on variations of the Packet ReservationMultiple Access (PRMA) protocol [12, 15, 16]. To sup-port hundreds of data users sharing a channel in a cablenetwork, the IEEE 802.14 working group used a central-ized variant of the Aloha Reservation protocol as the MACprotocol that extended ATM services over a cable channel.This work eventually led to DOCSIS.
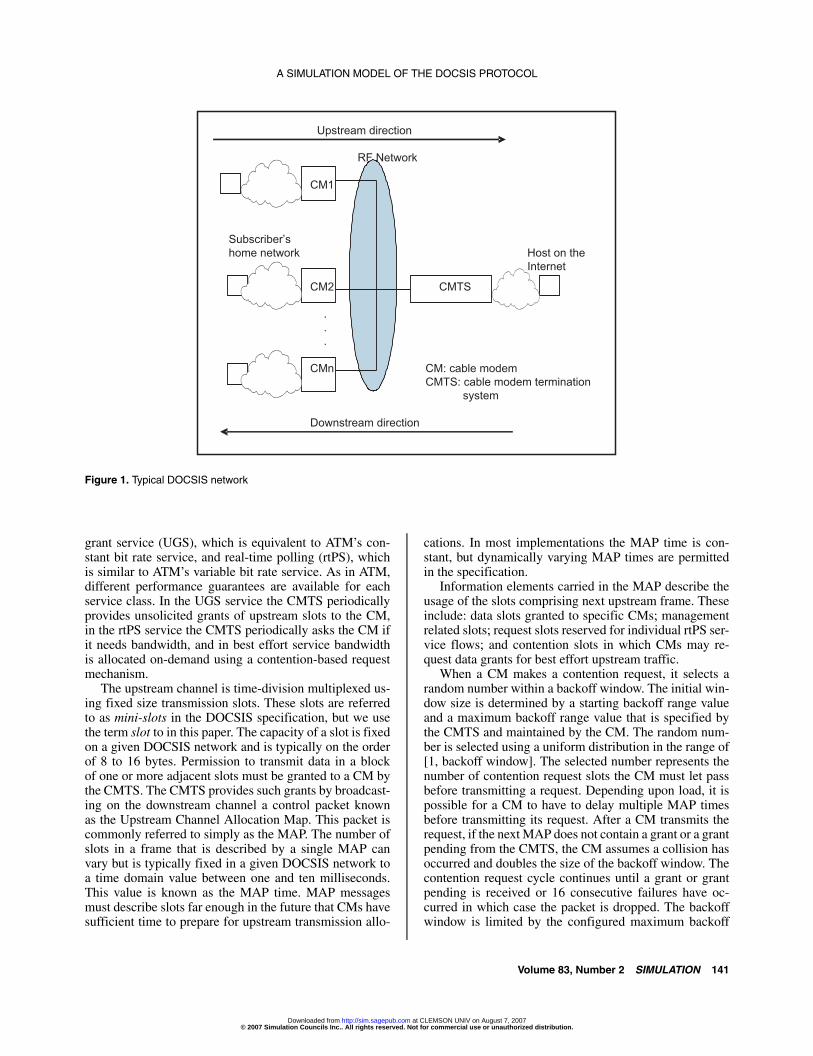
A typical DOCSIS network is shown in Figure 1. Thecable system operator hosts the cable modem termina-tion system (CMTS) units that interact with cable modems(CMs) deployed at subscriber locations. A modern CMTShouses multiple “blades” with each blade supporting oneor more HFC domains (one downstream channel with fourupstream channels). A 6 MHz (or greater) bandwidth isallocated from the 88–860 MHz spectrum for each down-stream channel, and upstream channels are allocated fromthe 5–52 MHz frequency range.
In the downstream direction, a single sender (theCMTS) transmits to the attached CMs. Downstream datarates presently vary from 10 to 50 Mbps. IP packetssent downstream are divided into 188-byte MPEG frames.Each CM has a unique MAC address and will receiveonly frames that are addressed to its MAC address or tothe broadcast address. Computers owned by the subscriberconnect to the CM through an Ethernet or USB interface.
In the upstream direction multiple senders (CMs) sharea channel that supports data rates in the range of 5 to10 Mbps. The upstream transmission model is shared ac-cess using TDMA with a random access contention-basedreservation mechanism. IP packets that are sent upstreamare encapsulated in a DOCSIS frame and transmitted dur-ing assigned slots. If a packet does not fit into the numberof contiguous slots that were allocated it is fragmentedinto multiple DOCSIS frames.
Traffic is classified by service flow. Each service flowis assigned a unique numeric identifier commonly referredto as the SID. For example, a configuration that supportstelephony and best effort data typically has four serviceflows: one each for the upstream and downstream VoIPtraffic and one each for the upstream and downstream besteffort traffic. DOCSIS maps service flows to one of sev-eral ATM-like services including best effort, unsolicited
140 SIMULATION Volume 83, Number 2
© 2007 Simulation Councils Inc.. All rights reserved. Not for commercial use or unauthorized distribution. at CLEMSON UNIV on August 7, 2007 http://sim.sagepub.comDownloaded from
A SIMULATION MODEL OF THE DOCSIS PROTOCOL
Figure 1. Typical DOCSIS network
grant service (UGS), which is equivalent to ATM’s con-stant bit rate service, and real-time polling (rtPS), whichis similar to ATM’s variable bit rate service. As in ATM,different performance guarantees are available for eachservice class. In the UGS service the CMTS periodicallyprovides unsolicited grants of upstream slots to the CM,in the rtPS service the CMTS periodically asks the CM ifit needs bandwidth, and in best effort service bandwidthis allocated on-demand using a contention-based requestmechanism.
The upstream channel is time-division multiplexed us-ing fixed size transmission slots. These slots are referredto as mini-slots in the DOCSIS specification, but we usethe term slot to in this paper. The capacity of a slot is fixedon a given DOCSIS network and is typically on the orderof 8 to 16 bytes. Permission to transmit data in a blockof one or more adjacent slots must be granted to a CM bythe CMTS. The CMTS provides such grants by broadcast-ing on the downstream channel a control packet knownas the Upstream Channel Allocation Map. This packet iscommonly referred to simply as the MAP. The number ofslots in a frame that is described by a single MAP canvary but is typically fixed in a given DOCSIS network toa time domain value between one and ten milliseconds.This value is known as the MAP time. MAP messagesmust describe slots far enough in the future that CMs havesufficient time to prepare for upstream transmission allo-
cations. In most implementations the MAP time is con-stant, but dynamically varying MAP times are permittedin the specification.
Information elements carried in the MAP describe theusage of the slots comprising next upstream frame. Theseinclude: data slots granted to specific CMs� managementrelated slots� request slots reserved for individual rtPS ser-vice flows� and contention slots in which CMs may re-quest data grants for best effort upstream traffic.
When a CM makes a contention request, it selects arandom number within a backoff window. The initial win-dow size is determined by a starting backoff range valueand a maximum backoff range value that is specified bythe CMTS and maintained by the CM. The random num-ber is selected using a uniform distribution in the range of[1, backoff window]. The selected number represents thenumber of contention request slots the CM must let passbefore transmitting a request. Depending upon load, it ispossible for a CM to have to delay multiple MAP timesbefore transmitting its request. After a CM transmits therequest, if the next MAP does not contain a grant or a grantpending from the CMTS, the CM assumes a collision hasoccurred and doubles the size of the backoff window. Thecontention request cycle continues until a grant or grantpending is received or 16 consecutive failures have oc-curred in which case the packet is dropped. The backoffwindow is limited by the configured maximum backoff
Volume 83, Number 2 SIMULATION 141
© 2007 Simulation Councils Inc.. All rights reserved. Not for commercial use or unauthorized distribution. at CLEMSON UNIV on August 7, 2007 http://sim.sagepub.comDownloaded from
Martin and Westall
range parameter sent to all CMs. A CM may request band-width sufficient to transport multiple IP packets in a sin-gle DOCSIS frame by issuing a concatenated bandwidthrequest. To further reduce contention, a CM is permittedto piggyback a request for bandwidth on an upstream dataframe, if it has another IP packet in its output queue whenit begins to transmit the current packet.
The DOCSIS specification does not provide guidancein a number of aspects that significantly impact perfor-mance. There are many situations in which the use of ei-ther piggybacking or concatenation can significantly im-prove performance. Since there are times in which a CMcan do either piggybacking or concatenation, the specificbehavior is implementation dependent. All aspects ofscheduling at the CMTS are left unspecified. The onlyconstraint is that service-specific performance measuresare upheld. For UGS and rtPS service flows, unsolicitedgrants and periodic polls must be respectively providedwithin the tolerated jitter specification.
3. Related Work
In [1], the authors found that TCP throughput over an802.14-based HFC network is low primarily due to Ac-knowledgement (ACK) compression. While assumptionsmade by the authors (such as high loss rates in the up-stream path) are no longer true, our recent results doconfirm that DOCSIS induces ACK compression. Otherearly studies looked at TCP enhancements when operat-ing over HFC networks suffering from high channel errorrates or high collision rates due to heavy workloads [2, 17,18].
More recent analysis of DOCSIS has been performedusing either analytic models or simulation models [20–23]. The work in [20] was based on the Opnet DOC-SIS model [19]. The work in [21] explores system delaysbased on a Markov model of DOCSIS. The work in [22]was based on an in-house simulation model. Due to differ-ences in methods and implementations, it is not possibleto compare published results with our results. In [23], theauthor studied DOCSIS primarily with analytic methodsalthough an ‘ns’ simulation model was also developed tovalidate the analytic results. However, the fidelity of themodel was sufficient only to confirm that DOCSIS im-pacts TCP performance primarily because the upstreamchannel is packet rate limited. No prior work of which weare aware includes model verification and validation usinglive DOCSIS systems.
The prior work does not offer a unified, clear under-standing of how DOCSIS behaves. In contrast, 802.11technology has been in use approximately as long asDOCSIS and is considered ‘well understood’ [24, 25].Barriers such as protocol complexity and cost of equip-ment have hindered the study of DOCSIS. Our work pro-vides a framework that includes analysis, tools, and tech-niques that collectively will facilitate future research inDOCSIS.
4. The Simulation Model
The simulation model implements the DOCSIS architec-ture defined in [3] with the following restrictions: (1) CMsare limited to a single default best effort service flow anda single UGS or rtPS service flow� (2) the model is limitedto one upstream channel and one downstream channel� (3)the model does not support dynamic service provisioning�(4) physical layer impairments are not modeled� (5) themodel assumes that the CMTS and the CM clocks are syn-chronized.
To account for forward error correction (FEC) over-head in the physical layer, we reduce the upstream chan-nel capacity by 8% and by 4.9% in the downstreamchannel. This approximation was suggested by Cisco[26]. The contention backoff range that is sent to eachCM in downstream MAP messages is statically set by aconfiguration parameter. Both concatenation and piggy-backing can be enabled or disabled. If concatenation is en-abled, a configuration parameter specifies the maximumnumber of IP packets (or bytes) that can comprise a singleconcatenated transmission. After a CM transmits a frame,the CM waits until the next MAP to arrive. At this time,if the CM has more than one packet waiting for upstreamtransmission, it must decide to use either piggybacking orconcatenation. Our implementation will use concatenationrather than piggybacking.
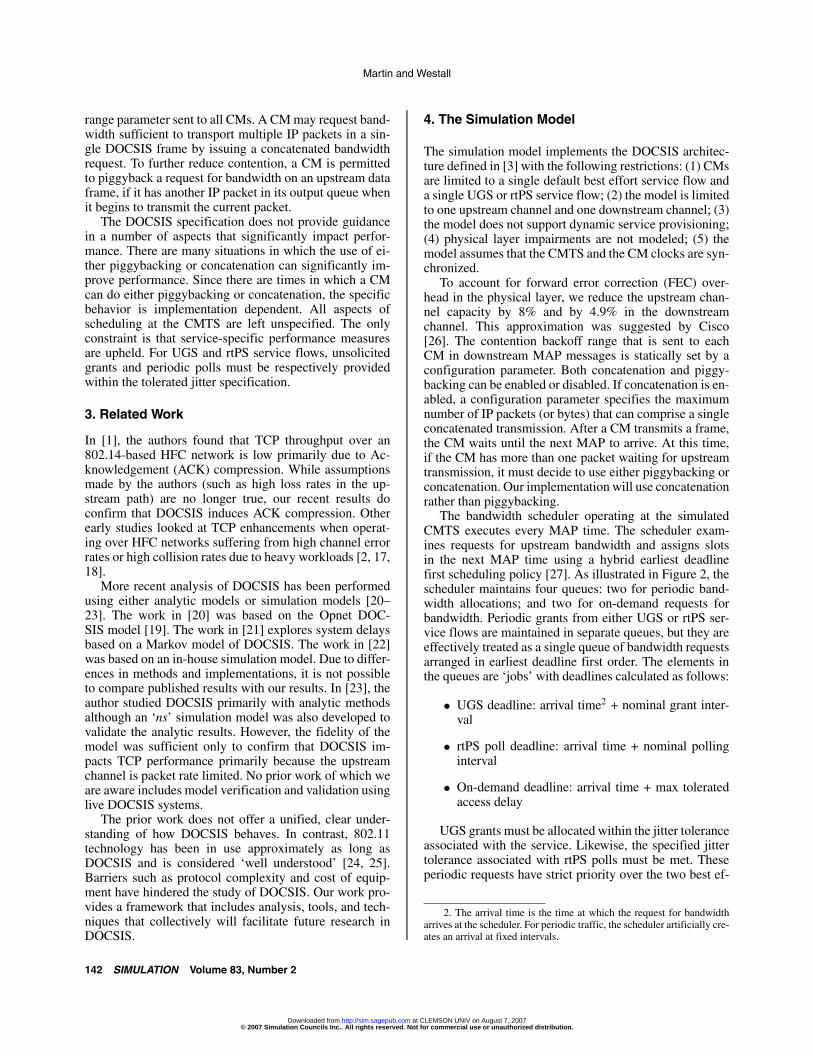
The bandwidth scheduler operating at the simulatedCMTS executes every MAP time. The scheduler exam-ines requests for upstream bandwidth and assigns slotsin the next MAP time using a hybrid earliest deadlinefirst scheduling policy [27]. As illustrated in Figure 2, thescheduler maintains four queues: two for periodic band-width allocations� and two for on-demand requests forbandwidth. Periodic grants from either UGS or rtPS ser-vice flows are maintained in separate queues, but they areeffectively treated as a single queue of bandwidth requestsarranged in earliest deadline first order. The elements inthe queues are ‘jobs’ with deadlines calculated as follows:
� UGS deadline: arrival time2 + nominal grant inter-val
� rtPS poll deadline: arrival time + nominal pollinginterval
� On-demand deadline: arrival time + max toleratedaccess delay
UGS grants must be allocated within the jitter toleranceassociated with the service. Likewise, the specified jittertolerance associated with rtPS polls must be met. Theseperiodic requests have strict priority over the two best ef-
2. The arrival time is the time at which the request for bandwidtharrives at the scheduler. For periodic traffic, the scheduler artificially cre-ates an arrival at fixed intervals.
142 SIMULATION Volume 83, Number 2
© 2007 Simulation Councils Inc.. All rights reserved. Not for commercial use or unauthorized distribution. at CLEMSON UNIV on August 7, 2007 http://sim.sagepub.comDownloaded from
A SIMULATION MODEL OF THE DOCSIS PROTOCOL
Figure 2. Simulation scheduler
fort queues. Periodic requests that miss their deadlines aredeleted and a ‘provisioning error’ statistic is incremented.
After periodic requests having deadlines that occur dur-ing the current MAP time are allocated, management slotsand the required minimum number of contention slotsare allocated. The remaining slots are then allocated tothe two classes of on-demand requests. When a CM re-quests bandwidth through a response to an rtPS poll, therequest is inserted in the rtPS aperiodic queue. The sched-uler divides the number of available slots by a weight fac-tor allowing the system to treat rtPS data requests witha different priority level than a data request that arrivesthrough either contention or piggybacked request mech-anisms. The maximum tolerated access delay allows theCMTS to control the level of backlogged requests. We setthis to 1 s. If an aperiodic job is not processed by its dead-line, the job is deleted and a ‘denied request’ statistic isincremented.
Figure 2 illustrates that the scheduling process includesa packing operation in which allocations are arrangedwithin the MAP. The simulation uses a form of next fit binpacking wherein jobs are inserted in the MAP in a mannerthat meets periodic jitter requirements and that optimizesperformance. By default, any unused slots are allocatedfor additional contention requests.
As noted earlier the DOCSIS specification permits theMAP time to grow up to a configured number of slots(known as the MAP lookahead). Our simulator can beconfigured to support this, but for all of the results re-ported here the MAP time was fixed.
The scheduling algorithm defines system performance.The algorithm that we have implemented, which we refer
to as the “DOCSIS compliant” scheduler, serves as a base-line. In the results reported in this paper, we focus the val-idation on relatively simple scenarios that do not involveUGS or rtPS services. Therefore the generic “DOCSIScompliant” scheduler that we have implemented shouldmatch the behavior of an actual system in the scenariosthat are studied.
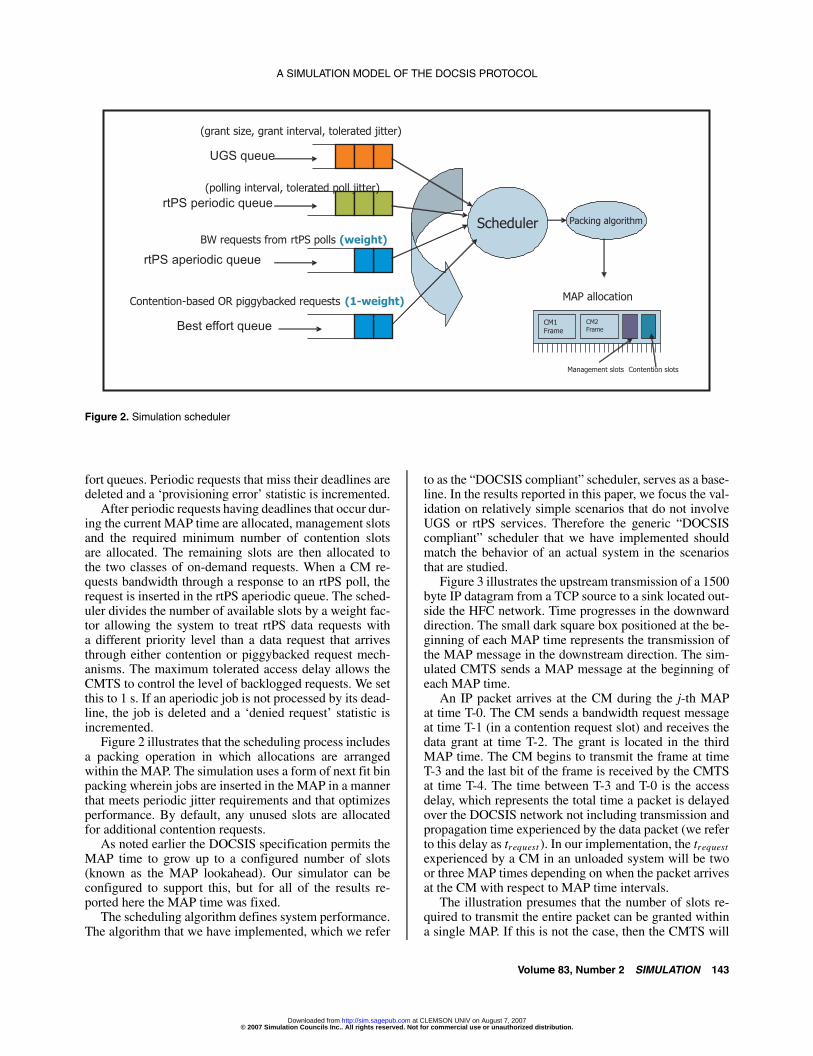
Figure 3 illustrates the upstream transmission of a 1500byte IP datagram from a TCP source to a sink located out-side the HFC network. Time progresses in the downwarddirection. The small dark square box positioned at the be-ginning of each MAP time represents the transmission ofthe MAP message in the downstream direction. The sim-ulated CMTS sends a MAP message at the beginning ofeach MAP time.
An IP packet arrives at the CM during the j-th MAPat time T-0. The CM sends a bandwidth request messageat time T-1 (in a contention request slot) and receives thedata grant at time T-2. The grant is located in the thirdMAP time. The CM begins to transmit the frame at timeT-3 and the last bit of the frame is received by the CMTSat time T-4. The time between T-3 and T-0 is the accessdelay, which represents the total time a packet is delayedover the DOCSIS network not including transmission andpropagation time experienced by the data packet (we referto this delay as trequest ). In our implementation, the trequestexperienced by a CM in an unloaded system will be twoor three MAP times depending on when the packet arrivesat the CM with respect to MAP time intervals.
The illustration presumes that the number of slots re-quired to transmit the entire packet can be granted withina single MAP. If this is not the case, then the CMTS will
Volume 83, Number 2 SIMULATION 143
© 2007 Simulation Councils Inc.. All rights reserved. Not for commercial use or unauthorized distribution. at CLEMSON UNIV on August 7, 2007 http://sim.sagepub.comDownloaded from
Martin and Westall
Figure 3. Upstream transmission scenario with variable MAP times
issue a sequence of partial grants, requiring the CM tosend DOCSIS (not IP) fragments. Reassembly of the fullIP packet is performed by the CMTS.
Packets that arrive at a CM from the subscriber inter-face are queued by the CM until they can be transmitted.The size of the upstream CM queue is a configuration pa-rameter.
In prior work we have shown that performance can de-teriorate as the MAP time grows [28, 29]. The contentionrequest allocation strategy and the use of fragmentation,concatenation and piggybacking also have significant im-pact on system performance.
5. Model Validation
As noted in the introduction, it can be argued that a simu-lation of a system as complex as a DOCSIS network cannever be claimed to have been truly verified or validated,and we certainly make no claims to having done so here.Nevertheless, it is important to establish, insofar as it ispossible, that the results produced by the simulation arenot inconsistent with behavior that can be observed on anoperational DOCSIS network.
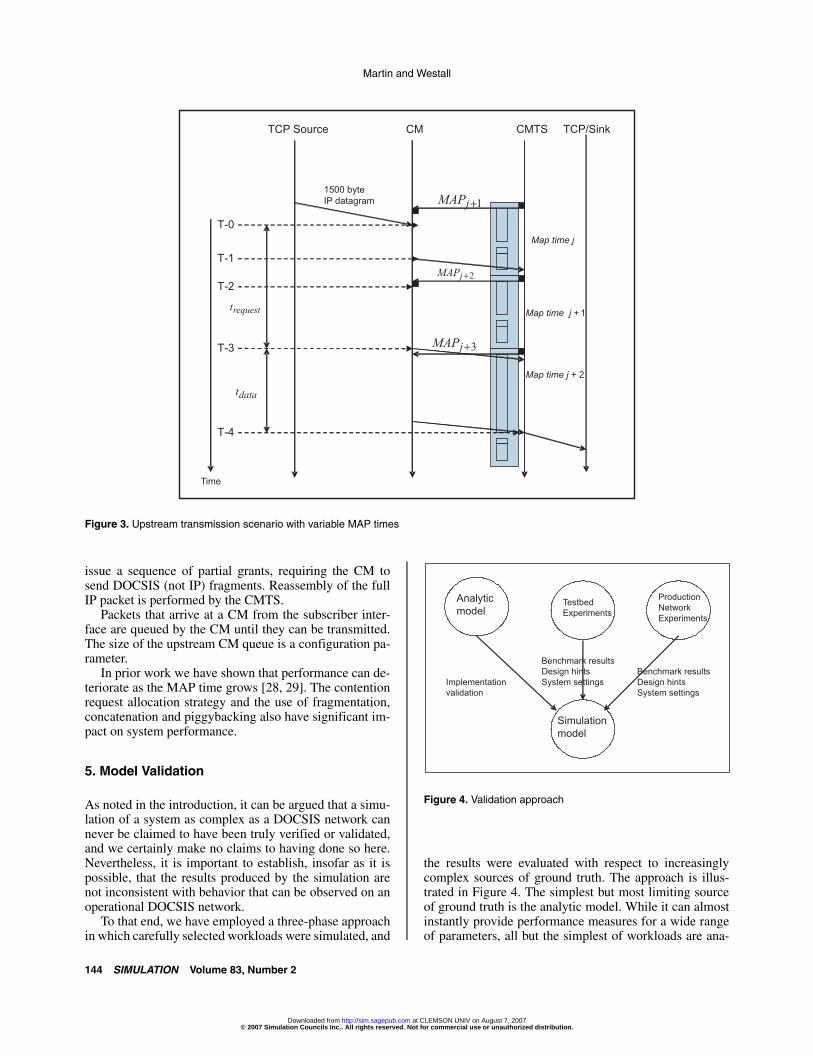
To that end, we have employed a three-phase approachin which carefully selected workloads were simulated, and
Figure 4. Validation approach
the results were evaluated with respect to increasinglycomplex sources of ground truth. The approach is illus-trated in Figure 4. The simplest but most limiting sourceof ground truth is the analytic model. While it can almostinstantly provide performance measures for a wide rangeof parameters, all but the simplest of workloads are ana-
144 SIMULATION Volume 83, Number 2
© 2007 Simulation Councils Inc.. All rights reserved. Not for commercial use or unauthorized distribution. at CLEMSON UNIV on August 7, 2007 http://sim.sagepub.comDownloaded from
A SIMULATION MODEL OF THE DOCSIS PROTOCOL
lytically intractable. Our analytic model assumes only asingle, always-on User Datagram Protocol (UDP) trafficsource that maintains a packet backlog at the CM. Nev-ertheless, it proved useful in the verification of the sim-ulation program and it provides a useful first step in thevalidation process.
To gain confidence that the DOCSIS simulation modelproduced correct behavior under somewhat more complex(and thus analytically intractable) workloads, we mea-sured performance of selected benchmark workloads ontwo operational DOCSIS networks: a private laboratorynetwork that we operate� and a public network operatedby Charter Communications.
Criteria used in selecting benchmark workloads in-cluded the following: workloads should be simple andprovide repeatable behavior to facilitate identification ofthe source(s) of anomalous behavior in the simulation.Some workloads should be explicitly designed to elicitknown idiosyncratic performance characteristics of theDOCSIS protocol
Therefore, in this first phase of validation, none of theworkloads introduced explicitly stochastic behavior suchas would be caused by the use of pseudo-random inter-packet times. Furthermore, even implicitly stochastic be-havior (as would be caused by multiple concurrent up-stream traffic sources) was also not present. In the studyinvolving the DOCSIS network of Charter Communica-tions stochastic behavior obviously was present, but wasnot introduced by our benchmark workloads.
Stochastic elements are present in benchmark work-loads in tests that are ongoing. Nevertheless, we remainconvinced that, for a simulation of a system as complexas a DOCSIS network, a very disciplined and incrementalapproach to validation is the most productive.
5.1 Analytic Validation
The upstream behavior of DOCSIS is similar to slottedAloha with reservations [30–32]. Following the methodpresented in [33], we define the maximum upstream ap-plication throughput, Tmaxus , to be
DperCycletdata�trequest
whereDperCycle is the amount of user data sent upstream in onereservation request cycle, tdata is the upstream transmis-sion and propagation time of the data, and trequest is thedelay associated with the request process. In this section,we consider an analytic model that computes the upstreamthroughput that could be obtained by a single applicationflow. The model does not consider loss or collision thatmight be caused by competing traffic. While the single-flow assumption is clearly limiting, it allows us to com-pare basic operation of the MAC analytic and simulationmodels to live DOCSIS networks under controlled condi-tions. For brevity, we only consider the backlogged casewhere a single CM always has 1500 byte IP packets tosend. Figure 3 illustrates the trequest and the tdata delaysin an upstream operation. The trequest represents the to-
tal delay experienced by the packet from its arrival at theCM until its first bit is transmitted upstream. The tdata isthe transmission and the propagation time of the upstreamdata frame.
For brevity, we also omit the details of the analyticmodel and focus upon its use in validating the simulation.Appendix A shows the derivation of the trequest for thecase of no piggybacking and concatenation and a fixednumber of contention slots in each MAP. Refer to [34] fora complete description of the analytic model. The modelincorporates basic configuration information such as thenumber of slots in a MAP, the number of managementslots and the number of contention request slots per MAP,the backoff range, and the stochastic nature of the backoffprocess. The model optionally accounts for piggybackingand concatenation. In this section we consider results fromthe analytic model with piggybacking and concatenationdisabled.
The analytic model presumes a single always-onsource in which a packet backlog is always present in theCM. Thus, it also closely models the behavior of a sus-tained TCP connection in which: (1) there is no packetloss� and (2) TCP window size and the rate of ACK ar-rivals is such that the assumptions related to the queuingbehavior at the CM are satisfied.
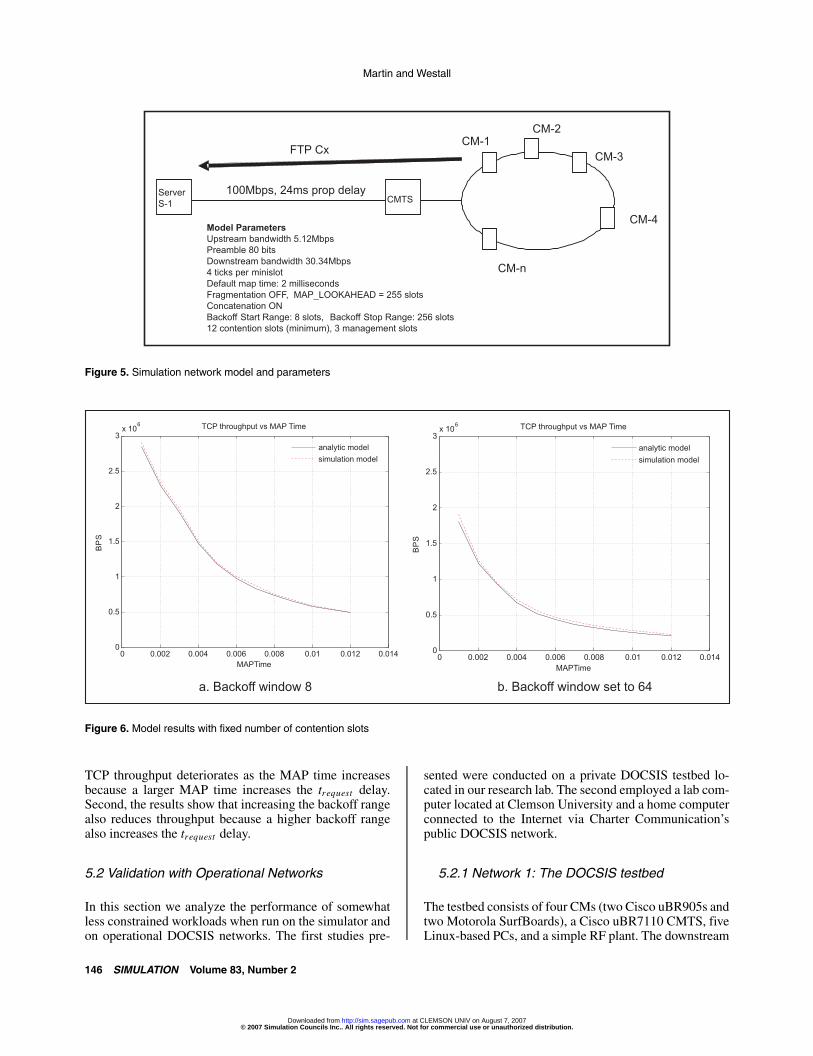
5.1.1 Simulation Methodology
The simulated network used in the analytic evaluation isillustrated in Figure 5. One FTP flow is active betweenCM-1 and the server S-1. The maximum TCP windowconfiguration setting was 11 packets which was sufficientto keep the upstream transmission queue at CM-1 alwaysfilled with data but to avoid queue overflow. We disabledpiggybacking and concatenation in the simulation modelso that it is consistent with the assumptions of the analyticmodel.
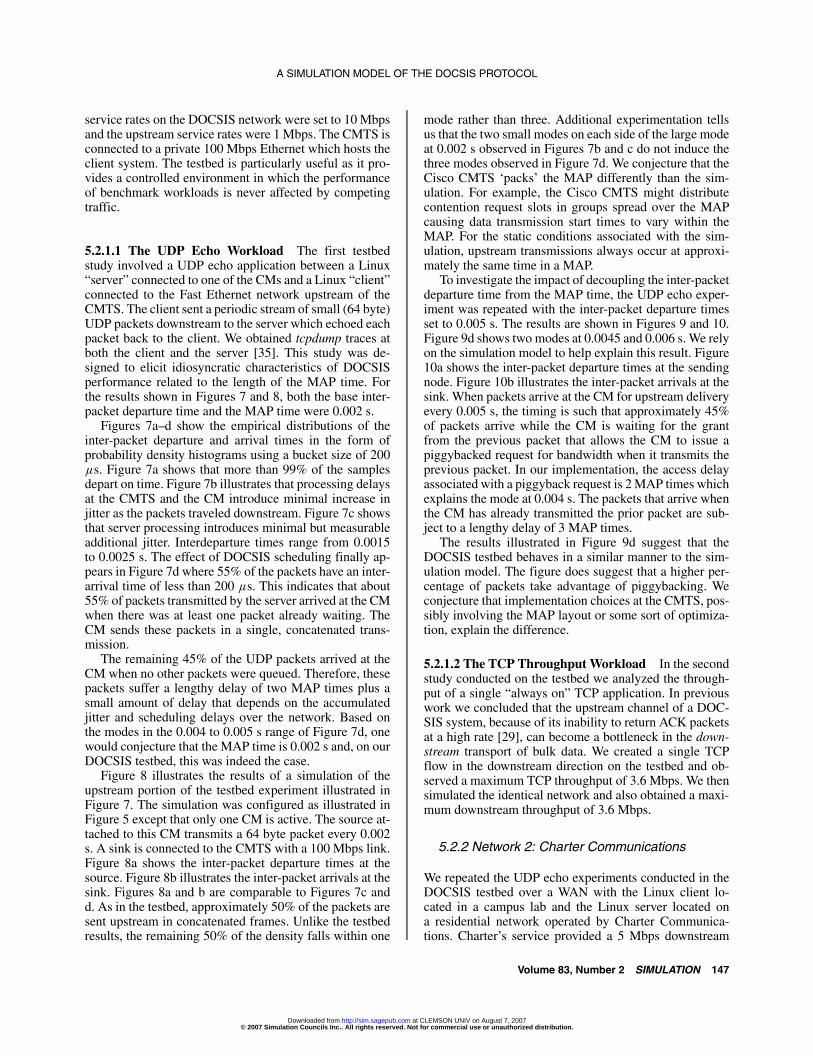
We performed multiple runs varying the MAP time pa-rameter from a value of 0.001 s to a maximum value of0.012 s. Each data point of the simulation model curve isthe average TCP throughput observed in a single simula-tion that ran for 1000 simulated seconds. We did not usemultiple runs as the variation over multiple runs was verysmall, less than 0.5%. To test the level of certainty asso-ciated with the statistic, we ran the MAP time of 0.002 spoint illustrated in Figure 6b for 10 iterations. The 99%confidence interval was within 0.23% about the mean.
Figures 6a and 6b show TCP throughput in Mbps pre-dicted by the analytic model and throughput observed inthe simulation experiment. A backoff range of eight slotswas used to obtain the results shown in Figure 6a. Thisparameter was increased to 64 slots for the results shownin Figure 6b. The throughput obtained by the simulationclosely tracks the throughput predicted by the analyticmodel in both cases with the maximum difference neverexceeding 10%. Two results are evident. First, upstream
Volume 83, Number 2 SIMULATION 145
© 2007 Simulation Councils Inc.. All rights reserved. Not for commercial use or unauthorized distribution. at CLEMSON UNIV on August 7, 2007 http://sim.sagepub.comDownloaded from
Martin and Westall
Figure 5. Simulation network model and parameters
Figure 6. Model results with fixed number of contention slots
TCP throughput deteriorates as the MAP time increasesbecause a larger MAP time increases the trequest delay.Second, the results show that increasing the backoff rangealso reduces throughput because a higher backoff rangealso increases the trequest delay.
5.2 Validation with Operational Networks
In this section we analyze the performance of somewhatless constrained workloads when run on the simulator andon operational DOCSIS networks. The first studies pre-
sented were conducted on a private DOCSIS testbed lo-cated in our research lab. The second employed a lab com-puter located at Clemson University and a home computerconnected to the Internet via Charter Communication’spublic DOCSIS network.
5.2.1 Network 1: The DOCSIS testbed
The testbed consists of four CMs (two Cisco uBR905s andtwo Motorola SurfBoards), a Cisco uBR7110 CMTS, fiveLinux-based PCs, and a simple RF plant. The downstream
146 SIMULATION Volume 83, Number 2
© 2007 Simulation Councils Inc.. All rights reserved. Not for commercial use or unauthorized distribution. at CLEMSON UNIV on August 7, 2007 http://sim.sagepub.comDownloaded from
A SIMULATION MODEL OF THE DOCSIS PROTOCOL
service rates on the DOCSIS network were set to 10 Mbpsand the upstream service rates were 1 Mbps. The CMTS isconnected to a private 100 Mbps Ethernet which hosts theclient system. The testbed is particularly useful as it pro-vides a controlled environment in which the performanceof benchmark workloads is never affected by competingtraffic.
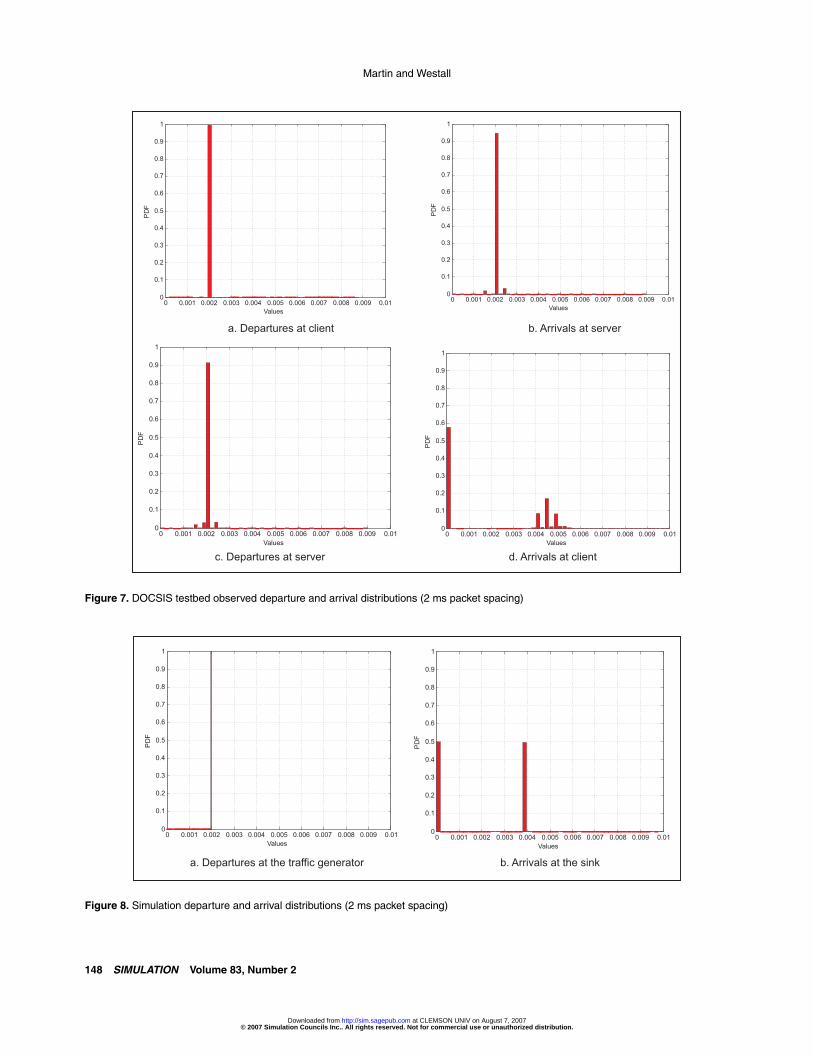
5.2.1.1 The UDP Echo Workload The first testbedstudy involved a UDP echo application between a Linux“server” connected to one of the CMs and a Linux “client”connected to the Fast Ethernet network upstream of theCMTS. The client sent a periodic stream of small (64 byte)UDP packets downstream to the server which echoed eachpacket back to the client. We obtained tcpdump traces atboth the client and the server [35]. This study was de-signed to elicit idiosyncratic characteristics of DOCSISperformance related to the length of the MAP time. Forthe results shown in Figures 7 and 8, both the base inter-packet departure time and the MAP time were 0.002 s.
Figures 7a–d show the empirical distributions of theinter-packet departure and arrival times in the form ofprobability density histograms using a bucket size of 200�s. Figure 7a shows that more than 99% of the samplesdepart on time. Figure 7b illustrates that processing delaysat the CMTS and the CM introduce minimal increase injitter as the packets traveled downstream. Figure 7c showsthat server processing introduces minimal but measurableadditional jitter. Interdeparture times range from 0.0015to 0.0025 s. The effect of DOCSIS scheduling finally ap-pears in Figure 7d where 55% of the packets have an inter-arrival time of less than 200 �s. This indicates that about55% of packets transmitted by the server arrived at the CMwhen there was at least one packet already waiting. TheCM sends these packets in a single, concatenated trans-mission.
The remaining 45% of the UDP packets arrived at theCM when no other packets were queued. Therefore, thesepackets suffer a lengthy delay of two MAP times plus asmall amount of delay that depends on the accumulatedjitter and scheduling delays over the network. Based onthe modes in the 0.004 to 0.005 s range of Figure 7d, onewould conjecture that the MAP time is 0.002 s and, on ourDOCSIS testbed, this was indeed the case.
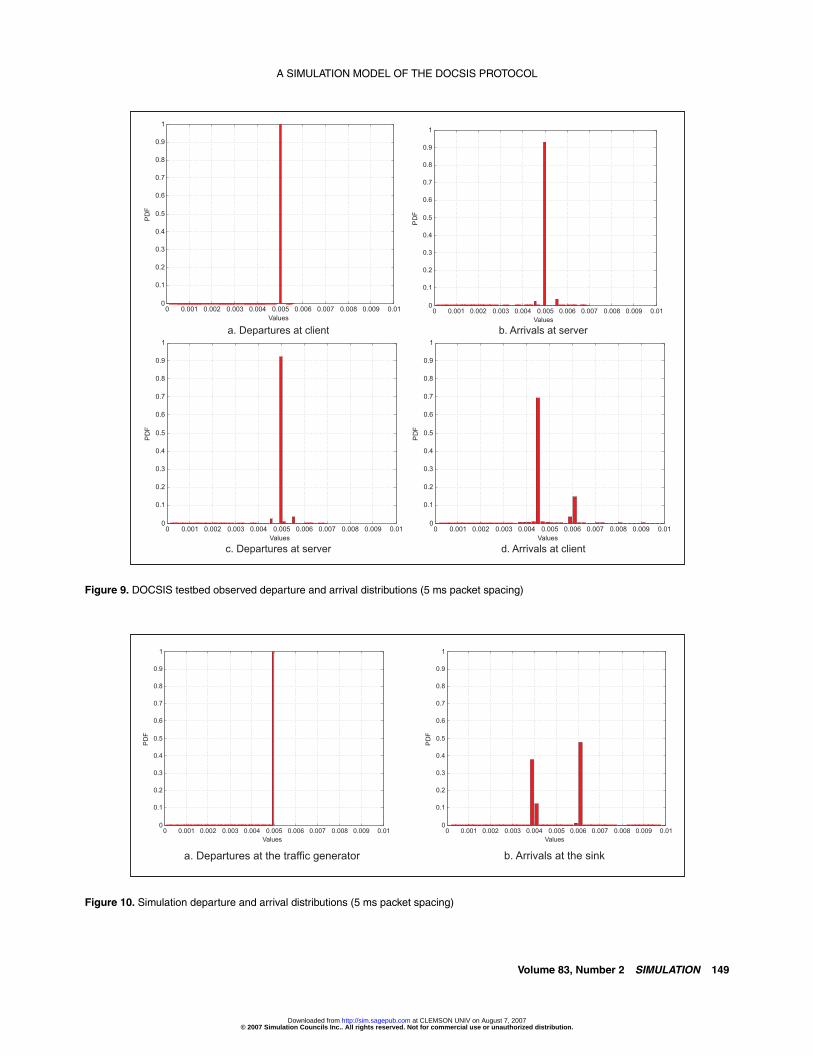
Figure 8 illustrates the results of a simulation of theupstream portion of the testbed experiment illustrated inFigure 7. The simulation was configured as illustrated inFigure 5 except that only one CM is active. The source at-tached to this CM transmits a 64 byte packet every 0.002s. A sink is connected to the CMTS with a 100 Mbps link.Figure 8a shows the inter-packet departure times at thesource. Figure 8b illustrates the inter-packet arrivals at thesink. Figures 8a and b are comparable to Figures 7c andd. As in the testbed, approximately 50% of the packets aresent upstream in concatenated frames. Unlike the testbedresults, the remaining 50% of the density falls within one
mode rather than three. Additional experimentation tellsus that the two small modes on each side of the large modeat 0.002 s observed in Figures 7b and c do not induce thethree modes observed in Figure 7d. We conjecture that theCisco CMTS ‘packs’ the MAP differently than the sim-ulation. For example, the Cisco CMTS might distributecontention request slots in groups spread over the MAPcausing data transmission start times to vary within theMAP. For the static conditions associated with the sim-ulation, upstream transmissions always occur at approxi-mately the same time in a MAP.
To investigate the impact of decoupling the inter-packetdeparture time from the MAP time, the UDP echo exper-iment was repeated with the inter-packet departure timesset to 0.005 s. The results are shown in Figures 9 and 10.Figure 9d shows two modes at 0.0045 and 0.006 s. We relyon the simulation model to help explain this result. Figure10a shows the inter-packet departure times at the sendingnode. Figure 10b illustrates the inter-packet arrivals at thesink. When packets arrive at the CM for upstream deliveryevery 0.005 s, the timing is such that approximately 45%of packets arrive while the CM is waiting for the grantfrom the previous packet that allows the CM to issue apiggybacked request for bandwidth when it transmits theprevious packet. In our implementation, the access delayassociated with a piggyback request is 2 MAP times whichexplains the mode at 0.004 s. The packets that arrive whenthe CM has already transmitted the prior packet are sub-ject to a lengthy delay of 3 MAP times.
The results illustrated in Figure 9d suggest that theDOCSIS testbed behaves in a similar manner to the sim-ulation model. The figure does suggest that a higher per-centage of packets take advantage of piggybacking. Weconjecture that implementation choices at the CMTS, pos-sibly involving the MAP layout or some sort of optimiza-tion, explain the difference.
5.2.1.2 The TCP Throughput Workload In the secondstudy conducted on the testbed we analyzed the through-put of a single “always on” TCP application. In previouswork we concluded that the upstream channel of a DOC-SIS system, because of its inability to return ACK packetsat a high rate [29], can become a bottleneck in the down-stream transport of bulk data. We created a single TCPflow in the downstream direction on the testbed and ob-served a maximum TCP throughput of 3.6 Mbps. We thensimulated the identical network and also obtained a maxi-mum downstream throughput of 3.6 Mbps.
5.2.2 Network 2: Charter Communications
We repeated the UDP echo experiments conducted in theDOCSIS testbed over a WAN with the Linux client lo-cated in a campus lab and the Linux server located ona residential network operated by Charter Communica-tions. Charter’s service provided a 5 Mbps downstream
Volume 83, Number 2 SIMULATION 147
© 2007 Simulation Councils Inc.. All rights reserved. Not for commercial use or unauthorized distribution. at CLEMSON UNIV on August 7, 2007 http://sim.sagepub.comDownloaded from
Martin and Westall
Figure 7. DOCSIS testbed observed departure and arrival distributions (2 ms packet spacing)
Figure 8. Simulation departure and arrival distributions (2 ms packet spacing)
148 SIMULATION Volume 83, Number 2
© 2007 Simulation Councils Inc.. All rights reserved. Not for commercial use or unauthorized distribution. at CLEMSON UNIV on August 7, 2007 http://sim.sagepub.comDownloaded from
A SIMULATION MODEL OF THE DOCSIS PROTOCOL
Figure 9. DOCSIS testbed observed departure and arrival distributions (5 ms packet spacing)
Figure 10. Simulation departure and arrival distributions (5 ms packet spacing)
Volume 83, Number 2 SIMULATION 149
© 2007 Simulation Councils Inc.. All rights reserved. Not for commercial use or unauthorized distribution. at CLEMSON UNIV on August 7, 2007 http://sim.sagepub.comDownloaded from
Martin and Westall
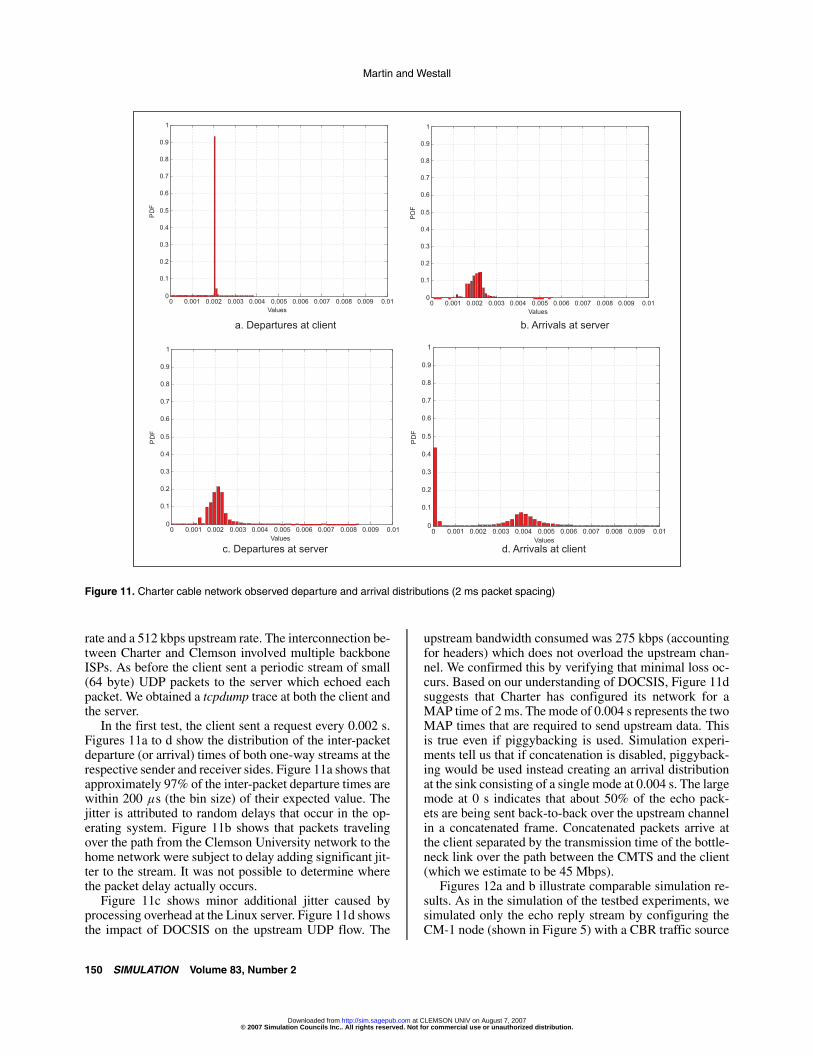
Figure 11. Charter cable network observed departure and arrival distributions (2 ms packet spacing)
rate and a 512 kbps upstream rate. The interconnection be-tween Charter and Clemson involved multiple backboneISPs. As before the client sent a periodic stream of small(64 byte) UDP packets to the server which echoed eachpacket. We obtained a tcpdump trace at both the client andthe server.
In the first test, the client sent a request every 0.002 s.Figures 11a to d show the distribution of the inter-packetdeparture (or arrival) times of both one-way streams at therespective sender and receiver sides. Figure 11a shows thatapproximately 97% of the inter-packet departure times arewithin 200 �s (the bin size) of their expected value. Thejitter is attributed to random delays that occur in the op-erating system. Figure 11b shows that packets travelingover the path from the Clemson University network to thehome network were subject to delay adding significant jit-ter to the stream. It was not possible to determine wherethe packet delay actually occurs.
Figure 11c shows minor additional jitter caused byprocessing overhead at the Linux server. Figure 11d showsthe impact of DOCSIS on the upstream UDP flow. The
upstream bandwidth consumed was 275 kbps (accountingfor headers) which does not overload the upstream chan-nel. We confirmed this by verifying that minimal loss oc-curs. Based on our understanding of DOCSIS, Figure 11dsuggests that Charter has configured its network for aMAP time of 2 ms. The mode of 0.004 s represents the twoMAP times that are required to send upstream data. Thisis true even if piggybacking is used. Simulation experi-ments tell us that if concatenation is disabled, piggyback-ing would be used instead creating an arrival distributionat the sink consisting of a single mode at 0.004 s. The largemode at 0 s indicates that about 50% of the echo pack-ets are being sent back-to-back over the upstream channelin a concatenated frame. Concatenated packets arrive atthe client separated by the transmission time of the bottle-neck link over the path between the CMTS and the client(which we estimate to be 45 Mbps).
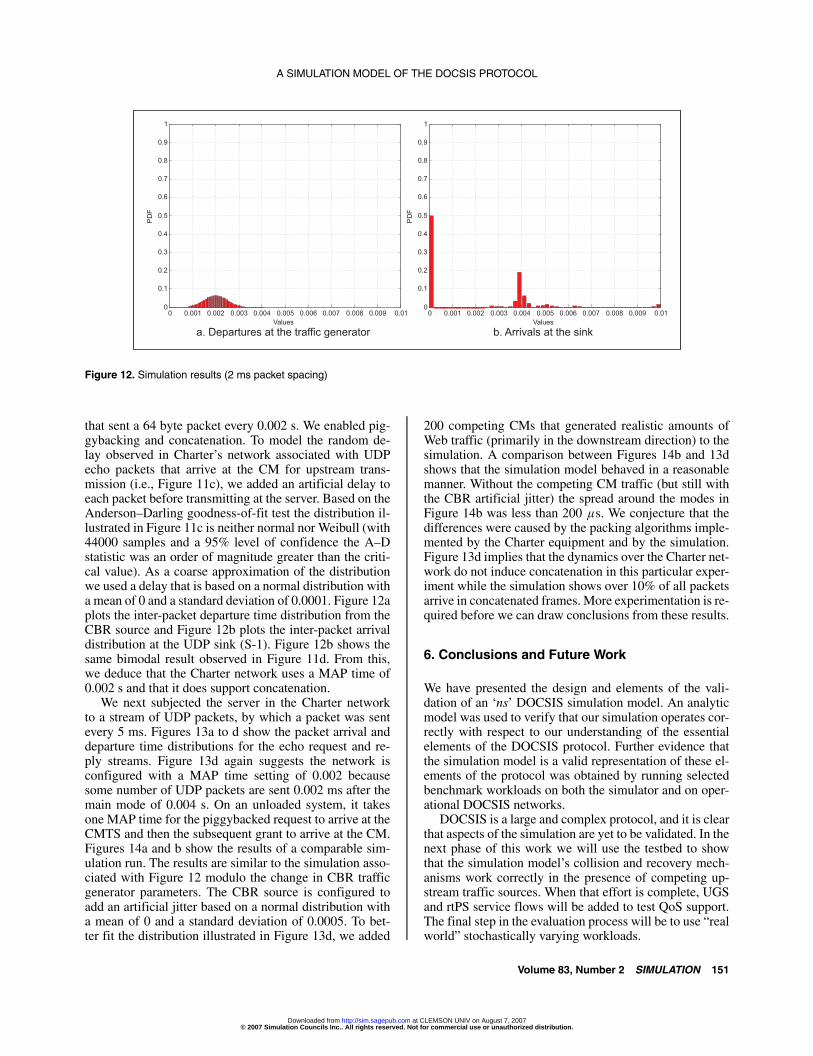
Figures 12a and b illustrate comparable simulation re-sults. As in the simulation of the testbed experiments, wesimulated only the echo reply stream by configuring theCM-1 node (shown in Figure 5) with a CBR traffic source
150 SIMULATION Volume 83, Number 2
© 2007 Simulation Councils Inc.. All rights reserved. Not for commercial use or unauthorized distribution. at CLEMSON UNIV on August 7, 2007 http://sim.sagepub.comDownloaded from
A SIMULATION MODEL OF THE DOCSIS PROTOCOL
Figure 12. Simulation results (2 ms packet spacing)
that sent a 64 byte packet every 0.002 s. We enabled pig-gybacking and concatenation. To model the random de-lay observed in Charter’s network associated with UDPecho packets that arrive at the CM for upstream trans-mission (i.e., Figure 11c), we added an artificial delay toeach packet before transmitting at the server. Based on theAnderson–Darling goodness-of-fit test the distribution il-lustrated in Figure 11c is neither normal nor Weibull (with44000 samples and a 95% level of confidence the A–Dstatistic was an order of magnitude greater than the criti-cal value). As a coarse approximation of the distributionwe used a delay that is based on a normal distribution witha mean of 0 and a standard deviation of 0.0001. Figure 12aplots the inter-packet departure time distribution from theCBR source and Figure 12b plots the inter-packet arrivaldistribution at the UDP sink (S-1). Figure 12b shows thesame bimodal result observed in Figure 11d. From this,we deduce that the Charter network uses a MAP time of0.002 s and that it does support concatenation.
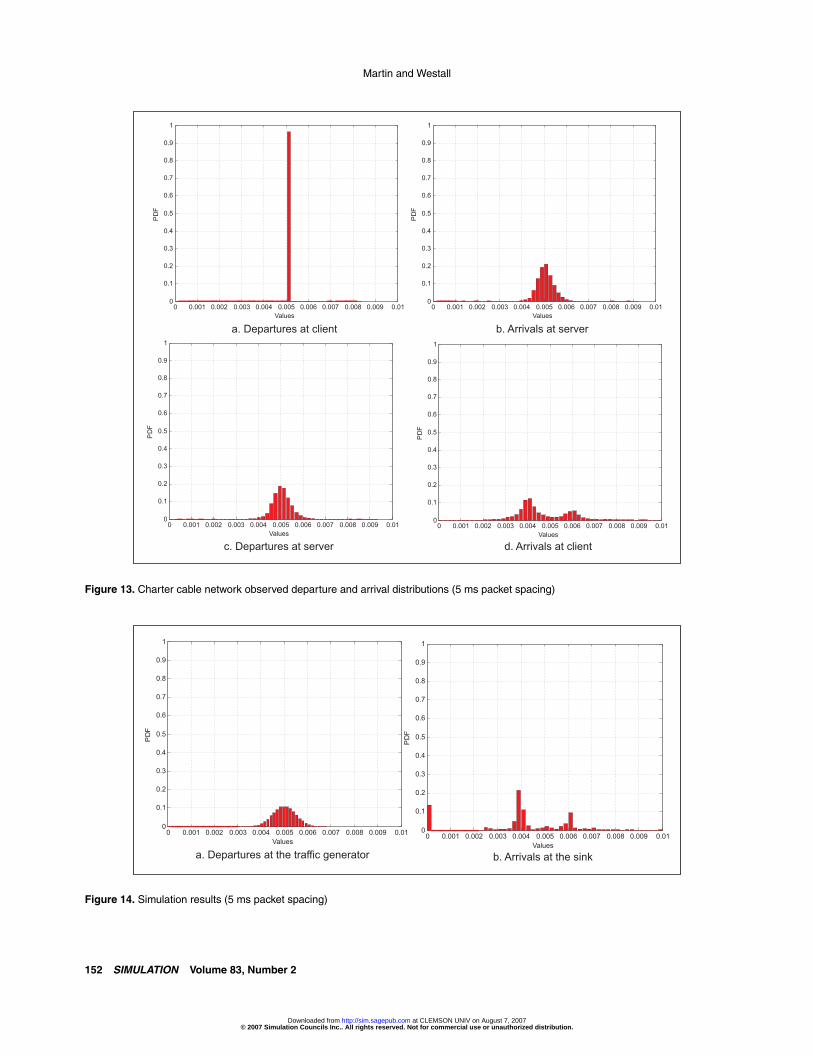
We next subjected the server in the Charter networkto a stream of UDP packets, by which a packet was sentevery 5 ms. Figures 13a to d show the packet arrival anddeparture time distributions for the echo request and re-ply streams. Figure 13d again suggests the network isconfigured with a MAP time setting of 0.002 becausesome number of UDP packets are sent 0.002 ms after themain mode of 0.004 s. On an unloaded system, it takesone MAP time for the piggybacked request to arrive at theCMTS and then the subsequent grant to arrive at the CM.Figures 14a and b show the results of a comparable sim-ulation run. The results are similar to the simulation asso-ciated with Figure 12 modulo the change in CBR trafficgenerator parameters. The CBR source is configured toadd an artificial jitter based on a normal distribution witha mean of 0 and a standard deviation of 0.0005. To bet-ter fit the distribution illustrated in Figure 13d, we added
200 competing CMs that generated realistic amounts ofWeb traffic (primarily in the downstream direction) to thesimulation. A comparison between Figures 14b and 13dshows that the simulation model behaved in a reasonablemanner. Without the competing CM traffic (but still withthe CBR artificial jitter) the spread around the modes inFigure 14b was less than 200 �s. We conjecture that thedifferences were caused by the packing algorithms imple-mented by the Charter equipment and by the simulation.Figure 13d implies that the dynamics over the Charter net-work do not induce concatenation in this particular exper-iment while the simulation shows over 10% of all packetsarrive in concatenated frames. More experimentation is re-quired before we can draw conclusions from these results.
6. Conclusions and Future Work
We have presented the design and elements of the vali-dation of an ‘ns’ DOCSIS simulation model. An analyticmodel was used to verify that our simulation operates cor-rectly with respect to our understanding of the essentialelements of the DOCSIS protocol. Further evidence thatthe simulation model is a valid representation of these el-ements of the protocol was obtained by running selectedbenchmark workloads on both the simulator and on oper-ational DOCSIS networks.
DOCSIS is a large and complex protocol, and it is clearthat aspects of the simulation are yet to be validated. In thenext phase of this work we will use the testbed to showthat the simulation model’s collision and recovery mech-anisms work correctly in the presence of competing up-stream traffic sources. When that effort is complete, UGSand rtPS service flows will be added to test QoS support.The final step in the evaluation process will be to use “realworld” stochastically varying workloads.
Volume 83, Number 2 SIMULATION 151
© 2007 Simulation Councils Inc.. All rights reserved. Not for commercial use or unauthorized distribution. at CLEMSON UNIV on August 7, 2007 http://sim.sagepub.comDownloaded from
Martin and Westall
Figure 13. Charter cable network observed departure and arrival distributions (5 ms packet spacing)
Figure 14. Simulation results (5 ms packet spacing)
152 SIMULATION Volume 83, Number 2
© 2007 Simulation Councils Inc.. All rights reserved. Not for commercial use or unauthorized distribution. at CLEMSON UNIV on August 7, 2007 http://sim.sagepub.comDownloaded from
A SIMULATION MODEL OF THE DOCSIS PROTOCOL
Figure 15. Backlogged contention request delay
Shared medium broadband access such as DOCSIScable and WiMAX are complex. The behavior of thesesystems and their subsequent impact on the Internet isinfluenced by the network provider’s choice of equipmentand by its configuration. The methods that we have usedfor model validation, particularly the analysis of live net-works, help ground our simulation model to real systems.By making a validated simulation model available to theresearch community, we hope that others in academia willalso contribute to the evolution of DOCSIS broadband ac-cess networks.
7. Appendix A. Analytic Model
The maximum upstream application throughput, Tmaxus ,is defined as
DperCycletdata�trequest
. We derive the trequest for the caseof no piggybacking, no concatenation, with a fixed num-ber of contention slots allocated in each MAP, and with abacklog of packets waiting for upstream transmission.
The trequest has two components, the Dtotal Request Delayand the Dgrant . The former is the total number of slotsdelayed from when a packet arrives until when the re-quest for bandwidth is transmitted. For the backloggedcase, this delay is simply the time from when the previ-ous data transmission ends until when the bandwidth re-quest is sent. The Dtotal Request Delay includes a static por-tion (the configured number of management slots Nms)and a random portion (the collision backoff DC SBackof f ).The Dgrant represents the delay from when the CM trans-mits the request until it begins transmitting the data frame.
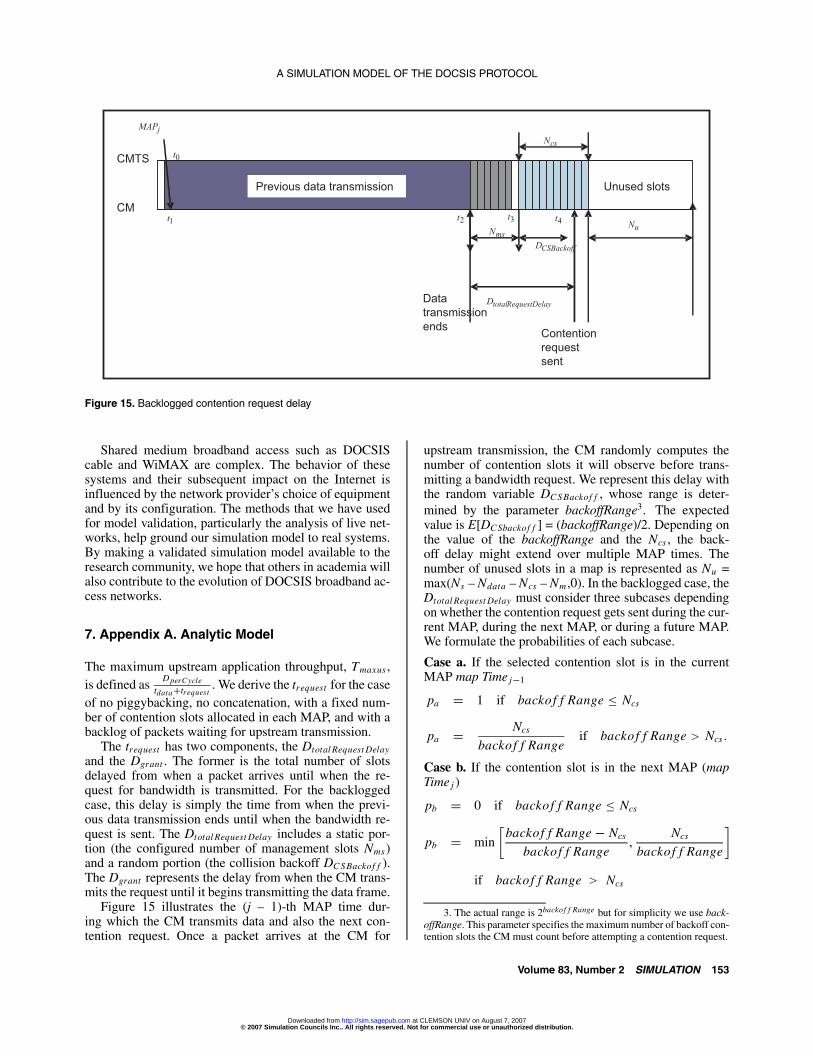
Figure 15 illustrates the (j – 1)-th MAP time dur-ing which the CM transmits data and also the next con-tention request. Once a packet arrives at the CM for
upstream transmission, the CM randomly computes thenumber of contention slots it will observe before trans-mitting a bandwidth request. We represent this delay withthe random variable DC S Backof f , whose range is deter-mined by the parameter backoffRange3. The expectedvalue is E[DC Sbackof f ] = (backoffRange)/2. Depending onthe value of the backoffRange and the Ncs , the back-off delay might extend over multiple MAP times. Thenumber of unused slots in a map is represented as Nu =max(Ns – Ndata – Ncs – Nm ,0). In the backlogged case, theDtotal Request Delay must consider three subcases dependingon whether the contention request gets sent during the cur-rent MAP, during the next MAP, or during a future MAP.We formulate the probabilities of each subcase.
Case a. If the selected contention slot is in the currentMAP map Time j�1
pa � 1 if backof f Range � Ncs
pa � Ncs
backof f Rangeif backof f Range � Ncs �
Case b. If the contention slot is in the next MAP (mapTime j )
pb � 0 if backof f Range � Ncs
pb � min
�backof f Range � Ncs
backof f Range�
Ncs
backof f Range
�
if backof f Range � Ncs
3. The actual range is 2backof f Range but for simplicity we use back-offRange. This parameter specifies the maximum number of backoff con-tention slots the CM must count before attempting a contention request.
Volume 83, Number 2 SIMULATION 153
© 2007 Simulation Councils Inc.. All rights reserved. Not for commercial use or unauthorized distribution. at CLEMSON UNIV on August 7, 2007 http://sim.sagepub.comDownloaded from
Martin and Westall
Case c. If the selected contention slot falls in a MAP atleast 2 MAP times in the future (map Time j�1 or later)
pc � max
�backof f Range � 2Ncs
backof f Range� 0
��
The expected delay from when the data transmission ter-minates until when the request is sent is the weighted de-lays for each subcase.
E Dtotal Request Delay
� pa�Nms � E DC SBackof f
�� pb
�Nms � Ncs � Nu � Nms � Ncs
� rem�
E DC SBackof fNcs
��
� pc
�Nms � Ncs � Nu �
�f loor
�E DC SBackof f
Ncs
��
� Ns � Nms � Ncs � rem�
E DC SBackof fNcs
���
The expected value of Dgrant consists of four delay com-ponents (all defined in units of slot times):
E Dgrant � DRequesttransi t � E DC MT SMap Alignment
� Dschedule � DMaptransit
� DC M MapAlignment �
We summarize each component as follows:
DRequesttransit : Represents the transmission andpropagation time experienced by the contention re-quest. A bandwidth request frame fits in one slot
which leads to DRequesttransit � ceil�
tslot � tproptslotT ime
�.
DC MT SMapAllignment : Represents the number of slotsfrom when the CMTS received a request from aCM until the beginning of the next MAP time. Thevalue depends on whether the contention request ar-rives during a MAP in which a data packet fromthe CM arrived (as in Figure 4) or if the request ar-rived during a MAP time which did not include adata grant. For the former case, the expected valueis DC MT SMapAlignment = Ncs /2 + Nu . For the lat-ter case, the value is DC MT SMapAlignment = Ncs /2 +Nu + Ns – (Ncs /2 + Nmgt ). The first case occurs
with probability p � min�
Ncsbackof f Range � 1
�. There-
fore, E[DC MT SMapAlignment ] = p(Ncs /2 + Nu) (1 –p)(Ncs /2 + Nu + Ns – (Ncs /2 + Nmgt )).
Dschedule: Represents waiting time experienced bythe request at the CMTS caused by scheduling de-lays. This delay will be a number of slots times that
are integral multiples of the number of slots in aMAP. In other words, the granularity of the schedul-ing delays at the CMTS are in units of MAP times.For the analysis presented in this paper we assumethat this delay is 0.
DMaptransit t : Represents the transmission and prop-agation time (in slots) experienced by the MAPmessage in the downstream direction.
DC M Map Alignment : Represents the number of slotsfrom when the MAP message arrives at the CM un-til the grant. This will be DC M MapAlignment = Ns –DMapT ransit .
8. References
[1] Elloumi, O., et al. 2000. A simulation-based study of TCP dynamicsover HFC networks. Computer Networks 32(3), 301–17.
[2] Cohen, R., and S. Ramanathan. 1998. TCP for high performancein hybrid fiber coaxial broad-band access networks. IEEE/ACMTransactions on Networking 6(1), 15–29.
[3] Cable Television Labs Inc., CableLabs, “Data-Over CableService Interface Specifications- Radio Frequency InterfaceSpecification”, SP-RFIv2.0, available at http://www.cable-modem.com/specifications/specifications20.html.
[4] CableLabs. www.cablelabs.com[5] Horrigan, J. 2005. Broadband Adoption in the United States,
PEW internet report. Available at http://www.pewinternet.org/pdfs/PIP_Broadband.TPRC_Sept05.pdf
[6] The Network Simulator –ns2. UCB/LBNL/VINT http://www.isi.edu/nsnam/ns/
[7] Pawlikowski, K., H. Jeong, and J. Lee. 2002. On credibility of simu-lation studies of telecommunications networks. IEEE Communi-cations, 40(1), pp. 132–139.
[8] Floyd, S., and E. Kohler. 2003. Internet research needs better models.ACM SIGCOMM Computer Communication Review, 33(1), 29–34.
[9] Gurtov, A., and S. Floyd. 2004. Modeling wireless links for transportprotocols. ACM SIGCOMM Computer Communication Review34(24), 85–96.
[10] Heidemann, J. et al. 2001. Effects of detail in wireless network sim-ulation. In Proceedings of the SCS Multiconference on Distrib-uted Simulation, pp. 3–11.
[11] Kotz, D., C. Newport, and C. Elliott. 2003. The Mistaken Axioms ofWireless-Network Research. Dartmouth College Computer Sci-ence, Tech. Rep. TR2003-467.
[12] Bianchi, G., F. Borgonovo, L. Fratta, L. Musumeci, and M. Zorzi.1997. C-PRMA: a centralized packet reservation multiple accessfor local wireless communications. IEEE Transactions on Vehic-ular Technology 46(2), 422–435.
[13] Goodman, D., R. Valenzuela, K. Gayliard, and B. Ramamurthi.1989. Packet reservation multiple access for local wireless com-munication. IEEE Transactions on Communications 37(3), 885–890.
[14] Crowther, W., R. Rettberg, D. Waldem, S. Ornstein, and F.Heart. 1973. A system for broadcast communications: reserva-tion ALOHA. In Proceedings of the Sixth Hawaii InternationalSystem Science Conference, Hawaii, pp. 596–603.
[15] Cai, J., and D. Goodman. 1997. General packet radio services. IEEECommunications Magazine 35, 122–31.
[16] Ghribi, B., and L. Logrippo. 2000. Understanding GPRS: the GSMpacket radio service. Computer Networks 34, 763–79.
[17] Golmie, N., Y. Saintillan, and D. Su. 1999. A review of contentionresolution algorithms for IEEE 802.14 networks”, IEEE Commu-nication Surveys, 2(1), electronic journal.
154 SIMULATION Volume 83, Number 2
© 2007 Simulation Councils Inc.. All rights reserved. Not for commercial use or unauthorized distribution. at CLEMSON UNIV on August 7, 2007 http://sim.sagepub.comDownloaded from
A SIMULATION MODEL OF THE DOCSIS PROTOCOL
[18] Sala, D., J. Limb, and S. Khaunte. 1998. Adaptive control mech-anism for cable modem MAC protocols. In Proceedings of theIEEE Conference on Computer Communications (IEEE Infocom98), San Francisco, California, pp. 1392–1399.
[19] Opnet simulation tool. www.opnet.com[20] Chandrasekaran, G., M. Hawa, and D. Petr. 2003. Preliminary
performance evaluation of QoS in DOCSIS1.1, ITTC-FY2003-TR-22736-01, Information and Telecommunication TechnologyCenter, University of Kansas.
[21] Xiao, X., Y. Chew, W. Seah, and C. Ko. 2001. Performance analy-sis for voice and data integration in hybrid fiber/coax networks.Computer Networks 36, 323–41.
[22] Murphy, R. 2004. A simulation study of DOCSIS channel band-width allocation strategies for minimal user response time. Mas-ters Thesis, Department of Computer Science, The University ofTexas at San Antonio.
[23] Liao, W. 2006. The behavior of TCP over DOCSIS-based CATVnetworks. IEEE Transactions on Communications 54, 1633–42.
[24] Bianchi, G. 2000. Performance analysis of the IEEE 802.11 distrib-uted coordination function. IEEE Journal on Selected Areas inCommunications 18(3), 535–547.
[25] Balakrishnan, H., V. Padmanabhan, S. Seshan, and R. Katz. 1997.A comparison of mechanisms for improving TCP performanceover wireless links. IEEE/ACM Transaction on Networking 5(6),756–69.
[26] Cisco white paper. Understanding Data Throughput in a DOCSISWorld, available at http://www.cisco.comwarp/public/109/data_thruputdocsis_world_19220.pdf
[27] Ferrari, D., and D. Verma. 1990. A scheme for real-time channelestablishment in wide-area networks. IEEE Journal on SelectedAreas in Communications 8, 368–79.
[28] Martin, J., and N. Shrivastay. 2003. Modeling the DOCSIS 1.1/2.0MAC protocol. In Proceedings of the IEEE International Confer-ence on Complete Communications and Networks (ICCCN 03),Dallas, Texas, pp. 205–210.
[29] Martin, J. 2005. The impact of the DOCSIS 1.1/2.0 MAC proto-col on TCP. In Proceedings of the IEEE Consumer Communica-
tions and Networking Conference, Las Vegas, Nevada, pp. 302–306.
[30] Roberts, L. 1973. Dynamic allocation of satellite capacity throughpacket reservation. In Proceedings of AFIPS National ComputerConference, AFIPS, New York, vol. 42, pp. 711–716.
[31] Abramson N. 1970. The Aloha system – another alternative forcomputer communications. In Proceedings of the AFIPS FallJoint Computer Conference, vol. 37, pp. 281–283.
[32] Lam, S., and L. Kleinrock. 1975. Packet switching in multiaccessbroadcast channel: dynamic control procedures. IEEE Transac-tions on Communications, 23(9), 891–904.
[33] Bertsekas, D., and R. Gallager. 1992. Data Networks, New Jersey:Prentice-Hall.
[34] Martin, J., and M. Westall. DOCSIS Analytic Models, work inprogress, available at http://www.clemson.edu/�jmarty/docsis.html.
[35] tcpdump program available at http://www.tcpdump.org
Jim Martin is an Assistant Professor in the School of Comput-ing at Clemson University. His research interests include broad-band access, autonomic computing, Internet protocols and net-work performance analysis. He has received funding from NASA,the Department of Justice, BMW, IBM, and Cisco. Dr Martin re-ceived his PhD from North Carolina State University. Prior tojoining Clemson, Dr Martin was a consultant for Gartner andprior to that a software engineer for IBM.
James Westall is a Professor of Computer Science in the Schoolof Computing at Clemson University. His present research inter-ests include computer network performance analysis and highperformance computing using GPUs. He received his PhD fromthe University of North Carolina at Chapel Hill.
Volume 83, Number 2 SIMULATION 155
© 2007 Simulation Councils Inc.. All rights reserved. Not for commercial use or unauthorized distribution. at CLEMSON UNIV on August 7, 2007 http://sim.sagepub.comDownloaded from