Embed Size (px)
Citation preview
Government Information Quarterly 26 (2009) 15–24
Contents lists available at ScienceDirect
Government Information Quarterly
j ourna l homepage: www.e lsev ie r.com/ locate /gov inf
Simulation and animation for adopting shared services: Evaluating and comparingalternative arrangements
Marijn Janssen a,⁎, Anton Joha b, Arre Zuurmond a
a Delft University of Technology, The Netherlandsb EquaTerra, The Netherlands
⁎ Corresponding author. Delft University of Technologand Management, Jaffalaan 5, 2628 BX Delft, The Nethe
E-mail address: [email protected] (M. Jans
0740-624X/$ – see front matter © 2008 Elsevier Inc. Aldoi:10.1016/j.giq.2008.08.004
a b s t r a c t
a r t i c l e i n f oAvailable online 6 November 2008
Keywords:
Although shared service orgthe organizational arrangemstakeholders may have con
AdoptionSimulationAnimationTransformationServiceService systemShared servicesShared service benefitsService-oriented governmentShared service organizationsShared service centers
ceptions about shared service arrangements. As such, there is a need for supportfor the adoption of shared services.In this paper, we develop and statistically validate simulation models to evaluate the impact of sharedservices, and in this way support their adoption. We analyze a case study involving municipalities thatwanted to share services and found that simulation models facilitate discussions about alternativearrangements prior to implementation. The simulation models show that shared services can result inimproved efficiency and service levels. However, the type of arrangement determines the level of efficiency,as high service levels can only be realized at the expense of efficiency, which means that the decision aboutthe type of arrangement is not obvious. Decision-makers should understand the implications of sharedservice arrangement prior to implementation and make decisions with regard to key design variables.
© 2008 Elsevier Inc. All rights reserved.
anizations have the potential to improve government operations, the adoption ofents involved has been limited. Their impact may not be clear in advance and
1. Introduction
In a recent study, technical and organizational aspects of sharedservices are mentioned as a key research theme (Irani, Elliman, &Jackson, 2007). Shared services organizations (SSOs) or Shared ServiceCenters (SSCs) are becoming more popular as a service managementand delivery option in industry (Bergeron, 2003; Ulbrich, 2006) andgovernment (Grant, McKnight, Uruthirapathy, & Brown, 2007;Janssen, Joha, & Weerakkody, 2007). In many countries, the potentialbenefits of sharing services have resulted in the creation of SSCs aspart of the national infrastructures, and a number of countries,including the USA, Canada, Australia, Ireland, and the Netherlands,have adopted shared services (e.g. Accenture, 2006). Other countriesare also interested in establishing shared service centers to supportand speed E-Government development, and the potential savingswithin the European Union are estimated to be substantial (KableDIR-ECT, 2007).
The basic premise with regard to shared services is that servicesthat are provided by one organization or department can be providedto users with relatively little effort (Bergeron, 2003). The design ofshared services is often a trade-off, because not all objectives can berealized at the same time (Janssen & Joha, 2006). It is not clear which
y, Faculty of Technology, Policyrlands. Fax: +31 15 278 3741.sen).
l rights reserved.
approach allows organizations to make the most of shared services. Inaddition, because introducing shared services is a major decision thathas a long-term impact on all the participants, it will have to be aconscious decision that is supported by all the stakeholders involved.
Only a small portion of all services are shared (KableDIRECT, 2007).Ulbrich (2006) has found that adopting an SSC requires an extensivebusiness process re-engineering approach whereby agencies will haveto transfer the development, maintenance, and control of their in-formation systems to a different organization and abandon theirexisting information systems. Government organizations often oper-ate as independent and autonomous units without understandingother public organizations. Organizations that decide to share theirservices need to work together and make decisions concerning whichservices to share, as well as how to transform their business processesand standardize their services and systems.
Currently, there are significant barriers to transforming structuresand processes within local government (Beynon-Davies & Williams,2003). Some of the frequently mentioned problems include theinability to predict the outcomes of a change (Meel & Sol, 1996), thelack of alignment between organizational goals and the informationtechnology (IT) involved, the existence of multiple (sometimes con-flicting) goals, individual interests, and associated behaviors whichcan generate resistance to change or create internal conflicts (Gil-Garcia & Pardo, 2005). The adoption of a shared service arrangementsresults in higher levels of interdependence across organizationalboundaries and a need for supra-organizational connections. To adoptsuch arrangements there is a need to convince employees to change
16 M. Janssen et al. / Government Information Quarterly 26 (2009) 15–24
the existing organizational processes and management to give upsome of its authority, as tasks are moved to a semi-autonomousbusiness unit. This involves a major effort in terms of integrationof systems and processes, business process re-engineering, andtransformation.
When it comes to attempts to redesign public managementoperations through the extensive use of information technology,there is still insufficient support for business process re-engineeringand structural transformation (Stemberger & Jaklic, 2007). Manyauthors argue that one of the major problems is a lack of decision-making support tools that can be used to evaluate and show theeffects of potential solutions before actual implementation (Meel &Sol, 1996). Correcting mistakes after a solution has been implementedis usually a costly and difficult affair. Business process modeling andsimulation tools are often considered to facilitate organizationalchange processes and can be used to evaluate the effects of alternativesolutions prior to implementation (e.g. Kettinger, Teng, & Guha, 1997;Stemberger & Jaklic, 2007). Simulation is one of the most widely usedmethods in operations research and management science (Law &Kelton, 1999). Business process simulation uses abstractions of pro-cesses to analyze and assess the impact of alternative arrangementsquantitatively and qualitatively. Simulation can be defined as “theprocess of designing a model of a concrete system and conductingexperiments with this model to understand the behavior of a concretesystem and/or to evaluate various strategies for the operation of thesystem” (Shannon, 1975).
Literature on electronic government, which is still being devel-oped, would benefit from more focused studies to enhance ourunderstanding (Beynon-Davies & Williams, 2003). In this paper, wefocus on the role of business process simulation and animation insupporting the adoption of shared services by three municipalities.The aim of this paper is twofold. On the one hand, we attempt toinvestigate shared service arrangements and create a better under-standing of the various arrangements and trade-offs necessary. On theother hand, we want to demonstrate the use of business processsimulation in facilitating organizational change and for adoptingshared services. We conduct a case study and use simulation andanimation models to evaluate shared services arrangements from aquantitative and qualitative point of view. By developing twoalternative models, we use simulation to model and compare theexisting situation with two alternative shared service arrangementsand to compare the various options from a quantitative perspective. Inaddition, we use animation to communicate the model to thestakeholders involved, to allow them to evaluate the quality of themodels. The models show sharing arrangements and the simulatedimplications.
2. Literature background
2.1. Shared services
Although services and service provisioning have been importanttopics in E-Government research, as yet no universal definition ofservices is available (e.g. Spohrer, Maglio, Bailey, & Gruhl, 2007).Grönroos (2001) has identified three main characteristics of services.To begin with, services are processes that consist of series of activitiesrather than things. Often, service providers and their clients have tointeract frequently in the course of the service delivery process.Second, services are, at least to some extent, produced and consumedsimultaneously, and third, customers in one way or another par-ticipate in the service delivery process. Themore knowledge-intensiveand personalized the service is, the more interactions are needed,resulting in a unique service provisioning process.
System theory, which is interdisciplinary by nature, views a systemas being composed of a group of interacting or interrelating parts thatcan be modeled systematically (Checkland, 1981). Modeling the dy-
namic behavior that is the result of the interaction among the variousparts over time is a key element. Unlike products, services are in-tangible and can only be observed by investigating the dynamicbehavior during the service provisioning process. The output of aservice provisioning process is a new state, e.g. a permit is granted or arecommendation provided. Due to their intangible nature, services areoften provided on the basis of predefined conditions or clear expec-tations to avoid a mismatch between the expectations of the serviceproviders and their clients. Based on Spohrer et al. (2007), we adopt asystems perspective and define a service as “a series of interactionsbetween the service provider and clients that result in an observableoutput”. The service provisioning process and the resulting output arethe central elements of our service definition.
A service is provided by a series of activities that are organized in aservice system. In a service system, service providers (which couldinclude a number of organizations) work together to provide services.A service system includes people and information systems. A sharedservice arrangement is a part of the service system inwhich a separateand accountable semi-autonomous unit is created that providesspecific pre-defined services to the operational units within the (inter)organizational entity. Bergeron (2003) has stated that shared servicesinvolve a collaborative strategy in which a subset of existing businessfunctions are concentrated into a semi-autonomous business unit.Based on the definition of a service and the basic idea of sharingservices, we define shared services as “the concentration of dispersedservice provisioning activities in a single organizational entity”.
Shared services enable governments to focus resources on theprimary high-impact activities at the core of their mission rather thanon routine administrative functions (Accenture, 2006). Sharedservices free resources to allow departments and organizations tofocus on their core activities and customer needs.
The SSC business model holds promise for public administrationfor several reasons. Because budgets and expertise are limited,services often cannot be provided in a cost-efficient way by a singleorganization or department. In particular, smaller public organiza-tions cannot develop all the services or information systems that areneeded. Moreover, both small and large organizations possess variouskinds of expertise that cannot be accessed beyond the organizationalboundaries. Shared services may provide access to expertise that isotherwise out of reach. Finally, there is a promise that sharing servicesmay help increase efficiency, generate value, reduce costs, andimprove services for the internal customers of the parent corporation(Bergeron, 2003). However, expectations of SSCs are often high, andsometimes not entirely realistic (Ulbrich, 2006). Furthermore, it isdifficult to realize all the objectives, because the introduction of a SSCoften involves a series of complex, interrelated objectives and involvesa large number of stakeholders (Janssen & Joha, 2006).
Shared services may vary with regard to the type of services beingshared aswell as the extent towhich they are shared (Bergeron, 2003).They may range from sharing simple IT services (for instance, a webpage) to sharing complete business processes or functions (for exam-ple, human resources management). Complete end-to-end servicesmay be unbundled or one or more part(s) of a service may be con-centrated in an SSC, keeping the services that require customer con-tact within the organizations while sharing other services.
2.2. Simulation and animation
Many simulation software tools originated from static processmapping tools, which map business processes and assign responsi-bilities (Law & Kelton, 1999). More advanced process modeling toolsmake it possible to assign attributes to processes and carry out basiccalculations of process times. By adding dynamic elements andstatistic distributions, simulation tools make it possible to carry out a‘what-if’ analysis to support the decision-making process. Carefulsimulation scenario design and statistical validation can be used to
17M. Janssen et al. / Government Information Quarterly 26 (2009) 15–24
understand and evaluate alternatives, providing insight into the trade-offs involved.
The purpose of a model is to reduce complexity by eliminatingdetails that do not affect its relevant behavior (Curtis, Kellner, & Over,1992). To ensure that what we learn from a model also applies to thesystem under investigation, it should resemble the actual system asclosely as possible. Simulation models describe how the behavior of asystem affects its performance.
One of the main characteristics of the simulation analysis is that itincorporates variabilityand interdependence factors toobtainanaccurateoutlineof theprocessperformance forhypothetical future situations (Law& Kelton, 1999). The systems contain variability with regard to thedemand on the system (e.g. arrivals of customer permit or informationrequests) and thedurationof processes (e.g. the time it takes to checkdataor provide customer service). Simulation makes it possible to includestatistical distributions, thus providing an indication of the range andvariability of the performance of the process. This is important in systemsin which not only the average performance is relevant, but queue lengthas well. The latter can be used to check whether the performance dropsbelow/exceeds a certain threshold level (e.g. permits exceeding a certaintime). In addition, simulation models a number of decision points, theinterdependencies of which affect the overall performance of the system.Simulation can incorporate statistical distributions to model the like-lihood of potential decision-making options occurring.
An important aspect of simulation is the ability to experiment withalternative arrangements (Shannon, 1975; Sol, 1982). The idea is todevelop a model of the existing situation and, based on a diagnosis,developoneormore alternativemodels andfind improvedarrangementsusing ‘what-if’ analyses (which can be used to determine the con-sequences of sharing services). Simulation can thus be used to test andanalyze various scenarios and decide which scenario is most promising.
Most discrete event simulation modeling software is supported byanimation, which can be created by dropping icons visualizing simu-lation components on the computer screen (Vreede & Verbraeck,1996). Pegden et al. (1994) view animation as a dynamic picture con-taining graphics that change position, shape, or color against a staticbackground. Animation of time-ordered sequences of tasks can takeplace against a static background of the lay-out of an organization. Inthis way, simulation can be used to support the decision-makingprocess by communicating the results to stakeholders in a mannerthat is easy to understand. In addition, this can help visualize alter-
Fig. 1. Architecture of th
natives, secure the acceptance of one of them, and rally support, andthus facilitate the adoption of shared services.
3. Adoption of shared services
3.1. Case study background
In this study, we focus on three municipalities that explored thepossibility of sharing services in response to a budget reduction andthe need to improve their customer service provisioning. The mu-nicipalities are located in the same area and are considered medium-sized, although one of them is clearly bigger in terms of the number ofemployees. In addition, the larger municipality has a reputation ofbeing innovative and is considered a front-runner when it comes toadopting new technology. Because the employees of the three mu-nicipalities already exchanged knowledge, sharing services was con-sidered a logical next step.
Dutch public agencies have considerable freedom in terms ofdesigning their business processes, and can buy their systems from avariety of software vendors. At themoment, most public organizationsuse product-oriented information systems. Each cluster of productscontains business processes that are supported by a unique system.Many municipalities consider their business processes as individualbecause they have evolved over time and have been customized to fittheir particular situation. At a higher level of abstraction, the businessprocesses are often relatively similar, and only really vary with regardto a limited number of aspects. The main differences have to do withthe different types of permits and the sequence of activities. Althoughmost permits are determined by politicians at a central level, everymunicipality is free to have its own, local permits. For example, apermit for cutting down trees was only available in two of the threemunicipalities under investigation. As far as permits determined at acentral level are concerned, they may be different in terms of theirtechnology and implementation, but they have the same objective andoften involve similar business processes. This means that there areopportunities to share services and realize economies of scale.
The threemunicipalities started a process to unbundle their serviceswith the aim of concentrating them in new, semi-autonomous servicecenters. After analyzing their business processes, standardizing theirbusiness processes and services, and investigating the opportunities forreducing the number of information systems, the researchers were
e current situation.
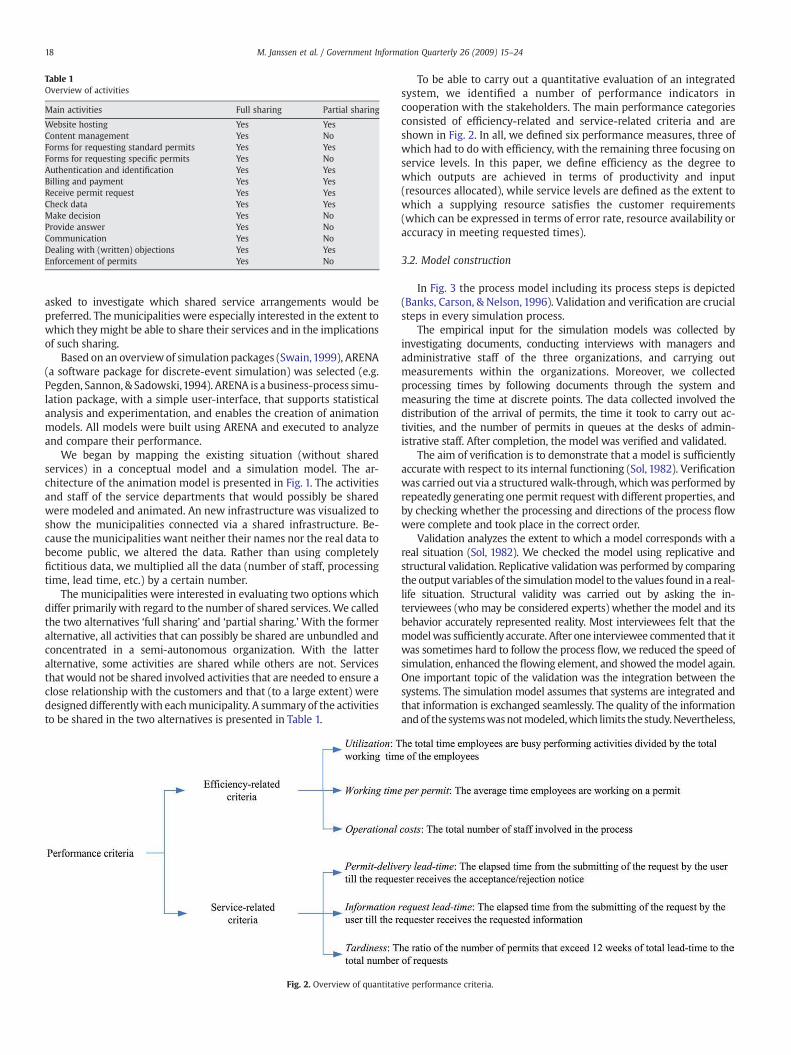
Table 1Overview of activities
Main activities Full sharing Partial sharing
Website hosting Yes YesContent management Yes NoForms for requesting standard permits Yes YesForms for requesting specific permits Yes NoAuthentication and identification Yes YesBilling and payment Yes YesReceive permit request Yes YesCheck data Yes YesMake decision Yes NoProvide answer Yes NoCommunication Yes NoDealing with (written) objections Yes YesEnforcement of permits Yes No
18 M. Janssen et al. / Government Information Quarterly 26 (2009) 15–24
asked to investigate which shared service arrangements would bepreferred. The municipalities were especially interested in the extent towhich they might be able to share their services and in the implicationsof such sharing.
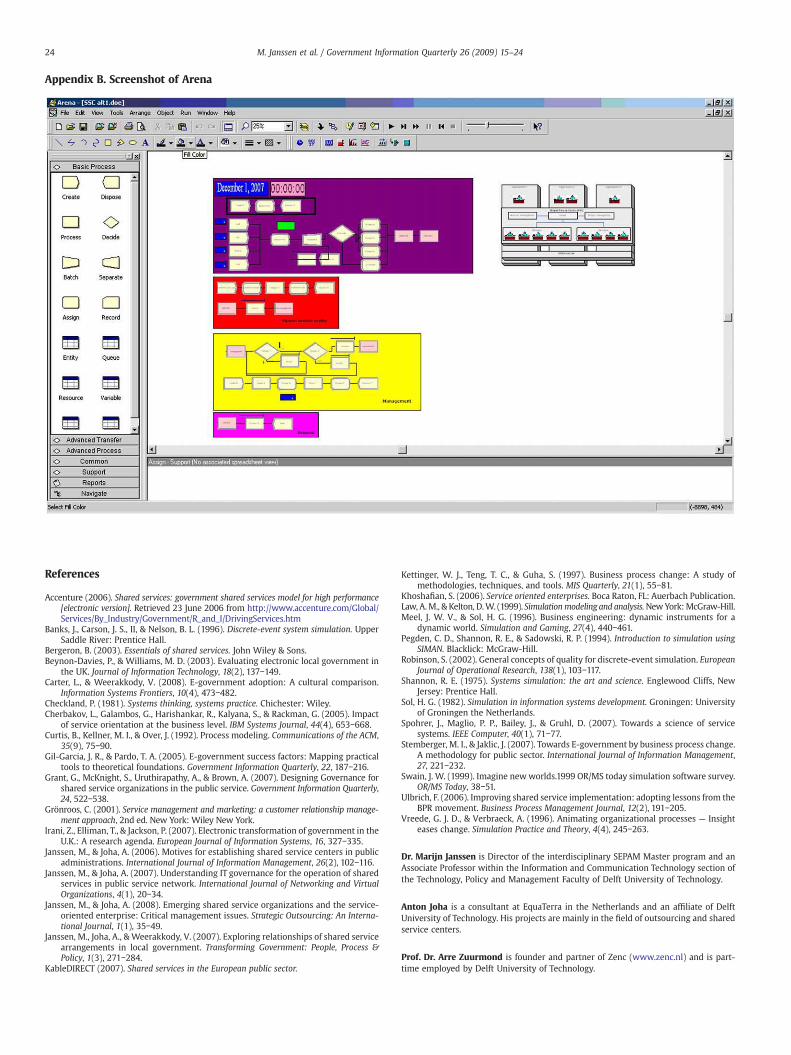
Based on an overviewof simulation packages (Swain,1999), ARENA(a software package for discrete-event simulation) was selected (e.g.Pegden, Sannon, & Sadowski,1994). ARENA is a business-process simu-lation package, with a simple user-interface, that supports statisticalanalysis and experimentation, and enables the creation of animationmodels. All models were built using ARENA and executed to analyzeand compare their performance.
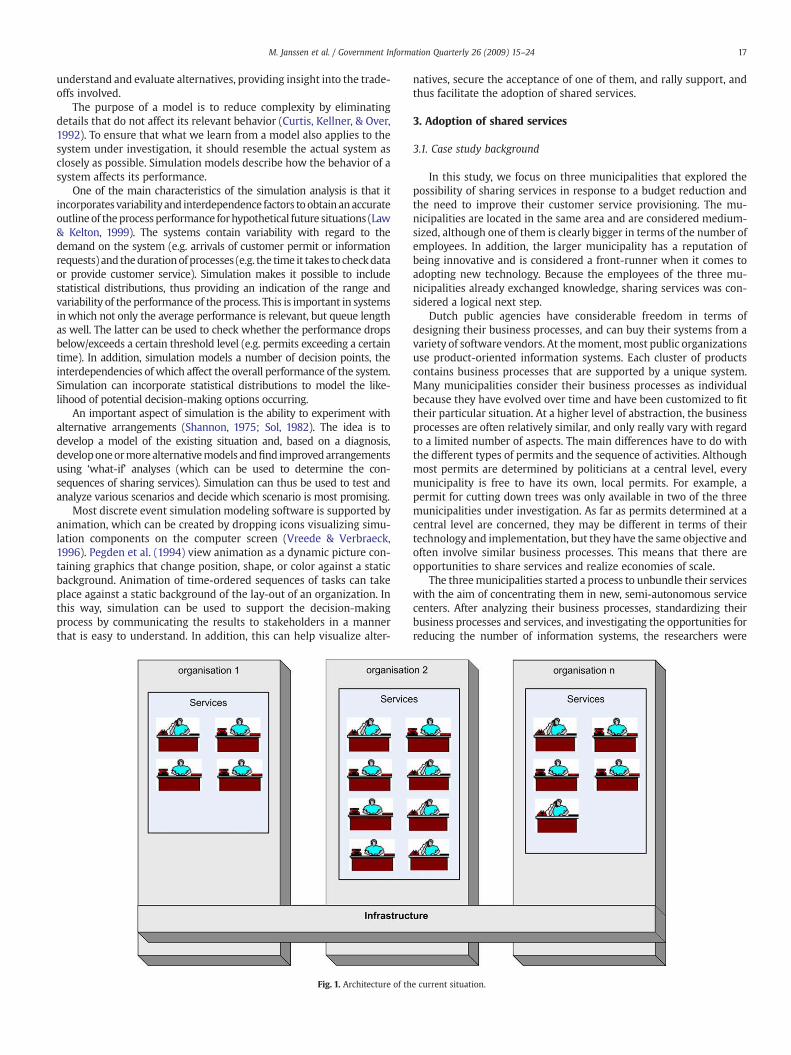
We began by mapping the existing situation (without sharedservices) in a conceptual model and a simulation model. The ar-chitecture of the animation model is presented in Fig. 1. The activitiesand staff of the service departments that would possibly be sharedwere modeled and animated. An new infrastructure was visualized toshow the municipalities connected via a shared infrastructure. Be-cause the municipalities want neither their names nor the real data tobecome public, we altered the data. Rather than using completelyfictitious data, we multiplied all the data (number of staff, processingtime, lead time, etc.) by a certain number.
The municipalities were interested in evaluating two options whichdiffer primarily with regard to the number of shared services.We calledthe two alternatives ‘full sharing’ and ‘partial sharing.’With the formeralternative, all activities that can possibly be shared are unbundled andconcentrated in a semi-autonomous organization. With the latteralternative, some activities are shared while others are not. Servicesthat would not be shared involved activities that are needed to ensure aclose relationship with the customers and that (to a large extent) weredesigned differentlywith eachmunicipality. A summary of the activitiesto be shared in the two alternatives is presented in Table 1.
Fig. 2. Overview of quantitat
To be able to carry out a quantitative evaluation of an integratedsystem, we identified a number of performance indicators incooperation with the stakeholders. The main performance categoriesconsisted of efficiency-related and service-related criteria and areshown in Fig. 2. In all, we defined six performance measures, three ofwhich had to do with efficiency, with the remaining three focusing onservice levels. In this paper, we define efficiency as the degree towhich outputs are achieved in terms of productivity and input(resources allocated), while service levels are defined as the extent towhich a supplying resource satisfies the customer requirements(which can be expressed in terms of error rate, resource availability oraccuracy in meeting requested times).
3.2. Model construction
In Fig. 3 the process model including its process steps is depicted(Banks, Carson, & Nelson, 1996). Validation and verification are crucialsteps in every simulation process.
The empirical input for the simulation models was collected byinvestigating documents, conducting interviews with managers andadministrative staff of the three organizations, and carrying outmeasurements within the organizations. Moreover, we collectedprocessing times by following documents through the system andmeasuring the time at discrete points. The data collected involved thedistribution of the arrival of permits, the time it took to carry out ac-tivities, and the number of permits in queues at the desks of admin-istrative staff. After completion, the model was verified and validated.
The aim of verification is to demonstrate that a model is sufficientlyaccurate with respect to its internal functioning (Sol, 1982). Verificationwas carried out via a structuredwalk-through, whichwas performed byrepeatedly generating one permit request with different properties, andby checking whether the processing and directions of the process flowwere complete and took place in the correct order.
Validation analyzes the extent to which a model corresponds with areal situation (Sol, 1982). We checked the model using replicative andstructural validation. Replicative validationwas performed by comparingthe output variables of the simulationmodel to the values found in a real-life situation. Structural validity was carried out by asking the in-terviewees (who may be considered experts) whether the model and itsbehavior accurately represented reality. Most interviewees felt that themodelwas sufficiently accurate. After one interviewee commented that itwas sometimes hard to follow the process flow, we reduced the speed ofsimulation, enhanced the flowing element, and showed themodel again.One important topic of the validation was the integration between thesystems. The simulation model assumes that systems are integrated andthat information is exchanged seamlessly. The quality of the informationandof the systemswasnotmodeled,which limits the study.Nevertheless,
ive performance criteria.
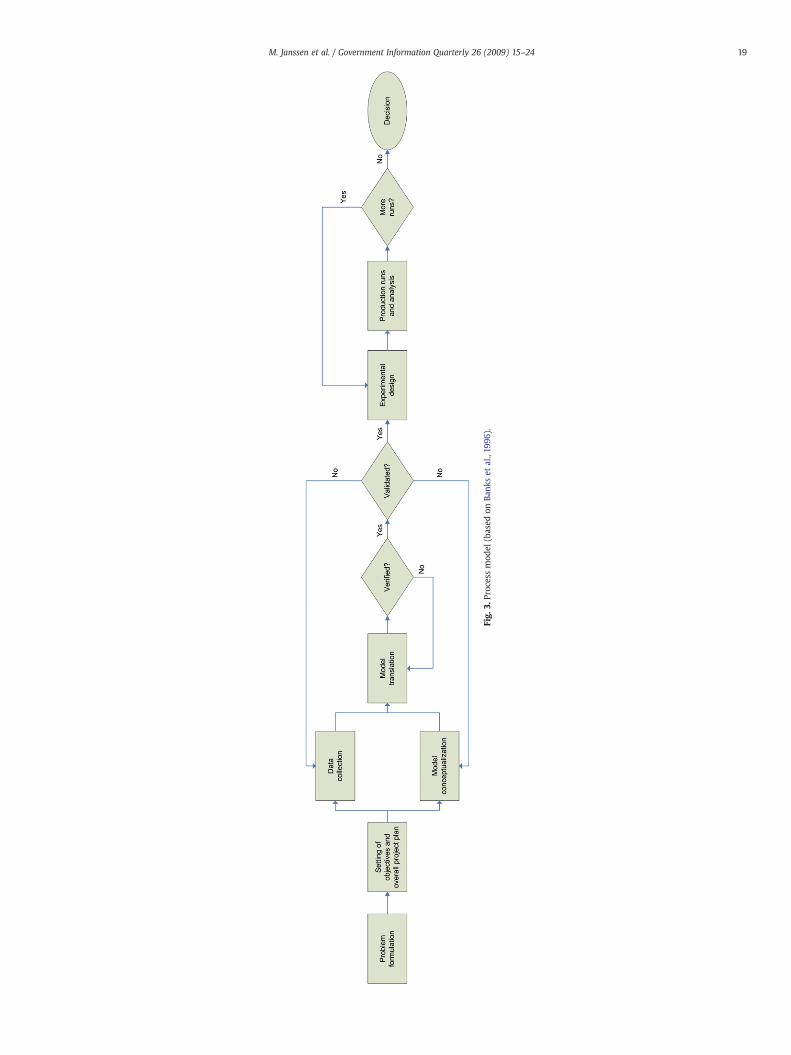
Fig.
3.Proc
essmod
el(based
onBa
nkset
al.,19
96).
19M. Janssen et al. / Government Information Quarterly 26 (2009) 15–24
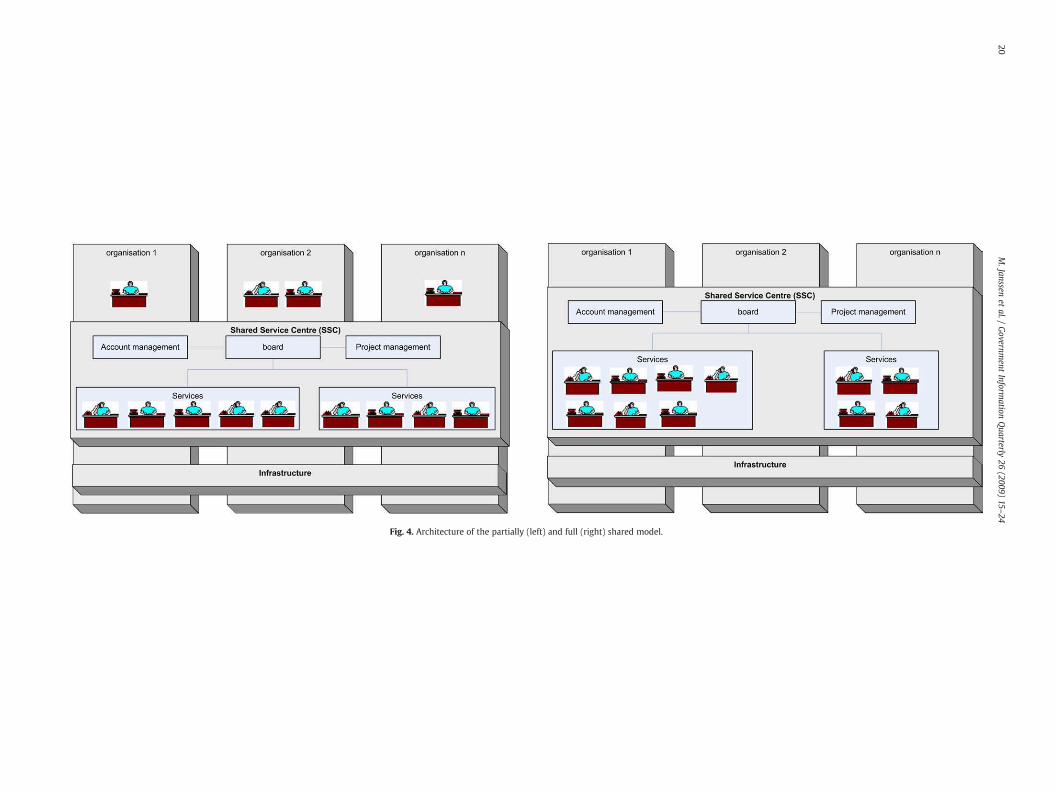
Fig. 4. Architecture of the partially (left) and full (right) shared model.
20M.Janssen
etal./
Governm
entInform
ationQuarterly
26(2009)
15–24
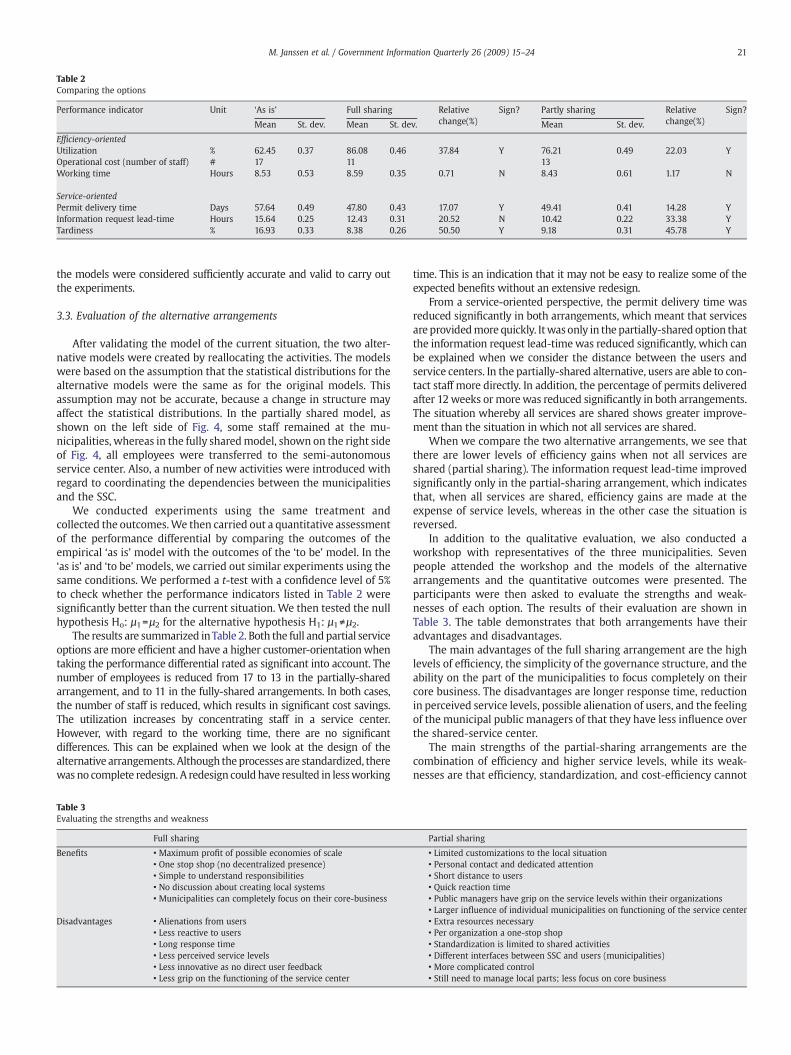
Table 2Comparing the options
Performance indicator Unit ‘As is’ Full sharing Relativechange(%)
Sign? Partly sharing Relativechange(%)
Sign?
Mean St. dev. Mean St. dev. Mean St. dev.
Efficiency-orientedUtilization % 62.45 0.37 86.08 0.46 37.84 Y 76.21 0.49 22.03 YOperational cost (number of staff) # 17 11 13Working time Hours 8.53 0.53 8.59 0.35 0.71 N 8.43 0.61 1.17 N
Service-orientedPermit delivery time Days 57.64 0.49 47.80 0.43 17.07 Y 49.41 0.41 14.28 YInformation request lead-time Hours 15.64 0.25 12.43 0.31 20.52 N 10.42 0.22 33.38 YTardiness % 16.93 0.33 8.38 0.26 50.50 Y 9.18 0.31 45.78 Y
21M. Janssen et al. / Government Information Quarterly 26 (2009) 15–24
the models were considered sufficiently accurate and valid to carry outthe experiments.
3.3. Evaluation of the alternative arrangements
After validating the model of the current situation, the two alter-native models were created by reallocating the activities. The modelswere based on the assumption that the statistical distributions for thealternative models were the same as for the original models. Thisassumption may not be accurate, because a change in structure mayaffect the statistical distributions. In the partially shared model, asshown on the left side of Fig. 4, some staff remained at the mu-nicipalities, whereas in the fully sharedmodel, shown on the right sideof Fig. 4, all employees were transferred to the semi-autonomousservice center. Also, a number of new activities were introduced withregard to coordinating the dependencies between the municipalitiesand the SSC.
We conducted experiments using the same treatment andcollected the outcomes.We then carried out a quantitative assessmentof the performance differential by comparing the outcomes of theempirical ‘as is’ model with the outcomes of the ‘to be’ model. In the‘as is’ and ‘to be’models, we carried out similar experiments using thesame conditions. We performed a t-test with a confidence level of 5%to check whether the performance indicators listed in Table 2 weresignificantly better than the current situation. We then tested the nullhypothesis Ho: µ1=µ2 for the alternative hypothesis H1: µ1≠µ2.
The results are summarized inTable 2. Both the full and partial serviceoptions are more efficient and have a higher customer-orientationwhentaking the performance differential rated as significant into account. Thenumber of employees is reduced from 17 to 13 in the partially-sharedarrangement, and to 11 in the fully-shared arrangements. In both cases,the number of staff is reduced, which results in significant cost savings.The utilization increases by concentrating staff in a service center.However, with regard to the working time, there are no significantdifferences. This can be explained when we look at the design of thealternative arrangements. Although theprocesses are standardized, therewas no complete redesign. A redesign could have resulted in lessworking
Table 3Evaluating the strengths and weakness
Full sharing
Benefits • Maximum profit of possible economies of scale• One stop shop (no decentralized presence)• Simple to understand responsibilities• No discussion about creating local systems• Municipalities can completely focus on their core-business
Disadvantages • Alienations from users• Less reactive to users• Long response time• Less perceived service levels• Less innovative as no direct user feedback• Less grip on the functioning of the service center
time. This is an indication that it may not be easy to realize some of theexpected benefits without an extensive redesign.
From a service-oriented perspective, the permit delivery time wasreduced significantly in both arrangements, which meant that servicesare providedmore quickly. Itwasonly in the partially-shared option thatthe information request lead-timewas reduced significantly, which canbe explained when we consider the distance between the users andservice centers. In the partially-shared alternative, users are able to con-tact staff more directly. In addition, the percentage of permits deliveredafter 12weeks or morewas reduced significantly in both arrangements.The situation whereby all services are shared shows greater improve-ment than the situation in which not all services are shared.
When we compare the two alternative arrangements, we see thatthere are lower levels of efficiency gains when not all services areshared (partial sharing). The information request lead-time improvedsignificantly only in the partial-sharing arrangement, which indicatesthat, when all services are shared, efficiency gains are made at theexpense of service levels, whereas in the other case the situation isreversed.
In addition to the qualitative evaluation, we also conducted aworkshop with representatives of the three municipalities. Sevenpeople attended the workshop and the models of the alternativearrangements and the quantitative outcomes were presented. Theparticipants were then asked to evaluate the strengths and weak-nesses of each option. The results of their evaluation are shown inTable 3. The table demonstrates that both arrangements have theiradvantages and disadvantages.
The main advantages of the full sharing arrangement are the highlevels of efficiency, the simplicity of the governance structure, and theability on the part of the municipalities to focus completely on theircore business. The disadvantages are longer response time, reductionin perceived service levels, possible alienation of users, and the feelingof the municipal public managers of that they have less influence overthe shared-service center.
The main strengths of the partial-sharing arrangements are thecombination of efficiency and higher service levels, while its weak-nesses are that efficiency, standardization, and cost-efficiency cannot
Partial sharing
• Limited customizations to the local situation• Personal contact and dedicated attention• Short distance to users• Quick reaction time• Public managers have grip on the service levels within their organizations• Larger influence of individual municipalities on functioning of the service center• Extra resources necessary• Per organization a one-stop shop• Standardization is limited to shared activities• Different interfaces between SSC and users (municipalities)• More complicated control• Still need to manage local parts; less focus on core business
22 M. Janssen et al. / Government Information Quarterly 26 (2009) 15–24
be fully realized, and the municipalities continued to be responsiblefor managing the services and activities.
The table clearly shows that theworkshop participants expect bothoptions to have both strong and weak elements. As such, the decisionas to which type of shared service arrangement to select is not ob-vious. The scope and the number of services that can be shareddetermine the possible efficiency and service level gains.
However, realizing the promised benefits is not easy becauseimplementation requires considerable changes in organizationalarrangements, coordination of mechanisms and processes, and theallocation of responsibilities (Janssen & Joha, 2006). Using a simula-tion model makes it possible to show clearly which conditions have tobe met to realize the benefits, and also provides insight into thevariability and interdependence of the factors affecting those benefits.Simulation makes stakeholders more aware of the arrangementsnecessary to realize the expected benefits of shared services.
4. Discussion
4.1. Animation and simulation supporting adoption of shared services
The purpose of simulation is to support the decision-makingprocess with regard to alternative sharing arrangements, while thegoal of animation is to facilitate communication among stakeholdergroups, with the aim of providing insight into the possible implica-tions of the alternatives. Ultimately, this should facilitate the adoptionprocess.
The simulation study was a time-consuming exercise that tookmonths of work and had a lead-time of six months. Most of the workinvolved in creating a simulation model has to do with the collectionof the statistical data used as input to create the models. A majorproblem is collecting the right information, because using the wrongdata would render the outcomes of the model invalid. As Robinson(2002) has shown, there is direct connection between the quality ofthe outcome, on the one hand, and the quality of the content and theprocess, on the other. As such, conducting a simulation study is noteasy, and its benefits should outweigh the efforts. There are variousbenefits in using discrete event simulation for the adoption of sharedservices.
The simulation is based on a model that includes actual businessprocesses as well as the human and technological resources needed toexecute these processes. Another advantage is that discrete eventsimulation makes it possible to incorporate variability and inter-dependence factors in order to obtain an accurate outline of systemsperformance. Our simulationwas able to predict process performancebased on a number of measures, including lead time, resource utiliza-tion, and tardiness.
Another advantage is provided by the visualization of the businessprocesses against a static background, which provides an overview ofand insight into the business processes in alternative arrangements. Thetranslation of the shared services idea into business processes helpedmake the shared-vision concrete. During the session, the participantsindicated that the simulation helped clarify the alternative arrange-ments and provided them with more insight into the consequences ofthe trade-offs. The SSC arrangement will be laid down in a frameworkcontract setting out the rules and responsibilities of participants.Although such a contract provides some certainty, it cannot specify allthe relevant components, and the partnership among organizations in aSSCarrangement typically involveshigh levels of trust. By simulating thealternative arrangements in advance, a better grip on the implicationscan be obtained and trust created. Moreover, the simulation increasespeople's understanding of the rules needed to ensure the smoothfunctioning of shared services once they have been implemented. Thesimulation, and the animation on top of the simulations, helps tounderstand thebenefit, to opendiscussions and at the end create trust inthe concept and commitment to adopt shared services. One interviewee
stated, “Finally we felt confident … the discussions with our futurecolleagues in the service center, centered around the animation, helpedto define action.” The showing of the implications supported thecreation of commitment of the shared-service concepts andmade themtangible. As a result, the participants could definewhatwas necessary tomake it work. They started discuss conditions including the need forintegration, decoupling of process steps, and standardization of formsand processes.
The interviewees involved in this process found that the use ofsimulationmodels resulted in more discussion than before the start ofthis research project. As one of the public managers put it, “We did notthink that any trade-offs would be necessary at the start, we weresimply thinking that sharing would involve no risks and disadvan-tages.” By interviewing and involving people, and showing them themodels, they become more aware (and better understood) shared-service arrangements and their implications. For some of the work-shop participants, the main benefits were related to the facilitation ofideas, creating understanding, and discussing the results by viewingthe animation, instead of using simulations for a detailed quantitativeanalysis. As such, simulation may be a useful instrument with regardto adopting shared services and facilitating change by providinginsight and generating discussion about its effects and implications.The use of simulation for adoption might vary due to cultural dif-ferences (e.g. Carter & Weerakkody, 2008). Simulation can be part ofthe adoption process, included in change management, businessprocess (re)engineering, and transformation methodologies, and itcan be used to support change and transformation before starting theimplementation process. It may result in conscious trade-offs and cansupport discussions about the desired outcome. More research isneeded with regard to the use of simulation and animation in changemanagement methodologies.
4.2. Benefits of shared services
A comparison of the alternative arrangements shows that there is nosingle arrangement that is best in all aspects. As such, it is of the utmostimportance to design the shared services in such a way that the variousstrategic objectives of the organizations involved are carefully chosen,and to align the design with these objectives. In our case study, themunicipalities needed to negotiate the objectives because they did notagree on what was more important: maximum cost efficiency orcustomer-orientation and service levels. Insight into possible objectivesand their implications can help create the right level of expectation andmake the right trade-offs regarding key design variables.
In literature (e.g. Bergeron, 2003), efficiency and customer-orienta-tion are often viewed as complimentary variables that can be accom-plished at the same time. The partial-sharing arrangement shows thatefficiency and customer-orientation are competing variables that tosome extent need to be traded off. Indeed, in both arrangements effi-ciency (as well as customer-orientation) are improved in comparisonwith theexisting situation.However, our study illustrates that the level ofpossible benefits depends on the type of arrangements. Although a SSCcan improve both efficiency and service levels, they remain competingobjectives. In the partial-sharing arrangement, improved service levelsare accomplished at the expense efficiency gains in comparison to thefull-sharing arrangement.
This indicates that some of the expected benefits may not be easilyrealized (or even impossible to realize), and that they require a greatereffort. In our case study, the organizations decided to keep the businessprocesses for the shared services as close as possible to the existingbusiness processes. The rationale behind this decisionwas that it wouldmake standardization easier, that it would not require new informationsystems, and that it would generate less resistance. However, it was adecision that limited potential efficiency gains. After realizing a shared-service arrangement that is accepted by the people involved, a next stepmay be to reengineer the business processes, adopting an incremental
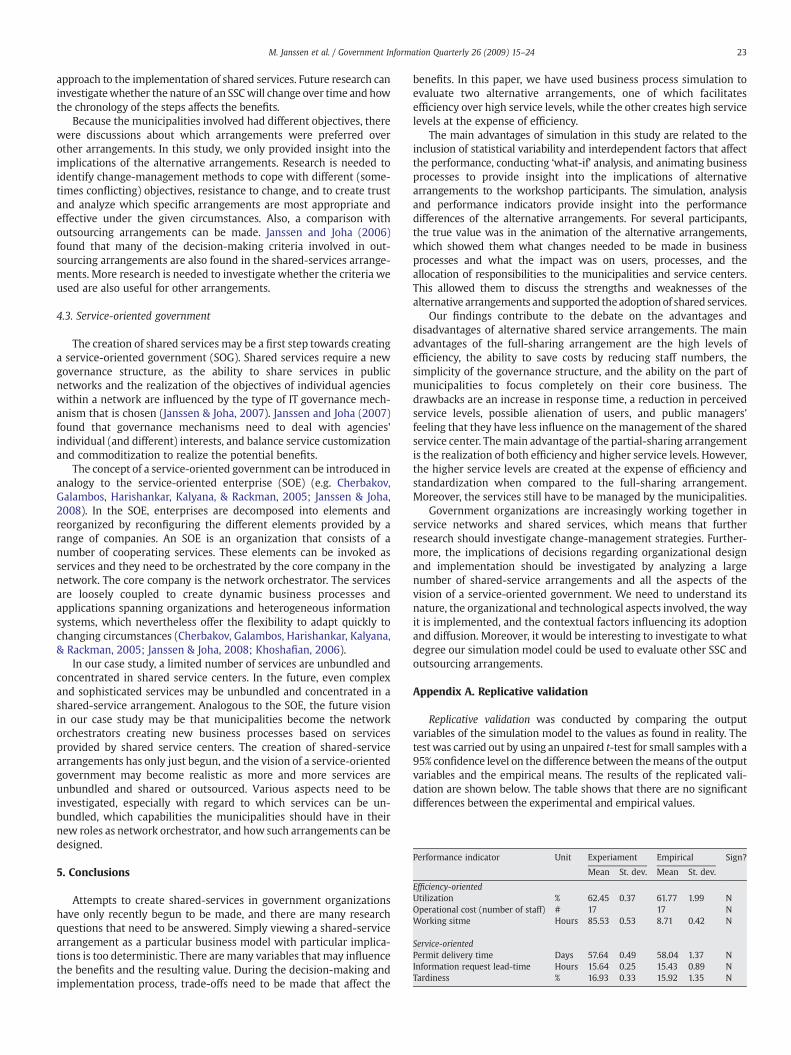
Performance indicator Unit Experiament Empirical Sign?
Mean St. dev. Mean St. dev.
Efficiency-orientedUtilization % 62.45 0.37 61.77 1.99 NOperational cost (number of staff) # 17 17 NWorking sitme Hours 85.53 0.53 8.71 0.42 N
Service-orientedPermit delivery time Days 57.64 0.49 58.04 1.37 NInformation request lead-time Hours 15.64 0.25 15.43 0.89 NTardiness % 16.93 0.33 15.92 1.35 N
23M. Janssen et al. / Government Information Quarterly 26 (2009) 15–24
approach to the implementation of shared services. Future research caninvestigatewhether the nature of an SSCwill change over time and howthe chronology of the steps affects the benefits.
Because the municipalities involved had different objectives, therewere discussions about which arrangements were preferred overother arrangements. In this study, we only provided insight into theimplications of the alternative arrangements. Research is needed toidentify change-management methods to cope with different (some-times conflicting) objectives, resistance to change, and to create trustand analyze which specific arrangements are most appropriate andeffective under the given circumstances. Also, a comparison withoutsourcing arrangements can be made. Janssen and Joha (2006)found that many of the decision-making criteria involved in out-sourcing arrangements are also found in the shared-services arrange-ments. More research is needed to investigate whether the criteria weused are also useful for other arrangements.
4.3. Service-oriented government
The creation of shared services may be a first step towards creatinga service-oriented government (SOG). Shared services require a newgovernance structure, as the ability to share services in publicnetworks and the realization of the objectives of individual agencieswithin a network are influenced by the type of IT governance mech-anism that is chosen (Janssen & Joha, 2007). Janssen and Joha (2007)found that governance mechanisms need to deal with agencies'individual (and different) interests, and balance service customizationand commoditization to realize the potential benefits.
The concept of a service-oriented government can be introduced inanalogy to the service-oriented enterprise (SOE) (e.g. Cherbakov,Galambos, Harishankar, Kalyana, & Rackman, 2005; Janssen & Joha,2008). In the SOE, enterprises are decomposed into elements andreorganized by reconfiguring the different elements provided by arange of companies. An SOE is an organization that consists of anumber of cooperating services. These elements can be invoked asservices and they need to be orchestrated by the core company in thenetwork. The core company is the network orchestrator. The servicesare loosely coupled to create dynamic business processes andapplications spanning organizations and heterogeneous informationsystems, which nevertheless offer the flexibility to adapt quickly tochanging circumstances (Cherbakov, Galambos, Harishankar, Kalyana,& Rackman, 2005; Janssen & Joha, 2008; Khoshafian, 2006).
In our case study, a limited number of services are unbundled andconcentrated in shared service centers. In the future, even complexand sophisticated services may be unbundled and concentrated in ashared-service arrangement. Analogous to the SOE, the future visionin our case study may be that municipalities become the networkorchestrators creating new business processes based on servicesprovided by shared service centers. The creation of shared-servicearrangements has only just begun, and the vision of a service-orientedgovernment may become realistic as more and more services areunbundled and shared or outsourced. Various aspects need to beinvestigated, especially with regard to which services can be un-bundled, which capabilities the municipalities should have in theirnew roles as network orchestrator, and how such arrangements can bedesigned.
5. Conclusions
Attempts to create shared-services in government organizationshave only recently begun to be made, and there are many researchquestions that need to be answered. Simply viewing a shared-servicearrangement as a particular business model with particular implica-tions is too deterministic. There aremany variables that may influencethe benefits and the resulting value. During the decision-making andimplementation process, trade-offs need to be made that affect the
benefits. In this paper, we have used business process simulation toevaluate two alternative arrangements, one of which facilitatesefficiency over high service levels, while the other creates high servicelevels at the expense of efficiency.
The main advantages of simulation in this study are related to theinclusion of statistical variability and interdependent factors that affectthe performance, conducting ‘what-if’ analysis, and animating businessprocesses to provide insight into the implications of alternativearrangements to the workshop participants. The simulation, analysisand performance indicators provide insight into the performancedifferences of the alternative arrangements. For several participants,the true value was in the animation of the alternative arrangements,which showed them what changes needed to be made in businessprocesses and what the impact was on users, processes, and theallocation of responsibilities to the municipalities and service centers.This allowed them to discuss the strengths and weaknesses of thealternative arrangements and supported theadoptionof shared services.
Our findings contribute to the debate on the advantages anddisadvantages of alternative shared service arrangements. The mainadvantages of the full-sharing arrangement are the high levels ofefficiency, the ability to save costs by reducing staff numbers, thesimplicity of the governance structure, and the ability on the part ofmunicipalities to focus completely on their core business. Thedrawbacks are an increase in response time, a reduction in perceivedservice levels, possible alienation of users, and public managers'feeling that they have less influence on the management of the sharedservice center. Themain advantage of the partial-sharing arrangementis the realization of both efficiency and higher service levels. However,the higher service levels are created at the expense of efficiency andstandardization when compared to the full-sharing arrangement.Moreover, the services still have to be managed by the municipalities.
Government organizations are increasingly working together inservice networks and shared services, which means that furtherresearch should investigate change-management strategies. Further-more, the implications of decisions regarding organizational designand implementation should be investigated by analyzing a largenumber of shared-service arrangements and all the aspects of thevision of a service-oriented government. We need to understand itsnature, the organizational and technological aspects involved, the wayit is implemented, and the contextual factors influencing its adoptionand diffusion. Moreover, it would be interesting to investigate to whatdegree our simulation model could be used to evaluate other SSC andoutsourcing arrangements.
Appendix A. Replicative validation
Replicative validation was conducted by comparing the outputvariables of the simulation model to the values as found in reality. Thetest was carried out by using an unpaired t-test for small sampleswith a95% confidence level on the difference between themeans of the outputvariables and the empirical means. The results of the replicated vali-dation are shown below. The table shows that there are no significantdifferences between the experimental and empirical values.
24 M. Janssen et al. / Government Information Quarterly 26 (2009) 15–24
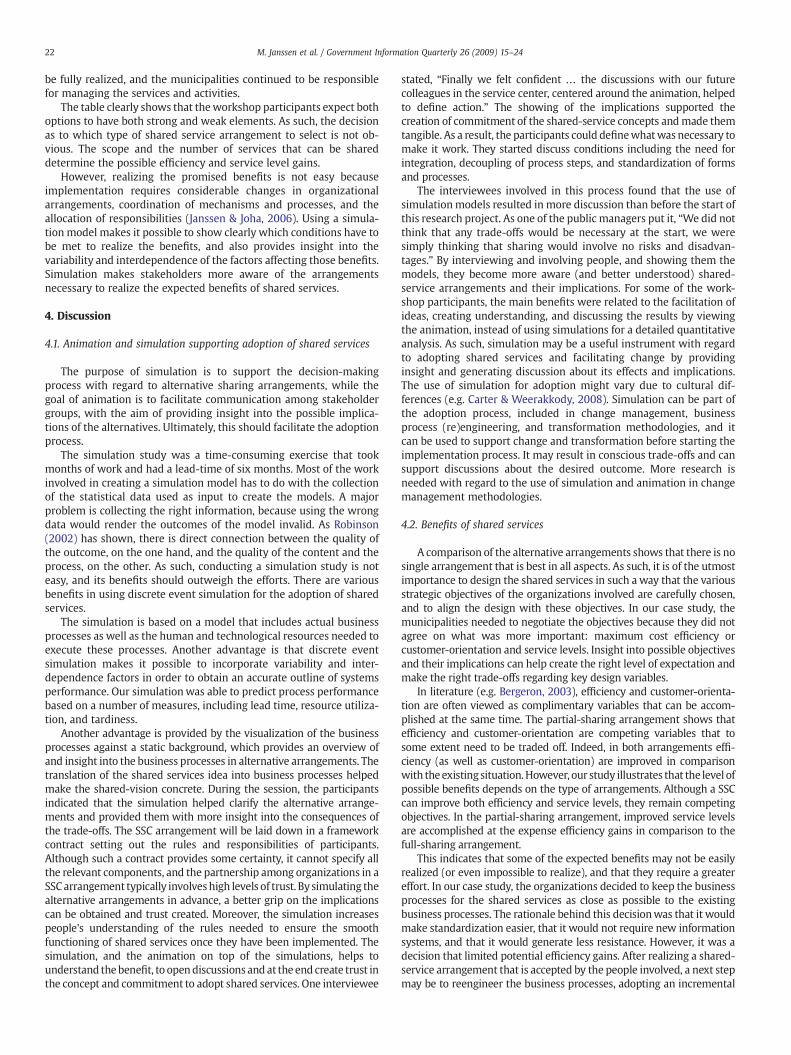
Appendix B. Screenshot of Arena
References
Accenture (2006). Shared services: government shared services model for high performance[electronic version]. Retrieved 23 June 2006 from http://www.accenture.com/Global/Services/By_Industry/Government/R_and_I/DrivingServices.htm
Banks, J., Carson, J. S., II, & Nelson, B. L. (1996). Discrete-event system simulation. UpperSaddle River: Prentice Hall.
Bergeron, B. (2003). Essentials of shared services. John Wiley & Sons.Beynon-Davies, P., & Williams, M. D. (2003). Evaluating electronic local government in
the UK. Journal of Information Technology, 18(2), 137−149.Carter, L., & Weerakkody, V. (2008). E-government adoption: A cultural comparison.
Information Systems Frontiers, 10(4), 473−482.Checkland, P. (1981). Systems thinking, systems practice. Chichester: Wiley.Cherbakov, L., Galambos, G., Harishankar, R., Kalyana, S., & Rackman, G. (2005). Impact
of service orientation at the business level. IBM Systems Journal, 44(4), 653−668.Curtis, B., Kellner, M. I., & Over, J. (1992). Process modeling. Communications of the ACM,
35(9), 75−90.Gil-Garcia, J. R., & Pardo, T. A. (2005). E-government success factors: Mapping practical
tools to theoretical foundations. Government Information Quarterly, 22, 187−216.Grant, G., McKnight, S., Uruthirapathy, A., & Brown, A. (2007). Designing Governance for
shared service organizations in the public service. Government Information Quarterly,24, 522−538.
Grönroos, C. (2001). Service management and marketing: a customer relationship manage-ment approach, 2nd ed. New York: Wiley New York.
Irani, Z., Elliman, T., & Jackson, P. (2007). Electronic transformation of government in theU.K.: A research agenda. European Journal of Information Systems, 16, 327−335.
Janssen, M., & Joha, A. (2006). Motives for establishing shared service centers in publicadministrations. International Journal of Information Management, 26(2), 102−116.
Janssen, M., & Joha, A. (2007). Understanding IT governance for the operation of sharedservices in public service network. International Journal of Networking and VirtualOrganizations, 4(1), 20−34.
Janssen, M., & Joha, A. (2008). Emerging shared service organizations and the service-oriented enterprise: Critical management issues. Strategic Outsourcing: An Interna-tional Journal, 1(1), 35−49.
Janssen, M., Joha, A., &Weerakkody, V. (2007). Exploring relationships of shared servicearrangements in local government. Transforming Government: People, Process &Policy, 1(3), 271−284.
KableDIRECT (2007). Shared services in the European public sector.
Kettinger, W. J., Teng, T. C., & Guha, S. (1997). Business process change: A study ofmethodologies, techniques, and tools. MIS Quarterly, 21(1), 55−81.
Khoshafian, S. (2006). Service oriented enterprises. Boca Raton, FL: Auerbach Publication.Law, A.M., & Kelton, D.W. (1999). Simulationmodeling and analysis.NewYork:McGraw-Hill.Meel, J. W. V., & Sol, H. G. (1996). Business engineering: dynamic instruments for a
dynamic world. Simulation and Gaming, 27(4), 440−461.Pegden, C. D., Shannon, R. E., & Sadowski, R. P. (1994). Introduction to simulation using
SIMAN. Blacklick: McGraw-Hill.Robinson, S. (2002). General concepts of quality for discrete-event simulation. European
Journal of Operational Research, 138(1), 103−117.Shannon, R. E. (1975). Systems simulation: the art and science. Englewood Cliffs, New
Jersey: Prentice Hall.Sol, H. G. (1982). Simulation in information systems development. Groningen: University
of Groningen the Netherlands.Spohrer, J., Maglio, P. P., Bailey, J., & Gruhl, D. (2007). Towards a science of service
systems. IEEE Computer, 40(1), 71−77.Stemberger, M. I., & Jaklic, J. (2007). Towards E-government by business process change.
A methodology for public sector. International Journal of Information Management,27, 221−232.
Swain, J. W. (1999). Imagine newworlds.1999 OR/MS today simulation software survey.OR/MS Today, 38−51.
Ulbrich, F. (2006). Improving shared service implementation: adopting lessons from theBPR movement. Business Process Management Journal, 12(2), 191−205.
Vreede, G. J. D., & Verbraeck, A. (1996). Animating organizational processes — Insighteases change. Simulation Practice and Theory, 4(4), 245−263.
Dr. Marijn Janssen is Director of the interdisciplinary SEPAM Master program and anAssociate Professor within the Information and Communication Technology section ofthe Technology, Policy and Management Faculty of Delft University of Technology.
Anton Joha is a consultant at EquaTerra in the Netherlands and an affiliate of DelftUniversity of Technology. His projects are mainly in the field of outsourcing and sharedservice centers.
Prof. Dr. Arre Zuurmond is founder and partner of Zenc (www.zenc.nl) and is part-time employed by Delft University of Technology.