Embed Size (px)
Citation preview
Nat. Hazards Earth Syst. Sci., 12, 3031–3044, 2012www.nat-hazards-earth-syst-sci.net/12/3031/2012/doi:10.5194/nhess-12-3031-2012© Author(s) 2012. CC Attribution 3.0 License.
Natural Hazardsand Earth
System Sciences
Simulating dam-breach flood scenarios of the Tangjiashan landslidedam induced by the Wenchuan Earthquake
X. Fan1,2, C. X. Tang2, C. J. van Westen2, and D. Alkema2
1The State Key Laboratory of Geohazards Prevention and Geoenvironment Protection (Chengdu University of Technology),Chengdu, Sichuan, China2Faculty of Geo-Information Science and Earth Observation (ITC), University of Twente, 7500 AE, Enschede, P.O. Box 217,The Netherlands
Correspondence to:X. Fan ([email protected])
Received: 3 June 2012 – Revised: 8 August 2012 – Accepted: 9 August 2012 – Published: 2 October 2012
Abstract. Floods from failures of landslide dams can posea hazard to people and property downstream, which haveto be rapidly assessed and mitigated in order to reduce thepotential risk. The Tangjiashan landslide dam induced bythe Mw = 7.9 2008 Wenchuan earthquake had impoundedthe largest lake in the earthquake affected area with an es-timated volume of 3× 10⁸ m3, and the potential catastrophicdam breach posed a serious threat to more than 2.5 mil-lion people in downstream towns and Mianyang city, located85 km downstream. Chinese authorities had to evacuate partsof the city until the Tangjiashan landslide dam was artifi-cially breached by a spillway, and the lake was drained. Wepropose an integrated approach to simulate the dam-breachfloods for a number of possible scenarios, to evaluate theseverity of the threat to Mianyang city. Firstly, the physically-based BREACH model was applied to predict the flood hy-drographs at the dam location, which were calibrated withobservational data of the flood resulting from the artificialbreaching. The output hydrographs from this model were in-putted into the 1-D–2-D SOBEK hydrodynamic model tosimulate the spatial variations in flood parameters. The simu-lated flood hydrograph, peak discharge and peak arrival timeat the downstream towns fit the observations. Thus this ap-proach is capable of providing reliable predictions for the de-cision makers to determine the mitigation plans. The sensitiv-ity analysis of the BREACH model input parameters revealsthat the average grain size, the unit weight and porosity of thedam materials are the most sensitive parameters. The vari-ability of the dam material properties causes a large uncer-tainty in the estimation of the peak flood discharge and peakarrival time, but has little influence on the flood inundation
area and flood depth downstream. The effect of cascadingbreaches of smaller dams downstream of the Tangjiashandam was insignificant, due to their rather small volumes,which were only 2 % of the volume of the Tangjiashan lake.The construction of the spillway was proven to have played acrucial role in reducing the dam-breach flood, because all theother natural breach scenarios would have caused the flood-ing of the downstream towns and parts of Mianyang city.However, in retrospect improvements on the spillway designand the evacuation planning would have been possible. Thedam-break flood risk will be better controlled by reducing thespillway channel gradient and the porosity of the coating ofthe channel bottom. The experience and lessons we learnedfrom the Tangjiashan case will contribute to improving thehazard mitigation and risk management planning of similarevents in future.
1 Introduction
Natural damming of rivers by mass movements are verycommon and potentially dangerous phenomena (Costa andSchuster, 1988; Evans et al., 2011), which have been doc-umented all over the world, e.g. in Japan (Swanson et al.,1986), Canada (Clague and Evans, 1994), China (Chai etal., 1995), the northern Apennines in Italy (Casagli andErmini, 1999) and New Zealand (Korup, 2005). Hazardsand risks resulting from landslide dams have been reportedin many historic accounts of catastrophic floods from nat-ural dam failures. The 27 largest floods of the Quater-nary period with discharges greater than 100 000 m3 s−1
Published by Copernicus Publications on behalf of the European Geosciences Union.
3032 X. Fan et al.: Simulating dam-breach flood scenarios of the Tangjiashan landslide dam
were listed by O’Connor and Costa (2004), most of whichwere caused by breaches of glacier or landslide dams. Thelargest flood in recorded history was caused by the fail-ure of the earthquake-induced Raikhot landslide dam in1841 on the Indus River in Pakistan, which has an esti-mated peak discharge of∼ 540 000 m3 s−1 (Mason, 1929;Shroder Jr., 1998). Schneider (2009) described the largestlandslide triggered by the Kashmir earthquake (Mw = 7.6,2005) in Pakistan, which formed a natural dam impound-ing two lakes in the Karli river. Some other representa-tive cases were studied by Alexander (1988), Hewitt (1998),Cruden and Miller (2002), Dunning et al. (2006), Gupta andSah (2008) and Duman (2009). On overview of researchwork on landslide dams was made by Korup (2002) andEvans et al. (2011).
Many records of large landslide dams and catastrophicoutburst floods are known in China. On 1 June 1786, aM = 7.8 earthquake in the Kangding-Luding area triggered alarge (> 106 m3) landslide dam that blocked the Dadu River.Ten days later, the dam breached resulting in catastrophicdownstream flooding and 100 000 fatalities (Dai et al., 2005).Another examples is the sudden breach of three dams (Da-haizi, Xiaohaizi, and Deixi) induced by the Diexi earthquakecausing a tragic flood that affected settlements along a down-stream distance of 250 km, killing more than 2500 people(Chai et al., 2000). Of all the recorded cases, the largestdam was formed by the Yigong landslide (∼ 3× 10⁸ m3)
on 9 April 2000 in Tibet, which breached two monthslater and caused a flash flood with a peak discharge of∼
120 000 m3 s−1, resulting in 30 fatalities and over 100 peo-ple missing (Shang et al., 2003; Xu et al., 2012).
The Tangjiashan landslide dam induced by the devastat-ing 2008 Wenchuan earthquake (Mw = 7.9) in China, high-lighted the importance of the dam-breach flooding problem.This dam was the most dangerous one out of the> 800 co-seismic landslide dams mapped by Fan et al. (2012a, b),which had impounded the largest barrier lake with an esti-mated volume of 3× 10⁸ m3, threatening more than 2.5 mil-lion people downstream. Chinese authorities decided to evac-uate parts of the city until the Tangjiashan landslide dam wasartificially breached by a spillway, and the lake was drained(Liu et al., 2009).
For emergency mitigation planning related to potentialdam-break floods, the key issues are (1) assessing the damstability; (2) evaluating the potential dam breach process andmechanism; and (3) predicting the dam-break flood parame-ters, including the probable peak discharge, depth, velocity,duration and the affected area.
The stability assessment of landslide dams has been an im-portant research theme for a long time. Recently, a geomor-phic approach is widely used to correlate the dam and the im-pounded lake geomorphic features with the landslide dam’sstability (Ermini and Casagli, 2003; Dong et al., 2009). Us-ing this approach Cui et al. (2010) concluded that the Tangji-ashan dam was unstable. The limitation of this method is that
it ignores the dam structure and geotechnical properties ofthe dam materials (Dunning et al., 2005).
Concerning the dam breach process, Walder andO’Connor (1997) concluded that it was still poorly under-stood, since it involves a variety of processes, including sedi-ment entrainment from the breach floor, the gravitational col-lapse of breach sides and the downstream dam face. In theTangjiashan case, the availability of detailed field data andlaboratory-tested geotechnical parameters allow us to use aphysically-based model to simulate the dam breach process,predicting the dam-breach flood hydrograph, the failure timeand the ultimate breach geometry.
Regarding the dam-break flood modelling, the peak dis-charge can be predicted by both empirical and numericalsimulation methods. The empirical method relies on regres-sion relations between the peak discharge and other pa-rameters, such as the impounded lake volume, depth, andarea (Evans, 1986; Costa and Schuster, 1988; see Peng andZhang, 2012 for an overview). The numerical method in-cludes both a physically based model, e.g. the US NationalWeather Service BREACH Model (Fread, 1991) and Changand Zhang (2010) as well as a GIS-based hydraulic model (Liet al., 2011), which can also predict other flood characteris-tics (flood routing, depth, velocity, duration and the affectedarea). The empirical model is simple to apply, compared tothe numerical model which requires detailed parameters, butit provides less accurate results.
The previous studies on the Tangjiashan landslide dam aremainly concentrated on describing the emergency mitigationworks and on the estimation of the dam-break flood usingempirical methods (Liu et al., 2009; Xu et al., 2009; Cui etal., 2010) as well as on the prediction of the outburst floodhydrograph using physical models (Wang et al., 2008; Daiet al., 2010). However, there is little work on 2-D hydraulicmodelling of the dam-breach flood with consideration of dif-ferent scenarios, neither on the calibration of the model andon the cascading breach of several smaller downstream dams.To fill these gaps, the physically-based BREACH model andthe GIS-based hydraulic SOBEK 1-D–2-D model are inte-grated in this study to facilitate the dam-break flood mod-elling of the Tangjiashan dam. This study aims to model thedam-break floods of possible scenarios up to Mianyang city,based on our best understanding of the dam breach process.
2 Study area
2.1 Hydrologic and geological setting
The Tangjiashan landslide dam is located at 31.84◦ N,104.43◦ E, ∼5 km upstream of the town of Beichuan, whichwas completely devastated by the Wenchuan earthquake andthe large co-seismic landslides, and has not been recon-structed. The landslide blocked the Tongkou river (also calledJianjiang) with an upstream catchment area of 3, 550 km2
Nat. Hazards Earth Syst. Sci., 12, 3031–3044, 2012 www.nat-hazards-earth-syst-sci.net/12/3031/2012/
X. Fan et al.: Simulating dam-breach flood scenarios of the Tangjiashan landslide dam 3033
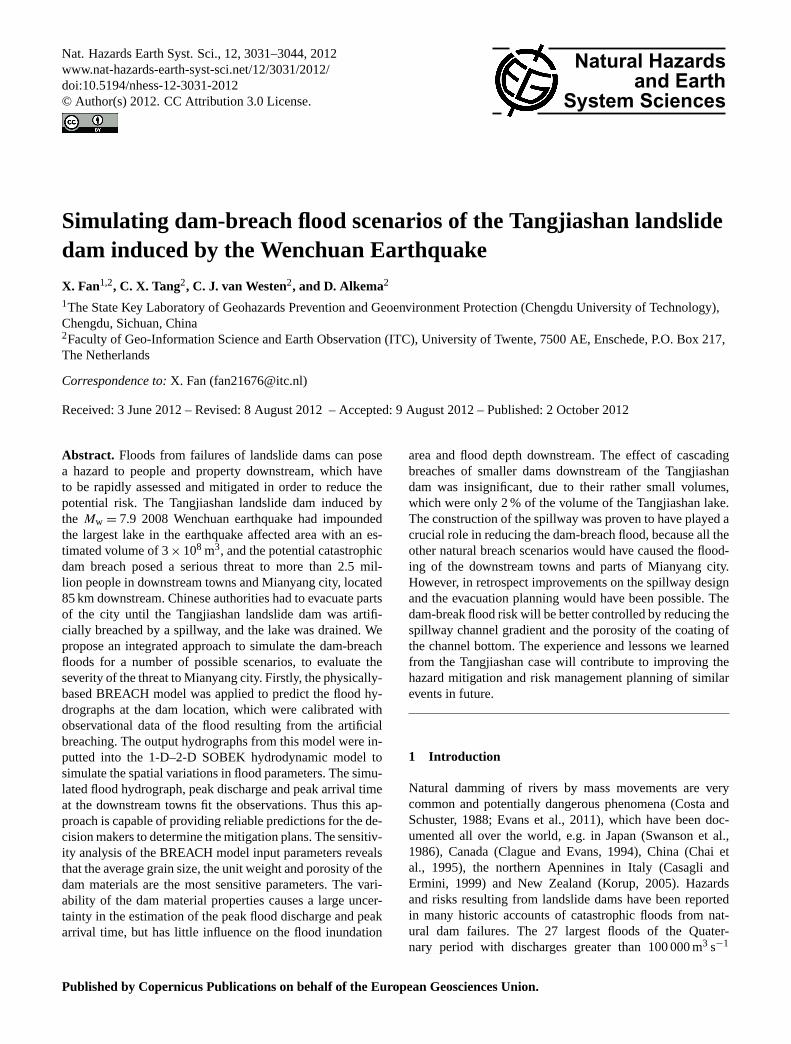
(Fig. 1). The river is 100–130 m wide and 0.5–4 m deep,having an asymmetrical V-shaped cross-section with rightand left valley-side slope gradient of∼ 45◦ and 25◦, re-spectively. The Tongkou river is mainly supplied by rain-fall, with a mean annual precipitation rate of 1287.5 mm. Therecorded maximum daily precipitation is 323.4 mm. Accord-ing to the record from the Beichuan hydraulic station, the av-erage annual discharge of the Tongkou river is 81 m3 s−1, andincreases to 167 m3 s−1 during the monsoon season whichlasts from May to October. The discharge before the dambreached was recorded as 90 m3 s−1 (Liu et al., 2009). His-torical flood records indicate that most of floods occurredin June to September due to extreme rainstorms, with thehighest frequency in July and August. In the past 100 yr, thelargest floods happened in 1902 and 1934 with peak dis-charges of 6720 m3 s−1 and 5750 m3 s−1, respectively. Ta-ble 1 shows the peak discharges of floods with different re-turn periods.
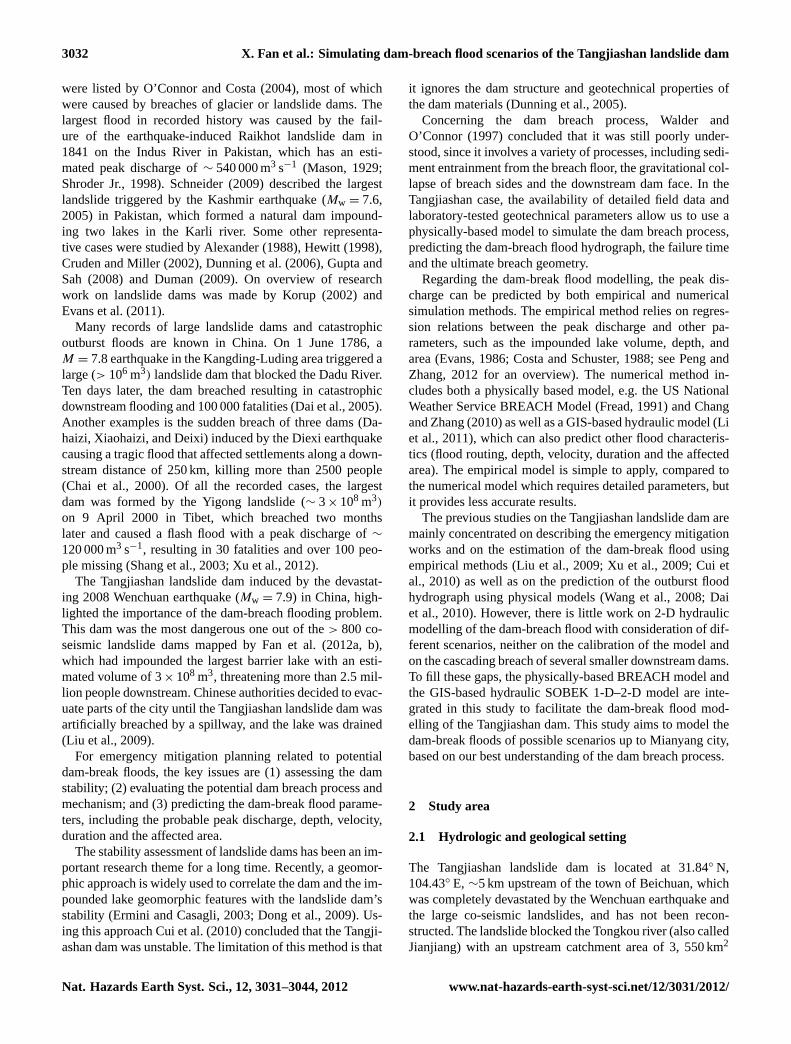
The Tangjiashan landslide dam was formed by a rock slidein fragmented bedrock composed of siltstone, siliceous rocksand mudstone of the Qingping Group, from the lower Cam-brian (Figs. 2 and 3, modified based on Xu et al., 2009). Thebedrock was covered by colluvium (mixed soil and fine rockfragments) with dense vegetation. The landslide is located onthe hanging wall of the main fault (Yingxiu-Beichuan fault),only 2 km away from the surface fault rupture. Due to thestrong seismic energy, the steep terrain and the fragile geo-logical structure, the landslide slid down into the river alongthe steep sliding surface (60◦) and even ran up to the oppositeslope, forming a 550 m high scarp (Fig. 2). The dam volumewas estimated to be 2.04× 10⁷ m3 with a height varying from82 m to 124 m through preliminary field measures (Liu et al.,2009). The dam crest extended approximately 600 m acrossthe valley and 800 m along the valley. It had impounded alake with 2.47× 10⁸ m3 of water till 7 June 2008, and withan estimated maximum capacity of 3× 10⁸ m3 (Liu et al.,2009). We generated the post-earthquake DEM with 5-m spa-tial resolution from the field-measured 2-m interval contourscovering the area from the dam site to the Beichuan town(Fig. 4). The dam volume was calculated to be 1.7× 10⁷ m3
by comparing the pre- and post- earthquake DEMs. Thereare also several smaller landslide dams located at the down-stream of the Tangjiashan dam (Fig. 4).
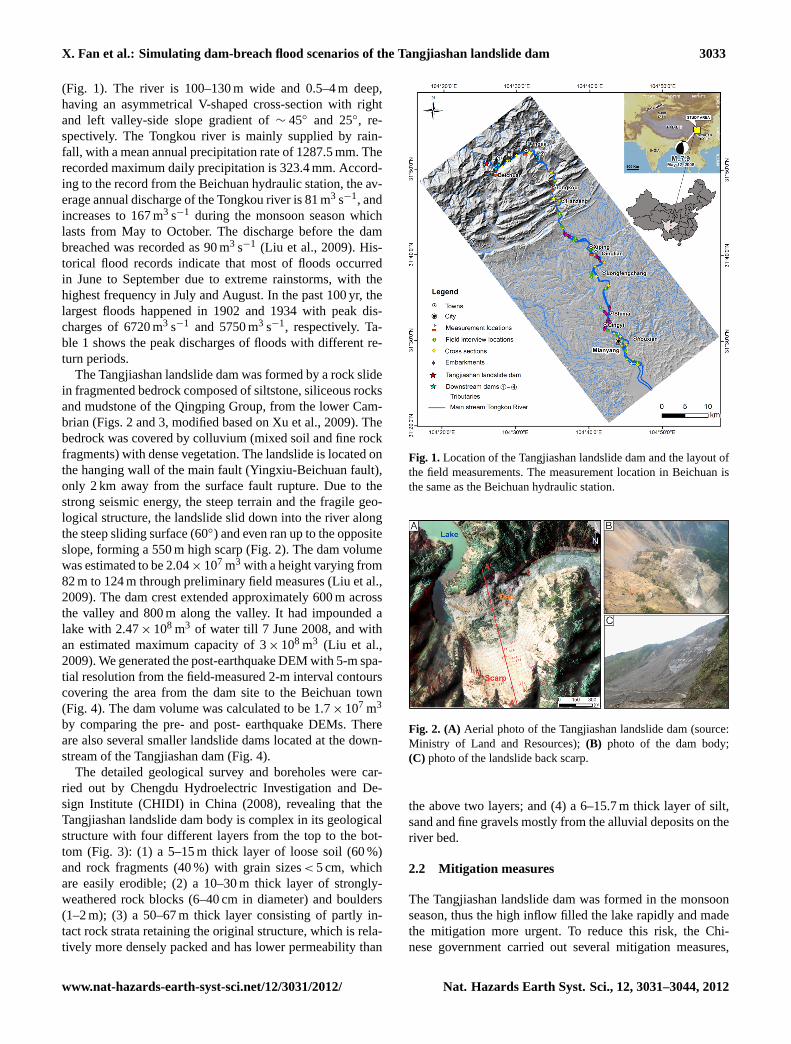
The detailed geological survey and boreholes were car-ried out by Chengdu Hydroelectric Investigation and De-sign Institute (CHIDI) in China (2008), revealing that theTangjiashan landslide dam body is complex in its geologicalstructure with four different layers from the top to the bot-tom (Fig. 3): (1) a 5–15 m thick layer of loose soil (60 %)and rock fragments (40 %) with grain sizes< 5 cm, whichare easily erodible; (2) a 10–30 m thick layer of strongly-weathered rock blocks (6–40 cm in diameter) and boulders(1–2 m); (3) a 50–67 m thick layer consisting of partly in-tact rock strata retaining the original structure, which is rela-tively more densely packed and has lower permeability than
Fig. 1.Location of the Tangjiashan landslide dam and the layout ofthe field measurements. The measurement location in Beichuan isthe same as the Beichuan hydraulic station.
Fig. 2. (A) Aerial photo of the Tangjiashan landslide dam (source:Ministry of Land and Resources);(B) photo of the dam body;(C) photo of the landslide back scarp.
the above two layers; and (4) a 6–15.7 m thick layer of silt,sand and fine gravels mostly from the alluvial deposits on theriver bed.
2.2 Mitigation measures
The Tangjiashan landslide dam was formed in the monsoonseason, thus the high inflow filled the lake rapidly and madethe mitigation more urgent. To reduce this risk, the Chi-nese government carried out several mitigation measures,
www.nat-hazards-earth-syst-sci.net/12/3031/2012/ Nat. Hazards Earth Syst. Sci., 12, 3031–3044, 2012
3034 X. Fan et al.: Simulating dam-breach flood scenarios of the Tangjiashan landslide dam
Table 1.Peak Discharge of floods with different return periods calculated from measurements at the Beichuan Hydraulic Station.
Return period (years) 2 5 10 20 50 100 200Peak discharge (m3 s−1) 1180 2190 3040 3920 5120 6040 6970
Fig. 3. (A) Geological profile (A–A′ in Fig. 2) of the Tangjiashanlandslide;(B) Longitudinal cross-section of the dam body along thevalley showing four-layered structure, modified based on ChengduHydroelectric Investigation and Design Institute (CHIDI) in China(2008) and Xu et al. (2009).
including 24-h monitoring of the lake level and the dam sta-bility situation, construction of a large emergency spillwayand evacuation of the people in the possible flooded area.The spillway was designed as a trapezoid cross-section witha slope of 1: 1.5 on both sides of the channel (Fig. 5a). Itwas 13 m wide, up to 9 m deep, 695 m long, and designed tobe capable to accommodate 1,160 m3 s−1. The longitudinalchannel gradient of the spillway varies from 0.6 % to 24 %from the upper reaches to the lower reaches (Liu et al., 2009).The construction work started on 26 May and was completedon 1 June 2008, lowering the lowest point on the dam crestfrom 750 m to 740.7 m. On 7 June when the impounded waterlevel rose to the lowest point on the dam crest, the spillwaystarted to drain the lake. The peak discharge of 6, 500 m3 s−1
appeared at 12:30 h (LT) on 10 June and declined quickly to79 m3 s−1 at 8:45 h (LT) on 11 June (Fig. 5b). During thisperiod, 1.6× 10⁸ m3 water was released and the water levelof the lake dropped∼27 m (Cui et al., 2010). Due to thestrong incision and erosion of the two top layers of the dambody, the spillway rapidly enlarged to a width of 100–130 mand eventually a depth of 40–60 m, and about 5× 10⁶ m3 of
material was eroded (Liu et al., 2009). Currently, the remain-ing part of the dam body is enhanced by concrete, still im-pounding about 8× 10⁷ m3 of water (Fig. 5c and d).
3 Data and methods
To simulate the dam-breach flood, we integrated theBREACH model (Fread, 1991) and the SOBEK 1-D–2-Dmodel developed by Deltares (Dhondia and Stelling, 2002).The BREACH model can simulate the outflow hydrographemanating from a dam and quantify the dam breach process.To calibrate the model, we reconstructed the 2008 event bysetting up the spillway as a base scenario. The outputs of theBREACH model for different scenarios were subsequentlyused in the SOBEK model. The integrated simulation ap-proach is depicted in the flowchart in Fig. 6.
Four scenarios were considered in this study:
Scenarios 1:assuming that the dam would breach natu-rally without the spillway under the same hydrologicalcondition as the base (calibrated) scenario for the pur-pose of evaluating the effects of the spillway.
Scenarios 2:the same asScenario 1, but also consider-ing that the breach of the Tangjiashan dam would causethe cascading breach of the four smaller downstreamdams as shown in Figs. 1 and 4.
Scenarios 3:assuming that the dam would breach nat-urally given a 5-yr return period flood discharge of2190 m3 s−1 (see Table 1) as inflow to lake, under aheavy rainstorm situation. The 5-yr return period wasselected as it is likely to occur and can provide largelydifferent outputs from other scenarios.
Scenarios 4:assuming the geotechnical parameters ofdam material would be the most unfavourable (worstcombination), leading to the whole breach of the damand the completely releasing all the water in the barrierlake, which is the most catastrophic scenario comparedto others.
3.1 The BREACH model and data requirements
The BREACH model is a physically based mathematicalmodel capable of predicting the breach characteristics andthe discharge hydrograph from the breach of a man-madedam or a naturally-formed landslide dam, developed byFread (1991) at the US National Weather Service. Thismodel is created by coupling the conservation of mass of
Nat. Hazards Earth Syst. Sci., 12, 3031–3044, 2012 www.nat-hazards-earth-syst-sci.net/12/3031/2012/
X. Fan et al.: Simulating dam-breach flood scenarios of the Tangjiashan landslide dam 3035
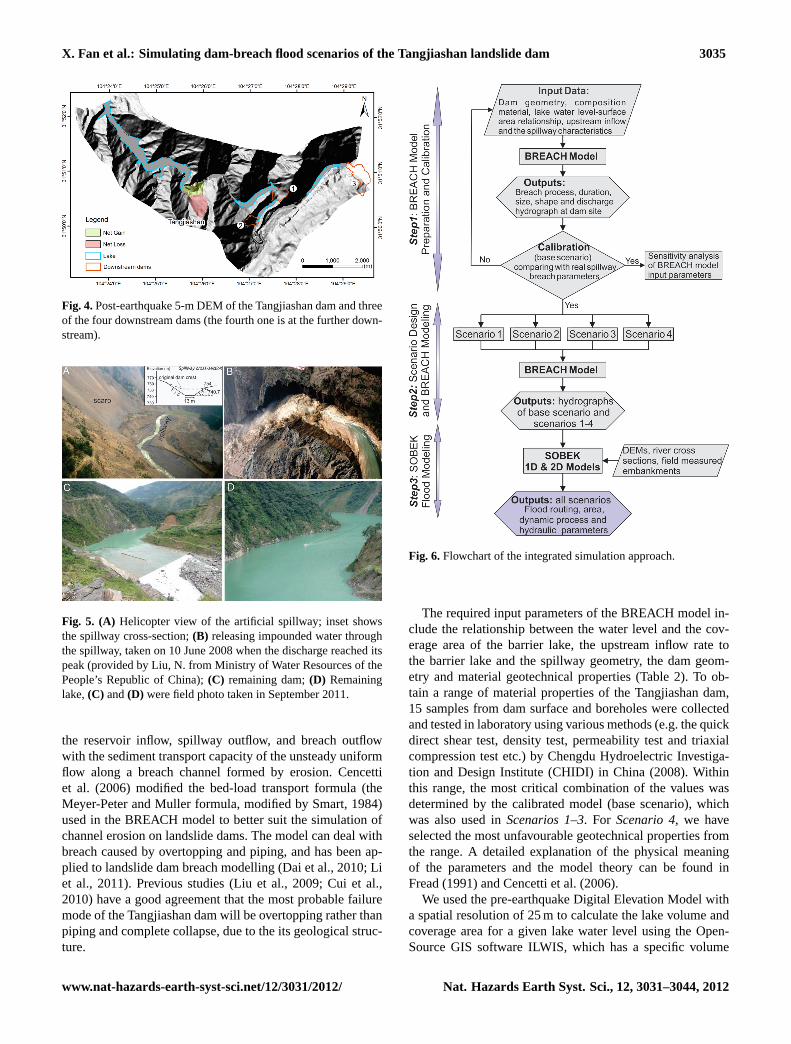
Fig. 4.Post-earthquake 5-m DEM of the Tangjiashan dam and threeof the four downstream dams (the fourth one is at the further down-stream).
Fig. 5. (A) Helicopter view of the artificial spillway; inset showsthe spillway cross-section;(B) releasing impounded water throughthe spillway, taken on 10 June 2008 when the discharge reached itspeak (provided by Liu, N. from Ministry of Water Resources of thePeople’s Republic of China);(C) remaining dam;(D) Remaininglake,(C) and(D) were field photo taken in September 2011.
the reservoir inflow, spillway outflow, and breach outflowwith the sediment transport capacity of the unsteady uniformflow along a breach channel formed by erosion. Cencettiet al. (2006) modified the bed-load transport formula (theMeyer-Peter and Muller formula, modified by Smart, 1984)used in the BREACH model to better suit the simulation ofchannel erosion on landslide dams. The model can deal withbreach caused by overtopping and piping, and has been ap-plied to landslide dam breach modelling (Dai et al., 2010; Liet al., 2011). Previous studies (Liu et al., 2009; Cui et al.,2010) have a good agreement that the most probable failuremode of the Tangjiashan dam will be overtopping rather thanpiping and complete collapse, due to the its geological struc-ture.
Fig. 6.Flowchart of the integrated simulation approach.
The required input parameters of the BREACH model in-clude the relationship between the water level and the cov-erage area of the barrier lake, the upstream inflow rate tothe barrier lake and the spillway geometry, the dam geom-etry and material geotechnical properties (Table 2). To ob-tain a range of material properties of the Tangjiashan dam,15 samples from dam surface and boreholes were collectedand tested in laboratory using various methods (e.g. the quickdirect shear test, density test, permeability test and triaxialcompression test etc.) by Chengdu Hydroelectric Investiga-tion and Design Institute (CHIDI) in China (2008). Withinthis range, the most critical combination of the values wasdetermined by the calibrated model (base scenario), whichwas also used inScenarios 1–3. For Scenario 4, we haveselected the most unfavourable geotechnical properties fromthe range. A detailed explanation of the physical meaningof the parameters and the model theory can be found inFread (1991) and Cencetti et al. (2006).
We used the pre-earthquake Digital Elevation Model witha spatial resolution of 25 m to calculate the lake volume andcoverage area for a given lake water level using the Open-Source GIS software ILWIS, which has a specific volume
www.nat-hazards-earth-syst-sci.net/12/3031/2012/ Nat. Hazards Earth Syst. Sci., 12, 3031–3044, 2012
3036 X. Fan et al.: Simulating dam-breach flood scenarios of the Tangjiashan landslide dam
Table 2. Input parameters for the BREACH model. A range of the dam material geotechnical properties was measured using laboratory testsshown in the brackets in the base scenario column.
Parameters Base scenario Scenarios 1 and 2 Scenario 3 Scenario 4
Lake parameters
Inflow to lake (m3 s−1) 90.0 90.0 2190.0 90.0Lake water level,H (m) 740.7 750.0 750.0 750.0Lake volume,V (m3) 2.3× 10⁸ 3.1× 10⁸ 3.1× 10⁸ 3.1× 10⁸
Average depth of lake,D (m) 30.6 33.7 33.7 33.7Lake covered area,Sa (m2) 7.4× 10⁶ 9.0× 10⁶ 9.0× 10⁶ 9.0× 10⁶
Dam and spillway geometry
Dam crest elevation,Hu (m) 750.0 750.0 750.0 750.0Dam downstream face gradient,S 0.10 0.18 0.18 0.18Initial breach bottom elevation,Hc (m) 740.7 – – –Initial width of breach bottom,Bo (m) 13.0 – – –Spillway length,L (m) 695.0 – – –
Geotechnical properties of dam material
Unit weight,ρ (kg m−3) 2400 (1900–2500) 2400 2400 1900Internal friction angleφ, (◦) 30 (24–36) 30 30 24Cohesion,C (kPa) 13 (10–15) 13 13 10D50 (m) 1.1 (0.4–2.0) 1.1 1.1 0.4Porosity,Por 0.32 (0.28–0.45) 0.32 0.32 0.45
Note:D50 is defined as the grain diameter at which 50 % of dam sediments are finer; porosity,Por is the ratio of voids to the total volume of aspecimen.
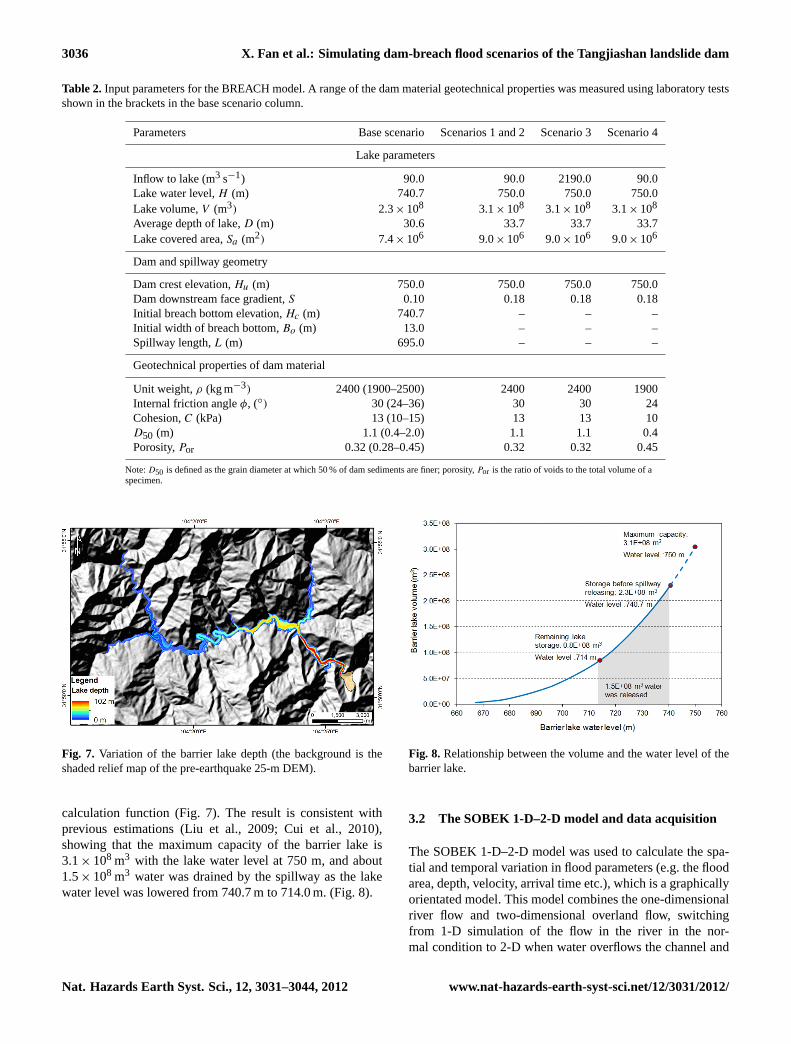
Fig. 7. Variation of the barrier lake depth (the background is theshaded relief map of the pre-earthquake 25-m DEM).
calculation function (Fig. 7). The result is consistent withprevious estimations (Liu et al., 2009; Cui et al., 2010),showing that the maximum capacity of the barrier lake is3.1× 108 m3 with the lake water level at 750 m, and about1.5× 108 m3 water was drained by the spillway as the lakewater level was lowered from 740.7 m to 714.0 m. (Fig. 8).
Fig. 8. Relationship between the volume and the water level of thebarrier lake.
3.2 The SOBEK 1-D–2-D model and data acquisition
The SOBEK 1-D–2-D model was used to calculate the spa-tial and temporal variation in flood parameters (e.g. the floodarea, depth, velocity, arrival time etc.), which is a graphicallyorientated model. This model combines the one-dimensionalriver flow and two-dimensional overland flow, switchingfrom 1-D simulation of the flow in the river in the nor-mal condition to 2-D when water overflows the channel and
Nat. Hazards Earth Syst. Sci., 12, 3031–3044, 2012 www.nat-hazards-earth-syst-sci.net/12/3031/2012/
X. Fan et al.: Simulating dam-breach flood scenarios of the Tangjiashan landslide dam 3037
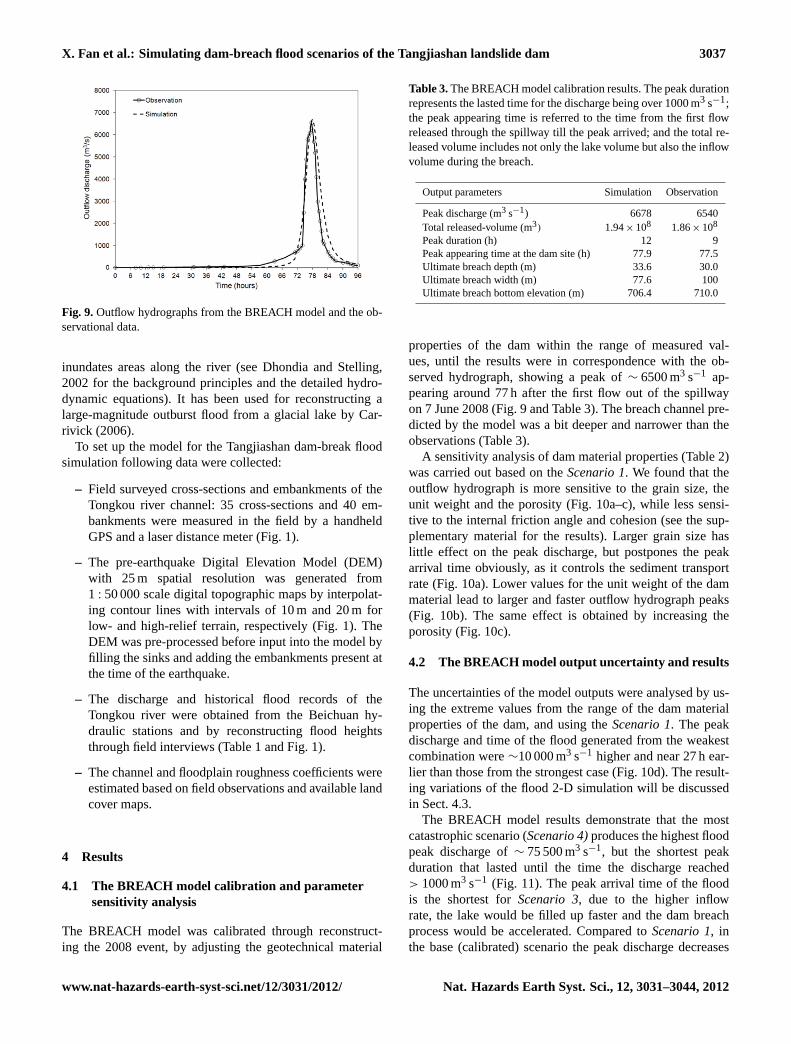
Fig. 9. Outflow hydrographs from the BREACH model and the ob-servational data.
inundates areas along the river (see Dhondia and Stelling,2002 for the background principles and the detailed hydro-dynamic equations). It has been used for reconstructing alarge-magnitude outburst flood from a glacial lake by Car-rivick (2006).
To set up the model for the Tangjiashan dam-break floodsimulation following data were collected:
– Field surveyed cross-sections and embankments of theTongkou river channel: 35 cross-sections and 40 em-bankments were measured in the field by a handheldGPS and a laser distance meter (Fig. 1).
– The pre-earthquake Digital Elevation Model (DEM)with 25 m spatial resolution was generated from1 : 50 000 scale digital topographic maps by interpolat-ing contour lines with intervals of 10 m and 20 m forlow- and high-relief terrain, respectively (Fig. 1). TheDEM was pre-processed before input into the model byfilling the sinks and adding the embankments present atthe time of the earthquake.
– The discharge and historical flood records of theTongkou river were obtained from the Beichuan hy-draulic stations and by reconstructing flood heightsthrough field interviews (Table 1 and Fig. 1).
– The channel and floodplain roughness coefficients wereestimated based on field observations and available landcover maps.
4 Results
4.1 The BREACH model calibration and parametersensitivity analysis
The BREACH model was calibrated through reconstruct-ing the 2008 event, by adjusting the geotechnical material
Table 3.The BREACH model calibration results. The peak durationrepresents the lasted time for the discharge being over 1000 m3 s−1;the peak appearing time is referred to the time from the first flowreleased through the spillway till the peak arrived; and the total re-leased volume includes not only the lake volume but also the inflowvolume during the breach.
Output parameters Simulation Observation
Peak discharge (m3 s−1) 6678 6540Total released-volume (m3) 1.94× 10⁸ 1.86× 10⁸
Peak duration (h) 12 9Peak appearing time at the dam site (h) 77.9 77.5Ultimate breach depth (m) 33.6 30.0Ultimate breach width (m) 77.6 100Ultimate breach bottom elevation (m) 706.4 710.0
properties of the dam within the range of measured val-ues, until the results were in correspondence with the ob-served hydrograph, showing a peak of∼ 6500 m3 s−1 ap-pearing around 77 h after the first flow out of the spillwayon 7 June 2008 (Fig. 9 and Table 3). The breach channel pre-dicted by the model was a bit deeper and narrower than theobservations (Table 3).
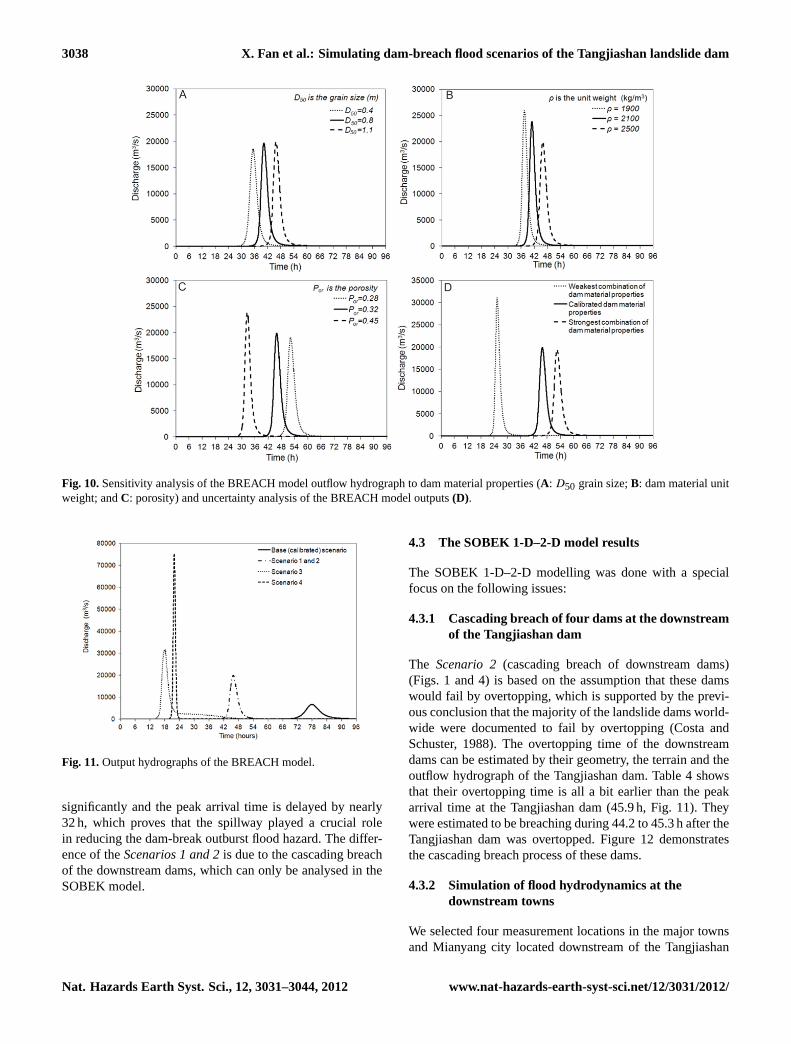
A sensitivity analysis of dam material properties (Table 2)was carried out based on theScenario 1. We found that theoutflow hydrograph is more sensitive to the grain size, theunit weight and the porosity (Fig. 10a–c), while less sensi-tive to the internal friction angle and cohesion (see the sup-plementary material for the results). Larger grain size haslittle effect on the peak discharge, but postpones the peakarrival time obviously, as it controls the sediment transportrate (Fig. 10a). Lower values for the unit weight of the dammaterial lead to larger and faster outflow hydrograph peaks(Fig. 10b). The same effect is obtained by increasing theporosity (Fig. 10c).
4.2 The BREACH model output uncertainty and results
The uncertainties of the model outputs were analysed by us-ing the extreme values from the range of the dam materialproperties of the dam, and using theScenario 1. The peakdischarge and time of the flood generated from the weakestcombination were∼10 000 m3 s−1 higher and near 27 h ear-lier than those from the strongest case (Fig. 10d). The result-ing variations of the flood 2-D simulation will be discussedin Sect. 4.3.
The BREACH model results demonstrate that the mostcatastrophic scenario (Scenario 4)produces the highest floodpeak discharge of∼ 75 500 m3 s−1, but the shortest peakduration that lasted until the time the discharge reached> 1000 m3 s−1 (Fig. 11). The peak arrival time of the floodis the shortest forScenario 3, due to the higher inflowrate, the lake would be filled up faster and the dam breachprocess would be accelerated. Compared toScenario 1, inthe base (calibrated) scenario the peak discharge decreases
www.nat-hazards-earth-syst-sci.net/12/3031/2012/ Nat. Hazards Earth Syst. Sci., 12, 3031–3044, 2012
3038 X. Fan et al.: Simulating dam-breach flood scenarios of the Tangjiashan landslide dam
Fig. 10.Sensitivity analysis of the BREACH model outflow hydrograph to dam material properties (A: D50 grain size;B: dam material unitweight; andC: porosity) and uncertainty analysis of the BREACH model outputs(D).
Fig. 11.Output hydrographs of the BREACH model.
significantly and the peak arrival time is delayed by nearly32 h, which proves that the spillway played a crucial rolein reducing the dam-break outburst flood hazard. The differ-ence of theScenarios 1 and 2is due to the cascading breachof the downstream dams, which can only be analysed in theSOBEK model.
4.3 The SOBEK 1-D–2-D model results
The SOBEK 1-D–2-D modelling was done with a specialfocus on the following issues:
4.3.1 Cascading breach of four dams at the downstreamof the Tangjiashan dam
The Scenario 2(cascading breach of downstream dams)(Figs. 1 and 4) is based on the assumption that these damswould fail by overtopping, which is supported by the previ-ous conclusion that the majority of the landslide dams world-wide were documented to fail by overtopping (Costa andSchuster, 1988). The overtopping time of the downstreamdams can be estimated by their geometry, the terrain and theoutflow hydrograph of the Tangjiashan dam. Table 4 showsthat their overtopping time is all a bit earlier than the peakarrival time at the Tangjiashan dam (45.9 h, Fig. 11). Theywere estimated to be breaching during 44.2 to 45.3 h after theTangjiashan dam was overtopped. Figure 12 demonstratesthe cascading breach process of these dams.
4.3.2 Simulation of flood hydrodynamics at thedownstream towns
We selected four measurement locations in the major townsand Mianyang city located downstream of the Tangjiashan
Nat. Hazards Earth Syst. Sci., 12, 3031–3044, 2012 www.nat-hazards-earth-syst-sci.net/12/3031/2012/
X. Fan et al.: Simulating dam-breach flood scenarios of the Tangjiashan landslide dam 3039
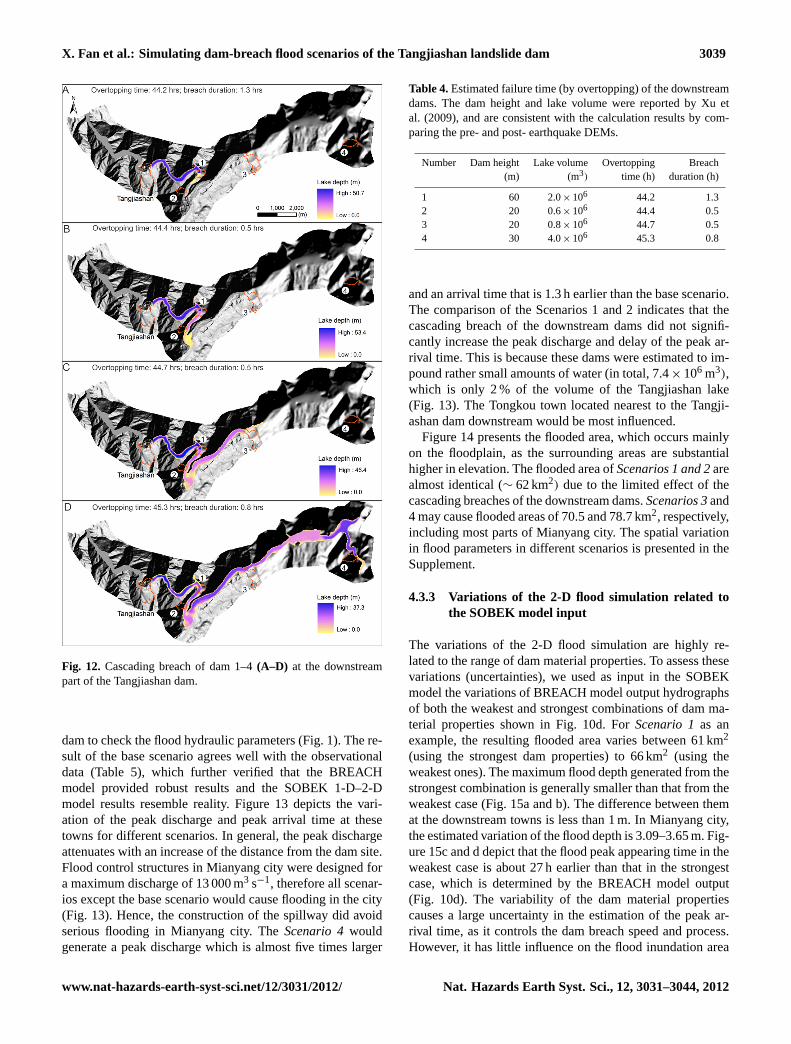
Fig. 12. Cascading breach of dam 1–4(A–D) at the downstreampart of the Tangjiashan dam.
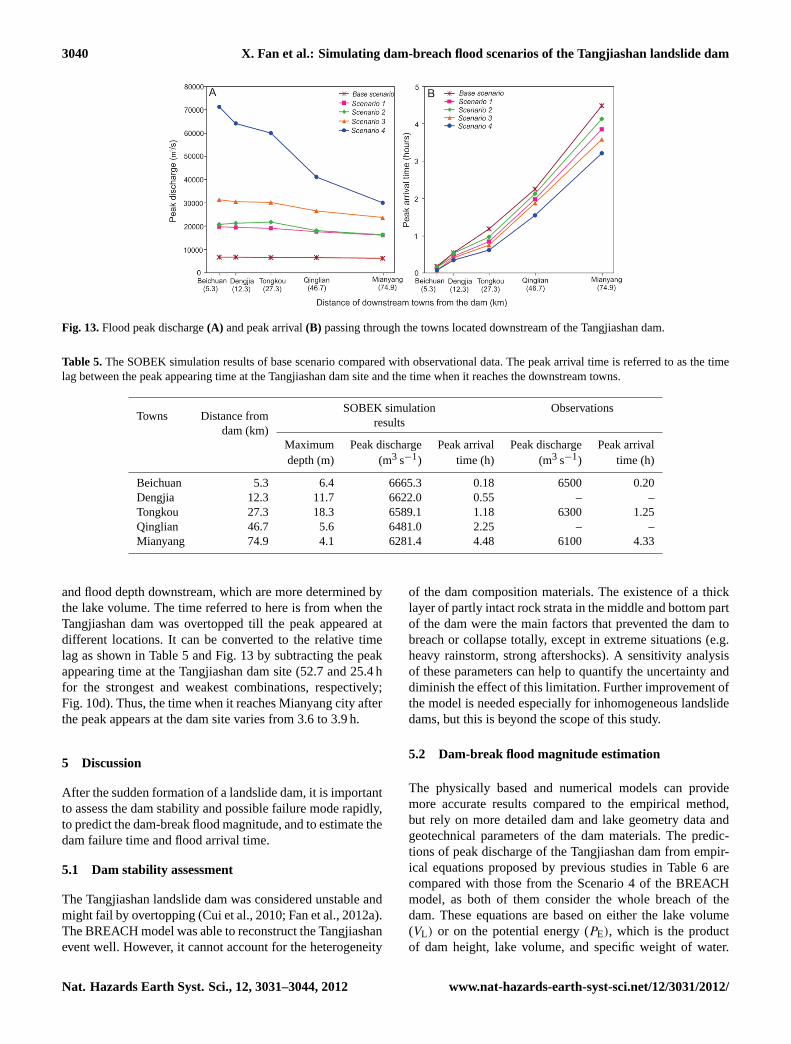
dam to check the flood hydraulic parameters (Fig. 1). The re-sult of the base scenario agrees well with the observationaldata (Table 5), which further verified that the BREACHmodel provided robust results and the SOBEK 1-D–2-Dmodel results resemble reality. Figure 13 depicts the vari-ation of the peak discharge and peak arrival time at thesetowns for different scenarios. In general, the peak dischargeattenuates with an increase of the distance from the dam site.Flood control structures in Mianyang city were designed fora maximum discharge of 13 000 m3 s−1, therefore all scenar-ios except the base scenario would cause flooding in the city(Fig. 13). Hence, the construction of the spillway did avoidserious flooding in Mianyang city. TheScenario 4wouldgenerate a peak discharge which is almost five times larger
Table 4.Estimated failure time (by overtopping) of the downstreamdams. The dam height and lake volume were reported by Xu etal. (2009), and are consistent with the calculation results by com-paring the pre- and post- earthquake DEMs.
Number Dam height Lake volume Overtopping Breach(m) (m3) time (h) duration (h)
1 60 2.0× 10⁶ 44.2 1.32 20 0.6× 10⁶ 44.4 0.53 20 0.8× 10⁶ 44.7 0.54 30 4.0× 10⁶ 45.3 0.8
and an arrival time that is 1.3 h earlier than the base scenario.The comparison of the Scenarios 1 and 2 indicates that thecascading breach of the downstream dams did not signifi-cantly increase the peak discharge and delay of the peak ar-rival time. This is because these dams were estimated to im-pound rather small amounts of water (in total, 7.4× 10⁶ m3),which is only 2 % of the volume of the Tangjiashan lake(Fig. 13). The Tongkou town located nearest to the Tangji-ashan dam downstream would be most influenced.
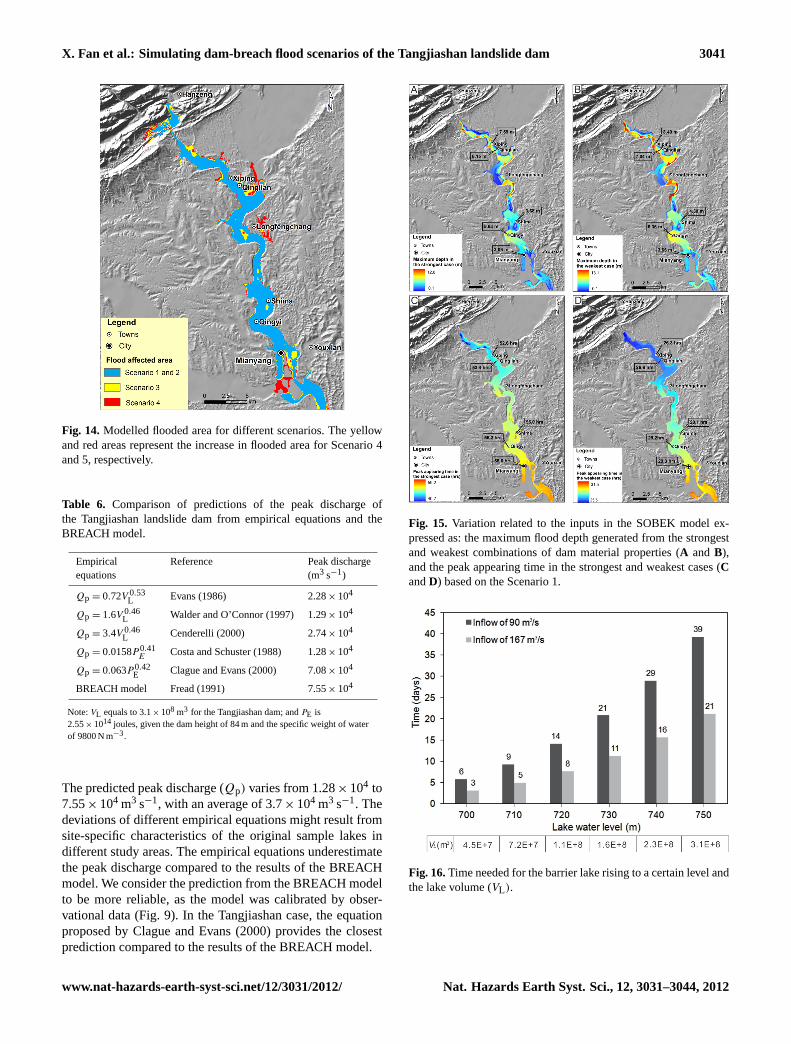
Figure 14 presents the flooded area, which occurs mainlyon the floodplain, as the surrounding areas are substantialhigher in elevation. The flooded area ofScenarios 1 and 2arealmost identical (∼ 62 km2) due to the limited effect of thecascading breaches of the downstream dams.Scenarios 3and4 may cause flooded areas of 70.5 and 78.7 km2, respectively,including most parts of Mianyang city. The spatial variationin flood parameters in different scenarios is presented in theSupplement.
4.3.3 Variations of the 2-D flood simulation related tothe SOBEK model input
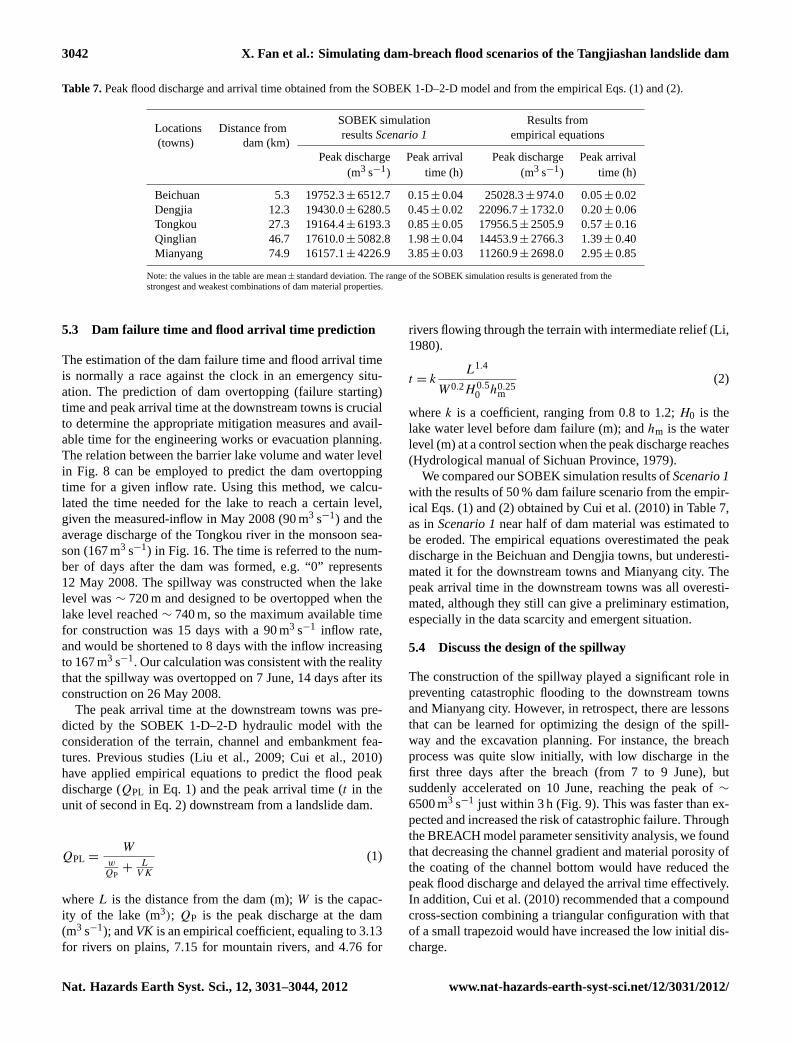
The variations of the 2-D flood simulation are highly re-lated to the range of dam material properties. To assess thesevariations (uncertainties), we used as input in the SOBEKmodel the variations of BREACH model output hydrographsof both the weakest and strongest combinations of dam ma-terial properties shown in Fig. 10d. ForScenario 1as anexample, the resulting flooded area varies between 61 km2
(using the strongest dam properties) to 66 km2 (using theweakest ones). The maximum flood depth generated from thestrongest combination is generally smaller than that from theweakest case (Fig. 15a and b). The difference between themat the downstream towns is less than 1 m. In Mianyang city,the estimated variation of the flood depth is 3.09–3.65 m. Fig-ure 15c and d depict that the flood peak appearing time in theweakest case is about 27 h earlier than that in the strongestcase, which is determined by the BREACH model output(Fig. 10d). The variability of the dam material propertiescauses a large uncertainty in the estimation of the peak ar-rival time, as it controls the dam breach speed and process.However, it has little influence on the flood inundation area
www.nat-hazards-earth-syst-sci.net/12/3031/2012/ Nat. Hazards Earth Syst. Sci., 12, 3031–3044, 2012
3040 X. Fan et al.: Simulating dam-breach flood scenarios of the Tangjiashan landslide dam
Fig. 13.Flood peak discharge(A) and peak arrival(B) passing through the towns located downstream of the Tangjiashan dam.
Table 5.The SOBEK simulation results of base scenario compared with observational data. The peak arrival time is referred to as the timelag between the peak appearing time at the Tangjiashan dam site and the time when it reaches the downstream towns.
Towns Distance fromSOBEK simulation Observations
dam (km)results
Maximum Peak discharge Peak arrival Peak discharge Peak arrivaldepth (m) (m3 s−1) time (h) (m3 s−1) time (h)
Beichuan 5.3 6.4 6665.3 0.18 6500 0.20Dengjia 12.3 11.7 6622.0 0.55 – –Tongkou 27.3 18.3 6589.1 1.18 6300 1.25Qinglian 46.7 5.6 6481.0 2.25 – –Mianyang 74.9 4.1 6281.4 4.48 6100 4.33
and flood depth downstream, which are more determined bythe lake volume. The time referred to here is from when theTangjiashan dam was overtopped till the peak appeared atdifferent locations. It can be converted to the relative timelag as shown in Table 5 and Fig. 13 by subtracting the peakappearing time at the Tangjiashan dam site (52.7 and 25.4 hfor the strongest and weakest combinations, respectively;Fig. 10d). Thus, the time when it reaches Mianyang city afterthe peak appears at the dam site varies from 3.6 to 3.9 h.
5 Discussion
After the sudden formation of a landslide dam, it is importantto assess the dam stability and possible failure mode rapidly,to predict the dam-break flood magnitude, and to estimate thedam failure time and flood arrival time.
5.1 Dam stability assessment
The Tangjiashan landslide dam was considered unstable andmight fail by overtopping (Cui et al., 2010; Fan et al., 2012a).The BREACH model was able to reconstruct the Tangjiashanevent well. However, it cannot account for the heterogeneity
of the dam composition materials. The existence of a thicklayer of partly intact rock strata in the middle and bottom partof the dam were the main factors that prevented the dam tobreach or collapse totally, except in extreme situations (e.g.heavy rainstorm, strong aftershocks). A sensitivity analysisof these parameters can help to quantify the uncertainty anddiminish the effect of this limitation. Further improvement ofthe model is needed especially for inhomogeneous landslidedams, but this is beyond the scope of this study.
5.2 Dam-break flood magnitude estimation
The physically based and numerical models can providemore accurate results compared to the empirical method,but rely on more detailed dam and lake geometry data andgeotechnical parameters of the dam materials. The predic-tions of peak discharge of the Tangjiashan dam from empir-ical equations proposed by previous studies in Table 6 arecompared with those from the Scenario 4 of the BREACHmodel, as both of them consider the whole breach of thedam. These equations are based on either the lake volume(VL) or on the potential energy (PE), which is the productof dam height, lake volume, and specific weight of water.
Nat. Hazards Earth Syst. Sci., 12, 3031–3044, 2012 www.nat-hazards-earth-syst-sci.net/12/3031/2012/
X. Fan et al.: Simulating dam-breach flood scenarios of the Tangjiashan landslide dam 3041
Fig. 14.Modelled flooded area for different scenarios. The yellowand red areas represent the increase in flooded area for Scenario 4and 5, respectively.
Table 6. Comparison of predictions of the peak discharge ofthe Tangjiashan landslide dam from empirical equations and theBREACH model.
Empirical Reference Peak dischargeequations (m3 s−1)
Qp = 0.72V 0.53L Evans (1986) 2.28× 10⁴
Qp = 1.6V 0.46L Walder and O’Connor (1997) 1.29× 10⁴
Qp = 3.4V 0.46L Cenderelli (2000) 2.74× 10⁴
Qp = 0.0158P 0.41E
Costa and Schuster (1988) 1.28× 10⁴
Qp = 0.063P 0.42E Clague and Evans (2000) 7.08× 10⁴
BREACH model Fread (1991) 7.55× 10⁴
Note:VL equals to 3.1× 10⁸ m3 for the Tangjiashan dam; andPE is2.55× 1014 joules, given the dam height of 84 m and the specific weight of waterof 9800 N m−3.
The predicted peak discharge (Qp) varies from 1.28× 10⁴ to7.55× 104 m3 s−1, with an average of 3.7× 10⁴ m3 s−1. Thedeviations of different empirical equations might result fromsite-specific characteristics of the original sample lakes indifferent study areas. The empirical equations underestimatethe peak discharge compared to the results of the BREACHmodel. We consider the prediction from the BREACH modelto be more reliable, as the model was calibrated by obser-vational data (Fig. 9). In the Tangjiashan case, the equationproposed by Clague and Evans (2000) provides the closestprediction compared to the results of the BREACH model.
Fig. 15. Variation related to the inputs in the SOBEK model ex-pressed as: the maximum flood depth generated from the strongestand weakest combinations of dam material properties (A andB),and the peak appearing time in the strongest and weakest cases (CandD) based on the Scenario 1.
Fig. 16.Time needed for the barrier lake rising to a certain level andthe lake volume (VL).
www.nat-hazards-earth-syst-sci.net/12/3031/2012/ Nat. Hazards Earth Syst. Sci., 12, 3031–3044, 2012
3042 X. Fan et al.: Simulating dam-breach flood scenarios of the Tangjiashan landslide dam
Table 7.Peak flood discharge and arrival time obtained from the SOBEK 1-D–2-D model and from the empirical Eqs. (1) and (2).
Locations Distance fromSOBEK simulation Results from
(towns) dam (km)resultsScenario 1 empirical equations
Peak discharge Peak arrival Peak discharge Peak arrival(m3 s−1) time (h) (m3 s−1) time (h)
Beichuan 5.3 19752.3± 6512.7 0.15± 0.04 25028.3± 974.0 0.05± 0.02Dengjia 12.3 19430.0± 6280.5 0.45± 0.02 22096.7± 1732.0 0.20± 0.06Tongkou 27.3 19164.4± 6193.3 0.85± 0.05 17956.5± 2505.9 0.57± 0.16Qinglian 46.7 17610.0± 5082.8 1.98± 0.04 14453.9± 2766.3 1.39± 0.40Mianyang 74.9 16157.1± 4226.9 3.85± 0.03 11260.9± 2698.0 2.95± 0.85
Note: the values in the table are mean± standard deviation. The range of the SOBEK simulation results is generated from thestrongest and weakest combinations of dam material properties.
5.3 Dam failure time and flood arrival time prediction
The estimation of the dam failure time and flood arrival timeis normally a race against the clock in an emergency situ-ation. The prediction of dam overtopping (failure starting)time and peak arrival time at the downstream towns is crucialto determine the appropriate mitigation measures and avail-able time for the engineering works or evacuation planning.The relation between the barrier lake volume and water levelin Fig. 8 can be employed to predict the dam overtoppingtime for a given inflow rate. Using this method, we calcu-lated the time needed for the lake to reach a certain level,given the measured-inflow in May 2008 (90 m3 s−1) and theaverage discharge of the Tongkou river in the monsoon sea-son (167 m3 s−1) in Fig. 16. The time is referred to the num-ber of days after the dam was formed, e.g. “0” represents12 May 2008. The spillway was constructed when the lakelevel was∼ 720 m and designed to be overtopped when thelake level reached∼ 740 m, so the maximum available timefor construction was 15 days with a 90 m3 s−1 inflow rate,and would be shortened to 8 days with the inflow increasingto 167 m3 s−1. Our calculation was consistent with the realitythat the spillway was overtopped on 7 June, 14 days after itsconstruction on 26 May 2008.
The peak arrival time at the downstream towns was pre-dicted by the SOBEK 1-D–2-D hydraulic model with theconsideration of the terrain, channel and embankment fea-tures. Previous studies (Liu et al., 2009; Cui et al., 2010)have applied empirical equations to predict the flood peakdischarge (QPL in Eq. 1) and the peak arrival time (t in theunit of second in Eq. 2) downstream from a landslide dam.
QPL =W
wQP
+L
V K
(1)
whereL is the distance from the dam (m);W is the capac-ity of the lake (m3); QP is the peak discharge at the dam(m3 s−1); andVK is an empirical coefficient, equaling to 3.13for rivers on plains, 7.15 for mountain rivers, and 4.76 for
rivers flowing through the terrain with intermediate relief (Li,1980).
t = kL1.4
W0.2H 0.50 h0.25
m
(2)
wherek is a coefficient, ranging from 0.8 to 1.2;H0 is thelake water level before dam failure (m); andhm is the waterlevel (m) at a control section when the peak discharge reaches(Hydrological manual of Sichuan Province, 1979).
We compared our SOBEK simulation results ofScenario 1with the results of 50 % dam failure scenario from the empir-ical Eqs. (1) and (2) obtained by Cui et al. (2010) in Table 7,as inScenario 1near half of dam material was estimated tobe eroded. The empirical equations overestimated the peakdischarge in the Beichuan and Dengjia towns, but underesti-mated it for the downstream towns and Mianyang city. Thepeak arrival time in the downstream towns was all overesti-mated, although they still can give a preliminary estimation,especially in the data scarcity and emergent situation.
5.4 Discuss the design of the spillway
The construction of the spillway played a significant role inpreventing catastrophic flooding to the downstream townsand Mianyang city. However, in retrospect, there are lessonsthat can be learned for optimizing the design of the spill-way and the excavation planning. For instance, the breachprocess was quite slow initially, with low discharge in thefirst three days after the breach (from 7 to 9 June), butsuddenly accelerated on 10 June, reaching the peak of∼
6500 m3 s−1 just within 3 h (Fig. 9). This was faster than ex-pected and increased the risk of catastrophic failure. Throughthe BREACH model parameter sensitivity analysis, we foundthat decreasing the channel gradient and material porosity ofthe coating of the channel bottom would have reduced thepeak flood discharge and delayed the arrival time effectively.In addition, Cui et al. (2010) recommended that a compoundcross-section combining a triangular configuration with thatof a small trapezoid would have increased the low initial dis-charge.
Nat. Hazards Earth Syst. Sci., 12, 3031–3044, 2012 www.nat-hazards-earth-syst-sci.net/12/3031/2012/
X. Fan et al.: Simulating dam-breach flood scenarios of the Tangjiashan landslide dam 3043
6 Conclusions
The Tangjiashan landslide dam was the most dangerous oneof the approximately 800 coseismic landslide dams inducedby the Wenchuan earthquake, and impounded the largest lakewhose catastrophic outburst flooding threatened∼ 2.5 mil-lion people downstream. This research provided insights inthe dam-breach process and the resulting flood propagationin possible scenarios. The integration of the BREACH modeland the SOBEK model can provide predictions that agreedwell with the observations. The uncertainty analysis revealedthat the variability of the dam material properties will not sig-nificantly affect the flood inundation area and the maximumflood depth in the downstream area. However, it will causelarge variation in the flood peak discharge and peak arrivaltime. We found that the cascading breach of the downstreamdams did not have a major influence on the modelled floodparameters, because they had lake volumes much smallerthan that of the Tangjiashan Lake. Based on the experienceand lessons we learned from the simulations of the Tangji-ashan event, we recommend making the mitigation measureson the basis of predictions from physically and hydraulicallybased models whenever possible. In data scarce situation,and in emergency situations with limited time to take deci-sions, the empirical method can also provide relatively goodfirst-hand estimations.
Supplementary material related to this article isavailable online at:http://www.nat-hazards-earth-syst-sci.net/12/3031/2012/nhess-12-3031-2012-supplement.pdf.
Acknowledgements.This research was financially supported bythe National Natural Science Foundation of the People’s Republicof China (41130745) and the Creative Team Program of Ministryof Education of China (IRT0812), in collaboration with the UnitedNations University – ITC Centre for Spatial Analysis and DisasterRisk Management of the University of Twente, the Netherlands.The authors acknowledge the Mianyang Hydrological Center,Sichuan Hydrological and Water Resource Bureau and local mu-nicipalities for providing the hydrological and meteorological data.We thank Prof. Chuan Tang and Prof. Jing Zhu for their supportto the fieldwork and data collection. We thank Alexander Strom,Theo van Asch and Jia-Jyun Dong for constructive comments onan earlier manuscript.
Edited by: B. D. MalamudReviewed by: A. Strom, J.-J. Dong, and T. Van Asch
References
Alexander, D.: Valtellina landslide and flood emergency, northernItaly, 1987, Disasters, 12, 212–222, 1988.
Carrivick, J. L.: Application of 2D hydrodynamic modeling to high-magnitude outburst floods: An example from Kverkfjoll, Iceland,J. Hydrol., 321, 187–199, 2006.
Casagli, N. and Ermini, L.: Geomorphic analysis of landslide damsin the Northern Apennine, Trans. Jpn. Geomorph. Union, 20,219–249, 1999.
Cencetti, C., Fredduzzi, A., Marchesini, I., Naccini, M., and Tac-coni, P.: Some considerations about the simulation of breachchannel erosion on landslide dams, Computat. Geosci., 10, 201–219, 2006.
Cenderelli, D. A.: Floods from natural and artificial dam failures, in:Inland Flood Hazards, edited by: Wohl, E. E., Cambridge Univer-sity Press, New York, 73–103, 2000.
Chai, H., Liu, H., and Zhang, Z.: The catalog of Chinese land-slide dam events, Journal of Geological Hazards and Environ-ment Preservation, 6, 1–9, 1995 (in Chinese).
Chai, H., Liu, H., Zhang, Z., and Xu, Z.: The distribution, causesand effects of damming landslides in China, Journal of theChengdu Institute of Technology, 27, 302–307, 2000 (In Chi-nese).
Chang, D. S. and Zhang, L. M.: Simulation of the erosion processof landslide dams due to overtopping considering variations insoil erodibility along depth, Nat. Hazards Earth Syst. Sci., 10,933–946,doi:10.5194/nhess-10-933-2010, 2010.
Clague, J. J. and Evans, S. G.: Formation and failure of natural damsin the Canadian Cordillera, Geol. Surv. Canada Bull., 464, 1–35,1994.
Clague, J. J. and Evans, S. G.: A review of catastrophic drainageof moraine-dammed lakes in British Columbia, Quaternary Sci.Rev., 19, 1763–1783, 2000.
Chengdu Hydroelectric Investigation and Design Institute (CHIDI)in China: Report on the stability assessment of the Tangjiashanlandslide dam and up- and downstream slopes, 2008.
Costa, J. E. and Schuster, R. L.: The formation and failure of naturaldams, Geol. Soc. Am. Bull., 100, 1054–1068, 1988.
Cruden, D. M. and Miller, B. G. N.: The Eureka River landslideand dam, Peace River Lowlands, Alberta. Can. Geotch. J., 39,863–878, 2002.
Cui, P., Dang, C., Zhuang, J., You, Y., Chen, X., and Scott, K. M.:Landslide-dammed lake at Tangjiashan, Sichuan Province, China(triggered by the Wenchuan earthquake, 12 May, 2008): risk as-sessment, mitigation strategy, and lessons learned, Environ. EarthSci., 65, 1055–1065, 2012.
Dai, F., Lee, C., Deng, J., and Tham, L. G.: The 1786 earthquake-triggered landslide dam and subsequent dam-break flood on theDadu River, southwestern China, Geomorphology, 65, 205–221,2005.
Dai, J., Zhang, S., and Xue, C.: Dam-break flood modeling forTangjiashan Quake Lake, Second International Conference onEarth Observation for Global Changes. Proc. SPIE Vol. 7471,74711D,doi:10.1117/12.836313, 2010.
Dhondia, J. F. and Stelling, G. S.: Application of the onedimensional-two dimensional integrated hydraulic model forflood simulation and damage assessment, Hydroinformatics2002: Proceedings of the Fifth International Conference on Hy-droinformatics, Cardiff, UK, 2002.
www.nat-hazards-earth-syst-sci.net/12/3031/2012/ Nat. Hazards Earth Syst. Sci., 12, 3031–3044, 2012
3044 X. Fan et al.: Simulating dam-breach flood scenarios of the Tangjiashan landslide dam
Dong, J. J, Tung, Y. H., Chen, C. C., Liao, J. J., and Pan, Y. W.: Dis-criminant analysis of the geomorphic characteristics and stabilityof landslide dams, Geomorphology, 110, 162–171, 2009.
Duman, T. Y.: The largest landslide dam in Turkey: Tortum land-slide, Eng. Geol., 104, 66–79, 2009.
Dunning, S. A., Rosser, N. J., Petley, D. N., and Massey, C. R.:Formation and failure of the Tsatichhu landslide dam, Bhutan,Landslides, 3, 107–113, 2006.
Ermini, L. and Casagli, N.: Prediction of the behavior of landslidedams using a geomorphological dimensionless index, Earth Surf.Proc. Landf., 28, 31–47, 2003.
Evans, S. G.: The maximum discharge of outburst floods caused bythe breaching of man-made and natural dams, Can. Geotch. J.,23, 385–87, 1986.
Evans, S. G., Delaney, K. B., Hermanns, R. L., Strom, A., andScarascia-Mugnozza, G.: The formation and behaviour of nat-ural and artificial rockslide dams; implications for engineer-ing performance and hazard management, in: Natural and ar-tificial rockslide dams, edited by: Evans, S. G., Hermanns, R.L., Strom, A. L., Scarascia-Mugnozza, G., and Mugnozza, G.,Berlin: Springer, Lecture Series in Earth Sciences, 1–76, 2011.
Fan, X., van Westen, C. J., Korup, O., Gorum, T., Xu, Q., Dai, F.,Huang, R., and Wang, G.: Transient water and sediment storageof the decaying landslide dams induced by the 2008 WenchuanEarthquake, China, Geomorphology, 171–172, 58–68, 2012.
Fan, X., van Westen, C. J., Xu, Q., Gorum, T., and Dai, F.: Analysisof landslide dams induced by the 2008 Wenchuan earthquake, J.Asian Earth Sci., 57, 25–37, 2012.
Fread, D. L.: BREACH: an erosion model for earth dam failures.Hydrologic Research Laboratory, US National Weather Service,1991.
Gupta, V. and Sah, M. P.: Impact of the Trans-Himalayan LandslideLake Outburst Flood (LLOF) in the Satluj catchment, HimachalPradesh, India, Nat. Hazards, 45, 379–390, 2008.
Hewitt, K.: Catastrophic landslides and their effects on the UpperIndus streams, Karakoram Himalaya, northern Pakistan, Geo-morphology, 26, 47–80, 1998.
Hydrological manual of Sichuan Province, Hydrology office ofSichuan Province, Sichuan Science and Technique House,Chengdu, 1979 (in Chinese).
Korup, O.: Recent research on landslide dams-a literature reviewwith special attention to New Zealand, Prog. Phys. Geog., 26,206–235, 2002.
Korup, O.: Geomorphic hazard assessment of landslide dams inSouth Westland, New Zealand: Fundamental problems and ap-proaches, Geomorphology, 66, 167–188, 2005.
Li, M. H., Sung, R. T., Dong, J. J., Lee, C. T., and Chen, C. C.:The formation and breaching of a short-lived landslide dam atHsiaolin Village, Taiwan-Part II: Simulation of debris flow withlandslide dam breach, Eng. Geol., 123, 60–71, 2011.
Li, W.: Handbook of hydraulic calculations, Water Publication, Bei-jing, 1980 (in Chinese).
Liu, N., Zhang, J., Lin, W., Cheng, W., and Chen, Z.: DrainingTangjiashan Barrier Lake after Wenchuan Earthquake and theflood propagation after the dam break, Sci. China Ser. E., 52,801–809, 2009.
Mason, K.: Indus floods and Shyok glaciers, Himalayan J., 1, 10–29, 1929.
O’Connor, J. E. and Costa, J. E.: The world’s largest floods, past andpresent – Their causes and magnitudes, US Geological SurveyCircular, 1254, 1–13, 2004.
Peng, M. and Zhang, L. M.: Breaching parameters of landslidedams, Landslides, 9, 13–31, 2012.
Schneider, J. F.: Seismically reactivated Hattian slide in Kashmir,Northern Pakistan, J. Seismol., 13, 387–398, 2009.
Shang, Y., Yang, Z., Li, L., Liu, D., Liao, Q., and Wang, Y.: A super-large landslide in Tibet in 2000: background, occurrence, disas-ter, and origin, Geomorphology, 54, 225–243, 2003.
Shroder Jr., J. F.: Slope failure and denudation in the western Hi-malaya, Geomorphology, 26, 81–105, 1998.
Smart, G. M.: Sediment transport formula for steep channels, J. Hy-draul. Divisions – ASCE 110, 267–276, 1984.
Swanson, F. J., Oyagi, N., and Tominaga, M.: Landslide dams inJapan, in: Landslide dams: process, risk, and mitigation NewYork: American Society of Civil Engineers Special Publication,edited by: Schuster, R. L., No. 3, 273–378, 1986.
Walder, J. S. and O’Connor, J. E.: Methods for predicting peakdischarge of floods caused by failure of natural and constructedearthen dams, Water Resour. Res., 33, 2337–48, 1997.
Wang, G., Liu, F., Fu, X., and Li, T.: Simulation of dam breachdevelopment for emergency treatment of the Tangjiashan Quakelake in China, Sci. China Ser. E., 51, Supp. II, 82–94, 2008.
Xu, Q., Fan, X., Huang, R., and van Westen, C. J.: Landslide damstriggered by the Wenchuan earthquake, Sichuan Province, southwest China, Bull. Eng. Geol. Environ., 68, 373–386, 2009.
Xu, Q., Shang, Y., van Asch, T., Wang, S., Zhang, Z., and Dong,X.: Observations from the large, rapid Yigong rock slide-debrisavalanche, southeast Tibet, Can. Geotech. J., 49, 589–606, 2012.
Nat. Hazards Earth Syst. Sci., 12, 3031–3044, 2012 www.nat-hazards-earth-syst-sci.net/12/3031/2012/