Embed Size (px)
Citation preview
SLAC-PUB -938 9
Simulated X-Ray Absorption Spectroscopy on the Water Dimer
Amy Wung ERULF Program
University of California, Berkeley Stanford Linear Accelerator Center
Menlo Park, California
August 13,2002
Prepared in partial fulfillment of the requirements of the Office of Science, DOE Energy Research Undergraduate Laboratory Fellowship or DOE Community College Institute of Science and Technology Program under the direction of Anders Nilsson in the Stanford Synchrotron Radiation Laboratory at the Stanford Linear Accelerator Center.
Work supported in part by the Departnient of Energy contract DE-AC03-76SF0051.5.
Abstract
Simulated X-Ray Absorption Spectroscopy on the Water Dimer. AMY WUNG (UC Berkeley, Berkeley, CA, 94704) ANDERS NILSSON (Stanford Linear Accelerator Center, Menlo Park, CA 94025
The ability of an individual H20 molecule to form multiple hydrogen bonds with neighboring molecules makes it an ideal substance for the study of hydrogen bonding. X- ray absorption spectroscopy ( U S ) can be used to study what intermolecular structures the hydrogen-bonded water molecules form. XAS excites core electrons from the oxygen 1 s atomic orbital to an unoccupied orbital. The resulting absorption spectrum shows the' energy levels of the unoccupied orbitals, which in turn is dependent on the intermolecular structure of the H2O system. Previous studies using molecular dynamics computer simulations have concluded that the intermolecular structure of liquid water is a distorted tetrahedron. Yet x-ray absorption spectra show discrepancies between liquid water and ice Ih, which is already known to have a rigid tetrahedral structure. The research group, which is based in the University of Sweden in Stockholm and the Stanford Synchrotron Radiation Laboratory at the Stanford Linear Accelerator Center, has studied the possible presence of broken hydrogen bonds in the liquid water intermolecular structure to explain these deviations. Computer simulations are used to construct theoretical absorption spectra for models of liquid water including broken hydrogen bonds. Creating such models requires controlling variables. The simplest method of isolating individual variables, such as hydrogen bond length and angles, is to study the water dimer. Here, the water dimer is used to study how the absorption spectra change with the way the water molecules are positioned and oriented relative to each other.
Table of Contents
Abstract
Introduction
Methods and Materials
Results
Discussion and Conclusions
Acknowledgements
References
Figures
... 111.
1.
4.
5.
6.
10.
12.
13.
.. 11
1
Introduction
Liquid water is one of the most important and abundant resources on our planet.
Yet its molecular structure is strangely elusive to study. It is known that hydrogen bonds
(H bonds) can be formed between a hydrogen atom and the lone electron pairs on an
oxygen atom of a neighboring water molecule. Since oxygen is more electronegative
than hydrogen, the hydrogen atoms have a slight positive charge that attracts them to the
lone pairs of oxygen atoms on neighboring H20 molecules. This attraction is what
creates the H bond. That still leaves the question of what intermolecular structure the H-
bonded H20 molecules form. For liquid water, it has been difficult to analyze
experimental data that might answer this question.
In contrast to liquid water, interpreting data from X-ray and neutron diffraction on
ice is much easier to interpret. This is because ice has a rigid, periodic crystal structure.
In particular, the intermolecular structure of ice Ih, a common form of ice as shown in
Figure 1, has been successfully analyzed already. Diffraction techniques have discovered
that ice Ih forms a rigid tetrahedral arrangement bonded together by H bonds. As shown
in Figure 2, the tetrahedron has a central H2O molecule with four H bonds. Two H bonds
connect the hydrogen atoms to oxygen atoms of neighboring molecules. In addition, the
oxygen atom of the central H20 molecule has two more H bonds, connecting the two lone
pairs to hydrogen atoms on two neighboring H20 molecules (Myneni et al., 2002).
Data from diffraction techniques used on liquid water is much more difficult to
interpret than for ice. This is partially because of the liquid water’s fluidity, unlike the
rigid crystal structure of ice. Also, problems arise due to the fact that in liquid water H
bonds are constantly broken and reformed. The time scale for this rearrangement is on
1
the order of a picosecond. Thus, liquid water is composed of many different
configurations simultaneously. Experimentalists were able to determine that the average
distance is 2.85 f 0.5 A' between oxygen atoms on neighboring H20 molecules
connected by an H bond (Wilson et al., 2002). However, these experiments were still
unable to determine the number of H bonds on each liquid water molecule. Based upon
computer simulations, it was concluded that liquid water had a distorted tetrahedral
structure, similar to ice Ih (Chaplin, 2002).
Now, with the development of third generation synchrotron radiation laboratories,
high-energy radiation is available to begin a new approach to the study of liquid water
structure. This research group, which is based at the University of Sweden in Stockholm
and at the Stanford Synchrotron Radiation Laboratory, has used X-ray absorption
spectroscopy ( U S ) to probe the unoccupied molecular orbitals of liquid water. This
technique uses X-rays to excite the oxygen 1 s core electrons into unoccupied molecular
orbitals. Since the presence of H bonds has a strong influence on the energy levels of
molecular orbitals, the absorption spectra are dependent on intermolecular structures
(Myneni et al., 2002).
The results of such testing have shown that there are notable differences between
the absorption spectrum for ice Ih and that of liquid water. This has led to the hypothesis
that these differences are a result of a fairly large fraction of liquid water molecules that
have broken H bonds. These molecules with broken H bonds would thus not correspond
to the distorted tetrahedral structure (Myneni et al., 2002). To test this hypothesis, the
group has used Density Functional Theory (DFT) to compute theoretical absorption
spectra for different intermolecular structure models containing broken H bonds
2
(Cavalleri, 2002a). Ultimately, the group would like to create a structure whose
theoretical absorption spectrum more closely matches the experimental absorption
spectra of liquid water.
It is a challenging task to compute theoretical spectra, considering the many
variables that must be controlled and the many intermolecular interactions that must be
taken into account. Systems that have been studied with DFT normally contain thirty to
forty H20 molecules, making it even harder to keep track of single variables. This
portion of the research instead uses the water dimer, the simplest H bonded configuration.
The water dimer consists of two H20 molecules connected by a H bond. The molecule
that contains the hydrogen atom in the H bond will be referred to as the donor molecule,
since it has donated positive charge to the bond. Conversely, the molecule that contains
the oxygen atom in the H bond is referred to as the acceptor molecule (Myneni et al.,
2002). The simplicity of this model makes it more efficient to study the direct effects of
changing the molecules’ relative positions and orientations.
Ultimately, the study of H20 intermolecular structure is a study of H bonds. H
bonds form the essential building blocks of our universe, binding together water
molecules as well as the double helix in our DNA. H bonds explain unique phenomena,
such as surface tension and the global water cycle (Wilson et al., 2002). Thus this
research has applications in fields such as biology, chemistry, physics, and environmental
science. Unlike hydrogen fluoride and other substances that are also capable of forming
H bonds, H20 has the unique property of being able to form multiple H bonds on a single
molecule. This fact, as well as its abundance, makes water an ideal substance for the
study of H bonds.
3
Materials and Methods
Calculating the theoretical absorption spectra was preceded by first
constructing a model of the water dimer. The first model was the optimized geometry for
a water dimer, which had been previously calculated using DFT by the group (Cavalleri,
2002b). Using the graphics program Molden, angles and distances could be
systematically varied (Schaftenaar, 2002). Three variables were isolated: the length of
the H bond, the O-H ... 0 angle, and the dihedral angle. The dihedral angle is defined to be
the angle between the planes of the water molecule. The dihedral angle of the optimal
configuration is referred to here as the normal dihedral angle. The length of the H bond
is defined as the distance between the center of the oxygen atom and the center of the
hydrogen atom within the H bond. For the optimal water dimer geometry, this distance is
1.93 Angstroms. The O-H ... 0 angle is defined as the angle formed by the two oxygen
atoms and the hydrogen atom within the H bond. This angle is 171" in the optimal
geometry. This angle was varied in two situations: one where the H bond length was
kept constant, and one where the 0 0 distance was kept constant. The optimal
configuration and these three variables are depicted in Figure 3.
When changing one variable, as many values of the optimized geometry as
possible are kept constant. This way, their individual effects are kept isolated from each
other. Unfortunately it was not possible to keep the dihedral angle constant while
changing the O-H ... 0 angle due to the specifics of Molden. Nonetheless, the effect of
this error will be negligible, for reasons explained later. After computing absorption
spectra for several different geometric configurations of the water dimer, it is possible to
4
study the effects of each variable separately. It is also possible to compare and contrast
the effects of changing each variable.
With Molden, a set of Cartesian coordinates for the molecules could be generated.
The coordinates were inserted into an input file. The computer could then compute
absorption spectra from the input file using DFT techniques. Since the absorption spectra
contained only discrete impulses of oscillator strength as a function of energy,
convolution techniques were used to fit Gaussian curves to each impulse, creating a
smooth curve. The convoluted curves more closely simulate experimental spectra, which
are affected by finite energy resolution as well as high density of states for certain energy
regions. Once the newly convoluted data files had been generated, the graphics program
gnuplot (Woo, 2002) was used to plot the absorption spectra for varying distances and
angles. For each set of Cartesian coordinates, the absorption spectrum for an excited
acceptor molecule was calculated, as well as that of the excited donor molecule.
The computer, using DFT techniques again, can also output the ground state
energy (no core hole) of any given geometrical configuration of the water dimer. It is
also possible to calculate the ground state energy of each individual water molecule, with
the same geometry as the water dimer’s acceptor and donor molecule respectively. By
subtracting the individual molecules’ energies from the total dimer energy, it is possible
to calculate the strength, or energy, of the H bond. The H bond strength was thus
calculated for several H lengths and 0-H ... 0 angles.
.
Results
Figure 4 shows the absorption spectra calculated for the free H20 molecule
(calculated twice, using the geometry of the acceptor and donor molecules in the
5
optimized dimer), the acceptor molecule, and the donor molecule in the optimized dimer.
Figures 5-9 show the absorption spectra of the acceptor and donor molecules calculated
from DFT for varying distances and angles. The primary absorption data are shown as
green impulses, scaled vertically by a factor of 5000 in order to be plotted together with
the convoluted data. All the spectra have the same scale on the x and y-axis, as shown on
the bottom graph of every page. The chosen range of the energy axis focuses on the
important near-edge region where most changes in the spectrum are observed.
Figure 5 shows the absorption spectra of the excited acceptor molecule for
varying the H bond length and the 0-H ... 0 angle for both a constant H bond length and a
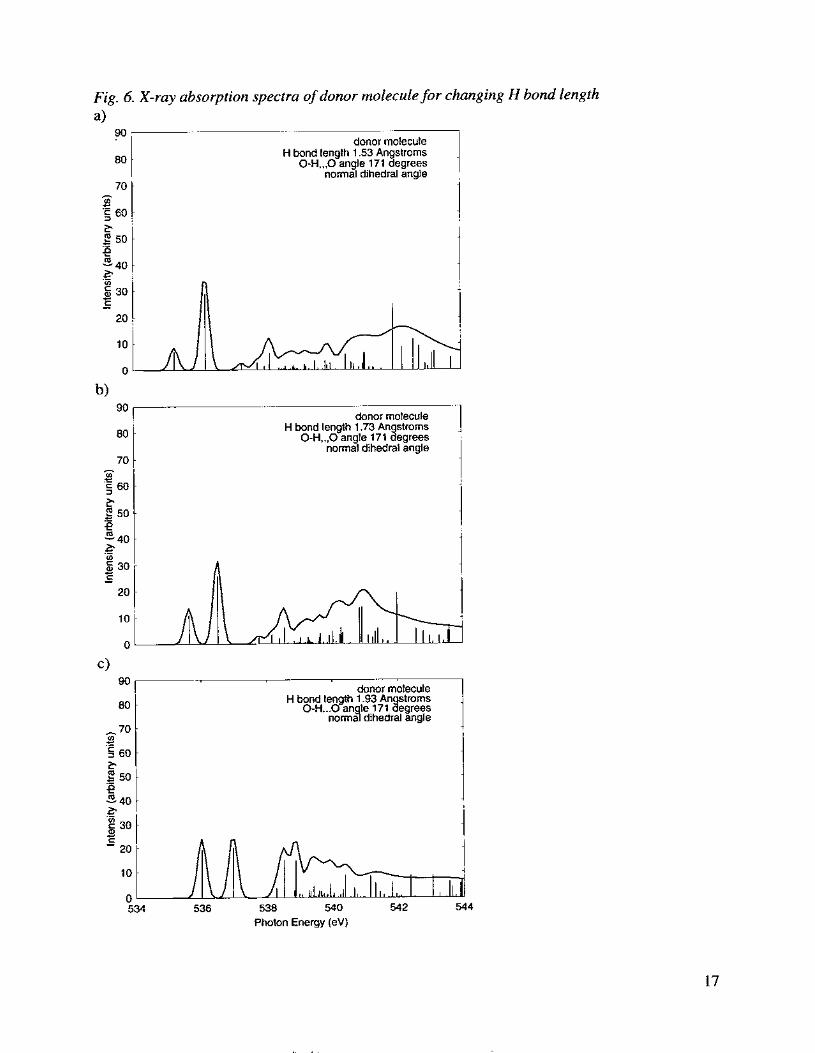
constant 0 0 distance. Figure 6 shows the absorption spectra of the excited donor
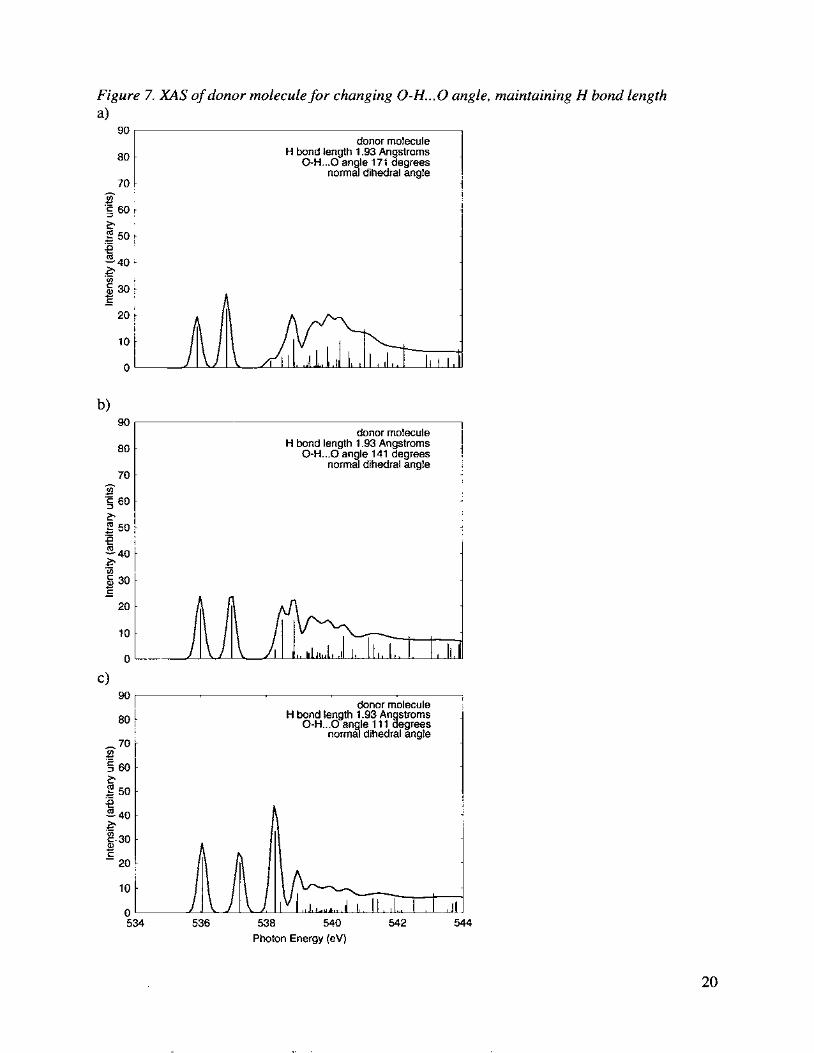
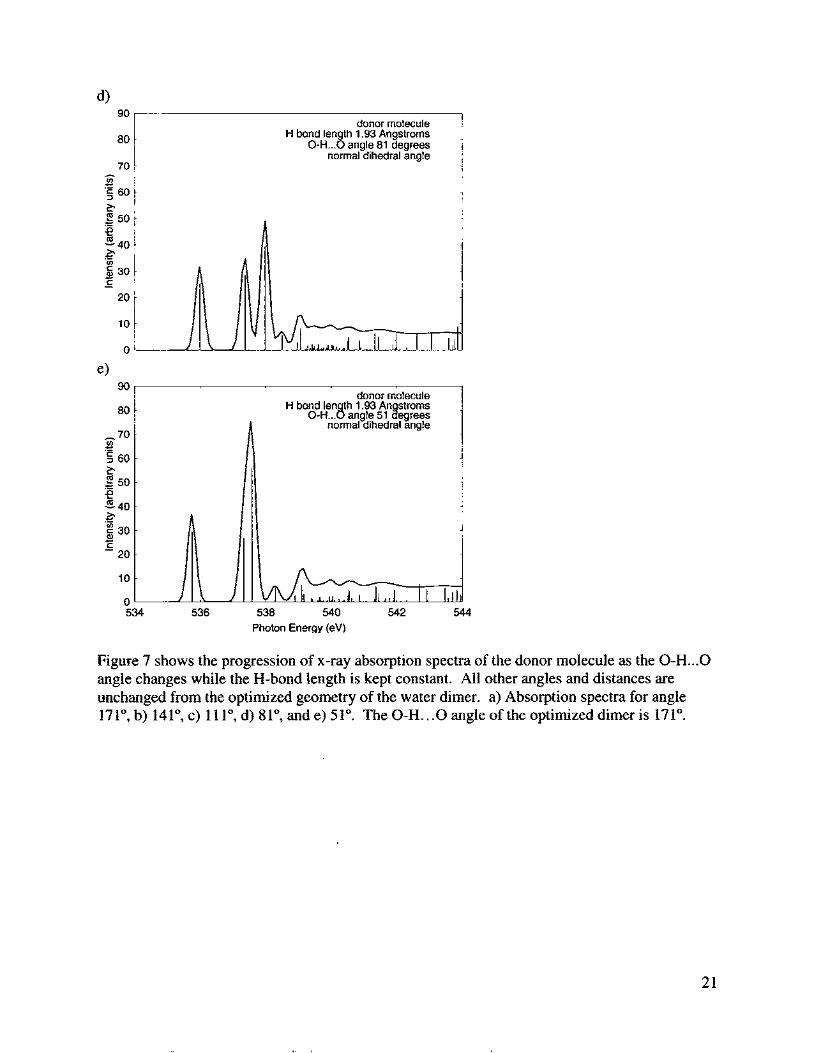
molecule for varying the H bond length. Figure 7 shows the donor molecule absorption
spectra for varying the 0-H ... 0 angle, while maintaining a constant H bond length.
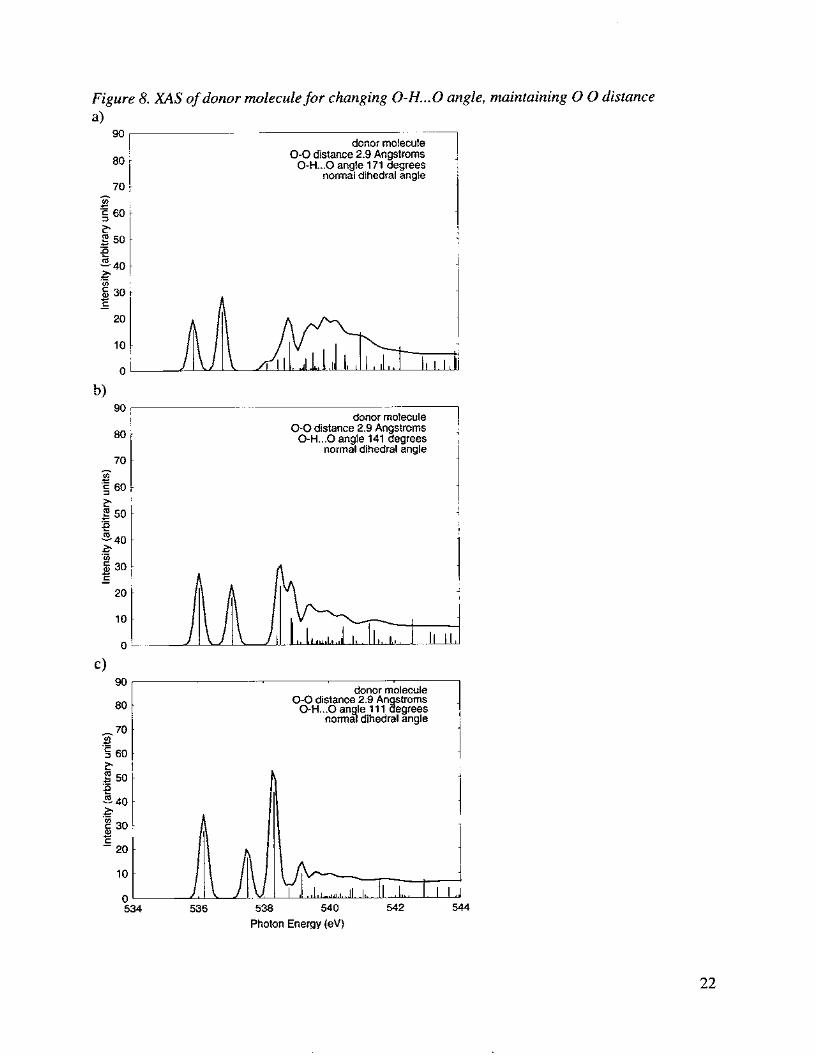
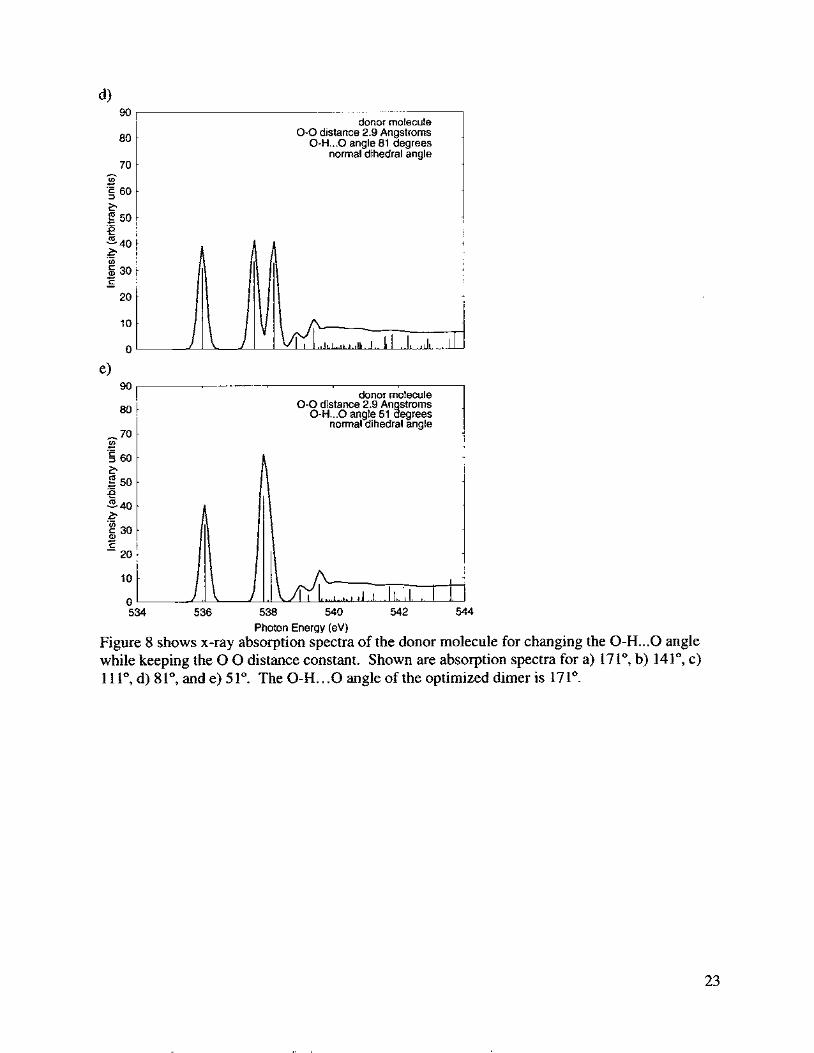
Figure 8 shows the same, except the 0-H ... 0 angle was varied while the 0 0 distance
was kept constant. Figure 9 shows the spectra of the excited acceptor and donor
molecule for varying the dihedral angle. Figure 10 shows the calculations of the H bond
strength for various geometries.
Discussions and Conclusions
Free v. H bonded molecules Figure 4 shows the effect of H bonding on the orbital structure of the donor
molecule in the water dimer. The two geometries of the free molecule show nearly
identical absorption spectra, with two peaks at approximately the same energy levels.
While the acceptor molecule shows two strong peaks and some weak additional structure
at higher energies like the free molecules, the donor molecule shows a broad band-like
intensity around 540 eV. Conceptually, these deviations between the acceptor molecule
6
and the donor molecule spectra are expected because absorption spectra probe
unoccupied orbitals. Since the oxygen lone pairs that participate in the H bond make up
occupied orbitals, the presence of an H bond would primarily affect these occupied
orbitals. In contrast, the unoccupied antibonding molecular orbitals that form between
the oxygen and hydrogen atoms on the donor molecule are affected by the presence of an
H bond. Thus the absorption spectrum of the donor molecule should reflect the presence
of an H bond, but the spectrum of the acceptor molecule should not (Cavalleri et al.,
2002).
This indicates that the absorption spectrum for the acceptor molecule in the
optimized dimer will be similar to the absorption spectrum for a free H2O molecule,
which is also unaffected by H bonding. The absorption spectrum of the donor molecule,
on the other hand, is not expected to be similar to the spectrum of a free H20 molecule.
Figure 4 confirms these expectations, because the acceptor and free molecule spectra
both have the same basic structure of two peaks at approximately the same energy level.
The absorption spectrum of the donor molecule shows two peaks as well as a band of
higher energies, which is very different from the shape of the free molecule spectrum.
Acceptor v. donor The spectra of the acceptor and donor molecules also behave differently as the H
bond breaks. The H bond breaks when lengthening the H bond, because the greater
distance weakens the electrostatic interactions between the two molecules. As shown in
Figure 5 , breaking the H bond causes the acceptor molecule’s peak energy levels to
decrease slightly. This shift with decreasing confinement of the molecules is expected,
from the particle in a box analogy. In contrast to the acceptor molecule spectra, the donor
molecule spectra in Figure 6 display much more drastic changes when the H bond is
7
broken, notably the appearance and then disappearance of a third peak (detailed
discussion later). These changes in the spectra indicate changes in the unoccupied
molecular orbitals of the donor molecule. Therefore following the changes in the donor
molecule absorption spectra can accurately monitor changes in the H-bonding in the
water dimer.
A similar situation appears when the O-H ... 0 angle is decreased. Changing the
angle can be seen as breaking the H bond, just like lengthening the H bond. This is
because the oxygen lone pairs, which are more or less fixed in position by the acceptor
molecule’s repulsive O-H bonds, are being rotated away from the hydrogen atom. This
will also decrease the electrostatic interactions, thus breaking the H bond. As a result, it
is reasonable to expect similar changes in the absorption spectra from changing O-H ... 0
angle as from lengthening the H bond. Figures 5, 7, and 8 confirm this reasoning.
Drastic changes involving a third peak can be seen in the donor molecule in Figures 7 and
8, whereas the acceptor molecule only shows slight shifts to lower energies in Figure 5.
From these observations, it can be concluded that breaking the H bond does not
affect the unoccupied molecular orbitals, and thus the absorption spectra, of the acceptor
molecule. This conclusion correlates with past studies of bulk water. These studies
calculated theoretical absorption using systems of thirty to forty H20 molecules
(Cavalleri, 2002). In some systems, the H bond was broken at the hydrogen site of the
central molecule in the distorted tetrahedron. In other systems the H bond was broken at
the oxygen site of the central molecule in the distorted tetrahedron. These two
geometrical configurations clearly represent the same difference that is seen between the
acceptor and donor molecules of the dimer. The absorption spectra for broken bonds at
8
., .
the hydrogen site were not significantly different from the absorption spectra of a system
with no broken H bonds. The absorption spectra for broken bonds at the oxygen site did
show significant differences (Myneni et al, 2002). Therefore breaking an H bond on the
oxygen site could not explain why the absorption spectra of liquid water are different
from the absorption spectra of ice. Breaking an H bond on the hydrogen site, on the other
hand, might be able to provide such an explanation. The focus can now be shifted to the
donor molecule, and how the donor molecule spectra change with the individual
variables.
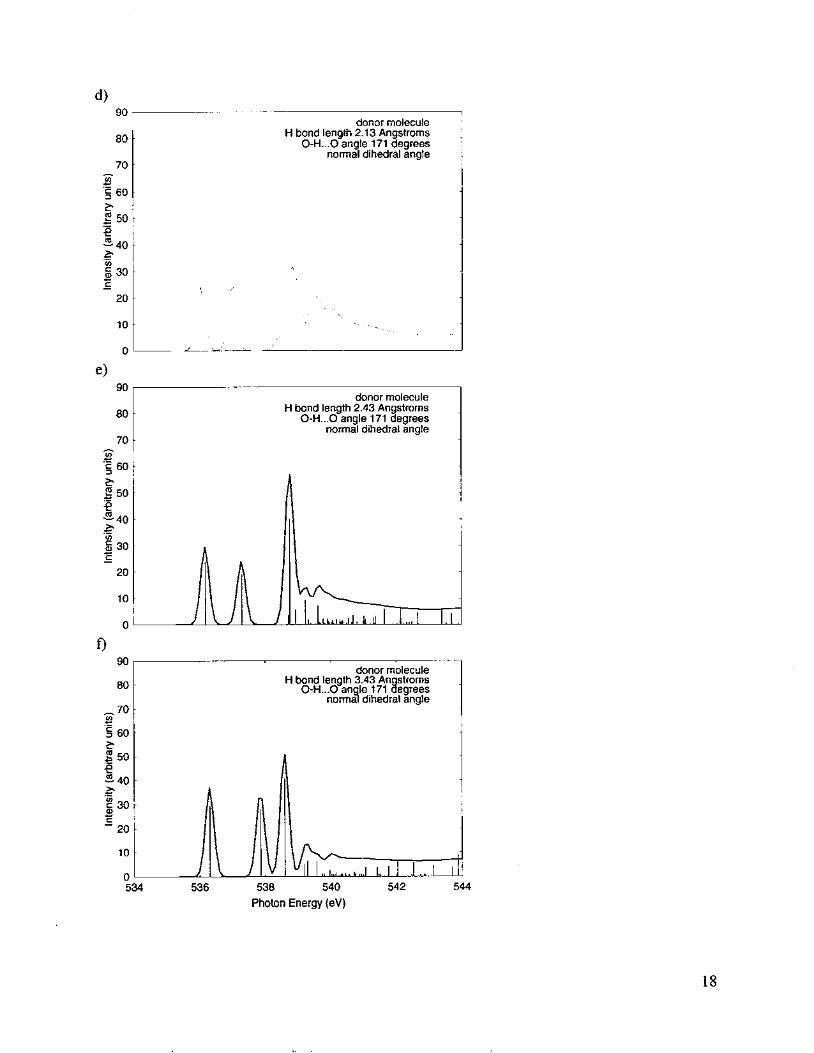
H bond length and 0-H. ..O angle As explained previously, lengthening the H bond distance and decreasing the H
bond angle both effectively break the H bond. Figures 6, 7, and 8 confirm this, showing
similar changes in the absorption spectra as the H bond lengthens and in both cases of the
0-H ... 0 angle decreasing. Figures 7 and 8 show that there seem to be little difference
between the two cases of changing 0-H.. .O angle, and so the angle measurements will
only be referred to once. At first, breaking the H bond causes a third peak to appear.
This peak dominates over the first two peaks (H bond length 2.4381, 0-H.. .O angle 11 lo,
see Figure 6c, 7c, and 8c) before merging into the second peak (H bond length 3.4381, 0-
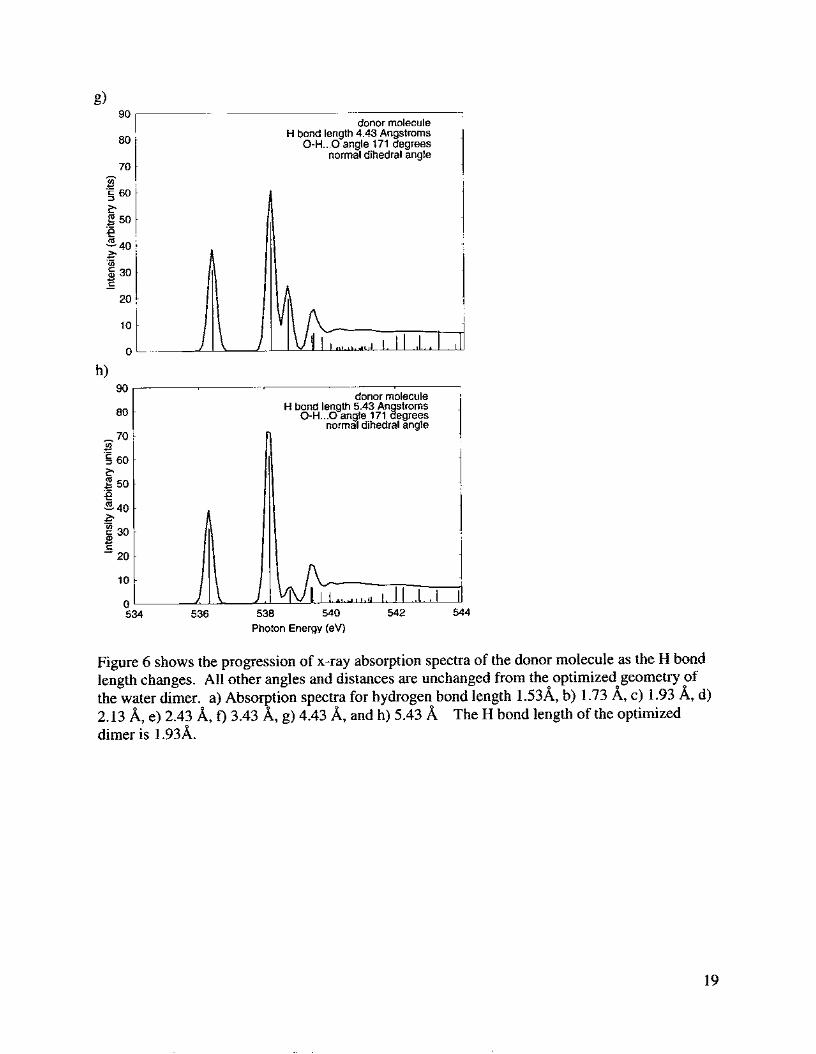
H.. .O angle 8 I", see Figure 6e, 7d, and 8d). In the end, there are once again two peaks
(H bond length 5.43 81, 0-H.. .O angle 51", see Figure 6f, 7f, and 80, and the shape of the
spectrum converges to the shape of the acceptor molecule/free molecule absorption
spectra. The similarity of the spectra for the molecules at large distances and the free
molecule is expected, because the acceptor molecule spectra represents a molecule which
is unaffected by the presence of an H bond. As mentioned before, breaking the H bond
affects the unoccupied molecular orbitals of the donor molecule. It can also be observed
9
that these effects are present for H bond lengths of 5 Angstroms even. The graphs shown
in Figure 6 are insufficient to quantify an exact length at which the H bond breaks.
H bond strength It is instructive to plot the H bond strength as a function of distances and angles as
shown in Figure 10. The graphs are one-dimensional slices of a multi-dimensional plot
that would show H bond strength as a function of all possible positions and orientations.
The graphs in Figure 10 give another idea of the range of distances over which the H
bond is present. Yet it still seems difficult to quantify an exact point at which the H bond
is no longer present from this graph.
The intermolecular interactions which created these potential curves are repulsion,
electrostatic interactions, and charge transfer. The graphs of Figure 10 provide
opportunities to quantify the effects charge transfer. More calculations will follow the
ones presented here to address this issue.
Dihedral angle It can be reasoned that changing the dihedral angle in either direction will have
little effect on the absorption spectraj because the rotation will not change the position of
the hydrogen atom relative to the two lone pairs on the oxygen atom. This indicates that
the relative positions of the oxygen lone pairs and the hydrogen atom would have to be
changed in order to create changes in the H bond and the absorption spectra. This is true
for both acceptor and donor molecules. As expected, changing the dihedral angle in
either direction produces almost no change in the absorption spectra in Figure 9. From
this, it can be reasoned that changing the dihedral angle while changing the 0-H ... 0 angle
will have negligible effects on the absorption spectra of the acceptor and donor
molecules.
10
Acknowledgements I am very grateful for the United States Department of Energy Office of Science
for providing the ERULF program. The experience of being at the Stanford Linear
Accelerator Center, participating in a research group, and meeting undergraduate science
majors from across the country has been extremely rewarding. Also I am thankful that
the Stanford Linear Accelerator has been so accommodating in providing such an
invaluable opportunity.
I would like to extend my gratitude to my mentor Professor Anders Nilsson for
taking me into his group and giving me the opportunity to witness and experience for
myself the world of research. I would also like to thank the entire research group,
especially Philippe Wernet, Matteo Cavelleri, Klas Anderson, and Lars Naslund, for the
constant help and encouragement.
Lastly, special thanks to the directors of the ERULF program here at Stanford: Helen
Quinn, Erin Smith, and Sekazi Mtingwa. Without their leadership and enthusiasm, this program
would not have been possible.
11
References
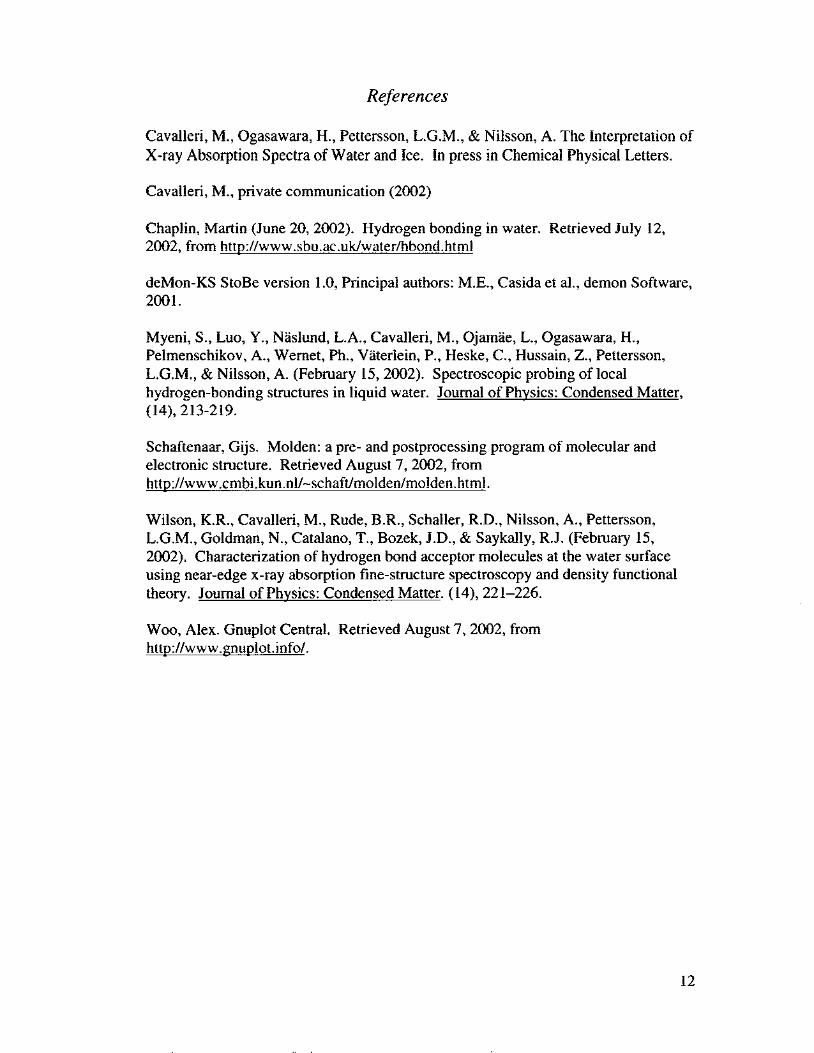
Cavalleri, M., Ogasawara, H., Pettersson, L.G.M., & Nilsson, A. The Interpretation of X-ray Absorption Spectra of Water and Ice. In press in Chemical Physical Letters.
Cavalleri, M., private communication (2002)
Chaplin, Martin (June 20, 2002). Hydrogen bonding in water. Retrieved July 12, 2002, from http://www.sbu.ac.ukwater/hbond.html
deMon-KS StoBe version 1.0, Principal authors: M.E., Casida et al., demon Software, 2001.
Myeni, S., Luo, Y., Naslund, L.A., Cavalleri, M., Ojamae, L., Ogasawara, H., Pelmenschikov, A., Wernet, Ph., Vaterlein, P., Heske, C., Hussain, Z., Pettersson, L.G.M., & Nilsson, A. (February 15,2002). Spectroscopic probing of local hydrogen-bonding structures in liquid water. Journal of Physics: Condensed Matter, (14), 213-219.
Schaftenaar, Gijs. Molden: a pre- and postprocessing program of molecular and electronic structure. Retrieved August 7, 2002, from http://www .cmbi.kun.nl/-schaft/molden/molden.html.
Wilson, K.R., Cavalleri, M., Rude, B.R., Schaller, R.D., Nilsson, A., Pettersson, L.G.M., Goldman, N., Catalano, T., Bozek, J.D., & Saykally, R.J. (February 15, 2002). Characterization of hydrogen bond acceptor molecules at the water surface using near-edge x-ray absorption fine-structure spectroscopy and density functional theory. Journal of Physics: Condensed Matter. (14), 221-226.
Woo, Alex. Gnuplot Central. Retrieved August 7,2002, from http://www.gnuplot.info/.
12
Figures
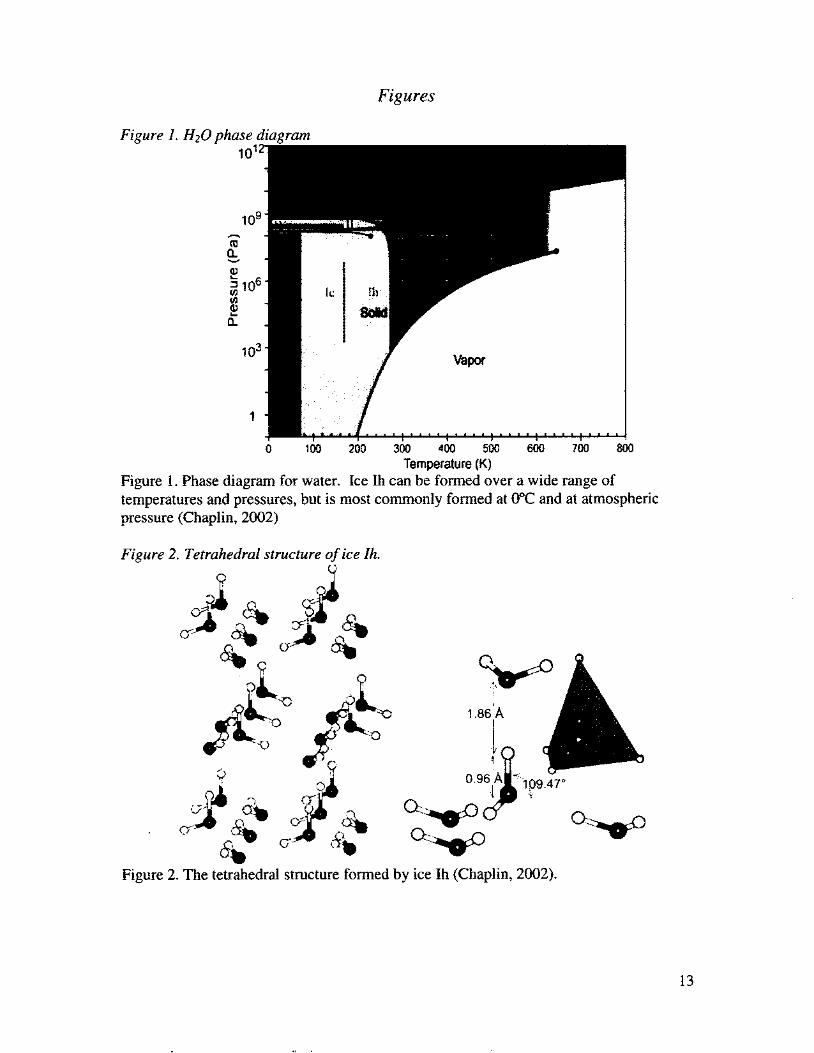
Figure 1. H20 I
Figure 1. Phase
jhase diagram
0 100 200 300 400 500 600 700 E Temperature (K)
diagram for water. Ice Ih can be formed over a wide range of
0
temperatures and pressures, but is most commonly formed at 0°C and at atmospheric pressure (Chaplin, 2002)
Figure 2, Tetrahedral structure of ice Ih. h Y
Figure 2. The tetrahedral structure formed by ice Ih (Chaplin, 2002).
13
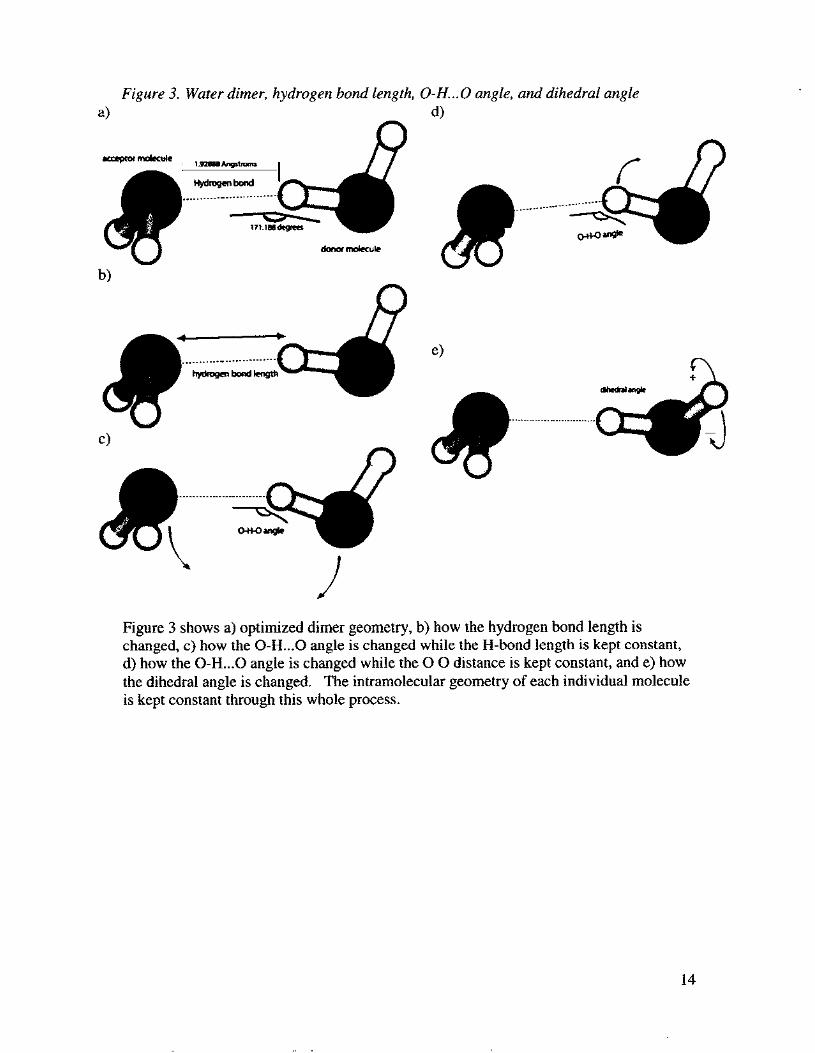
Figure 3. a)
Water dimer, hydrogen bond length,
.... .......-...............
0 - H . ..O angle, d)
and dihedral angle
..............
Figure 3 shows a) optimized dimer geometry, b) how the hydrogen bond length is changed, c) how the 0-H ... 0 angle is changed while the H-bond length is kept constant, d) how the 0-H ... 0 angle is changed while the 0 0 distance is kept constant, and e) how the dihedral angle is changed. The intramolecular geometry of each individual molecule is kept constant through this whole process.
14
90
80
70
5 60 P e 50
-40 .- .E?
5 30
20
10
v) c .-
2 v) - C -
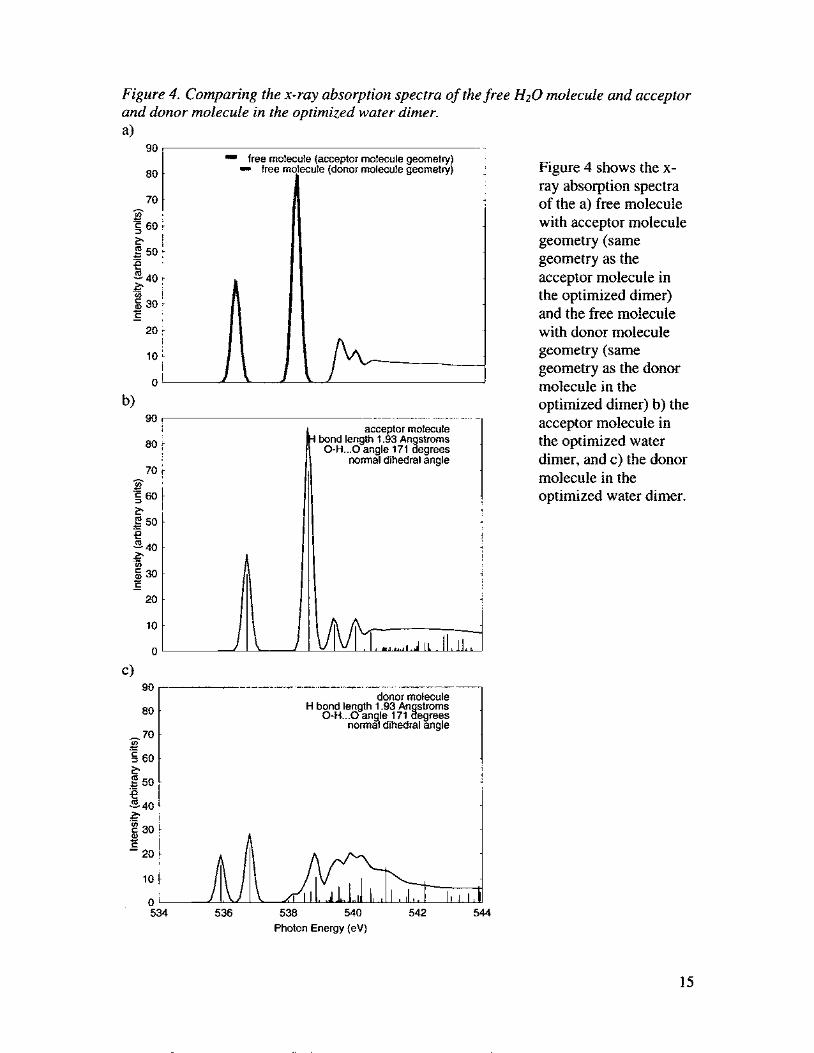
Figure 4. Comparing the x-ray absorption spectra of the free H20 molecule and acceptor and donor molecule in the optimized water dimer.
-
-
-
-
-
-
-
-
-
0-
90
80
70
90
80
-70 v)
C e .- 3 60 P 50
e g 4 0
.-
v) c .- 5 60
donor molecule H bond length 1.93 An stroms
0-H ... 0 an le 171 gegrees normi dihedral angle
-
-
-
-
-
P c 2 50
- 40
5 30
2 .- b v)
c C -
Figure 4 shows the x- ray absorption spectra of the a) free molecule with acceptor molecule geometry (same geometry as the acceptor molecule in the optimized dimer) and the free molecule with donor molecule geometry (same geometry as the donor molecule in the optimized dimer) b) the
acceptor molecule bond length 1.93 Angstroms 0-H ... 0 angle 171 degrees
normal dihedral angle
acceptor molecule in the optimized water dimer, and c) the donor molecule in the optimized water dimer.
" 534 536 538 540 542 544
Photon Energy (eV)
15
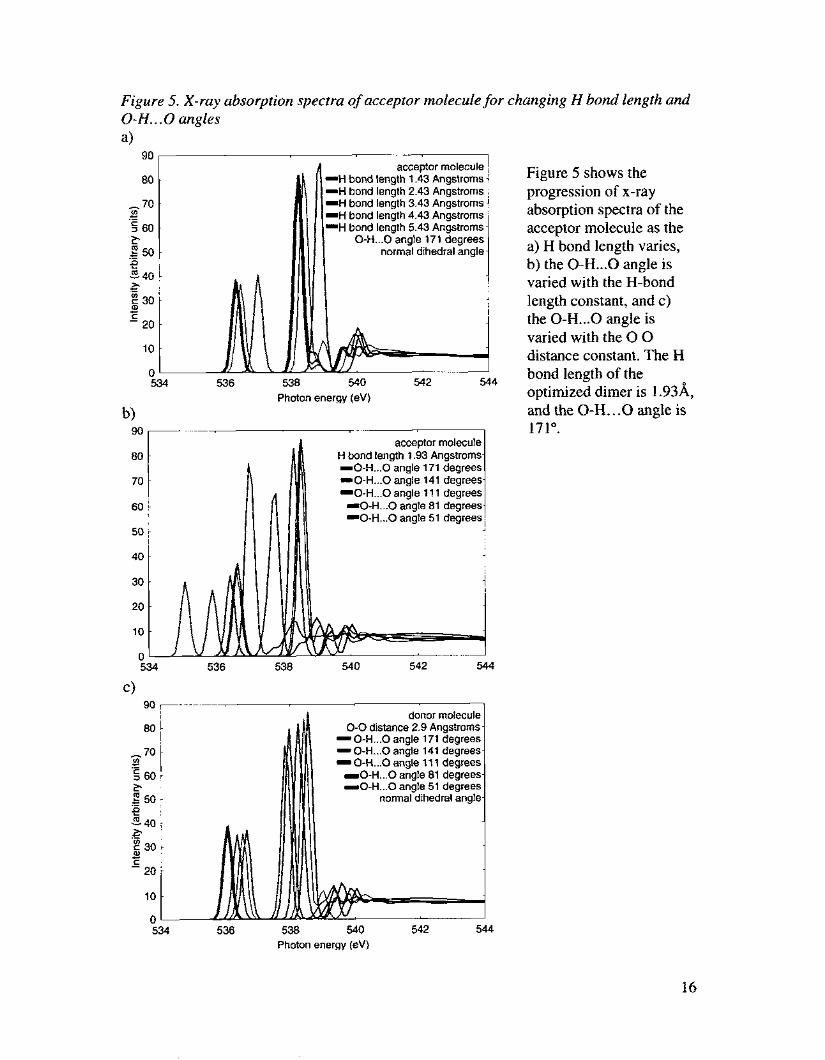
Figure 5. X-ray absorption spectra of acceptor molecule for changing H bond length and 0- H . . . 0 angles a)
4 Photon energy (eV)
-0-H...O angle 171 degree! -0-H...O angle 141 degree! -0-H...O angle 11 1 degree! -0-H...O angle 81 degree! -0-H...O angle 51 degree!
4
c) 90
80 0-0 distance 2.9 Angstroms -0-H...O angle 171 degrees - 0-H ... 0 angle 141 degrees - 0-H ... 0 angle 11 1 degrees
-0-H ... 0 angle 81 degrees IO-H ... 0 angle 51 degrees
50 normal dihedral angle
70 .- 3 C 3 60 i?
$ s 40 .- L.
30
- 20
10
0 534 536 538 540 542 544
.3d C
Photon energy (eV)
Figure 5 shows the progression of x-ray absorption spectra of the acceptor molecule as the a) H bond length varies, b) the 0-H ... 0 angle is varied with the H-bond length constant, and c) the 0-H ... 0 angle is varied with the 0 0 distance constant. The H bond length of the optimized dimer is 1.93A, and the 0-H.. .O angle is 17 1".
16
80
70
donor molecule H bond length 1.53 Angstroms
0-H,,,O angle 171 degrees normal dihedral angle
-
-
R1 -40
30
20
10
.- 4% v)
c K -
0 -
donor molecule H bond length 1.93 An stroms
0-H ... 0 an le 171 8egrees norma8 dihedral angle
-
- 7
~
-
90
80
70 h
c v) .- 5 6 0 - 2 - 2 50
-40 2
donor molecule H bond length 1.73 Angstroms
- 0-H,,,O angle 171 degrees noma1 dihedral angle
-
-
-
- 534 536 538 540 542 544
Photon Energy (eV)
90
80
-70 v) c .- 5 60 50
840
I 30
6 .-
.- 4%
17
-
-
-
-
-
-
s c - 20 10
n
-
-
4 90
80
70
5 60 ?? 2" 50 - 40 30
20
10
0
h
c v) .-
.- 2 .- 4% v)
c C -
90
80
70
5 60 2 2" 50 -40
5 30
20
10
0
- c v) .-
2 .- 2. v)
e c -
donor molecule H bond length 2.13 Angstroms
0-H ... 0 angle 171 degrees normal dihedral angle
donor molecule H bond length 2.43 Angstroms
0-H ... 0 angle 171 degrees normal dihedral angle
-
-
-
-
-
-
-
-
n I ,
i
90
80
-70
5 60 2 2 50 g40
v) c .-
e .- 2.
E 30 - 20 e c
donor molecule H bond length 3.43 An stroms
0-H ... 0 an le 171 iegrees norm3 dihedral angle
-
~
-
-
-
-
-
0 534 536 538 540 542 544
Photon Energy (eV)
l o i
18
s ) 90
80
70 u) c .- 5 60 P c !! 50
-40
5 30
20
10
0
2 .- b In
e C -
h)
80
donor molecule H bond length 4.43 Angstroms
0-H ... 0 angle 171 degrees normal dihedral angle
donor molecule H bond length 5.43 An stroms
0-H ... 0 an le171 iegrees normi dihedral angle
-
-70 In c .- 5 60 P 6 50 z 540 .- b
5 30 - 20 e C
-
-
-
-
-
-
l o n L " 534 536 538 540 542 544
Photon Energy (eV)
Figure 6 shows the progression of x-ray absorption spectra of the donor molecule as the H bond length changes. All other angles and distances are unchanged from the optimized geometry of the water dimer. a) Absorption spectra for hydrogen bond length 1.53A, b) 1.73 A, c) 1.93 A, d) 2.13 A, e) 2.43 A, f) 3.43 A, g) 4.43 A, and h) 5.43 8, The H bond length of the optimized dimer is 1.9381.
19
80
70
donor molecule H bond length 1.93 Angstroms
0-H ... 0 angle 171 degrees normal dihedral angle
-
-
2 g 50
- 40
5 30
20
10
0
2 .- b 0)
e C -
80
70
donor molecule H bond length 1.93 An stroms
0-H ... o an le.1113egrees normi?l dihedral angle
donor molecule H bond length 1.93 Angstroms
0-H ... 0 angle 141 degrees normal dihedral angle
-
-
2 g 50 g
40 .- b E. 30 - 20
10
0 534 536 538 540 542 544
Photon Energy (eV)
e C
20
80
70
.- b I 30
- 20 10
c
534
donor molecule H bond len th 1 93 Angstroms
0-H ... 8 angle 81 degrees normal dihedral angle
~
-
h, 536 538 540 542 544
'hoton Energy (eV)
Figure 7 shows the progression of x-ray absorption spectra of the donor molecule as the 0-H ... 0 angle changes while the H-bond length is kept constant. All other angles and distances are unchanged from the optimized geometry of the water dimer. a) Absorption spectra for angle 171", b) 141", c) 1 1 lo, d) 81", and e) 51". The 0-H.. .O angle of the optimized dimer is 171".
21
90
80
70
5 60 ?? g 50 -40
5 30
20
10
0
h
c ln .-
2 .- 2 ln
c C -
donor molecule 0-0 distance 2.9 Angstroms
0-H ... 0 angle 171 degrees normal dihedral angle
-
-
-
-
-
-
A - I
1 1 . 1 ,
0 534 536 538 540 542 544
Photon Energy (eV)
l o i
80
70
22
donor molecule 0-0 distance 2.9 Angstroms
0-H ... 0 angle 141 degrees normal dihedral angle
-
-
90
80
-70 .- 3 3 60
50 e m40 .- 2
5 30 - 20
C
$
c c
donor molecule 0-0 distance 2.9 An stroms
0-H ... o an le 1 1 1 8egrees normi dihedral angle
-
-
r
-
-
-
-
d) 90
80
70
5 60
c 50
- 40 5 30
20
10
0
h v) 4- .-
; .- L. v)
c r: -
I
e) 90
80
h 70 .- 3 5 60 2 2 50 p 5 4 0 .- a I 30 - 20
10
0
c C
f , 534 536 538 540 542 544
Photon Energy (eV) Figure 8 shows x-ray absorption spectra of the donor molecule for changing the 0-H ... 0 angle while keeping the 0 0 distance constant. Shown are absorption spectra for a) 17 lo, b) 141", c) 11 lo, d) 81", and e) 5 1". The 0-H.. .O angle of the optimized dimer is 17 1".
23
90
80
70
5 60 E? c !! 50
h
c v) .-
.- 2 40 .- 2.
s 30
20
10
0
v)
c c -
b) 90
80
h 70 .- 3 3 60 2 .- 6 50
.- 2. I 30
- 20 10
0
c
$40
c c
acceptor molecule - ' H bond length 1.93 Angstroms
0-H ... 0 angle 171 degrees - I dihedral angle -20 degrees
-normal dihedral angle - - dihedral angle 20 degrees
-
-
-
-
1
donor molecule H bond length 1.93 Angstroms
0-H ... 0 angle 171 degrees - dihedral angle -20 degrees -normal dihedral angle - dihedral angle 20 degrees
534 536 538 540 542 544 Photon energy (eV)
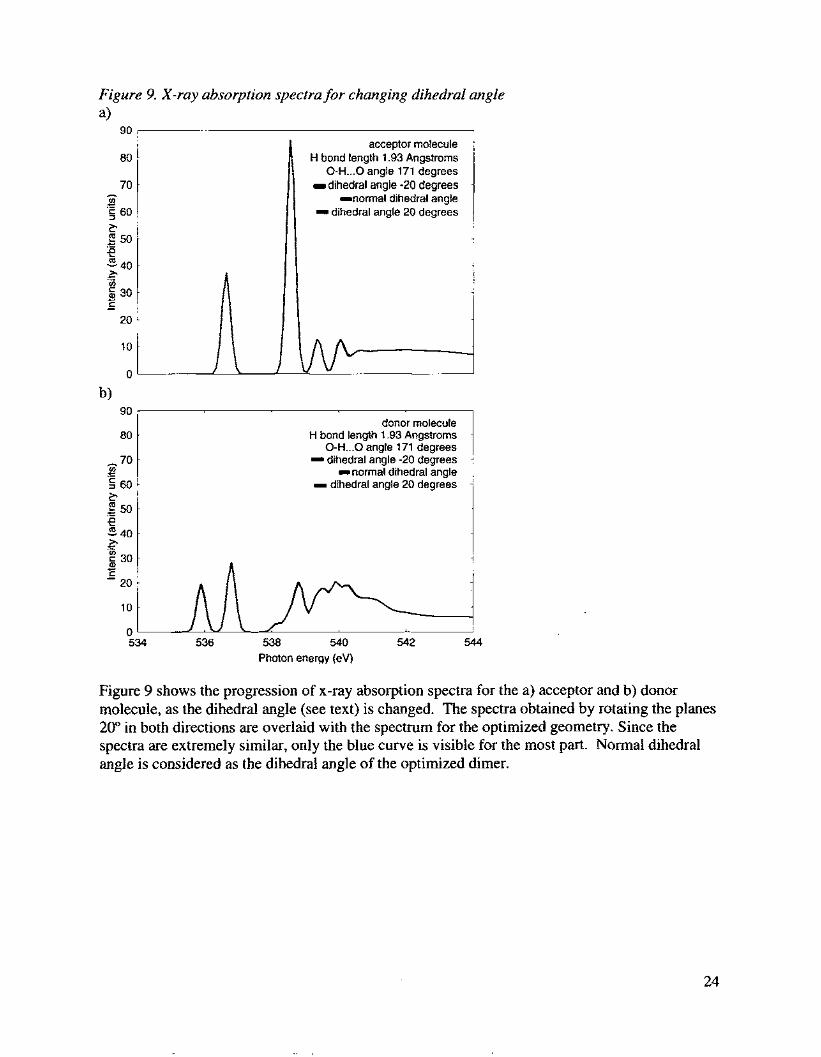
Figure 9 shows the progression of x-ray absorption spectra for the a) acceptor and b) donor molecule, as the dihedral angle (see text) is changed. The spectra obtained by rotating the planes 20" in both directions are overlaid with the spectrum for the optimized geometry. Since the spectra are extremely similar, only the blue curve is visible for the most part. Normal dihedral angle is considered as the dihedral angle of the optimized dimer.
24
1. ,
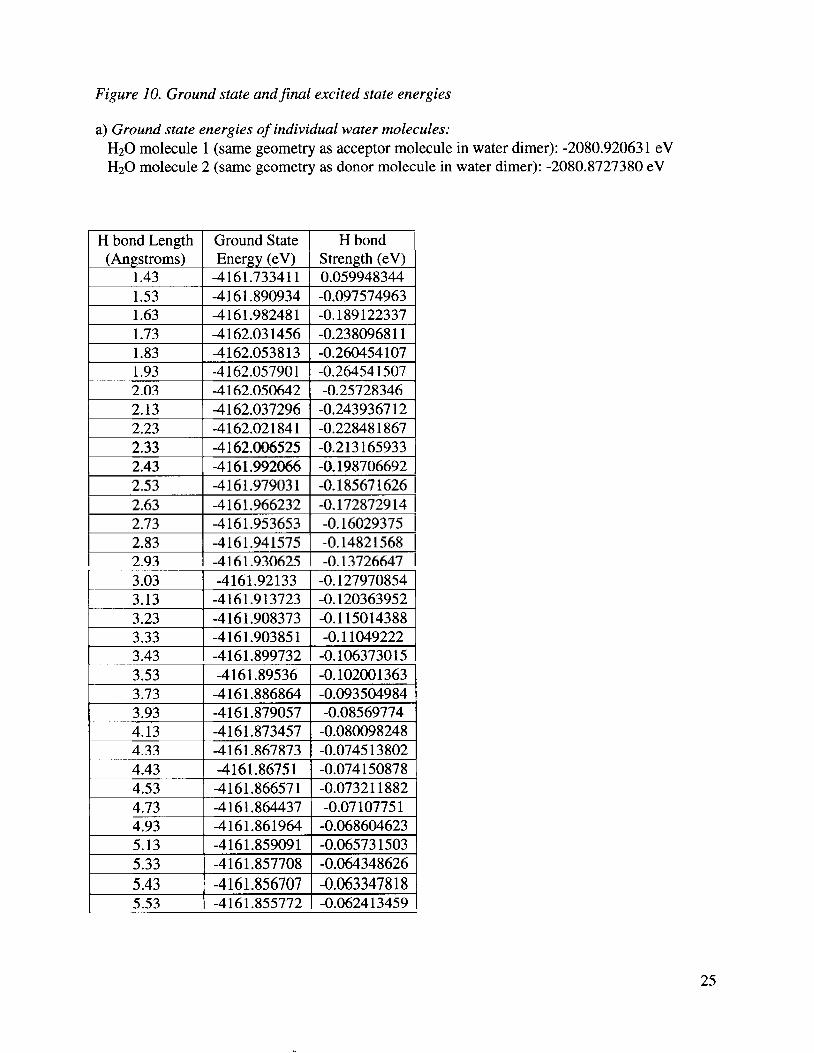
Figure IO. Ground state and final excited state energies
I HbondLength I Groundstate I H bond
a) Ground state energies of individual water molecules: H20 molecule 1 (same geometry as acceptor molecule in water dimer): -2080.92063 1 eV H20 molecule 2 (same geometry as donor molecule in water dimer): -2080.8727380 eV
(Angstroms) 1.43
Energy (eV) Strength (eV) -4161.73341 1 0.059948344
1.63 1.73
1.53 I -4161.890934 I -0.097574963 I -4161.982481 -0.189122337 -4162.03 1456 -0.23809681 1
1.83 1.93 2.03
-4162.0538 13 -0.260454107 -4 162.05790 1 -0.26454 1507 -4162.050642 -0.25728346
2.13 2.23
-4162.037296 -0.243936712 -4162.021841 -0.228481867
2.93
2.33 2.43
-4162.006525 -0.2 13 165933 -4 16 1.992066 -0.198706692
3.03 3.13
3.43 I -4161.899732 I-0.106373015 I
-4161.92133 -0.127970854 -4161.913723 -0.120363952
3.23 3.33
-4161.908373 -0.115014388 -4161.903851 -0.1 1049222
3.53 3.73
-4 16 1.89536 -0.10200 1363 -4161.886864 -0.093504984
3.93 4.13 4.33
5.53 I -4161.855772 1-0.062413459 I
-4161.879057 -0.08569774 -4 16 1.873457 -0.080098248 -4 16 1 -867873 -0.0745 13 802
25
4.43 4.53
-4 16 1.8675 1 -0.074 150878 -4161.86657 1 -0.07321 1882
4.73 4.93 5.13
-4161 364437 -0.07 10775 1 -4161.861964 -0.068604623 -4161 359091 -0.06573 1503
5.33 5.43
-4161.857708 -0.064348626 -4161.856707 -0.063347818
c) H bond strength for changing 0-H. . . 0 angle (maintaining H
179 175
bond length) in the water dimer I H bondLength I Ground State I H bond
-4162.054308 -0.26094853 -4162.056729 -0.263369772
- I (Angstroms) I Energy (eV) I Strength(eV) I
171 167
-4 162.05790 1 -0.26454 1 507 -4162.057766 -0.264407283
159 155
I 163 I -4162.055584 I -0.26222525 I -4162.05142 -0.258060618 -4162.045539 -0.252180305
15 1 147 143
-4162.038403 -0.245044289 -4 162.029976 -0.2366 17488 -4 162.01986 -0.2265009 17
139 135
-4 162.007428 -0.2 14069445 -4 16 1.992098 -0.19873927
111 107
-4161.806199 -0.012839657 -4161.751459 0.041899568
103 99
-4161.686065 0.10729412 -4161.605033 0.188326384
95
86 91
26
-4161.503693 0.289665841
-4 161.1688 1 0.624548804 -4161.37705 1 0.416308301
81 76
-4160.881648 0.91 1710609 -4160.487583 1.305776249
71 66 61
I
-4159.952395 1.840963665 -4 159.237 143 2.5562 15978 -4 158.284539 3.5088 19572
56 51
-4157.01489 4.7784691 18 -4155.36807 6.425289454
4 intaining 0 0 distance) in the water dimer
136 131
-4161.985887 -0.192527803 -4161.96789 -0.174530685
126 121 116
-4 16 1.949425 -4161.930687 -0.1373276 -4161.911911 -0.118552124
-0.1560659 1 1
101 I -4161.860802 I -0.067443349 I 111 106
-4161.89397 -0.1006108 17 -4161.877091 -0.083732346
86
96 91
-4 16 1.844208 -0.050849054 -4161.826916 -0.03355733 1
85 84
I 81 1-4161.707088 I 0.086270748 1
-4 16 1.773307 -4 16 1.7 17263
0.02005 152 1 0.076096 15 1
83 82
-4161.711176 0.082183315 -4161.709238 0.084120966
27
76 71
-4161.697683 0.095675866 -4161.68969 0.103668664
66 61
-4161.684204 0.109154825 -4161.680827 0.11253176
0.1
0.05
0
5 -0.05 2 -
3 -0.15
0 K
v)
U
c 2 -0.1
-0.2
-0.25
-0.3
f)
7
6
z 5 Y
6 4
c E 3 0 K
v)
U 0 c 2 n = 1
0
-i
1 1.5
H bond strength v. H bond length
2 2.5 3 3.5 4 4.5 5 5.5 H bond length (Angstroms)
H bond strength v. O-H ... 0 angle (maintaining H bond length)
40 60 80 100 120 140 160 O-H ... 0 angle (degrees)
g)
180
H bond strength v. O-H ... 0 angle (maintaining 0-0 distance) 0.15 I I I 0.1
0.05
z o 6 K -0.05 E v) -0.1
8 -0.15
-0.2
0) - -0 K
r
-0.25
-0.3 ' 40 60 80 100 120 140 160 180
O-H ... 0 angle (degrees)
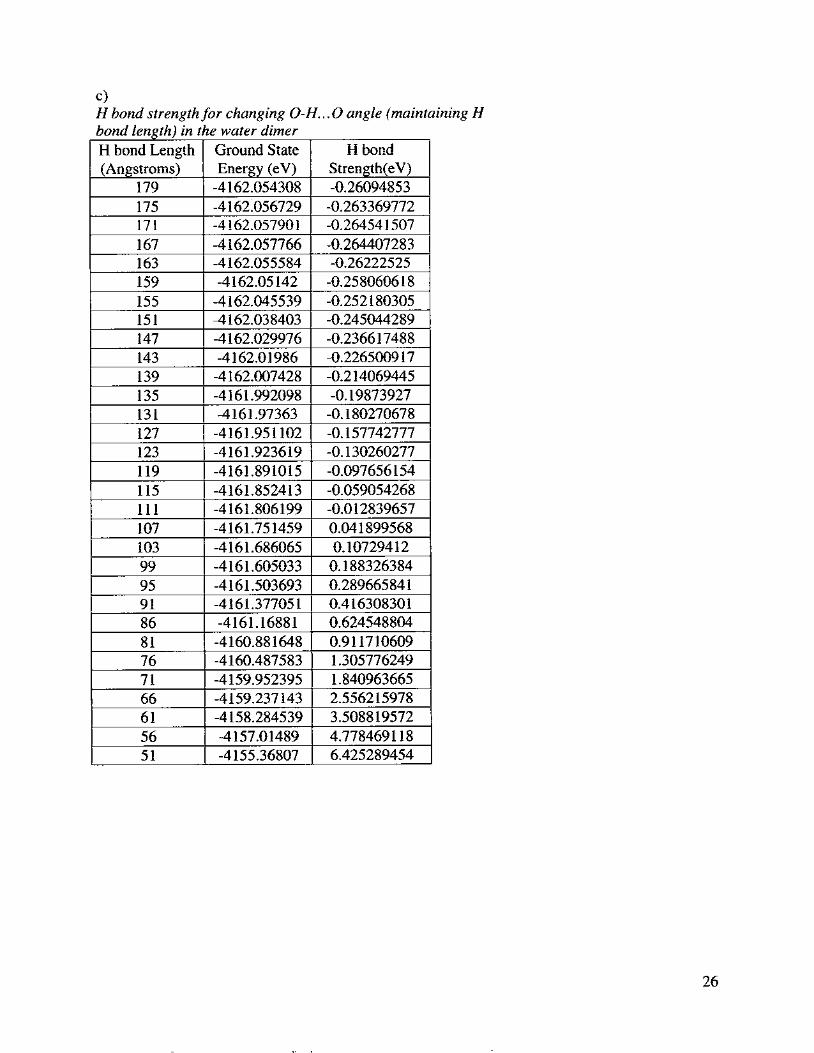
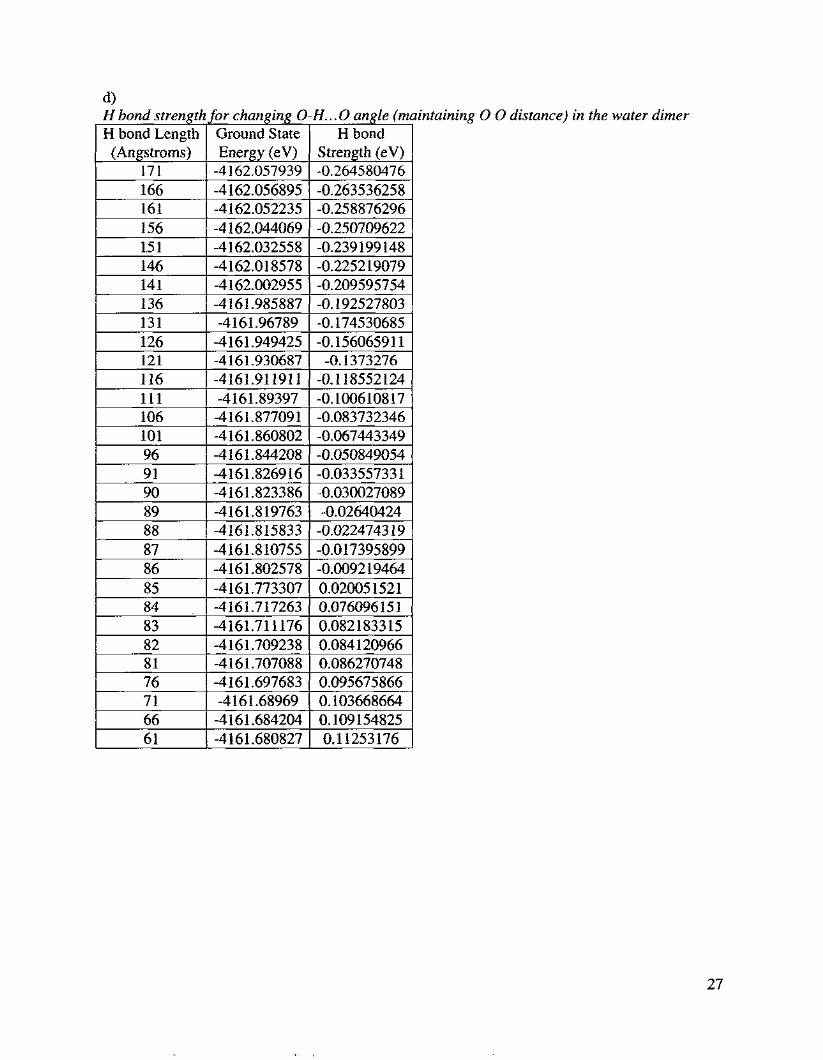
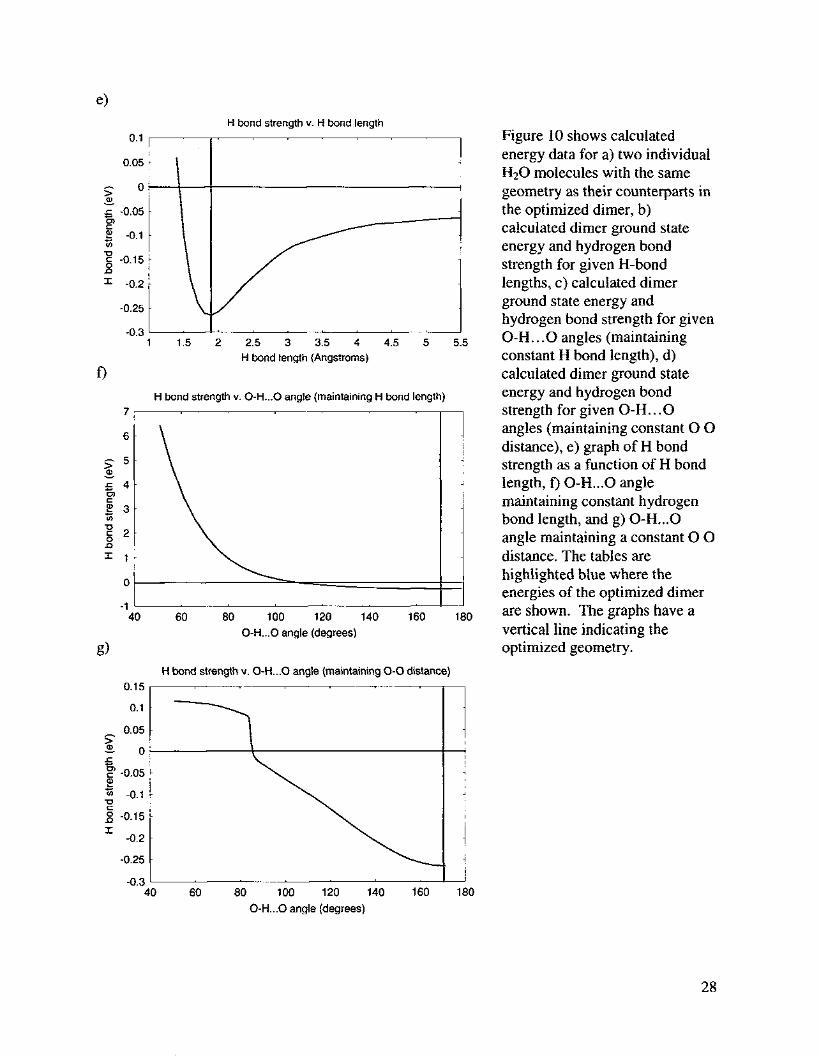
Figure 10 shows calculated energy data for a) two individual H20 molecules with the same geometry as their counterparts in the optimized dimer, b) calculated dimer ground state energy and hydrogen bond strength for given H-bond lengths, c) calculated dimer ground state energy and hydrogen bond strength for given O-H.. .O angles (maintaining constant H bond length), d) calculated dimer ground state energy and hydrogen bond strength for given O-H.. .O angles (maintaining constant 0 0 distance), e) graph of H bond strength as a function of H bond length, f) O-H ... 0 angle maintaining constant hydrogen bond length, and g) O-H ... 0 angle maintaining a constant 0 0 distance. The tables are highlighted blue where the energies of the optimized dimer are shown. The graphs have a vertical line indicating the optimized geometry.
28