Embed Size (px)
Citation preview
1
SIMULATED GROUND MOTIONS WITH SITE EFFECTS POTENTIAL
EVALUATED THROUGH TRANSFER FUNCTIONS AND H/V
MEASUREMENTS: CASE STUDY FOR İZMİR, TURKEY
Louise W. BJERRUM1, Torun LUTRO
2, Mathilde B. SØRENSEN
3, Lars OTTEMÖLLER
3, Coşkun
SARI4 and Kuvvet ATAKAN
3
ABSTRACT
İzmir is the third largest city in Turkey, situated in a complex tectonic region with several destructive
earthquakes in the history. The latest one of these occurred in 1778 and has caused significant damage
in the city. In addition to the complex tectonics young and soft sediments are wide-spread in the
metropolitan area, especially in the northern part of the city north of the İzmir Bay. This area is
covered by the Quaternary sediments originating from the large Gediz river delta system and poses
important challenges in the built environment with respect to the earthquake loads.
In order to assess the fundamental frequencies of the soft sedimentary layers in the area, H/V
spectral ratio method is adopted on ambient vibrations. The entire city is examined through a coarse
grid points where H/V measurements were conducted systematically following the SESAME
guidelines (Bard et al., 2004; Chatelain et al., 2008; Guillier et al., 2008). In addition, H/V
measurements were performed on a denser grid for three locations in both northern and central parts of
the city. Variation of the resulting fundamental frequencies correlates well with the expected
distribution and the thickness of the soft sediments. Furthermore an analytical assessment based on
equivalent linear approach is used. An iterative process is applied for developing representable soil
profiles based on the results of the analytical approach combined with the H/V measurements.
Obtained results give important indications that can be used for further analysis of site response on
simulated ground motions based on earthquake scenarios (Bjerrum et al., 2013).
INTRODUCTION
İzmir, the third largest city in Turkey, is located on the west coast of Turkey surrounded and underlain
by several active faults (Emre et al. 2005). Previous GPS studies have confirmed a westward
migration of the Anatolian microplate, with rotation of western Anatolia in the area around İzmir (e.g.
McClusky et al. 2000; Nyst and Thatcher 2004). This migration and rotation result in reactivation of
faults along the west coast of Turkey and İzmir is of this reason exposed to significant seismic hazard.
The city has historically experienced strong ground shaking due to earthquakes. The latest large
earthquake in the area was in 1778, following two events separated in time by approximately 50 years.
Macroseismic intensities in İzmir have been estimated to up to MMI = X for these events (Ambraseys
1 OCTIO, Bergen, Norway, [email protected]
2 STATOIL, Bergen, Norway, [email protected]
3 University of Bergen, Bergen, Norway, [email protected] , [email protected] ,
[email protected] 4 Dokuz Eylül University, İzmir, Turkey, [email protected]
2
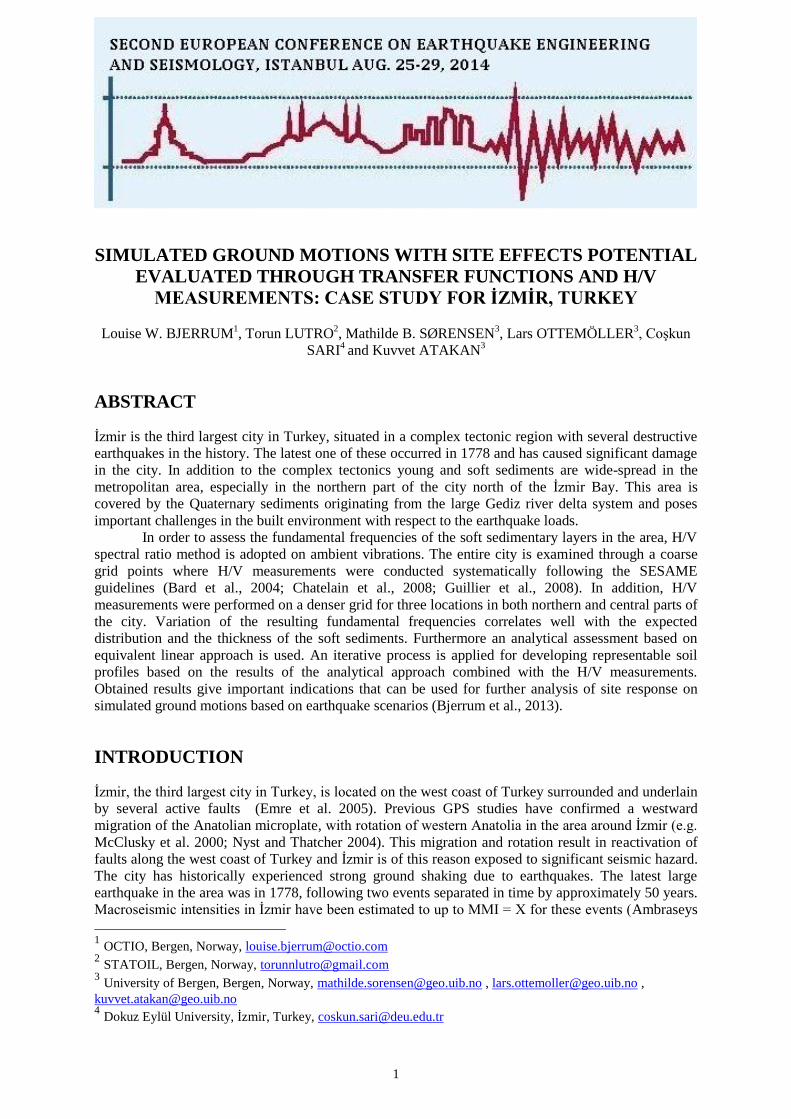
and Finkel 1995; Papazachos and Papazachou 1997; Papazachos et al. 1997). Low seismic activity in
the last 240 years, and the results of a local GPS study focusing on the local tectonic deformation
around İzmir (Aktug and Kilicoglu 2006) indicate that stresses are building up across the faults in the
area (Figure 1).
Figure 1. a) Map of the İzmir and surroundings. The faults mapped by MTA (Emre et al., 2005) are shown as
yellow lines, İzmir fault is marked with blue. The historic events in the area are indicated as white circles
(Ambraseys and Finkel, 1995; Papazachos and Papazachou, 1997; Papazachos et al., 1997) and the GPS velocity
field from Aktuğ and Kılıçoḡlu (2006) is shown as white arrows. b) Location of sites for H/V measurements.
(Yellow: Large grid points; Pink: dense grid in Konak; Blue: dense grid in Karşıyaka; Green: dense grid in
Mavişehir). Map prepared in Google Earth © .
İzmir is located directly above a normal fault of approximately 40 km length, potentially
capable of generating a Mw=6.9 earthquake (Wells and Coppersmith 1997). In addition, large parts of
the metropolitan area are underlain by soft sedimentary deposits, especially on the northern
(Karsiyaka) and eastern (Bornova) parts of the İzmir Bay. In the north the deltaic deposits from the
L.W. Bjerrum, T. Lutro, M.B. Sørensen, L. Ottemöller, C. Sarı and K. Atakan 3
Gediz river poses significant challenges to the built environment with settlement problems in
buildings, high liquefaction potential due to high water saturation etc. The sediment thickness is highly
variable within the city of İzmir, where also topographic high areas of bedrock outcrops are present. It
is therefore important and timely to address the local site effects in İzmir, especially taking into
account the possible large ground motions that are expected from future earthquakes. Site
amplification in İzmir has previously been estimated by the Metropolitan Municipality of İzmir (MMI)
(2000). The reported amplification factors are in the range of 3-4 in the central and northern parts of
the city. More recently, Altun et al. (2012) used borehole data from MMI (2000) to perform a 1D
dynamic site response analysis. They found that most of the area along the northern coast of İzmir Bay
is prone to large ground shaking potential due to the soft sedimentary deposits, the deep bedrock level,
the shallow underground water table and the proximity to the active İzmir fault.
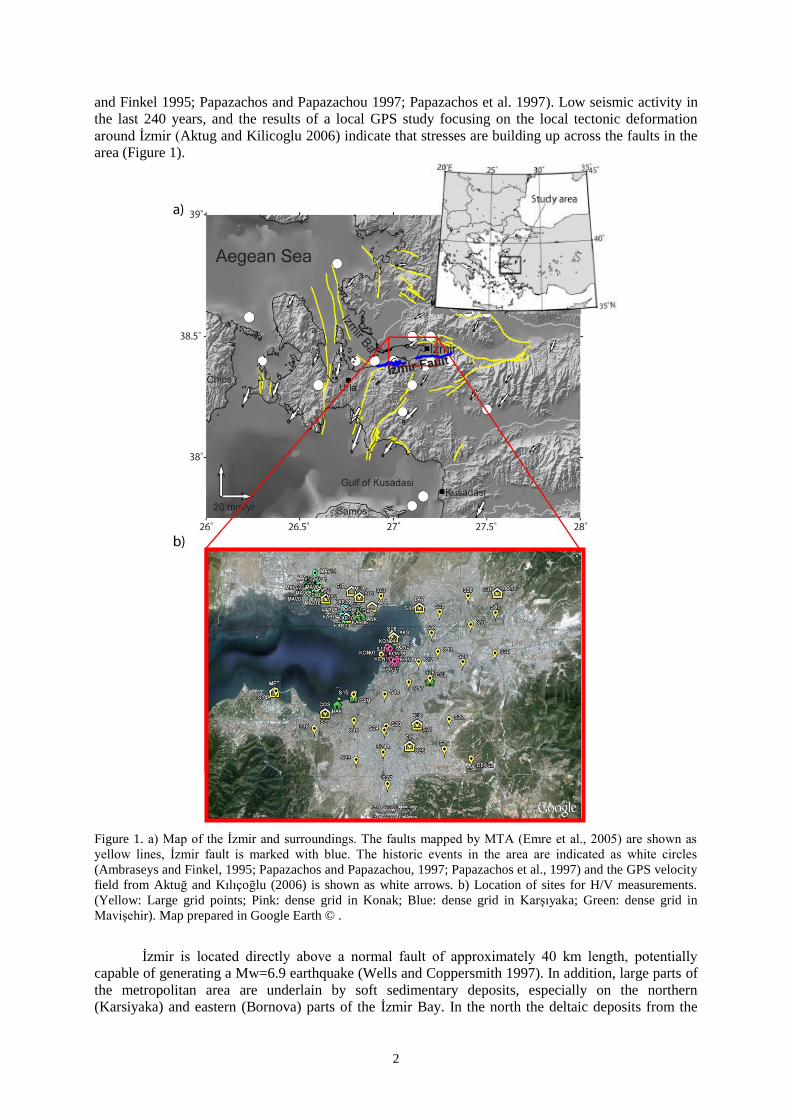
Previously both probabilistic and deterministic (based on ground motion simulations) seismic
hazard analyses have been conducted for the area around İzmir. Expected ground motions of 0.4 g for
a 475 year return period were predicted, while earthquake rupture scenarios predicted ground motions
on bedrock level exceeding 750 cm/s2 in the center of the city (MMI, 2000; Bjerrum 2007; Bjerrum
and Atakan 2008; Deniz et al. 2010; Bjerrum et al., 2013). Figure 2 shows the average peak ground
motions (in PGA and PGV) from the study of Bjerrum et al. (2013).
Figure 2. Spatial distribution of average ground motion and standard deviation of PGA (left) and PGV (right)
from ground motion simulations (from Bjerrum et al., 2013). The surface projection of the ruptured fault plane
and asperity are shown as white rectangles, the surface trace is marked with a thick stippled line. The nucleation
point is shown as a white star.
The objective of this study is to highlight the local site effects potential in İzmir due to a future
large earthquake, using H/V measurements across the metropolitan area of İzmir. Measurements were
conducted in both a coarse grid points covering the entire city (approximately 2x2 km) as well as at
denser grid points (max 300 m spacing) on three selected areas (Figure 1b). Fundamental frequencies
obtained from the H/V measurements are then used in an iterative process to obtain representative 1D
soil columns for Karşıyaka on the northern coast of İzmir bay.
4
METHODOLOGY AND DATA
Nakamura’s H/V technique (Nakamura, 1989) is based on the assumptions that the horizontal and
vertical components on hard ground (bedrock) have similar characteristics and that the vertical
component of ground motion on the ground surface is similar to the horizontal component at the
bedrock. The spectral ratio between the horizontal and vertical components of ambient noise recorded
at the surface is assumed to capture the fundamental frequency of the soil column as well as the related
amplification. Nakamura (2010) further claims that this is caused by multiple reflections of SH-waves
in sedimentary layers overlying the bedrock. Many studies have validated the benefits of the method
e.g. for Japan (Nakamura 1989), Oakland, California (Field and Jacob 1995), Israel (Gitterman et al.
1996), Thessaloniki, Greece (Lanchet et al. 1996), Lisbon, Portugal (Teves-Costa and Matias 1996)
and the Rhone Delta, France (Bour et al. 1998). It is generally believed that reliable estimates of the
fundamental frequency can be obtained, whereas there is still uncertainty regarding the amplification
factors (Atakan, 2009). The empirical H/V technique uses recordings of ambient noise from a three-
component seismograph and as such it is a cheap and practical method to apply in urban environments
like İzmir.
We collected ambient noise data in spring 2010, covering a large part of the metropolitan area
of İzmir in a coarse grid of approximately 2x2 km, and for three smaller and denser grids in the areas
Mavişehir, Karşıyaka and Konak/Alsancak. In total we investigated 87 sites. The smaller and denser
grids were chosen for areas where the site classification study by MMI (2000) yields the largest
expected amplification. The data were collected using three SARA SR04 digitizers with 4.5 Hz
geophones, and recording on laptops. Each recording was approximately 30 minutes long and a
sampling frequency of 100 Hz was used. This set up is found valid to investigate fundamental
frequencies down to 0.3 Hz (Bard et al. 2004). For the data acquisition we used SEISLOG (Utheim
and Havskov 1998) and for organizing and checking the data we used SEISAN (Ottemöller et al.
2011). Processing of the collected data was done with the software GEOPSY (Wathelet 2011). H/V
spectral ratios were calculated using a window length of 25 s with no overlap and tapered with a 5%
cosine function. A Konno and Ohmachi smoothing with a smoothing constant of 40 was used without
filtering (Konno and Ohmachi 1995). Anti-triggering was set with a minimum STA/LTA of 0.2 and
maximum STA/LTA of 2.5, where the time windows of the STA and LTA were set to 1 s and 30 s,
respectively.
Soil response can be calculated theoretically from known soil structures using linear response
analysis. In such a case the theoretical transfer function is calculated for a site where the layered soil
column is known. In the case of İzmir detailed information on the soil velocity structure is not known,
and we therefore model a simplified soil structures for the district of Karşıyaka in İzmir. In the
modeling we tested different soil column models and calculated the corresponding theoretical transfer
functions. These functions are then compared to the average H/V spectral ratios we obtained from the
recorded ambient noise data. In an iterative process we have obtained two representative 1D soil
columns for Karşıyaka, one for a 60 m thick soil column and another for a 100 m thickness. The
modeling is conducted with first obtaining the approximate average shear-wave velocity of the soil
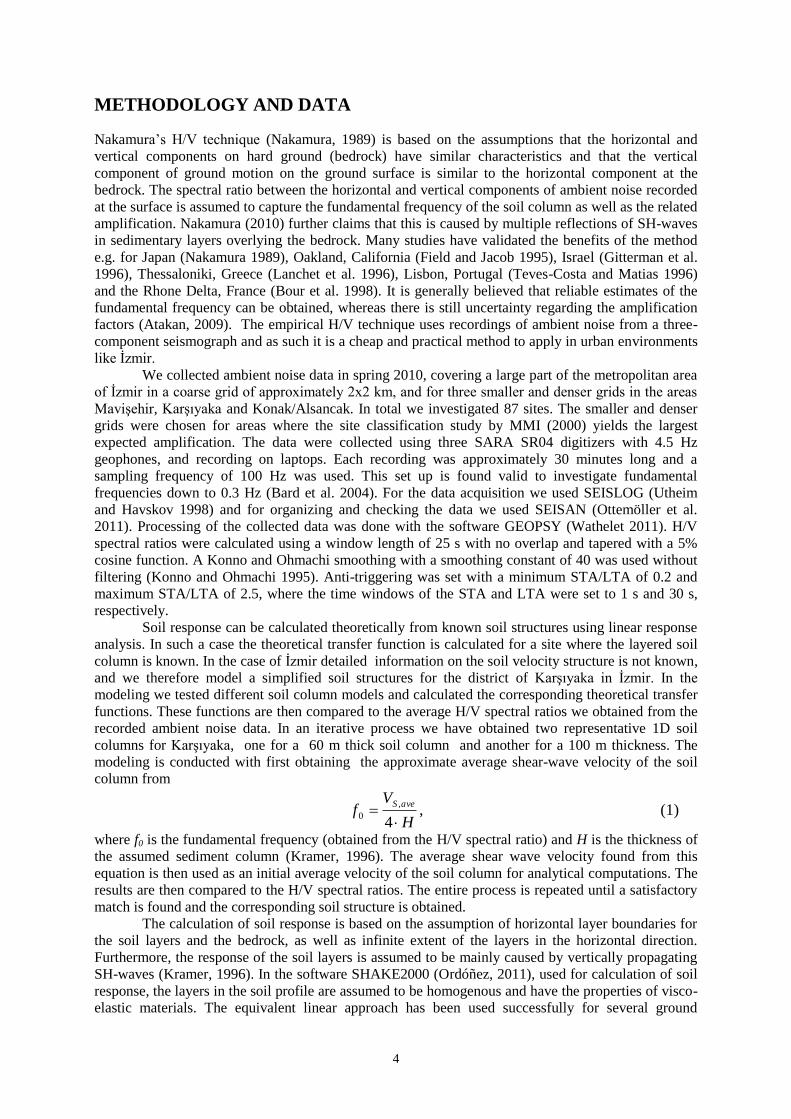
column from
,4
,
0H
Vf
aveS
(1)
where f0 is the fundamental frequency (obtained from the H/V spectral ratio) and H is the thickness of
the assumed sediment column (Kramer, 1996). The average shear wave velocity found from this
equation is then used as an initial average velocity of the soil column for analytical computations. The
results are then compared to the H/V spectral ratios. The entire process is repeated until a satisfactory
match is found and the corresponding soil structure is obtained.
The calculation of soil response is based on the assumption of horizontal layer boundaries for
the soil layers and the bedrock, as well as infinite extent of the layers in the horizontal direction.
Furthermore, the response of the soil layers is assumed to be mainly caused by vertically propagating
SH-waves (Kramer, 1996). In the software SHAKE2000 (Ordóñez, 2011), used for calculation of soil
response, the layers in the soil profile are assumed to be homogenous and have the properties of visco-
elastic materials. The equivalent linear approach has been used successfully for several ground
L.W. Bjerrum, T. Lutro, M.B. Sørensen, L. Ottemöller, C. Sarı and K. Atakan 5
response analyses e.g. for the Rhone Delta, France (Bour et al. 1998), Armenia, Columbia (Slob et al.
2002) and Bangalore, India (Sitharam and Anbazhagan 2008).
The soil structure is constructed and modified until the fundamental frequency of the transfer
function for the soil response, matches the fundamental frequency found from the average H/V
spectral ratio curve, when ambient noise is used as input motion in SHAKE2000. When a satisfactory
soil column is obtained, we calculate the soil response due to the ground shaking from the simulated
ground motions obtained by Bjerrum et al. (2013). The soil response is calculated based on two levels
of the ground motions; first one, the simulated ground motions that are scaled to have a maximum
acceleration of 0.3g (scaled) and the second, the full amplitudes from the simulated spectral
accelerations (unscaled). The scaled waveform is introduced, since ground motions of more than 0.3-
0.4 g may induce non-linearity in the soil response, and the linear approach therefore may no longer be
valid.
Sedimentary deposits are usually classified according to properties like grain size, matrix type,
cementation, water content, cohesion forces and porosity (Atakan, 1995). In geotechnical applications
other layer specific properties like density, viscosity, confining pressure, degree of consolidation,
stiffness, shear strength, shear wave velocity, damping, Poisson ratio, Youngs modulus, bulk modulus
and Lame’s constants are also important (NDT-Resource Center 2011; Pluijm and Marshak 2004).
When describing the behavior of soils in an analytical process, it is assumed that all these parameters
are reduced to stiffness and damping (Atakan 1995; Kramer 1996; Ordóñez 2011). Damping, unit
weight, G/Gmax curves and damping curves for damping and stiffness for clay, sand and rock used in
the modeling are chosen as average values (Amir M. Kaynia, personal communication).
ANALYSIS RESULTS
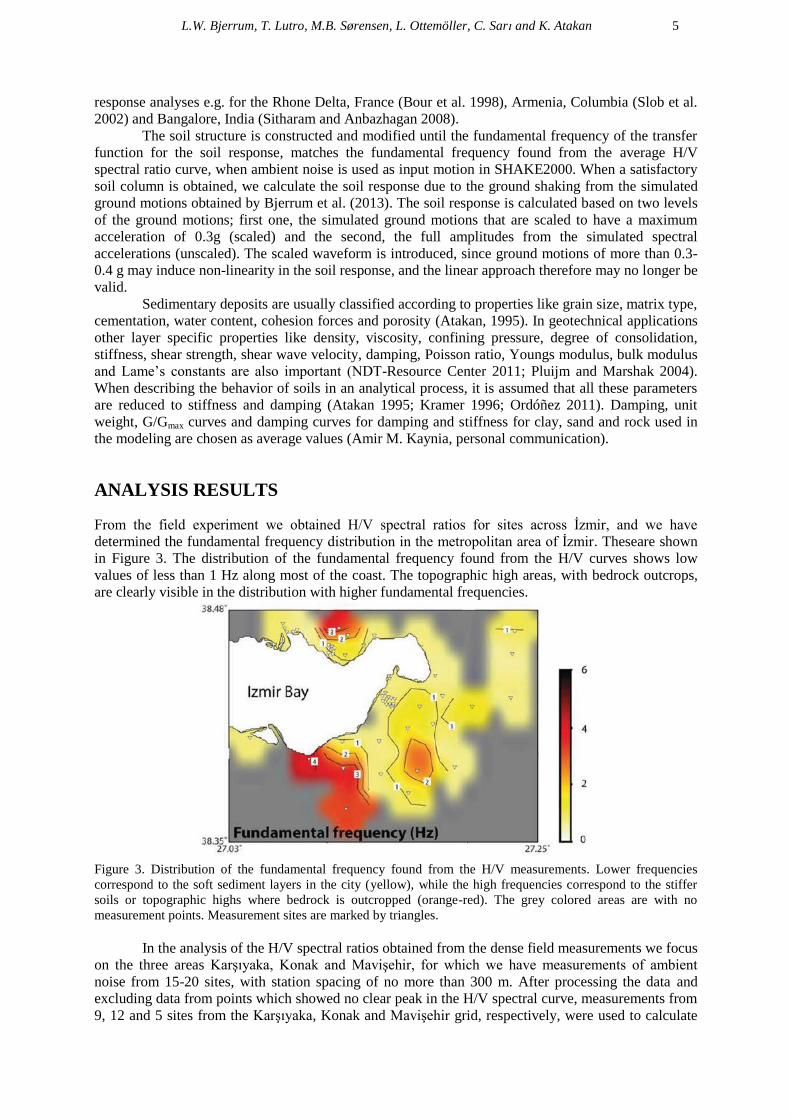
From the field experiment we obtained H/V spectral ratios for sites across İzmir, and we have
determined the fundamental frequency distribution in the metropolitan area of İzmir. Theseare shown
in Figure 3. The distribution of the fundamental frequency found from the H/V curves shows low
values of less than 1 Hz along most of the coast. The topographic high areas, with bedrock outcrops,
are clearly visible in the distribution with higher fundamental frequencies.
Figure 3. Distribution of the fundamental frequency found from the H/V measurements. Lower frequencies
correspond to the soft sediment layers in the city (yellow), while the high frequencies correspond to the stiffer
soils or topographic highs where bedrock is outcropped (orange-red). The grey colored areas are with no
measurement points. Measurement sites are marked by triangles.
In the analysis of the H/V spectral ratios obtained from the dense field measurements we focus
on the three areas Karşıyaka, Konak and Mavişehir, for which we have measurements of ambient
noise from 15-20 sites, with station spacing of no more than 300 m. After processing the data and
excluding data from points which showed no clear peak in the H/V spectral curve, measurements from
9, 12 and 5 sites from the Karşıyaka, Konak and Mavişehir grid, respectively, were used to calculate
6
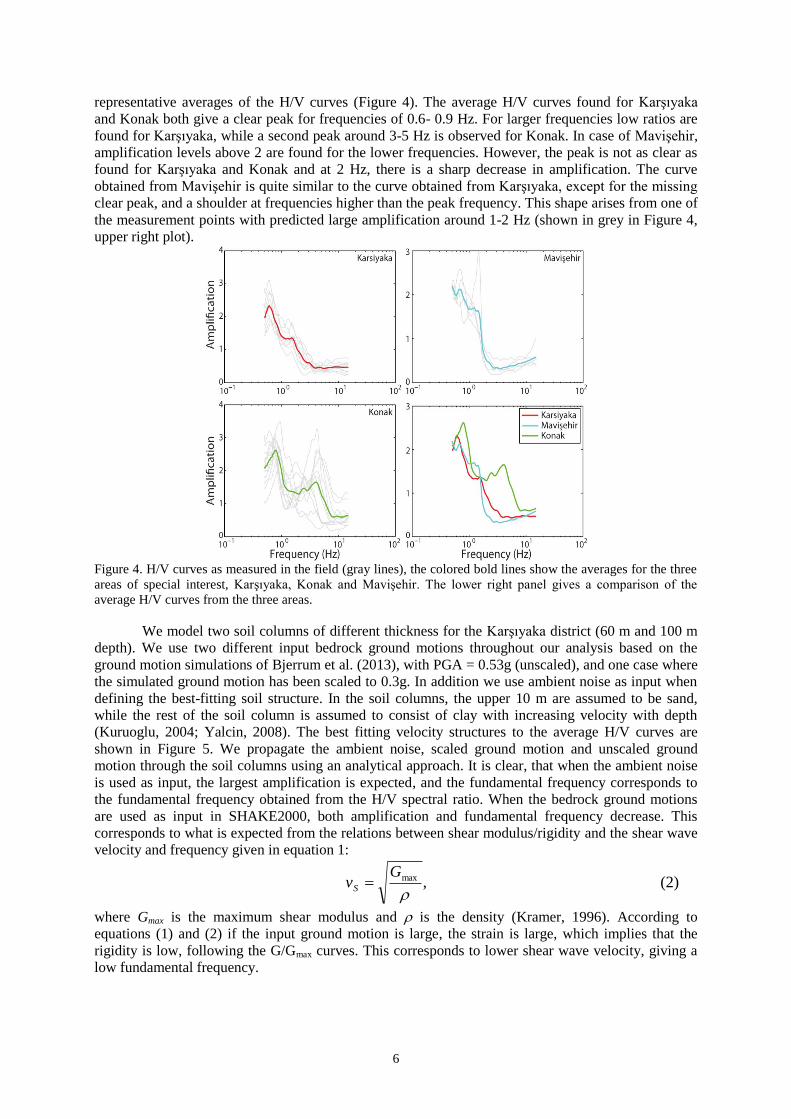
representative averages of the H/V curves (Figure 4). The average H/V curves found for Karşıyaka
and Konak both give a clear peak for frequencies of 0.6- 0.9 Hz. For larger frequencies low ratios are
found for Karşıyaka, while a second peak around 3-5 Hz is observed for Konak. In case of Mavişehir,
amplification levels above 2 are found for the lower frequencies. However, the peak is not as clear as
found for Karşıyaka and Konak and at 2 Hz, there is a sharp decrease in amplification. The curve
obtained from Mavişehir is quite similar to the curve obtained from Karşıyaka, except for the missing
clear peak, and a shoulder at frequencies higher than the peak frequency. This shape arises from one of
the measurement points with predicted large amplification around 1-2 Hz (shown in grey in Figure 4,
upper right plot).
Figure 4. H/V curves as measured in the field (gray lines), the colored bold lines show the averages for the three
areas of special interest, Karşıyaka, Konak and Mavişehir. The lower right panel gives a comparison of the
average H/V curves from the three areas.
We model two soil columns of different thickness for the Karşıyaka district (60 m and 100 m
depth). We use two different input bedrock ground motions throughout our analysis based on the
ground motion simulations of Bjerrum et al. (2013), with PGA = 0.53g (unscaled), and one case where
the simulated ground motion has been scaled to 0.3g. In addition we use ambient noise as input when
defining the best-fitting soil structure. In the soil columns, the upper 10 m are assumed to be sand,
while the rest of the soil column is assumed to consist of clay with increasing velocity with depth
(Kuruoglu, 2004; Yalcin, 2008). The best fitting velocity structures to the average H/V curves are
shown in Figure 5. We propagate the ambient noise, scaled ground motion and unscaled ground
motion through the soil columns using an analytical approach. It is clear, that when the ambient noise
is used as input, the largest amplification is expected, and the fundamental frequency corresponds to
the fundamental frequency obtained from the H/V spectral ratio. When the bedrock ground motions
are used as input in SHAKE2000, both amplification and fundamental frequency decrease. This
corresponds to what is expected from the relations between shear modulus/rigidity and the shear wave
velocity and frequency given in equation 1:
,max
GvS (2)
where Gmax is the maximum shear modulus and is the density (Kramer, 1996). According to
equations (1) and (2) if the input ground motion is large, the strain is large, which implies that the
rigidity is low, following the G/Gmax curves. This corresponds to lower shear wave velocity, giving a
low fundamental frequency.
L.W. Bjerrum, T. Lutro, M.B. Sørensen, L. Ottemöller, C. Sarı and K. Atakan 7
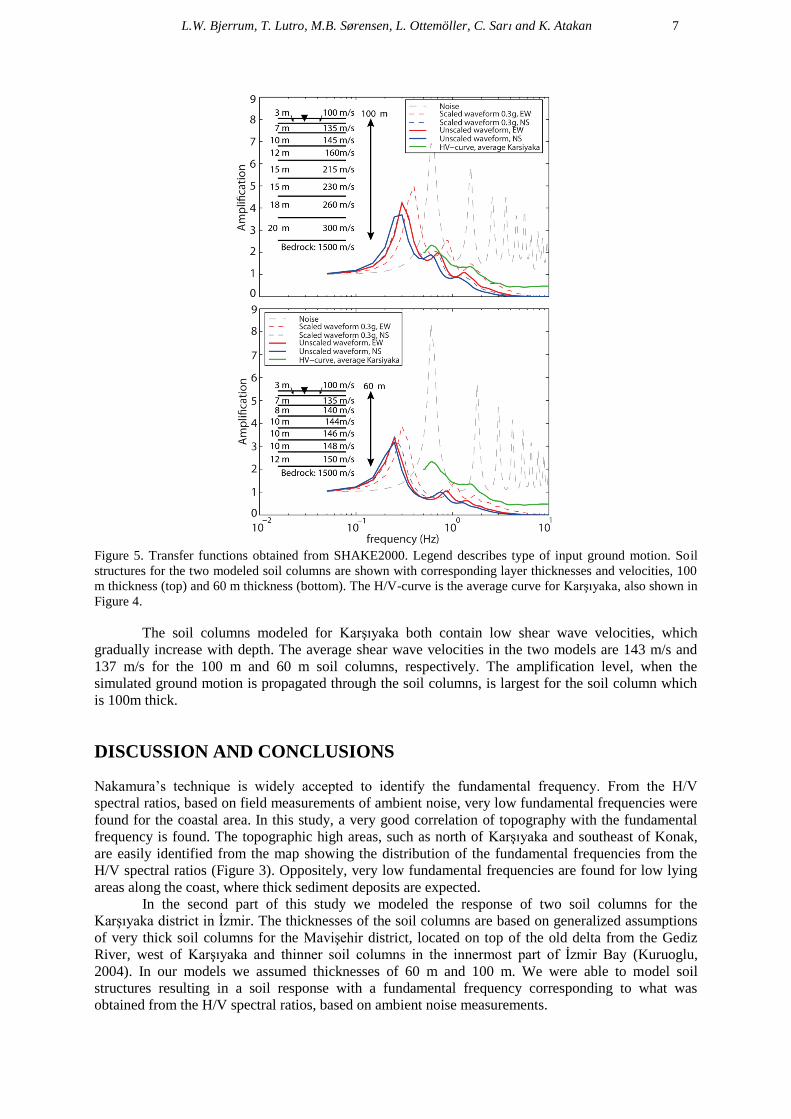
Figure 5. Transfer functions obtained from SHAKE2000. Legend describes type of input ground motion. Soil
structures for the two modeled soil columns are shown with corresponding layer thicknesses and velocities, 100
m thickness (top) and 60 m thickness (bottom). The H/V-curve is the average curve for Karşıyaka, also shown in
Figure 4.
The soil columns modeled for Karşıyaka both contain low shear wave velocities, which
gradually increase with depth. The average shear wave velocities in the two models are 143 m/s and
137 m/s for the 100 m and 60 m soil columns, respectively. The amplification level, when the
simulated ground motion is propagated through the soil columns, is largest for the soil column which
is 100m thick.
DISCUSSION AND CONCLUSIONS
Nakamura’s technique is widely accepted to identify the fundamental frequency. From the H/V
spectral ratios, based on field measurements of ambient noise, very low fundamental frequencies were
found for the coastal area. In this study, a very good correlation of topography with the fundamental
frequency is found. The topographic high areas, such as north of Karşıyaka and southeast of Konak,
are easily identified from the map showing the distribution of the fundamental frequencies from the
H/V spectral ratios (Figure 3). Oppositely, very low fundamental frequencies are found for low lying
areas along the coast, where thick sediment deposits are expected.
In the second part of this study we modeled the response of two soil columns for the
Karşıyaka district in İzmir. The thicknesses of the soil columns are based on generalized assumptions
of very thick soil columns for the Mavişehir district, located on top of the old delta from the Gediz
River, west of Karşıyaka and thinner soil columns in the innermost part of İzmir Bay (Kuruoglu,
2004). In our models we assumed thicknesses of 60 m and 100 m. We were able to model soil
structures resulting in a soil response with a fundamental frequency corresponding to what was
obtained from the H/V spectral ratios, based on ambient noise measurements.
8
We have interpreted the H/V curves by modelling simple generalized soil structures for
Karşıyaka with soil response similar to what was found from the H/V spectral ratios. The H/V spectral
ratios obtained from ambient noise measurements yield low fundamental frequencies for the coastal
area in İzmir, and the topographic high areas are clearly identified from the high fundamental
frequencies. The two soil columns, with soil response of fundamental frequency corresponding to the
H/V spectral ratios modeled for the Karşıyaka district, imply an increase in the low frequency content
of the ground motions when accounting for the soil columns, as compared to the ground motion at
bedrock level. However, PGA is found to be lower. Increased thickness (model of 100 m) results in
larger amplification of the ground motion.
The results presented are meant as a preliminary study of the site effect potential for İzmir, and
future studies are needed for better estimation of the transfer functions representing the response of the
soil layers. A detailed microzonation study is recommended including the classification of soil
structures and seismic velocities systematically determined for several soil profiles together with the
depth of the soft sediment layers across the city.
ACKNOWLEDGEMENTS
We have during our field work and visits to İzmir been assisted by several people from Dokuz Eylül
University in İzmir. We would especially like to thank Elif Balkan, Çaḡrı Çaylak, Ezgi Çınar, İlknur
Kaftan, and Emre Timur for assistance in the field, together with Åse Oliv Bjørge from University of
Bergen. We are grateful to Ersan Özsoy, who assisted during the fieldwork in İzmir. We would also
like to thank Amir M. Kaynia from Norwegian Geotechnical Institute, regarding the analytical
computations.
REFERENCES
Altun S, Sezer A, Göktepe AB (2012) “A preliminary microzonation study on Northern Coasts of İzmir:
Investigation of the local soil conditions”, Soil Dynamics and Earthquake Engineering, 39:37-49
Aktug B, and Kilicoglu A. (2006) “Recent crustal deformation of İzmir, western Anatolia and surrounding
regions as deduced from repeated GPS measurements and strain field”, Journal of Geodynamics, 41:471-
484
Ambraseys NN, Finkel CF (1995) The Seismicity of Turkey and adjacent areas, a historical review, 1500-1800,
Muhittin Salih EREN, IstanbulAtakan K (1995) “A review of the type of data and the techniques used in
empirical estimation of local site response”, Proceedings of the 5th International Conference on Seismic
Zonation, Nice, France, 17-19 October 1995
Atakan, K. (2009). The need for standardized approach for estimating the local site effects based on ambient
noise recordings. In: Mucciarelli, M., Herak, M., and Cassidy, J. (Eds.). “Increasing Seismic Safety by
Combining Engineering Technologies and Seismological Data”, NATO Science for Peace and Security
Series C: Environmental Security, Springer Science & Business Media B.V. 2009, Dordrecht,
Netherlands, 400p. Chapter 1.1, 3-16.
Bard P-Y, and the SESAME Project Participants (2004) “Guidelines for the Implementation of the H/V Spectral
Ratio Technique on Ambient Vibrations: Measurements, processing and interpretation”, SESAME Project
Report, Universite Joseph Fourier, Grenoble, France, 50p
Bjerrum LW (2007) Ground motion simulations for İzmir, Turkey, based on earthquake rupture scenarios, MSc
Thesis, University of Bergen, Norway, 162p
Bjerrum LW, Atakan K (2008) “Scenario based ground motion simulations for assessing the seismic hazard in
İzmir, Turkey”, Proceedings of the 14th World Conference on Earthquake Engineering, Beijing, China,
12-17 October 2008
Bjerrum LW, Sørensen MB, Ottemöller L., and Atakan K. (2013) “Sensitivity of ground motions due to input
parameter uncertainty: A case study for İzmir, Turkey”, Journal of Seismology, 17(4):1223- 1252, doi:
10.1007/s10950-013-9389-9
Bour M, Fouissac D, Dominique P, Martin C (1998) “On the use of microtremor recordings in seismic
microzonation”, Soil Dynamics and Earthquake Engineering, 17:465-474
Chatelain J-L, Guillier B, Cara F, Duval A-M, Atakan K, Bard P-Y, and the WP02 SESAME Team (2008)
“Evaluation of the influence of experimental conditions on H/V results from ambient noise recordings”,
Bulletin of Earthquake Engineering, 6(1):33-74, doi: 10.1007/s10518-007-9040-7
L.W. Bjerrum, T. Lutro, M.B. Sørensen, L. Ottemöller, C. Sarı and K. Atakan 9
Deniz A, Korkmaz KA, Irfanoglu A (2010) “Probabililstic seismic hazard assessment for İzmir, Turkey”, Pure
and Appllied Geophysics, 167:1475-1484
Emre Ö, Özalp S, Dogan A, Özaksoy V, Yildirim C, Göktas F (2005) “İzmir yakin cevresinin diri faylari ve
deprem potansiyelleri”, Maden Tetkik ve Arama, 80p (in Turkish).
Field EH, Jacob KH (1995) “A comparison and test of various site-response estimation techniques, including
three that are not reference-site dependent”, Bulletin of the Seismological Society of America, 85:1127-
1143
Gitterman Y, Zaslavsky Y, Shapira A, Shtivelman V (1996) “Empirical site response evaluations: case studies in
Israel”, Soil Dynamics and Earthquake Engineering, 15:447-463
Guillier B, Atakan K, Chatelain J-L, Havskov J, Ohrnberger M, Cara F, Duval A-M, Zacharapoulos S, Teves-
Costa P, and the SESAME Team (2008) “Influence of instruments on H/V spectral ratios of ambient
vibrations”, Bulletin of Earthquake Engineering, 6(1):3-31, doi: 10.1007/s10518-007-9039-0
Konno K, Ohmachi T (1995) “A smoothing function suitable for estimation of amplification factor of the surface
ground from microtremor and its application”, Journal of Japanese Society of Civil Engineering, 525(1–
33):247–259 (in Japanese with English abstract)
Kramer SL (1996) Geotechnical earthquake engineering. Prentice Hall, Upper Saddle River, New Jersey
Kuruoglu, M. (2004) Geographic information system (GIS) based database development and evaluation study
for soils of northern coast of İzmir Bay, M.Sc. thesis, Dokuz Eylul University, İzmir, Turkey, 151p.
Lachet C, Hatzfeld D, Bard P-Y, Theodulidis N, Papaioannou C, Savvaidis A (1996) “Site effects and
microzonation in the city of Thessaloniki (Greece) comparison of different approaches”, Bulletin of the
Seismological Society of America, 86:1692-1703
McClusky S, Balassanian S, Barka A, Demir C, Ergintav S, Georgiev I, Gurkan O, Hamburger M, Hurst K,
Kahle H, Kastens K, Kekelidze G, King R, Kotzev V, Lenk O, Mahmoud S, Mishin A, Nadariya M,
Ouzounis A, Paradissis D, Peter Y, Prilepin M, Reilinger R, Sanli I, Seeger H, Tealeb A, Toksöz MN,
Veis G (2000) “Global Positioning System constraints on plate kinematics and dynamics in the eastern
Mediterranean and Caucasus”, Journal of Geophysical Research, 105:5695-5719
Metropolitan Municipality of İzmir (MMI) (2000) İzmir Earthquake Masterplan, Published by the Metropolitan
Municipality of İzmir, İzmir, Turkey. http://www.İzmir.bel.tr/İzmirdeprem/İzmirrapor.htm. Accessed
August 2011 (in Turkish)
Nakamura Y (1989) “A method for dynamic characteristics estimation of subsurface using microtremor on the
ground surface”, Quarterly report of Railway Technical Research Institute, 20(1)
Nakamura Y (2010) “Comment on ‘Microtremor measurements in the Nile delta basin, Egypt: Response of the
topmost sedimentary layer’ by E.A. Fergany and S. Bonnefoy-Claudet”, Seismological Research Letters,
81:241-243
NDT-ResourceCenter (2011) “Sound Propagation in Elastic Materials. NDT-ResourceCenter”, http://www.ndt-
ed.org/EducationResources/CommunityCollege/Ultrasonics/Physics/elasticsolids.htm. Accessed 16
February 2011
Nyst M, Thatcher W (2004) “New constraints on the active tectonic deformation of the Aegean”, Journal of
Geophysical Research, 109:406-430
Ordóñez, GA (2011) “SHAKE2000 A computer program for the 1-D analysis og geotechnical earthquake
engineering problems”, http://www.shake2000.com/. Accessed 12 April 2011
Ottemöller L, Voss P, Havskov J (2011) “SEISAN earthquake analysis software for Windows, Solaris, Linux
and MacOSX”, version 9.0, 2011
Papazachos B, Papazachou C (1997) The earthquakes of Greece, Technical books Edition, Thessaloniki
Papazachos BC, Papaioannou CA, Papazachos CB, Savvaidis AS (1997) Atlas of isoseismal maps for strong
shallow earthquakes in Greece and surrounding area (426BC-1995), Technical books Editions,
Thessaloniki
Pluijm BA vd, Marshak S (2004) Earth structure, an introduction to structural geology and tectonics, W.W.
Norton & Company Inc, New York
Sitharam TG, Anbazhagan P (2008) “Seismic Microzontion: Principles, Practices and Experiments”, EJGE
Special Volume Bouquet 08, online, http://www.ejge.com/Bouquet08/Preface.htm
Slob S, Hack R , Scarpas T, Bemmelen Bv, Duque A (2002) “A methodology for seismic microzonation using
GIS and SHAKE – A case study from Armenia, Colombia”, Engineering Geology for Developing
Countries - Proceedings of 9th Congress of the International Association for Engineering Geology and
the Environment, Durban, South Africa, 16-20 September 2002
Teves-Costa P, Matias L, Bard Y-B (1996) “Seismic behaviour estimation of thin alluvium layers using
microtremor recordings”, Soil Dynamics and Earthquake Engineering, 15: 201-209
Utheim T, Havskov J (1998) The SEISLOG Data Acquisition System. PC version, Guide to installation,
maintenance and daily operation of the system, Institute of Solid Earth Physics, University of Bergen,
Norway

10
Wathelet M (2010) “Geopsy project” http://www.geopsy.org/index.html. Accessed March 2011
Wells DL, Coppersmith KJ (1994) “New empirical relationships among magnitude, rupture length, rupture
width, rupture area, and surface displacement”, Bulletin of the Seismological Society of America, 84:974-
1002
Yalcin, I.A. (2008) A geotechnical earthquake engineering investigation for soils of southeastern coast of İzmir
Bay, M.Sc. thesis. Dokuz Eylul University, İzmir, Turkey, 159p