Embed Size (px)
Citation preview
International Journal of Scientific and Innovative Mathematical Research (IJSIMR)
Volume 3, Issue 5, May 2015, PP 18-30
ISSN 2347-307X (Print) & ISSN 2347-3142 (Online)
www.arcjournals.org
©ARC Page | 18
Simulated Annealing vs Genetic Algorithm to Portfolio Selection
Joël N. Kapiamba
Faculty of Sciences
University of Kinshasa
Kinshasa, DR Congo
[email protected] Berthold Ulungu E.-L.
Faculty of Mechanics
High College of Applied Engineering
Kinshasa, DR Congo
Pascal K. Mubenga
Faculty of Sciences
University of Kinshasa
Kinshasa, DR Congo
Abstract: Portfolio selection problem consists on choice of best titles to constitute a portfolio which maximizes
revenue and minimizes risk. We then deal with a bicriteria problem having two conflicting criteria to optimize
simultaneously. It is well known that such a combinatorial problem is intractable with exact methods for large
dimension problems. Then metaheuristics are useful to find a good approximation of the efficient set.
The purpose of this article is to evaluate the efficiency of two metaheuristic methods, namely the simulated
annealing and the genetic algorithm to solve Portfolio selection problem. In order to compare both of them,
metaheuristics have been implemented in the same language, Matlab. Statistical estimator and variance
analysis allowed us to discriminate numerical experiments results. We observe that differences are significant.
In terms of calculation time, simulated annealing appears more efficient than genetic algorithm. Variance
analysis shows that both methods are independent one to another, and the result depends on the used method. In
conclusion, some suggestions for future research are proposed.
Keywords: Portfolio selection, Simulated Annealing, Genetic Algorithm, Optimization of a Portfolio,
Markowitz model, Analysis of Variance (ANOVA).
1. INTRODUCTION
First introduced by Markowitz [1], the mean-variance model for portfolio selection problem was the
benchmark formulation in the financial field and was the basis for the development of modern
financial theory over the past 60 years [2, 3].
A review of the portfolio management literature listed several articles on the subject since the early
works of Markowitz [1]. In [4], the proposed algorithm based on hybridizing Genetic Algorithm and
Simulated Annealing is efficient and applicable. The combination of Genetic Algorithm and
Simulated Annealing is used to solve the portfolio investment problem, and the strategic restriction is
introduced to the mutation process of Genetic Algorithm. It provides a high efficient decision-making
method for portfolio investment, and it can also be used in other fields related to optimization. In [5],
a modern theory of portfolio management is exposed. In [16], fuzzy number appears for the first time
in this field. In [7, 8, 9, 10, 11, 12], authors introduced multi-objective paradigm modelling. A
resolution with Goal Programming method is described in [13, 14]. In several other articles [8, 10, 13,
15, 16, 17, 18, 19, 20] various related issues are discussed, it is among other investment
diversification, the portfolio management expected return of the capital markets or mutual funds [18,
21].
In his model, Markowitz considered the mathematical expectation as portfolio investment revenue
(see [1, 22]) and variance as risk of investment.
In this article, we briefly present the benchmark model, the simulated annealing algorithm used with
its neighborhood systems that we have built, inspired by [5] and adapted to our genetic algorithm
Joël N. Kapiamba et al.
International Journal of Scientific and Innovative Mathematical Research (IJSIMR) Page 19
problem. A numerical example will illustrate the quality of solutions, and finally, we conclude with
some remarks and perspectives for future research.
2. MODELING
2.1 Classical Mathematical Formulation
Consider a portfolio P for which the expected performance and risk are known. The
classical management portfolio problem is formulated as follows:
nix
ww
PS
i
n
i
i
ji
n
i
n
j
iji
n
i
i
x
xxxr
,....,2,1;10
1
such that
)1max(
)(
1
1 11
Where
n is the headline number of titles;
i
x is the proportion of capital invested in title i ;
i
r is the result on title i ;
ii
REr is the expected result of title i ;
ij
is the covariance of results of title i and j ;
jjiijiij
RERRERERR ,cov
w is the coefficient of risk aversion characterizing the investor: with 10 w
( 1w means a high risk aversion).
The mathematical formulation of portfolio selection problem given below is due to
Markowitz [1]. It has become the reference formulation because it had generated other
developments.
2.2 Multi-Objective Formulation
The multi-objective paradigm has emerged over the past thirty years. It is a realistic model and it
allows to cohabit several conflicting objectives (see [8, 16, 23, 24, 25]).
In view of the problem (PS), we see that it is a bi-criteria problem, which can be formulated as follow:
(BCPS)
nix
x
xx
xR
i
n
i
i
n
i
n
j
jiij
n
i
ii
,...,1;10
1
such that
min
max
1
1 1
1
We can deduce problem (PS) from (BCPS) considering an aggregation of two criteria with a weighted
sum considering weights 1
w and 2
w such that 1
w + 2
w = 1. Let 2
w = w , then 1
w = 1- w . Therefore,
the weight w expresses the importance of criterion risk that corresponds to the aversion coefficient,
hence the formulation (PS).
Simulated Annealing vs Genetic Algorithm to Portfolio Selection
International Journal of Scientific and Innovative Mathematical Research (IJSIMR) Page 20
3. METAHEURISTIC RESOLUTION METHODS
Simpressive number in literature but well known are: Simulated Annealing, Genetic Algorithm and
Tabu Search. In this article, we focus on Simulated Annealing and Genetic Algorithm.
3.1 The simulated annealing algorithm (SA) [10, 23, 26]
The probably best-known trajectory method is Simulated Annealing (SA), introduced in [26]. SA was
conceived for combinatorial problems, but can easily be used for continuous problems where the
algorithm pseudocode is given below:
3.1.1. Algorithm
Set Rmax and T0
Randomly generate current solution x0
For i=1 to Rmax do
While stopping criteria not met do
generate (neighbor to current solution)
compute and generate u (uniform random variable)
if then
end while
reduce T0
end for
3.1.2. Adaptation for BCPS
We can use simulated annealing with each of the specificity on how to create neighborhoods to solve
the problem where f is the criterion to be maximized.
A. Settings and input variables:
R : matrix values history titles I;
: number of portfolio titles;
w: coefficient of risk aversion;
: initial solution;
: coefficient of cooling;
: lenght of the cooling bear;
: initial temperature;
: maximum number of iterations;
Parameter of neighbourhood selection
V1 and V2 neighbourhood system adopted.
B. Presentation of results:
as the optimal solution;
as optimal value of
Result of the optimal portfolio:
The risk of the optimal portfolio;
The execution time.
Joël N. Kapiamba et al.
International Journal of Scientific and Innovative Mathematical Research (IJSIMR) Page 21
3.2 How Create Neighborhoods
The subtlety of this step in the simulated annealing method is great. Indeed, the construction of the
vicinity of a solution should take into account the nature of the problem and the characteristics of the
set of eligible solutions. For our problem, the set of feasible solutions is defined by:
Take a portfolio . The objective is to construct a set of interesting portfolio belonging
to , by making on elementary transformation. In what follows, we propose two procedures for
creating neighborhoods
The first is based on the definition of a rentability;
The second is based on the correlation of returns of the portfolio securities.
3.2.1. Neighborhood with threshold:
Here is our procedure to build a neighborhood of x:
A. As a preliminary point, given the trade-off between risk and return, defined in the criterion to
maximize, we will introduce the concepts of the overestimated and underestimated title. To
do so, we define a threshold rating, depending on the risk aversion w of the investor. We take:
the greatest expected return on all titles
the smallest expected return on all titles:
the threshold is defined by :
mMwrrwS )1(
B. et us put the set of portfolio titles.
We define an underestimated title as a title whose return is strictly below the
threshold .
Let be the set of underestimated title
.
Similarly we call a title overestimated when its rentability is greater than or equal to
the threshold .
We note the set of overestimated title:
.
N.B: it is trivial form a partition of .
C. A neighbourhood is constructed as follow:
It is drawn at random two titles .
If the titles are of the same nature, that is to say simultaneously overestimated
or underestimated, . Then transferring a
portion of the amount to be invested in to the amount invested in is performed
Note the rate of this transfer, we get such that:
Simulated Annealing vs Genetic Algorithm to Portfolio Selection
International Journal of Scientific and Innovative Mathematical Research (IJSIMR) Page 22
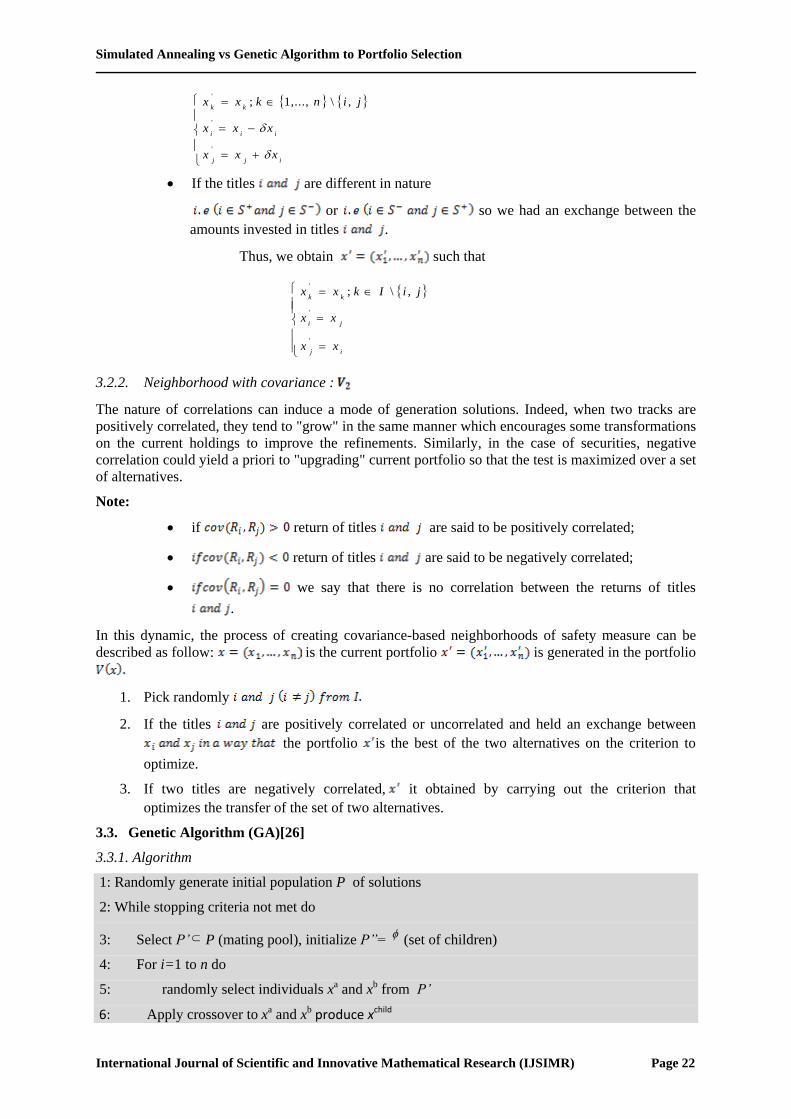
If the titles are different in nature
or so we had an exchange between the
amounts invested in titles .
Thus, we obtain such that
3.2.2. Neighborhood with covariance :
The nature of correlations can induce a mode of generation solutions. Indeed, when two tracks are
positively correlated, they tend to "grow" in the same manner which encourages some transformations
on the current holdings to improve the refinements. Similarly, in the case of securities, negative
correlation could yield a priori to "upgrading" current portfolio so that the test is maximized over a set
of alternatives.
Note:
if return of titles are said to be positively correlated;
return of titles are said to be negatively correlated;
we say that there is no correlation between the returns of titles
.
In this dynamic, the process of creating covariance-based neighborhoods of safety measure can be
described as follow: is the current portfolio is generated in the portfolio
1. Pick randomly
2. If the titles are positively correlated or uncorrelated and held an exchange between
the portfolio is the best of the two alternatives on the criterion to
optimize.
3. If two titles are negatively correlated, it obtained by carrying out the criterion that
optimizes the transfer of the set of two alternatives.
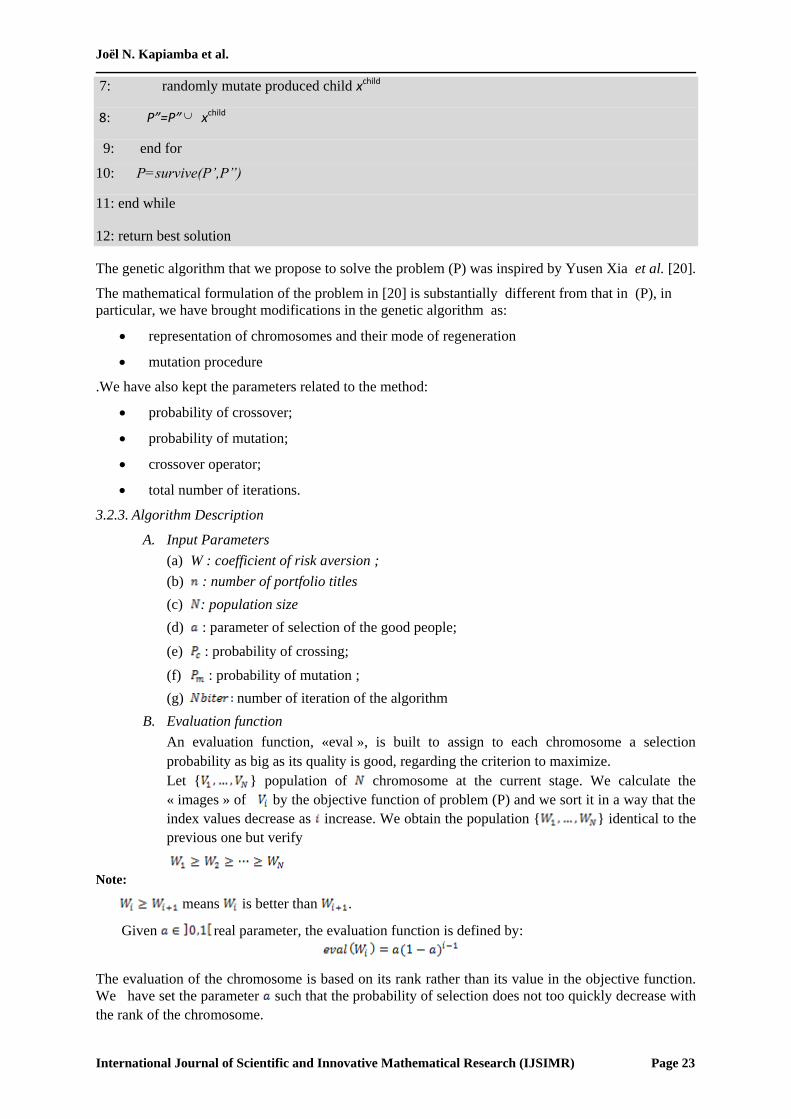
3.3. Genetic Algorithm (GA)[26]
3.3.1. Algorithm
1: Randomly generate initial population P of solutions
2: While stopping criteria not met do
3: Select P’ P (mating pool), initialize P”=
(set of children)
4: For i=1 to n do
5: randomly select individuals xa and xb from P’
6: Apply crossover to xa and xb produce xchild
ijj
iii
kk
xxx
xxx
jinkxx
'
'
',\,...,1;
ij
ji
kk
xx
xx
jiIkxx
'
'
',\;
Joël N. Kapiamba et al.
International Journal of Scientific and Innovative Mathematical Research (IJSIMR) Page 23
7: randomly mutate produced child xchild
8: P”=P” xchild
9: end for
10: P=survive(P’,P”)
11: end while
12: return best solution
The genetic algorithm that we propose to solve the problem (P) was inspired by Yusen Xia et al. [20].
The mathematical formulation of the problem in [20] is substantially different from that in (P), in
particular, we have brought modifications in the genetic algorithm as:
representation of chromosomes and their mode of regeneration
mutation procedure
.We have also kept the parameters related to the method:
probability of crossover;
probability of mutation;
crossover operator;
total number of iterations.
3.2.3. Algorithm Description
A. Input Parameters
(a) W : coefficient of risk aversion ;
(b) : number of portfolio titles
(c) : population size
(d) : parameter of selection of the good people;
(e) : probability of crossing;
(f) : probability of mutation ;
(g) number of iteration of the algorithm
B. Evaluation function
An evaluation function, «eval », is built to assign to each chromosome a selection
probability as big as its quality is good, regarding the criterion to maximize.
Let { } population of chromosome at the current stage. We calculate the
« images » of by the objective function of problem (P) and we sort it in a way that the
index values decrease as increase. We obtain the population { } identical to the
previous one but verify
Note:
means is better than .
Given real parameter, the evaluation function is defined by:
The evaluation of the chromosome is based on its rank rather than its value in the objective function.
We have set the parameter such that the probability of selection does not too quickly decrease with
the rank of the chromosome.

Simulated Annealing vs Genetic Algorithm to Portfolio Selection
International Journal of Scientific and Innovative Mathematical Research (IJSIMR) Page 24
C. Chromosomes Selection
a) Calculation of the accumulated probability of each chromosome :
b) Generation of a real at random in
N.B: We generate first randomly a number in which is then multiplied by .
c) selection of the chromosome , satisfying
d) Repeating steps b) and c) times to get a good selection of people.
e) Finally we obtain the population .
D. Crossing
a) Consider : probability of crossover.
b) To determine the parents it is generated randomly, N times a real in . is
selected as a parent if the generation of we have . This produces at
most individuals, , which are grouped in pairs:
,…. .
c) It generates a random number .
The crossing applied to the pair gives two chromosomes
, replacing . Idem for the
other selected pairs.
d) At the end of crossing we obtain the population .
E. Mutation
a) We define a parameter mutation probability. For we
generate a random number The chromosome will mutate if .
b) For each selected for mutation, a random vector is generated
.
c) The mutation consists to build the chromosome
transformation described in the initialization
procedure.
Remark
Repeating steps B) to E) time, each corresponding to an iteration of the genetic algorithm, and
we hold the best chromosome on all iterations as the optimal solution of the problem (P).
4. NUMERICAL APPLICATION
We give a numerical example to illustrate the resolution of the problem (P) by the two methods
presented earlier. For comparison, we also give the solution of the same problem obtained by the
optimization software LINGO.
Note: results of LINGO are taken from Yusen Xia et al [27]. Rentability and risk have been
recalculated on the basis of portfolios from that software.
We consider indeed, the returns of 6 titles on a history of 8 periods shown in the table below.
Titles 1 2 3 4 5 6
periods
t-7 0.04 0.14 0.13 0.12 0.18 0.15
t-6 0.07 0.06 0.13 0.04 0.06 0.04
t-5 0.09 0.08 0.11 0.18 0.22 0.08
t-4 0.13 0.15 0.15 0.13 0.15 0.06
t-3 0.14 0.11 0.10 0.19 0.14 0.13
t-2 0.17 0.13 0.07 0.16 0.06 0.06
t-1 0.21 0.10 0.14 0.14 0.08 0.10
t 0.24 0.11 0.11 0.11 0.09 0.09
Joël N. Kapiamba et al.
International Journal of Scientific and Innovative Mathematical Research (IJSIMR) Page 25
4.1. Simulated Annealing Parameters
For simulated annealing, we implement two types of neighborhood defined in (3.1.1) and use the
following parameters:
The temperature
The coefficient of cooling
The length of the landing
We consider an initial portfolio sufficiently distinct from the optimal portfolio to highlight the
performance of the algorithm.
Initial Portfolio
4.2. Genetic Algorithm Parameters
With regard to the genetic algorithm, we consider:
a population of 30 individuals
a probability of crossing
a mutation probability
an evaluation function with
We run the genetic algorithm on 50,000 iterations, delivering results for different values of coefficient
of risk aversion.
4.3. Numerical Results
In this subsection we present the results of our simulations with the caption:
Ling : results by the Lingo Optimization software
GA : the result of the genetic algorithm
SA1 : the results of simulated annealing by neighborhood with threshold
SA2 : The result of simulated annealing by neighborhood with covariance
Table1. Portfolio with coefficient of risk aversion w =1
Titles 1 2 3 4 5 6 Criterion Return risk Time
(s)
LING 0 0.2598 0.4659 0.0782 0 0.2171 -0.0004 0.1128 0.0004
SA1 0.0676 0.1423 0.5748 0.1930 0.0000 0.0222 -0.0002 0.1202 0.0003 2.61
SA2 0.0728 0.0280 0.6400 0.2329 0 0.0263 -0.0002 0.1217 0.0003 3.81
GA 0.0909 0.1425 0.5445 0.1566 0.0215 0.0440 -0.0002 0.1195 0.0003 55.6
Table2. Portfolio with coefficient of risk aversion w =0.8
Titles 1 2 3 4 5 6 Criterion Return risk Time(s)
LING 0.2925 0 0 0.7075 0 0 0.0225 0.1345 0.0018
SA1 0.3289 0 0.0346 0.6270 0.0094 0 0.0255 0.1339 0.0019 2.31
SA2 0.3217 0.0030 0.0361 0.6361 0.0030 0 0.0255 0.1339 0.0019 2.31
GA 0.3711 0.0157 0.0717 0.4896 0.0487 0.0032 0.0254 0.1324 0.0019 56.3
Table3. Portfolio with coefficient of risk aversion w =0.5
Titles 1 2 3 4 5 6 Criterion Return risk Time
(s)
LING 0.3943 0 0 0.6057 0 0 0.0664 0.1347 0.0019
SA1 0.5042 0 0 0.4958 0 0 0.0665 0.1350 0.0027 2.67
SA2 0 0 0 1 0 0 0.0658 0.1338 0.0022 3.67
GA 0.502 0.0093 0.013 0.4499 0.023 0.0028 0.0661 0.1342 0.0026 59

Simulated Annealing vs Genetic Algorithm to Portfolio Selection
International Journal of Scientific and Innovative Mathematical Research (IJSIMR) Page 26
Table 4. Portfolio with coefficient of risk aversion w =0.2
Titles 1 2 3 4 5 6 Criterion rentability risk Time
(s)
LING 0.7943 0 0 0.2057 0 0 0.1079 0.1357 0.0033
SA1 1 0 0 0 0 0 0.1081 0.1362 0.0047 2.47
SA2 0.9269 0 0 0.0731 0 0 0.1080 0.1361 0.0044 2.92
GA 0.5051 0.024 0.01 0.4197 0.0366 0.0045 0.1066 0.1337 0.0026 56
Table5. Portfolio with coefficient of risk aversion w =0.01
Titles 1 2 3 4 5 6 Criterion rentability risk Time
(s)
LING 1 0 0 0 0 0 0.1343 0.1362 0.0047
SA1 1 0 0 0 0 0 0.1348 0.1362 0.0047 2.5
SA2 0.5124 0 0 0.4876 0 0 0.1416 0.1430 0.0022 2.93
GA 0.5703 0.0278 0.0279 0.3401 0.0244 0.0096 0.1400 0.1414 0.0023 57.7
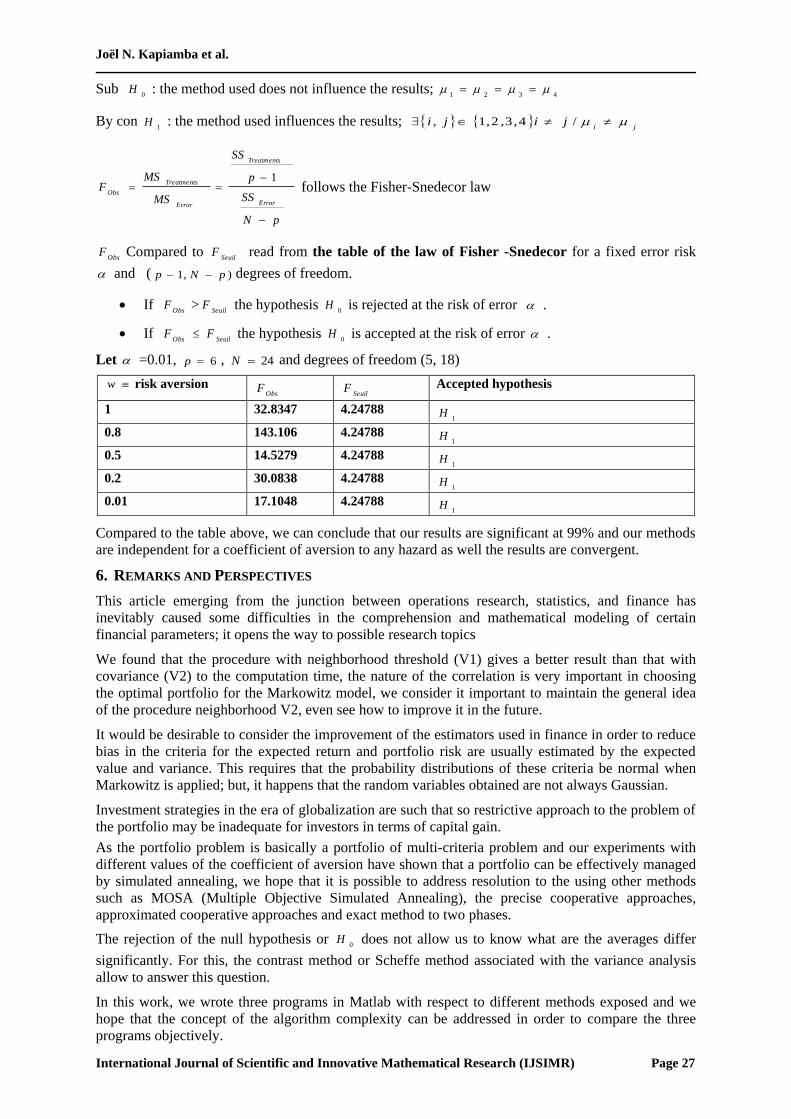
5. ANALYSIS OF RESULTS
By observing the means and variances obtained in tables 1 to 5, we find some differences between our
medium and to justify them, we use the variance analysis as a statistical estimator.
5.1. Applicability Condition of Test
Considering the size of the sample, the general form of the variance analysis is based on the Fisher's
test, and the normality of the distributions of the independent samples.
We will check two hypotheses:
The null hypothesis or H0 corresponds to the case where the distributions follow the same
normal distribution, and in other words, these differences are due to chance, the result is the
same despite the method used and there is no difference between the averages found.
The alternative hypothesis H1 means there exists at least a distribution whose average deviates
other means, that is to say, the methods are independent, which means that each method gives
a result independently to the others and each result depends on the method used.
The fundamental equation of the variance analysis
Where
TotalSS =sum of the total deviation or total variation;
TreatmentsSS =
ErrorSS =
Joël N. Kapiamba et al.
International Journal of Scientific and Innovative Mathematical Research (IJSIMR) Page 27
Sub 0
H : the method used does not influence the results; 4321
By con 1
H : the method used influences the results; ji
jiji /4,3,2,1,
pN
SS
p
SS
MS
MSF
Error
Treatments
Error
Treatments
Obs
1 follows the Fisher-Snedecor law
ObsF Compared to
SeuilF read from the table of the law of Fisher -Snedecor for a fixed error risk
and ( ),1 pNp degrees of freedom.
If Obs
F >Seuil
F the hypothesis 0
H is rejected at the risk of error .
If Obs
FSeuil
F the hypothesis 0
H is accepted at the risk of error .
Let =0.01, 6p , 24N and degrees of freedom (5, 18)
w risk aversion Obs
F Seuil
F Accepted hypothesis
1 32.8347 4.24788 1
H
0.8 143.106 4.24788 1
H
0.5 14.5279 4.24788 1
H
0.2 30.0838 4.24788 1
H
0.01 17.1048 4.24788 1
H
Compared to the table above, we can conclude that our results are significant at 99% and our methods
are independent for a coefficient of aversion to any hazard as well the results are convergent.
6. REMARKS AND PERSPECTIVES
This article emerging from the junction between operations research, statistics, and finance has
inevitably caused some difficulties in the comprehension and mathematical modeling of certain
financial parameters; it opens the way to possible research topics
We found that the procedure with neighborhood threshold (V1) gives a better result than that with
covariance (V2) to the computation time, the nature of the correlation is very important in choosing
the optimal portfolio for the Markowitz model, we consider it important to maintain the general idea
of the procedure neighborhood V2, even see how to improve it in the future.
It would be desirable to consider the improvement of the estimators used in finance in order to reduce
bias in the criteria for the expected return and portfolio risk are usually estimated by the expected
value and variance. This requires that the probability distributions of these criteria be normal when
Markowitz is applied; but, it happens that the random variables obtained are not always Gaussian.
Investment strategies in the era of globalization are such that so restrictive approach to the problem of
the portfolio may be inadequate for investors in terms of capital gain.
As the portfolio problem is basically a portfolio of multi-criteria problem and our experiments with
different values of the coefficient of aversion have shown that a portfolio can be effectively managed
by simulated annealing, we hope that it is possible to address resolution to the using other methods
such as MOSA (Multiple Objective Simulated Annealing), the precise cooperative approaches,
approximated cooperative approaches and exact method to two phases.
The rejection of the null hypothesis or 0
H does not allow us to know what are the averages differ
significantly. For this, the contrast method or Scheffe method associated with the variance analysis
allow to answer this question.
In this work, we wrote three programs in Matlab with respect to different methods exposed and we
hope that the concept of the algorithm complexity can be addressed in order to compare the three
programs objectively.
Simulated Annealing vs Genetic Algorithm to Portfolio Selection
International Journal of Scientific and Innovative Mathematical Research (IJSIMR) Page 28
We experienced our methods in portfolio management with a sample of six and eight titles, but
hopefully in the future it would be possible to see if there is convergence for a sample of 30 titles vis-
à-vis of any one portfolio.
To be more realistic, it would be interesting for better modeling to take into account tax (VAT,
income tax property values, etc.)
Note that our simulation is a daily fact and for significant results, various sets of parameters must be
considered in order to strengthen the robustness of the proposed solution.
7. CONCLUSION
Our goal in this paper was to see how the portfolio could be managed with Simulated Annealing
method and compare the result with the one of genetic algorithm one. The portfolio problem is
basically a multi-criteria one, and our experiments with different values of aversion coefficient have
shown that a portfolio can be managed efficiently when Simulated Annealing is used. Note that from
the variance analysis, we observe that both different used methods are independent and the obtained
results are related to the respective used methods.
We conclude that the above mentioned result is interesting in the mathematics and finance field. This
is the proof that common metaheuristics which are used to approximate solution to hard combinatorial
optimization problem, are often devoted to find optimum-close solution or potential efficient solution
set. An adapted tool in solving problem that any investor may face when confronted to risky financial
assets: to maximize his profit and minimize the risk.
Way for further research in this field is double: first hand to use metrics and indicators for verifying of
obtained solutions quality and second and to hybridize both methods to solve portfolio selection
problem.
REFERENCES
[1]. Markowitz H. Portfolio selection. Journal of Finance, 7: 77-91, (1952).
[2]. Damadaran A. Finance d’entreprise théorie et pratique. De Boeck, 2006.
[3]. Berk J. and Demarzo P. Finance d’entreprise. De Boeck, 2011.
[4]. Zhufang W., Donghong C. A Hybrid Algorithm Based on Genetic Algorithm and Simulated
Annealing for Solving Portfolio Problem. International Conference on Business Intelligence and
Financial Engineering. Management School, Shenyang University of Technology, Shenyang,
100178, China, 2009.
[5]. L’Hoir H. Approche multicritère pour la gestion de portefeuille. Travail de Fin d’Etudes, Faculté
Polytechnique de Mons/Belgique, juin 1987.
[6]. Parra A., Terol A., and Rodriguez Uria M.V. A fuzzy goal programming approach to portfolio
selection. European Journal of Operational Reseach 133, 287-297, (2001).
[7]. Aftalion F., Poncet P. and Portait R.: La théorie moderne du portefeuille. Collection Que sais-je?
Presse Universitaire de France (PUF), Décembre 1998.
[8]. Bilel J. Asset allocation and portfolio optimization problems with metaheuristics: a literature
survey. Published in: Business Excellence and Management, 3(4): 38-56, (2013).
[9]. Mark T. Leung and al. Using investment portfolio return to combine forescasts : A
multiobjective approach. European Journal of Operational Research 134, 84-102, (2001).
[10]. Fogarasi N. and Levendovszky J. Sparse, mean reverting portfolio selection using simulated
annealing. Algorithmic Finance, 2(3-4): 197-211, 2013.
[11]. Thombiano E.B. La gestion du portefeuille par la méthode du recuit simulé. Mémoire de DEA,
Université de Ouagadougou, Burkina Faso, 2002.
Joël N. Kapiamba et al.
International Journal of Scientific and Innovative Mathematical Research (IJSIMR) Page 29
[12]. Ogryczack W. Multiple criteria linear Programming model for portfolio selection. Annals of
Operations Research 97: 143-162, (2000).
[13]. Sang M.L. and Delton L.C. Goal programming for portfolio selection. The Journal of Portfolio
Management,pp 22-26, Spring 1980.
[14]. Spronk J.: Interaction multiple goal programming for capital budgeting and financial planning.
Delfsche Uitgevers Maatschappij B.V., Delft, 263p, 1980.
[15]. Morin C.: Optimisation multiobjectif de l’allocation stratégique par un algorithme génétique.
Mémoire présenté pour l’obtention du diplôme d’actuaire, Université Claude Bernard-Lyon1, 7
Janvier 2014.
[16]. Hurson C. and Zopounidis C.: Gestion de portefeuille et Analyse multicritère. Edition
Economica 1997.
[17]. Teghem J. and Pirlot M. Résolution de problèmes de Recherche Opérationnelle par les
métaheuristiques. Lavoisier, 2003.
[18]. William W.S. Portfolio Theory and Capital Markets. Mc. Graw-Hill series in finance 1970 And
2000.
[19]. Xiaoqiang C., Kok-Lay T., Xioqi Y. and Xun Yu Z.: Portfolio optimization under a minimax
ruler. Management science 2000 INFORMS. Vol.46 n°7, 957-972, July 2000.
[20]. Xia Y., Liu B., Wang S., Lai K.K. A model for portfolio selection with order of expected returns.
Computers & Operations Research. 27, 409-422, (2000).
[21]. Sang M.L. and Lerro A.J. Optimisation of the Portfolio selection for mutual funds. The Journal
of Finance, 28: 1087-1101, (1973).
[22]. Markowitz H.M.: Portfolio Selection, efficient diversification of investment. New Haven and
London, Yale University press, second printing, 1970.
[23]. Kapiamba J. Revue des principales méthodes de résolution du problème d’affectation multi-
objectif. Mémoire de DEA, Université de Kinshasa, 2011.
[24]. Ulungu B.E.L. and Teghem J. Multi-Objective combinatorial optimization problems: a survey.
Journal of Multi-Criteria Decision Aid 83-104, 1994.
[25]. Ulungu E.L., Teghem J. and Fortemps Ph. Heuristic for multiobjective combinatorial
optimization problems by simulated annealing, In Gu, J.J. Chen, G., Wei, Q. and Wang, S.(eds),
MCDM: Theory and Application, Sci-Tech, Windsor, 229-238, (1995).
[26]. Manfred G., Dietmar M. and Enrico S. Numerical Methods and Optimization in Finance.
Academic Press, 2011, August 25.

Simulated Annealing vs Genetic Algorithm to Portfolio Selection
International Journal of Scientific and Innovative Mathematical Research (IJSIMR) Page 30
AUTHORS’ BIOGRAPHY
Joël Kapiamba Ntumba is PhD student at university of Kinshasa. His main fields
are Operations Research, Decision-making Analysis, Multi-Criteria Decision-making
Aid, Statistics, Multi-objective Combinatorial Optimization, Computer programming,
Portfolio Management Theory, and Mathematical Programming.
Berthold Ulungu Ekunda Lukata is Professor at Institut Supérieur des Techniques
Appliquées (High College of Applied Engineering), Kinshasa (Democratic Republic
of the Congo). He worked at MATHRO laboratory (University of Mons) for many
years and has taught at many colleges and universities in DR Congo, Algeria,
Burkina Faso, and Belgium. In collaboration with Jacques Teghem, he was the first to
formalize use of metaheuristics (simulated annealing, taboo search, genetic
algorithm) for solving Multi-Objective Combinatorial Optimization problems. He is a fellow
(executive secretary) of two Applied Mathematics societies: ROCARO and RAMAD.
Pascal Mubenga Kampotu is Professor at University of Kinshasa where he has
taught Operations Research, General topology, and Functional analysis for forty
years. He is a PhD from Western Michigan University (Kalamazoo, Michigan, USA,
1972). His works are essentially related to General Topology, Functional Analysis,
optimization, Mathematical programming, and Graphs Theory.