Embed Size (px)
Citation preview
Review Article
Simplified Vibration Model and analysisof a single-conductor transmissionline with dampers
O Barry1, R Long1 and DCD Oguamanam2
Abstract
A novel model is developed for a vibrating single-conductor transmission line carrying Stockbridge dampers.
Experiments are performed to determine the equivalent viscous damping of the damper. This damper is then reduced
to an equivalent discrete mass-spring-mass and viscous damping system. The equations of motion of the model are
derived using Hamilton’s principle and explicit expressions are determined for the frequency equation, and mode shapes.
The proposed model is verified using experimental and finite element results from the literature. This proposed model
excellently captures free vibration characteristics of the system and the vibration level of the conductor, but performs
poorly in regard to the vibration of the counterweights.
Keywords
Aeolian vibration, Strouhal frequency, messenger, Stockbridge damper, equivalent viscous damping, mass-spring-damper
Date received: 4 August 2015; accepted: 14 March 2016
Introduction
Aeolian vibration of transmission lines has been asubject of study for many years. It occurs at what iscommonly referred to as Strouhal frequency which isproportional to the wind speed and inversely propor-tional to the diameter of the conductor. The Strouhalfrequency varies between 3 Hz and 150Hz and causesa peak-to-peak amplitude of up to one conductordiameter.1 Stockbridge dampers are often employedto dampen Aeolian vibration. Their effectivenessis dependent on their position on the conductor,their overall characteristics, and the characteristicsof the conductor.
The model of a conductor can be idealized as anaxially loaded Euler-Bernoulli beam subjected to anexciting force by the damper. Claren and Diana2 wereamong the earliest investigators to examine Aeolianvibration of transmission lines. They analytically andexperimentally determined the natural frequenciesof the conductor without damping. The effect of theconductor flexural rigidity on natural frequencies wasinvestigated by Dhotard et al.3 The differences in thevalues of natural frequencies observed in the simplysupported end cable (with and without flexural rigid-ity) were less than 3%. They hypothesized that thelocation of the dampers had negligible effect on thestrain for low frequency excitation (i.e. low windspeed). Barbieri et al.4 performed free vibration
analysis of a single conductor without dampingusing Galerkin method and experimentally validatedtheir results. Barry et al.5,6 used the finite element(FE) method to study the vibration of a transmissionline with an attached Stockbridge damper. Theyobserved that asymmetric Stockbridge dampers weremore effective at higher modes.
Many authors studied the forced vibration of trans-mission lines using methods based on impedance models.Tompkins et al.7 examined the interaction of a conductorwith a damper using the electrical–mechanical imped-ance method. That model was reformulated in solelymechanical-impedance terms by Rawlins8 and thenused to analyse conductor vibrations. Further extensionof the model was proposed by Nigol and Houston9 whoincluded the boundary conditions at both ends and con-sidered the arbitrary location of the excitation source.Their model was experimentally verified and it wasused to demonstrate optimum damping concepts.
1College of Engineering and Technology, Central Michigan University,
Mt Pleasant, MI, USA2Department of Mechanical and Industrial Engineering, Ryerson
University, Toronto, Ontario, Canada
Corresponding author:
O Barry, Central Michigan University, ET 100, School of Engineering &
Technology, Mt Pleasant, MI 48859, USA.
Email: [email protected]
Proc IMechE Part C:
J Mechanical Engineering Science
0(0) 1–13
! IMechE 2016
Reprints and permissions:
sagepub.co.uk/journalsPermissions.nav
DOI: 10.1177/0954406216660736
pic.sagepub.com
by guest on July 17, 2016pic.sagepub.comDownloaded from
Energy balance method (EBM) is another methodused to examine the forced-vibration analysis of trans-mission lines. The vibration level is evaluated by deter-mining the balance between the energy imparted to theconductor by the wind and the energy dissipated by theconductor (via conductor self-damping) and the addeddampers. Oliveira and Preire10 developed a dynamicalmodel of Aeolian vibration to predict the amplitude ofsteady-state motion of the conductor based on EBM.They included a method for solving the time-dependentNavier–Stokes equation. Kraus and Hagedorn11 alsoemployed the EBM to examine vibration magnitudes.Their results were compared to those obtained from awind tunnel experiment. The optimal position ofStockbridge dampers along the span of the conductorwas investigated by Verma and Hagedorn.12 To avoidlocating dampers on nodes for system natural frequen-cies of less than 50 Hz, they analytically showed that itwas sufficient to maintain approximately 1m max-imum distance between adjacent dampers.
A major drawback of the impedance and EBMapproaches is the limitation to only one-way couplingbetween the conductor and damper. Specifically, thedynamics of the damper influenced that of the con-ductor but not the converse. An attempt at modellinga two-way coupling scenario was reported in Barryet al.5,6,13,14 The messenger cable and counterweightswere modelled as two cantilevered Euler-Bernoullibeams with rigid tip masses. The system was con-nected to the conductor via a rigid link. While theefficacy of the model was demonstrated, it was verycomplicated compared with that based on EBM orthe impedance method. It was also computationallyintensive because of the numerous degrees of freedomemployed. The present exposition addresses theseshortcomings by replacing the continuum dampermodel with an equivalent discrete system.
The Stockbridge damper was reduced to an equiva-lent mass-spring-mass and viscous damping system.Hence, the transmission line system was modelled asan axially loaded Euler-Bernoulli beam with in-spanmass-spring-mass and viscous damping system.Numerous researchers (see Lin and Tsai,15 Ercoliand Laura,16 Liu and Huang,17 Wu and Lin,18
Gurgoze19 and Cha20 and the references mentionedtherein) have investigated the vibration of beamswith an attached in-span mass and/or spring-masssystem. In spite of these interests, there was no inves-tigation where the beam was subjected to an axial
load while supporting an in-span mass-spring-massand viscous damping system.
In developing the equivalent model, experimentswere performed to determine the equivalent viscousdamping using the forced response method. Theequivalent mass and stiffness of the messenger weredetermined on the premise that the damper consistedof the two cantilevered beams with a tip mass. Theequations of motion were derived using Hamiltonprinciple. Explicit expressions were presented for thecharacteristic equation, and mode shapes. The modelwas validated using both the numerical and experi-mental results in the literature. Parametric studieswere conducted to investigate the effect of the magni-tude and location of the damper on the natural fre-quency. The role of the Strouhal frequency on thevibration response was also examined.
Description of the system
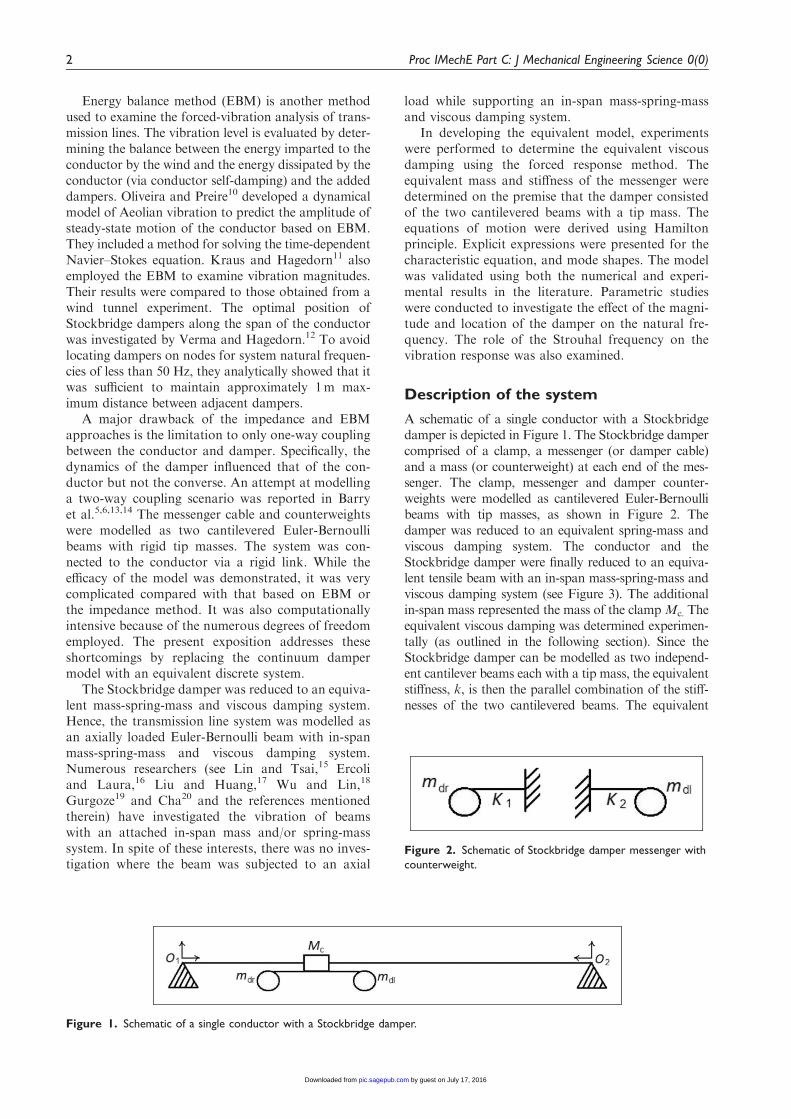
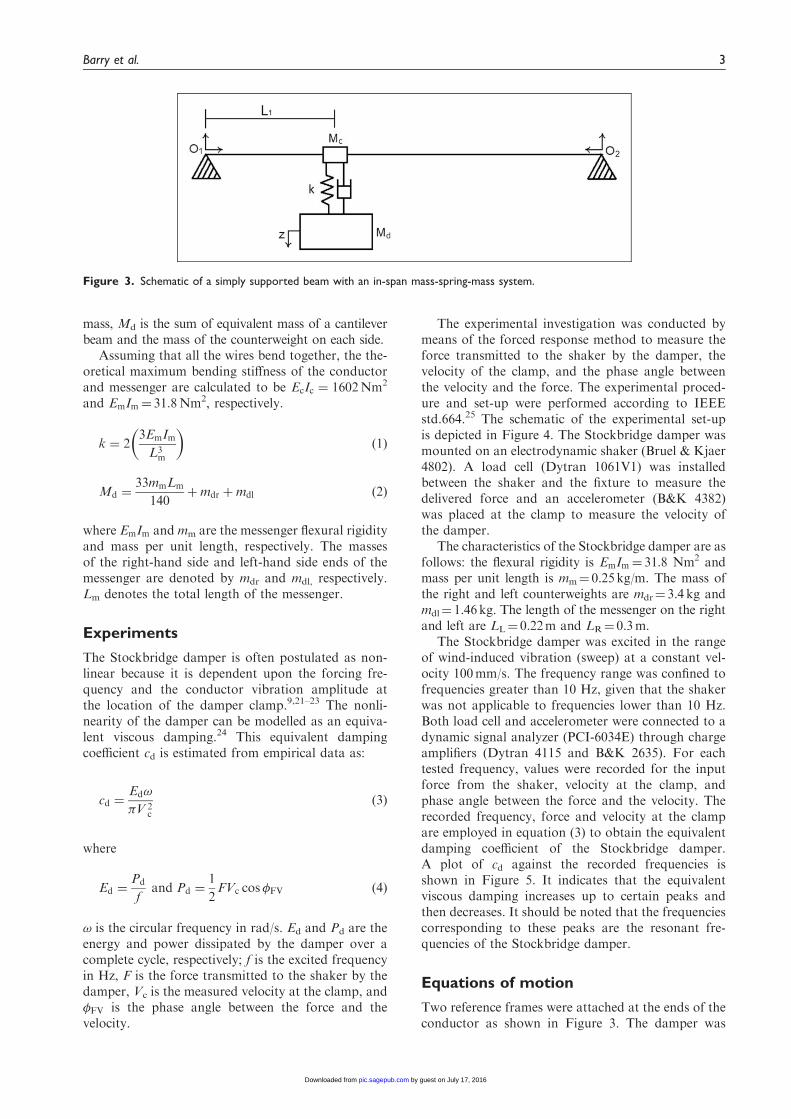
A schematic of a single conductor with a Stockbridgedamper is depicted in Figure 1. The Stockbridge dampercomprised of a clamp, a messenger (or damper cable)and a mass (or counterweight) at each end of the mes-senger. The clamp, messenger and damper counter-weights were modelled as cantilevered Euler-Bernoullibeams with tip masses, as shown in Figure 2. Thedamper was reduced to an equivalent spring-mass andviscous damping system. The conductor and theStockbridge damper were finally reduced to an equiva-lent tensile beam with an in-span mass-spring-mass andviscous damping system (see Figure 3). The additionalin-span mass represented the mass of the clampMc. Theequivalent viscous damping was determined experimen-tally (as outlined in the following section). Since theStockbridge damper can be modelled as two independ-ent cantilever beams each with a tip mass, the equivalentstiffness, k, is then the parallel combination of the stiff-nesses of the two cantilevered beams. The equivalent
Figure 1. Schematic of a single conductor with a Stockbridge damper.
Figure 2. Schematic of Stockbridge damper messenger with
counterweight.
2 Proc IMechE Part C: J Mechanical Engineering Science 0(0)
by guest on July 17, 2016pic.sagepub.comDownloaded from
mass, Md is the sum of equivalent mass of a cantileverbeam and the mass of the counterweight on each side.
Assuming that all the wires bend together, the the-oretical maximum bending stiffness of the conductorand messenger are calculated to be EcIc ¼ 1602Nm2
and EmIm¼ 31.8Nm2, respectively.
k ¼ 23EmImL3m
� �ð1Þ
Md ¼33mmLm
140þmdr þmdl ð2Þ
where EmIm and mm are the messenger flexural rigidityand mass per unit length, respectively. The massesof the right-hand side and left-hand side ends of themessenger are denoted by mdr and mdl, respectively.Lm denotes the total length of the messenger.
Experiments
The Stockbridge damper is often postulated as non-linear because it is dependent upon the forcing fre-quency and the conductor vibration amplitude atthe location of the damper clamp.9,21–23 The nonli-nearity of the damper can be modelled as an equiva-lent viscous damping.24 This equivalent dampingcoefficient cd is estimated from empirical data as:
cd ¼Ed!
�V 2c
ð3Þ
where
Ed ¼Pd
fand Pd ¼
1
2FVc cos�FV ð4Þ
! is the circular frequency in rad/s. Ed and Pd are theenergy and power dissipated by the damper over acomplete cycle, respectively; f is the excited frequencyin Hz, F is the force transmitted to the shaker by thedamper, Vc is the measured velocity at the clamp, and�FV is the phase angle between the force and thevelocity.
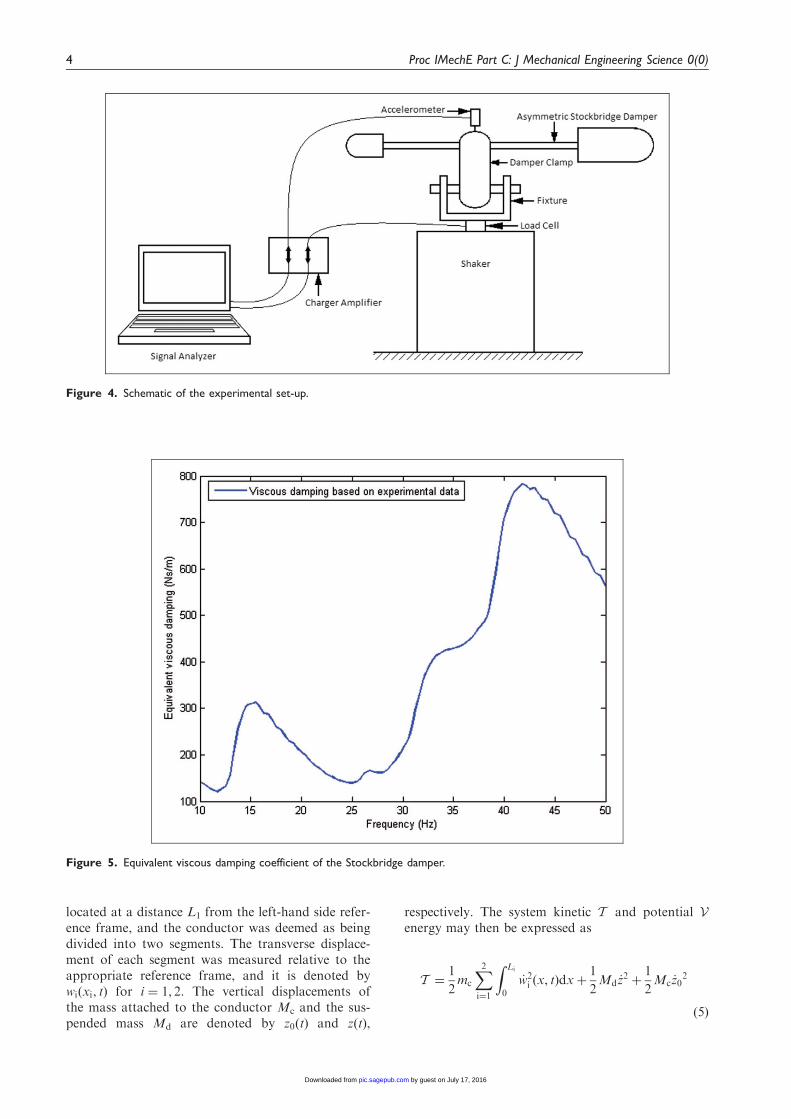
The experimental investigation was conducted bymeans of the forced response method to measure theforce transmitted to the shaker by the damper, thevelocity of the clamp, and the phase angle betweenthe velocity and the force. The experimental proced-ure and set-up were performed according to IEEEstd.664.25 The schematic of the experimental set-upis depicted in Figure 4. The Stockbridge damper wasmounted on an electrodynamic shaker (Bruel & Kjaer4802). A load cell (Dytran 1061V1) was installedbetween the shaker and the fixture to measure thedelivered force and an accelerometer (B&K 4382)was placed at the clamp to measure the velocity ofthe damper.
The characteristics of the Stockbridge damper are asfollows: the flexural rigidity is EmIm¼ 31.8 Nm2 andmass per unit length is mm¼ 0.25kg/m. The mass ofthe right and left counterweights are mdr¼ 3.4 kg andmdl¼ 1.46kg. The length of the messenger on the rightand left are LL¼ 0.22m and LR¼ 0.3m.
The Stockbridge damper was excited in the rangeof wind-induced vibration (sweep) at a constant vel-ocity 100mm/s. The frequency range was confined tofrequencies greater than 10 Hz, given that the shakerwas not applicable to frequencies lower than 10 Hz.Both load cell and accelerometer were connected to adynamic signal analyzer (PCI-6034E) through chargeamplifiers (Dytran 4115 and B&K 2635). For eachtested frequency, values were recorded for the inputforce from the shaker, velocity at the clamp, andphase angle between the force and the velocity. Therecorded frequency, force and velocity at the clampare employed in equation (3) to obtain the equivalentdamping coefficient of the Stockbridge damper.A plot of cd against the recorded frequencies isshown in Figure 5. It indicates that the equivalentviscous damping increases up to certain peaks andthen decreases. It should be noted that the frequenciescorresponding to these peaks are the resonant fre-quencies of the Stockbridge damper.
Equations of motion
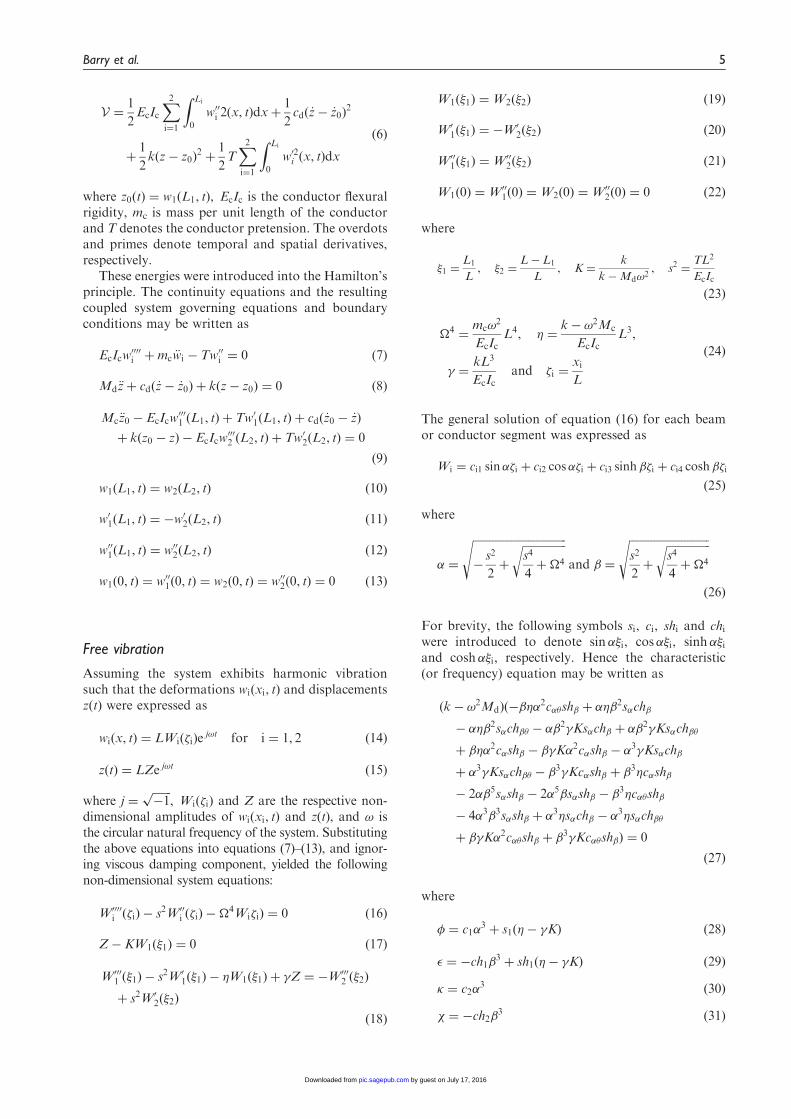
Two reference frames were attached at the ends of theconductor as shown in Figure 3. The damper was
Figure 3. Schematic of a simply supported beam with an in-span mass-spring-mass system.
Barry et al. 3
by guest on July 17, 2016pic.sagepub.comDownloaded from
located at a distance L1 from the left-hand side refer-ence frame, and the conductor was deemed as beingdivided into two segments. The transverse displace-ment of each segment was measured relative to theappropriate reference frame, and it is denoted bywiðxi, tÞ for i ¼ 1, 2. The vertical displacements ofthe mass attached to the conductor Mc and the sus-pended mass Md are denoted by z0ðtÞ and z(t),
respectively. The system kinetic T and potential Venergy may then be expressed as
T ¼1
2mc
X2i¼1
Z Li
0
_w2i ðx, tÞdxþ
1
2Md _z2 þ
1
2Mc _z0
2
ð5Þ
Figure 5. Equivalent viscous damping coefficient of the Stockbridge damper.
Figure 4. Schematic of the experimental set-up.
4 Proc IMechE Part C: J Mechanical Engineering Science 0(0)
by guest on July 17, 2016pic.sagepub.comDownloaded from
V ¼1
2EcIc
X2i¼1
Z Li
0
w00i 2ðx, tÞdxþ1
2cdð _z� _z0Þ
2
þ1
2kðz� z0Þ
2þ1
2TX2i¼1
Z Li
0
w02i ðx, tÞdx
ð6Þ
where z0ðtÞ ¼ w1ðL1, tÞ, EcIc is the conductor flexuralrigidity, mc is mass per unit length of the conductorand T denotes the conductor pretension. The overdotsand primes denote temporal and spatial derivatives,respectively.
These energies were introduced into the Hamilton’sprinciple. The continuity equations and the resultingcoupled system governing equations and boundaryconditions may be written as
EcIcw0000i þmc €wi � Tw00i ¼ 0 ð7Þ
Md €zþ cdð _z� _z0Þ þ kðz� z0Þ ¼ 0 ð8Þ
Mc €z0 � EcIcw0001 ðL1, tÞ þ Tw01ðL1, tÞ þ cdð _z0 � _zÞ
þ kðz0 � zÞ � EcIcw0002 ðL2, tÞ þ Tw02ðL2, tÞ ¼ 0
ð9Þ
w1ðL1, tÞ ¼ w2ðL2, tÞ ð10Þ
w01ðL1, tÞ ¼ �w02ðL2, tÞ ð11Þ
w001ðL1, tÞ ¼ w002ðL2, tÞ ð12Þ
w1ð0, tÞ ¼ w001ð0, tÞ ¼ w2ð0, tÞ ¼ w002ð0, tÞ ¼ 0 ð13Þ
Free vibration
Assuming the system exhibits harmonic vibrationsuch that the deformations wiðxi, tÞ and displacementsz(t) were expressed as
wiðx, tÞ ¼ LWið�iÞej!t for i ¼ 1, 2 ð14Þ
zðtÞ ¼ LZe j!t ð15Þ
where j ¼ffiffiffiffiffiffiffi�1p
, Wið�iÞ and Z are the respective non-dimensional amplitudes of wiðxi, tÞ and z(t), and ! isthe circular natural frequency of the system. Substitutingthe above equations into equations (7)–(13), and ignor-ing viscous damping component, yielded the followingnon-dimensional system equations:
W0000i ð�iÞ � s2W00i ð�iÞ ��4Wi�iÞ ¼ 0 ð16Þ
Z� KW1ð�1Þ ¼ 0 ð17Þ
W0001 ð�1Þ � s2W01ð�1Þ � �W1ð�1Þ þ �Z ¼ �W0002 ð�2Þ
þ s2W02ð�2Þ
ð18Þ
W1ð�1Þ ¼W2ð�2Þ ð19Þ
W01ð�1Þ ¼ �W02ð�2Þ ð20Þ
W001ð�1Þ ¼W002ð�2Þ ð21Þ
W1ð0Þ ¼W001ð0Þ ¼W2ð0Þ ¼W002ð0Þ ¼ 0 ð22Þ
where
�1 ¼L1
L, �2 ¼
L� L1
L, K ¼
k
k�Md!2, s2 ¼
TL2
EcIc
ð23Þ
�4 ¼mc!
2
EcIcL4, � ¼
k� !2Mc
EcIcL3,
� ¼kL3
EcIcand �i ¼
xiL
ð24Þ
The general solution of equation (16) for each beamor conductor segment was expressed as
Wi ¼ ci1 sin��i þ ci2 cos��i þ ci3 sinh �i þ ci4 cosh �i
ð25Þ
where
� ¼
ffiffiffiffiffiffiffiffiffiffiffiffiffiffiffiffiffiffiffiffiffiffiffiffiffiffiffiffiffiffiffiffiffiffi�s2
2þ
ffiffiffiffiffiffiffiffiffiffiffiffiffiffiffiffis4
4þ�4
rsand ¼
ffiffiffiffiffiffiffiffiffiffiffiffiffiffiffiffiffiffiffiffiffiffiffiffiffiffiffiffiffis2
2þ
ffiffiffiffiffiffiffiffiffiffiffiffiffiffiffiffis4
4þ�4
rs
ð26Þ
For brevity, the following symbols si, ci, shi and chiwere introduced to denote sin ��i, cos��i, sinh ��iand cosh��i, respectively. Hence the characteristic(or frequency) equation may be written as
ðk� !2MdÞð���2c�sh þ ��
2s�ch
� ��2s�ch � �2�Ks�ch þ �
2�Ks�ch
þ ��2c�sh � �K�2c�sh � �
3�Ks�ch
þ �3�Ks�ch � 3�Kc�sh þ
3�c�sh
� 2�5s�sh � 2�5s�sh � 3�c�sh
� 4�33s�sh þ �3�s�ch � �
3�s�ch
þ �K�2c�sh þ 3�Kc�shÞ ¼ 0
ð27Þ
where
� ¼ c1�3 þ s1ð�� �KÞ ð28Þ
� ¼ �ch13 þ sh1ð�� �KÞ ð29Þ
� ¼ c2�3 ð30Þ
¼ �ch23 ð31Þ
Barry et al. 5
by guest on July 17, 2016pic.sagepub.comDownloaded from
c� ¼ cos�, c� ¼ cosð�f�1 � �2gÞ, s� ¼ sin�, ch ¼cosh, sh ¼ sinh , and ch� ¼ coshðf�1 � �2gÞ. Thecharacteristic equation is multiplicatively decomposedinto a component that yielded the natural frequencyof the suspended simple discrete spring-mass sys-tem and another that provided the frequency of themore complex system. The shape functions are nowwritten as
W1ð�1Þ ¼ c11 sin��1 ð32Þ
W2ð�2Þ ¼ c11s1s2sin ��2 ð33Þ
Forced vibration
Given that the validation of the forced response wasbased on the experiment reported in Nigol andHouston,9 the excitation force was from the mid-span located at the electrodynamic shaker. Thisforce can be expressed as Fðx, tÞ ¼ f ðtÞ�ð� � 0:5Þ, andthe forced-vibration equations may be written as
mc €wþ EcIcwIV � Tw
00
þ �ðx� L1Þ�Mc €w:
þkðw� zÞ þ cdð _w� _zÞ�¼ Fðx, tÞ� x�
L
2
� �ð34Þ
Md €zþ k�z� wðL1Þ
�þ cd
�_z� _wðL1Þ
�¼ 0 ð35Þ
The solutions of equations (34) and (35) wereobtained using mode superposition principle. Thedeflection of the beam was assumed as
wðx, tÞ ¼ LX1i¼1
Wið�ÞqiðtÞ ð36Þ
zðtÞ ¼ LZiqiðtÞ ð37Þ
where qiðtÞs are the generalized displacements andWið�Þ are the mode shapes
Substituting equations (36) and (37) into equations(34) and (35), then projecting onto the jth eigenfunc-tion and using the classical orthonormality condi-tions, the following equation was obtained
€qj þ cj _qj þ !2j qj ¼ Qj for j ¼ 1, 2 . . . ð38Þ
where !j is the system natural frequency and cj and Qj
are given as
cj ¼cd
�jmcLW1jð�1Þ � Zj
� �2ð39Þ
Qj ¼1
�jmcLFðx, tÞW2j �2 ¼ 0:5ð Þ ð40Þ
and
�j ¼
Z �1
0
W21jd�1 þ
Z �2
0
W22jd�2
þ1
mL
�W2
1jð�1ÞMc þ Z2jMd
� ð41Þ
Equation (38) was solved using Runge-Kutta numer-ical integration method, and the vibration response ofthe conductor and the damper were determined usingequations (36) and (37), respectively.
Numerical simulation
The free vibration analyses were based on a795-KCMIL-DRAKE-ACSR conductor with thefollowing parameters: conductor diameter dc¼28.1mm, flexural rigidity EcIc ¼ 1602 Nm2, massper unit length mc¼ 1.6286 kg/m, and the tensionT¼ 27,840N. The Stockbridge damper data were pro-vided in ‘Experiments’ section. The parameters of theequivalent reduced model were: suspended massMd¼ 4.83 kg, clamp mass Mc¼ 0.2 kg and equivalentspring stiffness k¼ 1356.96N/m.
The first 10 natural frequencies are tabulated inTable 1 for a given conductor length of 27.25m. Theresults in the second column were obtained using equa-tion (27), the frequency equation. The third columnrepresents the results obtained via a FE implementa-tion of the conductor and mass-spring-mass model.A good agreement was observed between the valuesof the exact solution and the FE method. This obser-vation is true for the results in Barry et al.,5 whichare presented in the fourth column. The second nat-ural frequency was not captured in Barry et al.5
This frequency, 16.5798 rad/s, was in close proximity
Table 1. The first 10 natural frequencies obtained using
various methods for conductor in-span mass Mc¼ 0.2 kg,
L¼ 27.25 m and damper location �1¼ 0.05.
Natural frequency (Hz)
Mode Present
Finite
element
Barry
et al.5Bare
beam
1 2.3845 2.3845 2.3981 2.4011
2 2.6384 2.6387 – 4.8077
3 4.8164 4.8164 4.7820 7.2252
4 7.2337 7.2337 7.1263 9.6593
5 9.6663 9.6663 9.3843 12.1150
6 12.1182 12.1182 11.5202 14.5980
7 14.5942 14.5943 13.6375 17.1132
8 17.0992 17.0994 15.9025 19.6657
9 19.6385 19.6389 18.3324 22.2607
10 22.2172 22.2181 20.8802 24.9027
6 Proc IMechE Part C: J Mechanical Engineering Science 0(0)
by guest on July 17, 2016pic.sagepub.comDownloaded from
to that of the suspended spring-mass system (i.e. ! ¼ffiffiffiffiffikMd
q� 2:6674 Hz), and its absence may be explained
by their formulation method. The damper employed inBarry et al.5 was as a system comprising two independ-ent beams that were cantilevered to a rigid link whichwas connected to the conductor. Each cantileveredbeam modelled a segment of the messenger and carrieda tip mass which represented the counterweight. Thebare beam frequencies were obtained by using equation(27) and setting the Md, Mc and k to be zero.
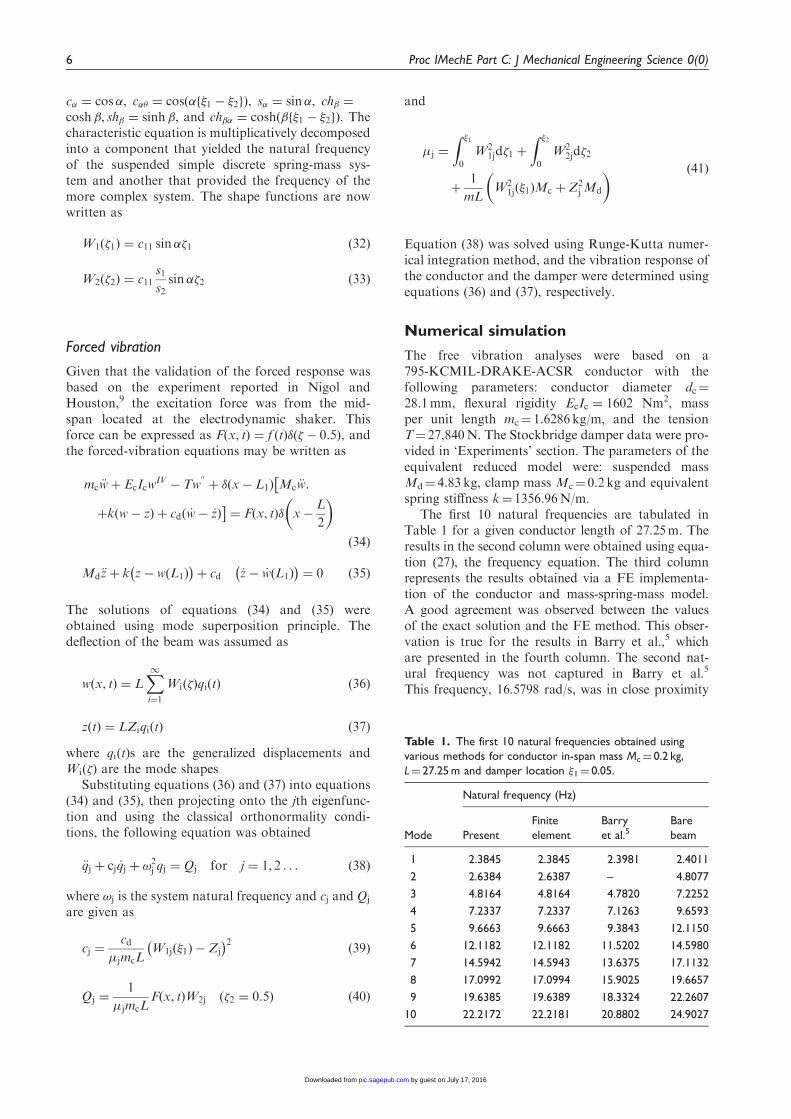
A plot of the mode shapes corresponding to thelowest five mode shapes of the system is depicted inFigure 6. Except for the second mode shape, thesemode shapes can be related to the mode shapes ofthe bare beam. As observed earlier, the second modefrequency was in the proximity of the natural fre-quency of the suspended spring-mass system. It isconjectured that the inertia/mass of the damper effect-ively divided the conductor into two segments.
For a given conductor length of 200m, the influ-ences of the relative magnitudes of the in-span massMc and the suspended mass Md on the system naturalfrequencies were examined by maintaining their totalsum constant – in the reported simulation Mc þMd¼
5 kg. The results are tabulated in Table 2. Usingthe scenario where the two masses are equal as a ref-erence, it was observed that increasing the in-spanmass Mc (and simultaneously decreasing the sus-pended mass Md in order to maintain the constanttotal mass condition) increased the system naturalfrequencies of all five modes. This is plausible because
increasing the in-span mass effectively increased thesystem stiffness (via the segmentation).
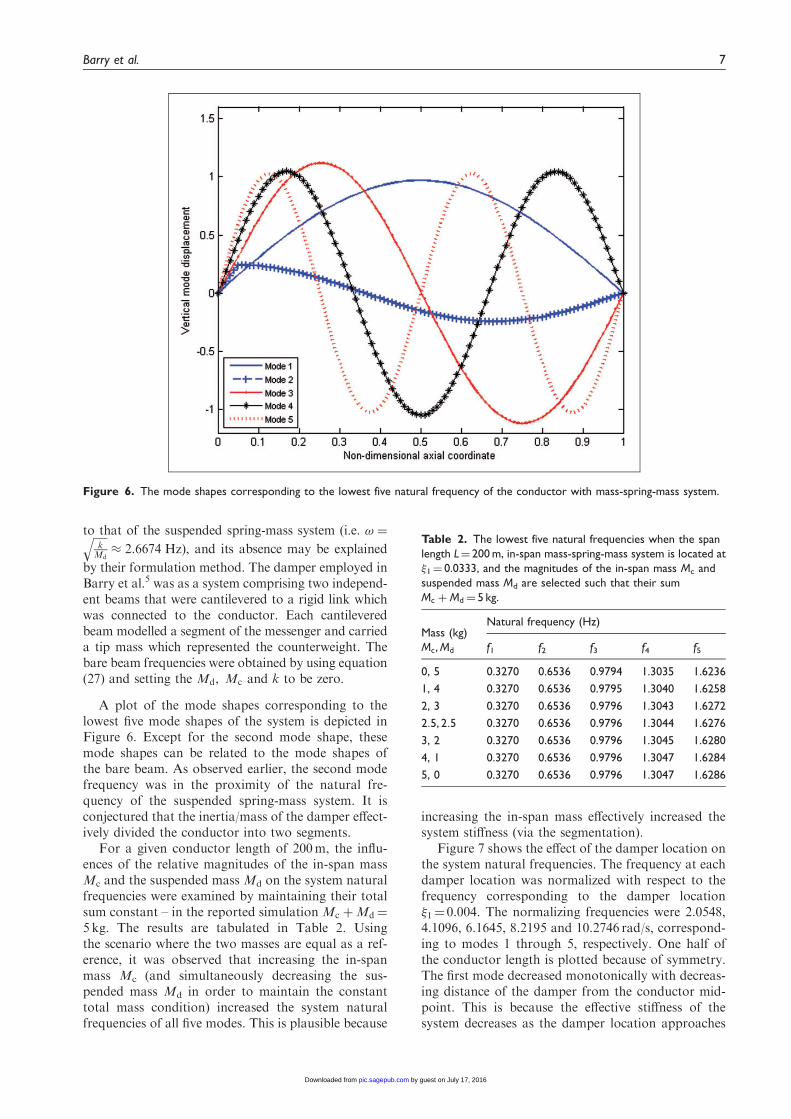
Figure 7 shows the effect of the damper location onthe system natural frequencies. The frequency at eachdamper location was normalized with respect to thefrequency corresponding to the damper location�1¼ 0.004. The normalizing frequencies were 2.0548,4.1096, 6.1645, 8.2195 and 10.2746 rad/s, correspond-ing to modes 1 through 5, respectively. One half ofthe conductor length is plotted because of symmetry.The first mode decreased monotonically with decreas-ing distance of the damper from the conductor mid-point. This is because the effective stiffness of thesystem decreases as the damper location approaches
Figure 6. The mode shapes corresponding to the lowest five natural frequency of the conductor with mass-spring-mass system.
Table 2. The lowest five natural frequencies when the span
length L¼ 200 m, in-span mass-spring-mass system is located at
�1¼ 0.0333, and the magnitudes of the in-span mass Mc and
suspended mass Md are selected such that their sum
Mc þMd¼ 5 kg.
Mass (kg)Natural frequency (Hz)
Mc, Md f1 f2 f3 f4 f5
0, 5 0.3270 0.6536 0.9794 1.3035 1.6236
1, 4 0.3270 0.6536 0.9795 1.3040 1.6258
2, 3 0.3270 0.6536 0.9796 1.3043 1.6272
2:5, 2:5 0.3270 0.6536 0.9796 1.3044 1.6276
3, 2 0.3270 0.6536 0.9796 1.3045 1.6280
4, 1 0.3270 0.6536 0.9796 1.3047 1.6284
5, 0 0.3270 0.6536 0.9796 1.3047 1.6286
Barry et al. 7
by guest on July 17, 2016pic.sagepub.comDownloaded from
the centre of the conductor. The other four modeswere remarkably affected in that they all decreasedand increased depending on whether they wereapproaching a node or an anti-node. The rate ofchange was more pronounced in the fifth frequency.
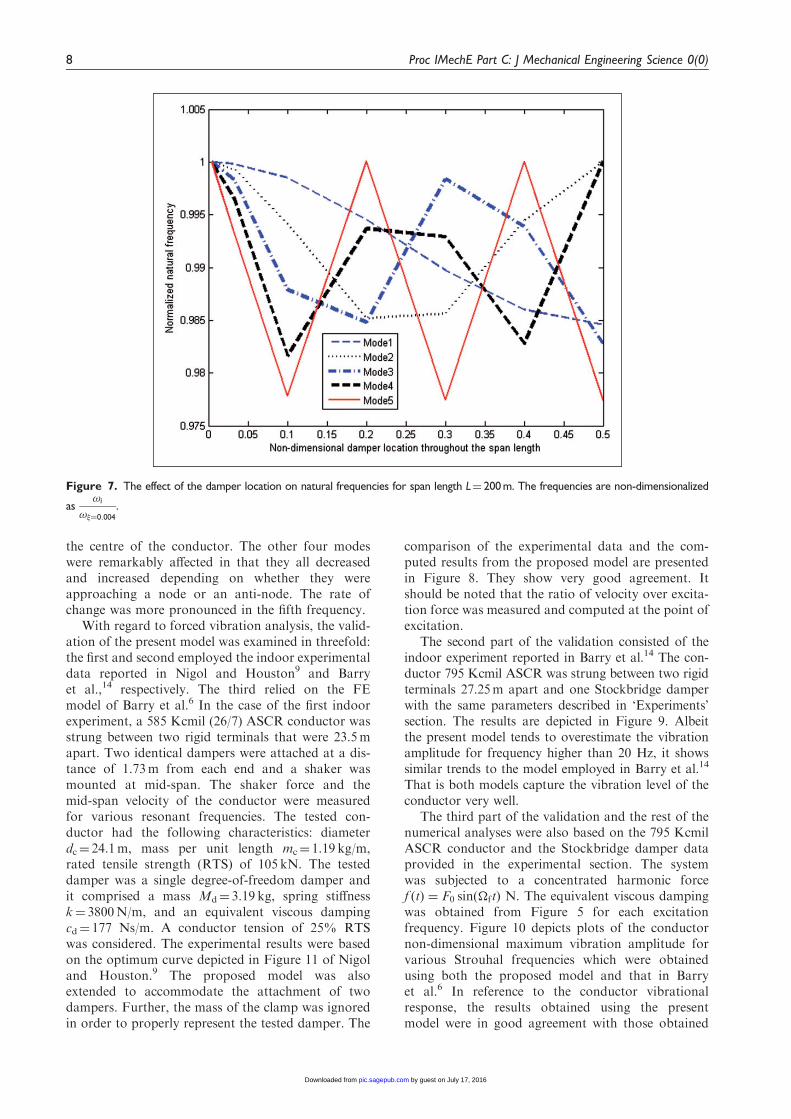
With regard to forced vibration analysis, the valid-ation of the present model was examined in threefold:the first and second employed the indoor experimentaldata reported in Nigol and Houston9 and Barryet al.,14 respectively. The third relied on the FEmodel of Barry et al.6 In the case of the first indoorexperiment, a 585 Kcmil (26/7) ASCR conductor wasstrung between two rigid terminals that were 23.5mapart. Two identical dampers were attached at a dis-tance of 1.73m from each end and a shaker wasmounted at mid-span. The shaker force and themid-span velocity of the conductor were measuredfor various resonant frequencies. The tested con-ductor had the following characteristics: diameterdc¼ 24.1m, mass per unit length mc¼ 1.19 kg/m,rated tensile strength (RTS) of 105 kN. The testeddamper was a single degree-of-freedom damper andit comprised a mass Md¼ 3.19 kg, spring stiffnessk¼ 3800N/m, and an equivalent viscous dampingcd¼ 177 Ns/m. A conductor tension of 25% RTSwas considered. The experimental results were basedon the optimum curve depicted in Figure 11 of Nigoland Houston.9 The proposed model was alsoextended to accommodate the attachment of twodampers. Further, the mass of the clamp was ignoredin order to properly represent the tested damper. The
comparison of the experimental data and the com-puted results from the proposed model are presentedin Figure 8. They show very good agreement. Itshould be noted that the ratio of velocity over excita-tion force was measured and computed at the point ofexcitation.
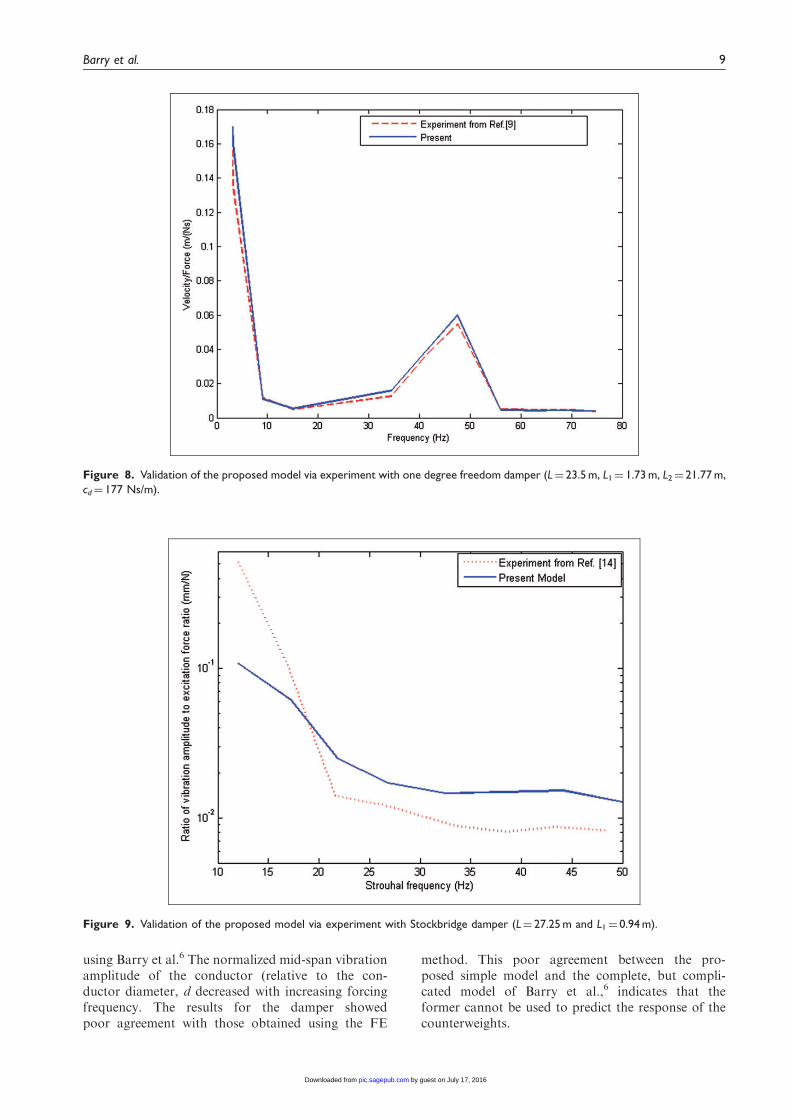
The second part of the validation consisted of theindoor experiment reported in Barry et al.14 The con-ductor 795 Kcmil ASCR was strung between two rigidterminals 27.25m apart and one Stockbridge damperwith the same parameters described in ‘Experiments’section. The results are depicted in Figure 9. Albeitthe present model tends to overestimate the vibrationamplitude for frequency higher than 20 Hz, it showssimilar trends to the model employed in Barry et al.14
That is both models capture the vibration level of theconductor very well.
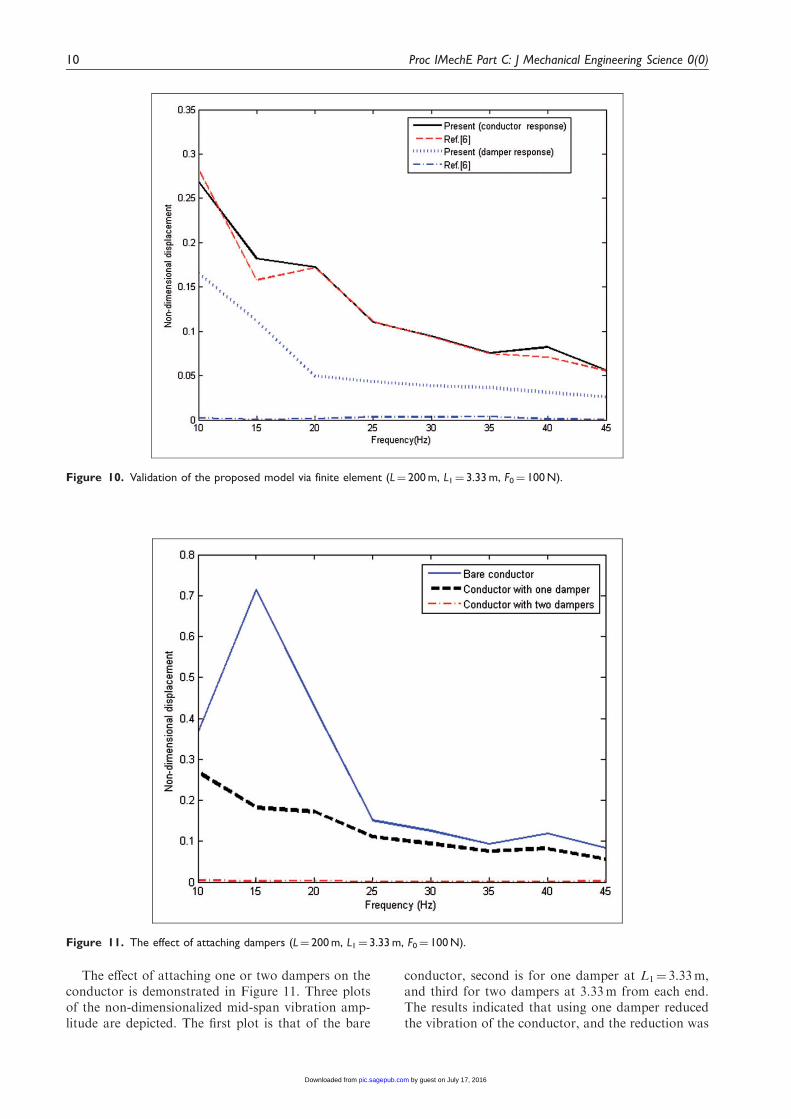
The third part of the validation and the rest of thenumerical analyses were also based on the 795 KcmilASCR conductor and the Stockbridge damper dataprovided in the experimental section. The systemwas subjected to a concentrated harmonic forcef ðtÞ ¼ F0 sinð�ftÞ N. The equivalent viscous dampingwas obtained from Figure 5 for each excitationfrequency. Figure 10 depicts plots of the conductornon-dimensional maximum vibration amplitude forvarious Strouhal frequencies which were obtainedusing both the proposed model and that in Barryet al.6 In reference to the conductor vibrationalresponse, the results obtained using the presentmodel were in good agreement with those obtained
Figure 7. The effect of the damper location on natural frequencies for span length L¼ 200 m. The frequencies are non-dimensionalized
as!i
!�¼0:004
.
8 Proc IMechE Part C: J Mechanical Engineering Science 0(0)
by guest on July 17, 2016pic.sagepub.comDownloaded from
using Barry et al.6 The normalized mid-span vibrationamplitude of the conductor (relative to the con-ductor diameter, d decreased with increasing forcingfrequency. The results for the damper showedpoor agreement with those obtained using the FE
method. This poor agreement between the pro-posed simple model and the complete, but compli-cated model of Barry et al.,6 indicates that theformer cannot be used to predict the response of thecounterweights.
Figure 8. Validation of the proposed model via experiment with one degree freedom damper (L¼ 23.5 m, L1¼ 1.73 m, L2¼ 21.77 m,
cd¼ 177 Ns/m).
Figure 9. Validation of the proposed model via experiment with Stockbridge damper (L¼ 27.25 m and L1¼ 0.94 m).
Barry et al. 9
by guest on July 17, 2016pic.sagepub.comDownloaded from
The effect of attaching one or two dampers on theconductor is demonstrated in Figure 11. Three plotsof the non-dimensionalized mid-span vibration amp-litude are depicted. The first plot is that of the bare
conductor, second is for one damper at L1¼ 3.33m,and third for two dampers at 3.33m from each end.The results indicated that using one damper reducedthe vibration of the conductor, and the reduction was
Figure 11. The effect of attaching dampers (L¼ 200 m, L1¼ 3.33 m, F0¼ 100 N).
Figure 10. Validation of the proposed model via finite element (L¼ 200 m, L1¼ 3.33 m, F0¼ 100 N).
10 Proc IMechE Part C: J Mechanical Engineering Science 0(0)
by guest on July 17, 2016pic.sagepub.comDownloaded from
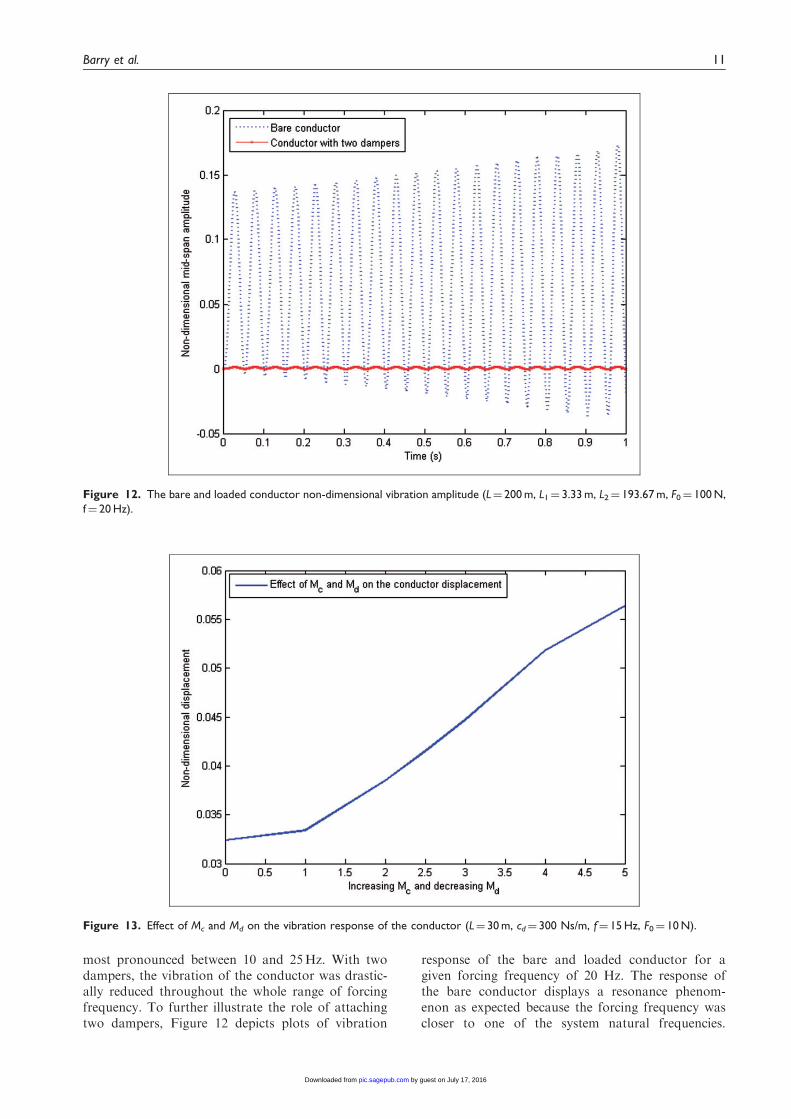
most pronounced between 10 and 25Hz. With twodampers, the vibration of the conductor was drastic-ally reduced throughout the whole range of forcingfrequency. To further illustrate the role of attachingtwo dampers, Figure 12 depicts plots of vibration
response of the bare and loaded conductor for agiven forcing frequency of 20 Hz. The response ofthe bare conductor displays a resonance phenom-enon as expected because the forcing frequency wascloser to one of the system natural frequencies.
Figure 12. The bare and loaded conductor non-dimensional vibration amplitude (L¼ 200 m, L1¼ 3.33 m, L2¼ 193.67 m, F0¼ 100 N,
f¼ 20 Hz).
Figure 13. Effect of Mc and Md on the vibration response of the conductor (L¼ 30 m, cd¼ 300 Ns/m, f¼ 15 Hz, F0¼ 10 N).
Barry et al. 11
by guest on July 17, 2016pic.sagepub.comDownloaded from
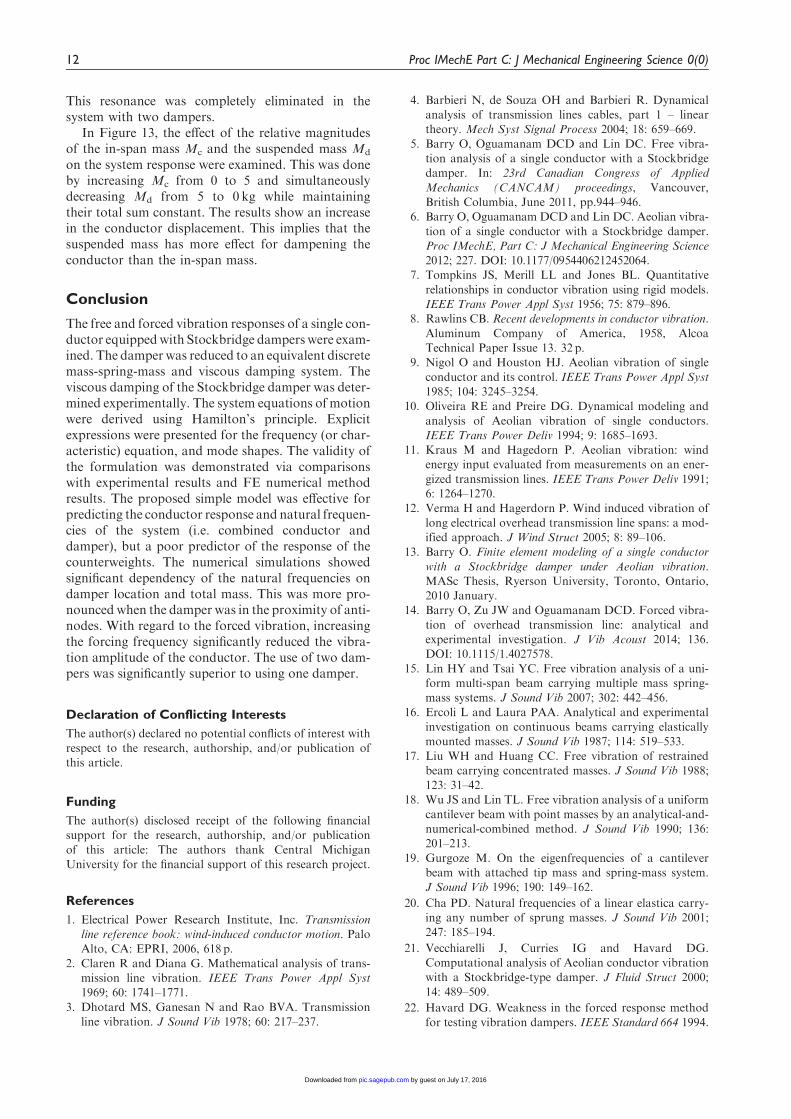
This resonance was completely eliminated in thesystem with two dampers.
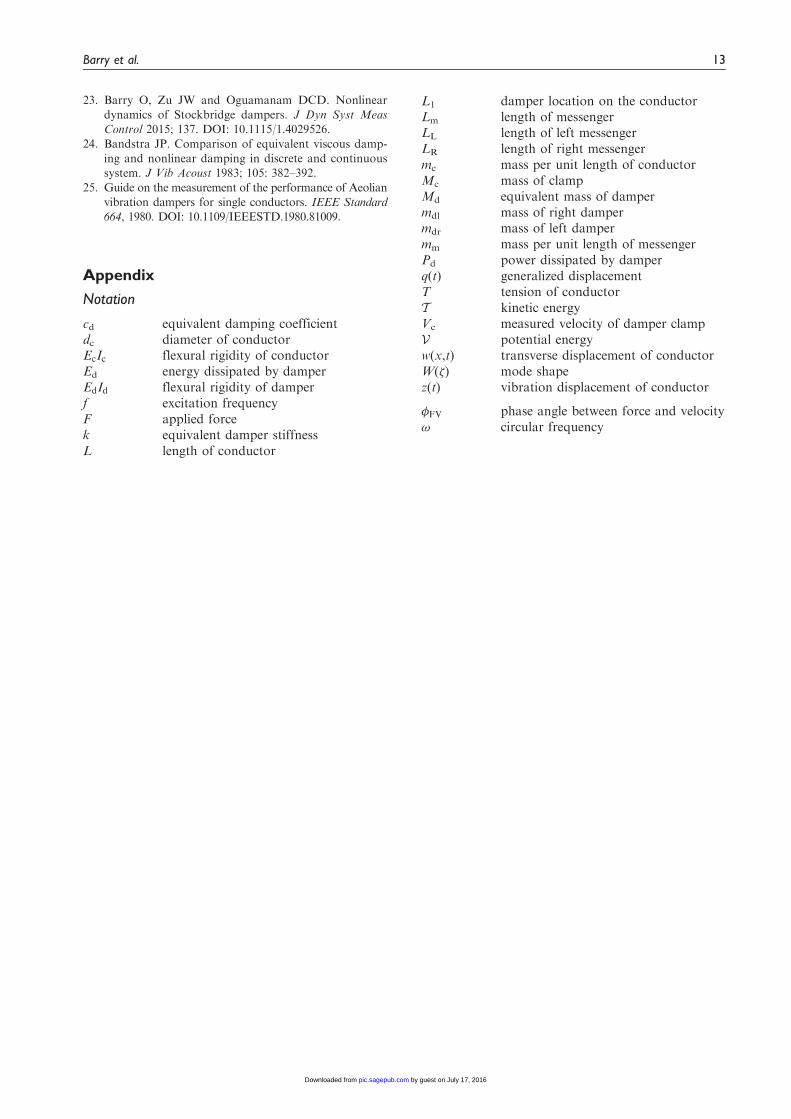
In Figure 13, the effect of the relative magnitudesof the in-span mass Mc and the suspended mass Md
on the system response were examined. This was doneby increasing Mc from 0 to 5 and simultaneouslydecreasing Md from 5 to 0 kg while maintainingtheir total sum constant. The results show an increasein the conductor displacement. This implies that thesuspended mass has more effect for dampening theconductor than the in-span mass.
Conclusion
The free and forced vibration responses of a single con-ductor equippedwith Stockbridge dampers were exam-ined. The damper was reduced to an equivalent discretemass-spring-mass and viscous damping system. Theviscous damping of the Stockbridge damper was deter-mined experimentally. The system equations of motionwere derived using Hamilton’s principle. Explicitexpressions were presented for the frequency (or char-acteristic) equation, and mode shapes. The validity ofthe formulation was demonstrated via comparisonswith experimental results and FE numerical methodresults. The proposed simple model was effective forpredicting the conductor response and natural frequen-cies of the system (i.e. combined conductor anddamper), but a poor predictor of the response of thecounterweights. The numerical simulations showedsignificant dependency of the natural frequencies ondamper location and total mass. This was more pro-nounced when the damper was in the proximity of anti-nodes. With regard to the forced vibration, increasingthe forcing frequency significantly reduced the vibra-tion amplitude of the conductor. The use of two dam-pers was significantly superior to using one damper.
Declaration of Conflicting Interests
The author(s) declared no potential conflicts of interest withrespect to the research, authorship, and/or publication ofthis article.
Funding
The author(s) disclosed receipt of the following financialsupport for the research, authorship, and/or publication
of this article: The authors thank Central MichiganUniversity for the financial support of this research project.
References
1. Electrical Power Research Institute, Inc. Transmissionline reference book: wind-induced conductor motion. PaloAlto, CA: EPRI, 2006, 618 p.
2. Claren R and Diana G. Mathematical analysis of trans-mission line vibration. IEEE Trans Power Appl Syst1969; 60: 1741–1771.
3. Dhotard MS, Ganesan N and Rao BVA. Transmissionline vibration. J Sound Vib 1978; 60: 217–237.
4. Barbieri N, de Souza OH and Barbieri R. Dynamicalanalysis of transmission lines cables, part 1 – lineartheory. Mech Syst Signal Process 2004; 18: 659–669.
5. Barry O, Oguamanam DCD and Lin DC. Free vibra-tion analysis of a single conductor with a Stockbridgedamper. In: 23rd Canadian Congress of Applied
Mechanics (CANCAM) proceedings, Vancouver,British Columbia, June 2011, pp.944–946.
6. Barry O, Oguamanam DCD and Lin DC. Aeolian vibra-
tion of a single conductor with a Stockbridge damper.Proc IMechE, Part C: J Mechanical Engineering Science2012; 227. DOI: 10.1177/0954406212452064.
7. Tompkins JS, Merill LL and Jones BL. Quantitative
relationships in conductor vibration using rigid models.IEEE Trans Power Appl Syst 1956; 75: 879–896.
8. Rawlins CB. Recent developments in conductor vibration.
Aluminum Company of America, 1958, AlcoaTechnical Paper Issue 13. 32 p.
9. Nigol O and Houston HJ. Aeolian vibration of single
conductor and its control. IEEE Trans Power Appl Syst1985; 104: 3245–3254.
10. Oliveira RE and Preire DG. Dynamical modeling and
analysis of Aeolian vibration of single conductors.IEEE Trans Power Deliv 1994; 9: 1685–1693.
11. Kraus M and Hagedorn P. Aeolian vibration: windenergy input evaluated from measurements on an ener-
gized transmission lines. IEEE Trans Power Deliv 1991;6: 1264–1270.
12. Verma H and Hagerdorn P. Wind induced vibration of
long electrical overhead transmission line spans: a mod-ified approach. J Wind Struct 2005; 8: 89–106.
13. Barry O. Finite element modeling of a single conductor
with a Stockbridge damper under Aeolian vibration.MASc Thesis, Ryerson University, Toronto, Ontario,2010 January.
14. Barry O, Zu JW and Oguamanam DCD. Forced vibra-
tion of overhead transmission line: analytical andexperimental investigation. J Vib Acoust 2014; 136.DOI: 10.1115/1.4027578.
15. Lin HY and Tsai YC. Free vibration analysis of a uni-form multi-span beam carrying multiple mass spring-mass systems. J Sound Vib 2007; 302: 442–456.
16. Ercoli L and Laura PAA. Analytical and experimentalinvestigation on continuous beams carrying elasticallymounted masses. J Sound Vib 1987; 114: 519–533.
17. Liu WH and Huang CC. Free vibration of restrainedbeam carrying concentrated masses. J Sound Vib 1988;123: 31–42.
18. Wu JS and Lin TL. Free vibration analysis of a uniform
cantilever beam with point masses by an analytical-and-numerical-combined method. J Sound Vib 1990; 136:201–213.
19. Gurgoze M. On the eigenfrequencies of a cantileverbeam with attached tip mass and spring-mass system.J Sound Vib 1996; 190: 149–162.
20. Cha PD. Natural frequencies of a linear elastica carry-ing any number of sprung masses. J Sound Vib 2001;
247: 185–194.
21. Vecchiarelli J, Curries IG and Havard DG.Computational analysis of Aeolian conductor vibrationwith a Stockbridge-type damper. J Fluid Struct 2000;
14: 489–509.
22. Havard DG. Weakness in the forced response method
for testing vibration dampers. IEEE Standard 664 1994.
12 Proc IMechE Part C: J Mechanical Engineering Science 0(0)
by guest on July 17, 2016pic.sagepub.comDownloaded from
23. Barry O, Zu JW and Oguamanam DCD. Nonlineardynamics of Stockbridge dampers. J Dyn Syst MeasControl 2015; 137. DOI: 10.1115/1.4029526.
24. Bandstra JP. Comparison of equivalent viscous damp-ing and nonlinear damping in discrete and continuoussystem. J Vib Acoust 1983; 105: 382–392.
25. Guide on the measurement of the performance of Aeolianvibration dampers for single conductors. IEEE Standard664, 1980. DOI: 10.1109/IEEESTD.1980.81009.
Appendix
Notation
cd equivalent damping coefficientdc diameter of conductorEcIc flexural rigidity of conductorEd energy dissipated by damperEdId flexural rigidity of damperf excitation frequencyF applied forcek equivalent damper stiffnessL length of conductor
L1 damper location on the conductorLm length of messengerLL length of left messengerLR length of right messengermc mass per unit length of conductorMc mass of clampMd equivalent mass of dampermdl mass of right dampermdr mass of left dampermm mass per unit length of messengerPd power dissipated by damperq(t) generalized displacementT tension of conductorT kinetic energyVc measured velocity of damper clampV potential energyw(x,t) transverse displacement of conductorWð�Þ mode shapez(t) vibration displacement of conductor
�FV phase angle between force and velocity! circular frequency
Barry et al. 13
by guest on July 17, 2016pic.sagepub.comDownloaded from