Embed Size (px)
Citation preview
71
JURNALRiset Akuntansi dan Keuangan IndonesiaURL : http://journals.ums.ac.id/index.php/reaksi/index
Simplicity, Price, Quality of Service and Safety Towards The Decision to Purchase Products Through Shopee.id Application
Nursiam, Anastasia Auti Merry Yanissa, Rina Kurnia Ariani
Faculty of Economic and Business, Universitas Muhammadiyah Surakarta
Email : [email protected]
Keywords:simplicity, price, quality of service, safety, decision on purchasing product
ABSTRACTThis study aims to determine the effect of simplicity, price, service quality and safety on product purchasing decisions through shopee.id application. The method used in this study is a quantitative method. Respondents in this study were accounting students for the 2016 class of the Faculty of Economics and Business, Universitas Muhammadiyah Surakarta, where the incidental sampling method was used, with a total sample of 81 respondents. Data analysis techniques used multiple linear regression models. The results of this study indicate that simplicity, price, and quality of service affect the product purchase decision through Shopee.id application with each sig value of 0,033; 0,000; and 0,000. Meanwhile, safety has no effect on product purchasing decisions through shopee.id application with a sig value of 0,087.
72
p-ISSN:1411-6510e-ISSN :2541-6111
Nursiam, Anastasia Auti Merry Yanissa, Rina Kurnia Ariani
JURNAL Riset Akuntansi dan Keuangan Indonesia Vol.5 No.1 April 2020
INTRODUCTION
In recent years the technology is far more sophisticated and continues to develop compared to several years ago. The development of these technologies can be felt in various fields, namely transportation, electronic community and even in cyberspace. This makes internet users in Indonesia increasingly develop along with technological advancements. Based on the calculation of the Indonesian Internet Service Providers Association (APJII) in 2017 it reached 143.26 million people while in 2018 Figure I.1 increased to reach 171.17 million people or around 64.8% of the total population of Indonesia.
The increasing number of internet users is a big opportunity for entrepreneurs to market their products via the internet or based online. Easy internet access either via wifi or cellphone has an impact on changing consumer behavior, from shopping directly or conventionally to online shopping. As the results of research conducted on internet users in Singapore by Liao and Cheung (2001), it showed that the more people use the internet, the happier they are to make purchases through e-shops.
Electronic commerce or e-commerce transactions in Indonesia have increased; eMarketer data showed that Indonesia’s e-commerce transactions reached Rp 25.1 trillion in 2014 and will rise to Rp 69.8 Trilin in 2016, with an exchange rate of Rp 13,200 per US dollar. E-Commerce has several types, one of which is Customer to Customer (C2C), where consumers can not only buy products in e-commerce, but also easily sell their products to other consumers. So that popping up companies that make a site as a place of market share between sellers and buyers in the digital world is called marketplace.
The development of e-commerce web in Indonesia is also increasingly marked by the emergence of a large marketplace that is increasingly known by all levels of society such as Tokopedia.com, Shopee.ID, Open Stalls, Blibli, zalora, lazada and the others. Marketplace is an electronic interactive business community container that provides a market where companies can take part
in B2B e-commerce and or other e-business activities (Bunn, Jensen, & Skovgaard). Marketplace provides facilities for free and the seller does not incur much cost in making a website.
Shopee.ID is a marketplace that has potential and it is popular in Indonesia. The company that is identical to the orange color managed to rank first in the AppStore and Playstore during the Q4 2018 period based on data compiled from AppAnnie. Shopee.ID is very easy for consumers to shop because it can be done anytime and anywhere. However, a few consumers also have problems in purchasing products.
The high number of competition for both similar and different goods causes consumers to act selectively in making purchasing decisions. These conditions require producers to follow the increasingly complex wants and needs of buyers. Price is the main benchmark in encouraging consumers to buy the goods offered. Usually consumers, choose cheap prices with good quality. The sellers must also provide the best quality of service, in order to encourage consumers to purchase the items offered.
The payment process through Shopee.ID is not carried out conventionally, but uses payment methods including credit cards, bank transfers, third parties and the Cash on delivery (COD) system. Shopee Guarantee Feature is a protection from Shopee for consumers by holding consumer funds. If the consumer confirms that the item has been received well then the funds will be passed on to the seller. Shopping through Shopee.ID is of interest to various circles as is the case among students. They choose Shopee.ID because it has free shipping, a complete category, and guarantees that the goods received are in good condition.
Based on the above phenomenon, the researchers conducted a study entitled “EFFECTS OF SIMPLICITY, PRICE, QUALITY OF SERVICE, AND SAFETY TOWARDS DECISIONS TO PURCHASE PRODUCTS THROUGH SHOPEE.ID APPLICATION (Empirical Studies in Accounting Students in 2016, Faculty of Economics and Business, University of Muhammadiyah Surakarta)”
73
p-ISSN:1411-6510e-ISSN :2541-6111
Simplicity, Price, Quality of Service and Safety Towards The Decision to Purchase Products ...
JURNAL Riset Akuntansi dan Keuangan IndonesiaVol.5 No.1 April 2020
LITERATURE REVIEW AND HYPOTHESIS DEVELOPMENT
Technology Acceptance Model (TAM)According to Venkatesh & Morris (2000)
in Sanjaya (2005) TAM is used to see individual understanding continuously using information technology in its activities.
Technology Of Planned Behavior (TPB)This theory is called perceived behavioral
control. Planned behavior theory (TPB) aims to control individual behavior that is limited by the shortcomings and limitations of the resources used to conduct their behavior (Chau and Hu, 2002 in Sulistyawati, 2019)
Social Learning TheorySocial learning theory states that people can
learn through direct observation and experience. One can learn by observing what happens to other individuals and only being told about something (Robbins and Judge, 2008: 74).
Electronic MarketingAccording to Boone and Kurtz (2005),
e-marketing is one component in e-commerce with special interests by marketers, namely the strategy of the process of making, distributing, promoting, and pricing the goods and services of the internet market share or through other digital equipment.
E-Commerce (Electronic Commerce)Electronic commerce is the distribution,
sale, purchase, marketing of goods and services that rely on electronic systems, such as the internet, television or other computer networks. Classification of e-commerce business models namely Business-to-business (B2B), Business-to-consummer (B2C), Consumer-to-consumer (C2C), Consumer-to-business (C2B), E-Commerce Public / Government Administration (B2G & C2G).
Buying decisionIt is a consumer behavior to make a purchase or
transaction. Consumers are often faced with several choices in buying an item, causing consumers to have to consider before making a purchasing decision.
Simplicity It is defined as the extent to which a person
believes that using a technology will be free from effort (Hartono and Jogiyanto, 2007: 114). This convenience factor will have an impact on behavior, namely the higher a person’s perception of the simplicity of using the system, the higher the level of information technology utilization.
PricePrice is the amount of money that must be
paid by consumers to get a product (Kotler and Armstrong (2008). The role of prices greatly affects the success rate of a company or seller in selling its products, so sellers do various ways to attract consumers, such as providing affordable prices, suitability of price with product quality, or provide discounts on products.
Service qualityQuality of service is how far the difference
between reality and customer expectations for the service received or obtained (Parasuraman, in Lupiyoadi, 2001: 148).
Safety Safety is the ability of an online store to
control and maintain security of data transactions (Park and Kim, 2006). The concept of security in an online environment is defined as the ability of online corporate websites to protect information and transaction data of consumers.
The Effect of Convenience Against Product Purchasing Decisions Through Shopee.ID Application
The facilities provided by shopee include the simplicity to be learned, accessed, understood, and easy to get information on shopee.id. This simplicity is expected to encourage consumers to make purchasing decisions at shopee.id.H1 : Simplicity affects the product purchase
decision on the Shopee.ID application.
The Effect of Prices on Product Purchasing Decisions through Shopee.ID Application
The price offered by shopee varies greatly, starting from the lowest price to the most expensive
74
p-ISSN:1411-6510e-ISSN :2541-6111
Nursiam, Anastasia Auti Merry Yanissa, Rina Kurnia Ariani
JURNAL Riset Akuntansi dan Keuangan Indonesia Vol.5 No.1 April 2020
price. Various goods with the same type and brand have different prices. At shopee there are also imported goods at lower prices compared to goods offered in Indonesia. Therefore, price is also one of the most important factors before consumers make a purchase decision.H2 : Price affects the product purchase decision
on the Shopee.ID application.
The Effect of Service Quality on Product Purchasing Decisions Through Shopee.ID Application
The quality of service at Shopee.id in this case is certainly expected to be able to create good service quality, so as to encourage consumers to make purchasing decisions on Shopee.id repeatedly.H3 : Service quality influences product purchase
decisions on the Shopee.ID application.
The Effect of Security on Product Purchasing Decisions Through Shopee.ID Application
Every e-commerce must have a good security system, because every payment uses an account. Therefore, the security of the buyer’s account must be protected well and properly so that the account is not known by others. If the security of an e-commerce is not good or there is no guarantee of security, consumers will hesitate to make a purchase.H4 : Security influences product purchase
decisions on the Shopee.ID application
RESEARCH METHOD
Population dan SamplePopulation is a generalization area consisting
of objects/ subjects that have certain qualities and characteristics determined by researchers to be studied and then drawn conclusions (Sugiyono (2009: 115). The population in this study is the Accounting Student Batch 2016 Faculty of Economics and Business, Universitas Muhammadiyah Surakarta. The total population in this study are 412 respondents, the sample chosen is considered to represent the existence of a population. The technique of determining the sample used is the Slovin formula, namely:
21 ( )N
nN e
=+
Note :n = Samples to be determinedN = The number of populatione = Expected level of precision not to deviate,
10%The sample for this research is :
Accounting Students of FEB’16 = 2
4121 412 (0,1)+
= 80,469 rounded down to 81
Data and Data SourcesThe study used primary data. The data were
obtained by distributing questionnaires. The distribution of the questionnaire was done by incidental sampling, i.e. anyone who incidentally met the researchers could be used as a sample, people who happened to be met were in accordance with the criteria, namely the 2016 Accounting Faculty of Economics and Business, Universitas Muhammadiyah Surakarta.
Operational Definition and Variable MeasurementProduct Purchase Decision
The purchasing decision is the decision process stage where the consumer actually purchases the product. There are indicators of purchasing decisions (Yugi Setyarko, 2016), namely the purpose of purchasing a product, processing information to get to brand selection, stability in a product and giving recommendations to others, to make a repeat purchase.
Simplicity It is defined as the extent to which a person
believes that using a technology will be free of effort. There are indicators of convenience (Yugi Setyarko, 2016), namely Easy to Learn, Controllable, Clear & Understandable, Flexible, Easy to Become Skillful, and Easy to Use.
PricePrice is the amount of money spent by
consumers to get products or services. There are price indicators (Fransiska Vania Sudjatmika, 2017), namely price feasibility, price conformity with product quality, and discounts.
75
p-ISSN:1411-6510e-ISSN :2541-6111
Simplicity, Price, Quality of Service and Safety Towards The Decision to Purchase Products ...
JURNAL Riset Akuntansi dan Keuangan IndonesiaVol.5 No.1 April 2020
Service qualityService Quality is defined as how far
the difference between reality and customer expectations for the services they receive (Parasuraman, in Lupiyoadi, 2001: 148). There are indicators of service quality (Yugi Setyarko, in Jasfar, 2005: 51), namely physical evidence, reliability, responsiveness, assurance, empathy.
Safety It is the ability of online stores to control and
maintain security of data transactions. There are security indicators (Fransiska Vania Sudjatmika, 2017), which does not misuse consumers ‘personal data, provide security and keep consumers’ personal data from outsiders, giving confidence in security guarantees.
FINDING AND DISCUSSION
Data analysis method used in this study is multiple linear analysis, which is to find out the effect of convenience, price, service quality and security on product purchasing decisions through the shopee.id application. The regression model used is as follows:
y = a + β1Km + β2Hg+ β3KP + β3Kmn + e
Note :Y = Product Purchase Decision through
E-commerceα = Konstantaβ = Regression CoefisienX1 = SimplicityX2 = PriceX3 = Service QualityX4 = Safetyε = Error of Estimation
The population in this study was the 2016 accounting student of the Faculty of Economics and Business, Universitas Muhammadiyah Surakarta. The sample determined by the Slovin formula and it was obtained a sample of 81 respondents with a 100% return rate in Table IV.1:
Table IV.1Questionnaire Return Rate
Description Respondent (University students)
Number of Questionnaires distributedNumber of Questionnaires that did not returnData ready to be processed
810
81
Total 81Source : Primary Data processed with SPSS, 2020
Results of Respondent CharacteristicsCharacteristics of respondents in this study
explain the description of the respondent’s identity, namely based on age, gender, shopping frequency, nominal shopping and electronic media used:
Table IV.2Characteristics of Respondents by Age
Age Frequency Procentage (%)19-21 year 68 83,95%22-24 year 13 16,05%
Total 81 100,00%
Source : Primary Data processed with SPSS, 2020
Table IV.2 shows that the age of respondents who made a purchase of products through the Shoppe.ID application was the age of 19-21 years with 68 respondents or 83.95% while the ages of 22-24 years were 13 respondents or 16.05%. This shows that the majority of respondents aged 19-21 years (83.95%).
Table IV.3Characteristics of Respondents by Gender
Gender Frequency Procentage (%)Male 15 18,52%
Female 66 81,48%Total 81 100,00%
Source : Primary Data processed with SPSS, 2020
Table IV.3 shows the gender of respondents who made a purchase of products through the Shoppe.ID application were 15 male or 18.52%
76
p-ISSN:1411-6510e-ISSN :2541-6111
Nursiam, Anastasia Auti Merry Yanissa, Rina Kurnia Ariani
JURNAL Riset Akuntansi dan Keuangan Indonesia Vol.5 No.1 April 2020
while women were 66 respondents or 81.48%. This shows that the majority of respondents were female by 81.48%.
Table IV.4Characteristics of Respondents Based on Shopping
Frequency
Shopping Frequency Frequency Procentage (%)< 3 x
3 – 5 x
> 5 x
42
27
12
51,85%
33,34%
14,81%Total 81 100,00%
Source : Primary Data processed with SPSS, 2020
Table IV.4 shows that the shopping frequency of respondents who bought products through the Shoppe.ID application less than 3 times were as many as 42 respondents or 51.85%, while purchases 3 to 5 times were 27 respondents or 33.34% and more than 5 times were as many 12 respondents or 14.81
Tabel IV.5Characteristics of Respondents Based on Nominal
Expenditures
Nominal Expenditures FrequencyProcentage
(%)< Rp 50.000 2 2,47%Rp 50.000 – Rp 100.000 34 41,97%Rp 100.001 – Rp 200.000 32 39,51%Rp 200.001 – Rp 300.000 10 12,35%
> Rp 300.000 3 3,70%Total 81 100,00%
Source : Primary Data processed with SPSS, 2020
Table IV.5 shows that the majority of respondents, as many as 34 people (41.97%) made a purchase of products as much as Rp 50,000 - Rp 100,000 in a single purchase through the Shopee.ID application.
Table IV.6Characteristics of Respondents Based on Electronic Media
Shopping Media FrequencyProcentage
(%)PC ( Personal Computer) / Laptop
0 0
Smart Phone 81 100,00%Tablet 0 0Total 81 100,00%
Source : Primary Data processed with SPSS, 2020
Table IV.6 shows that the electronic media used by respondents to purchase products through the Shoppe.ID application was Smart Phone.
Descriptive Statistics ResultsDescriptive statistics are statistics that describe
data into information that is clearer and easier to understand (Ghozali, 2011). Descriptive Statistics research results can be seen in the following table:
Table IV.7Descriptive Statistic
Description N Minimum Maximum Mean Std. DeviationSimplicity 81 18 30 26,16 2,736Price 81 13 30 24,42 2,836Service Quality 81 19 40 31,20 3,926Safety 81 16 30 23,96 2,685Product Purchase Decision 81 8 20 16,44 2,151Valid N (listwise) 81
Source : Primary Data processed with SPSS, 2020
Based on table IV.7 it can be concluded that descriptive statistical test results show that the simplicity variable has a minimum value of 18, a maximum value of 30, a mean value of 26.16 and a standard deviation of 2.736; a variable price has a minimum value of 13, a maximum value of 30 , a mean value of 24.42 and a standard deviation of
2.836; a Service Quality variable has a minimum value of 19, a maximum value of 40, a mean value of 31.20 and a standard deviation of 3.926; a Safety variable has a minimum value of 16, a maximum value of 30, the mean value is 23.96 and the standard deviation is 2.685; the Product Purchase Decision variable has a minimum value of 8, a maximum
77
p-ISSN:1411-6510e-ISSN :2541-6111
Simplicity, Price, Quality of Service and Safety Towards The Decision to Purchase Products ...
JURNAL Riset Akuntansi dan Keuangan IndonesiaVol.5 No.1 April 2020
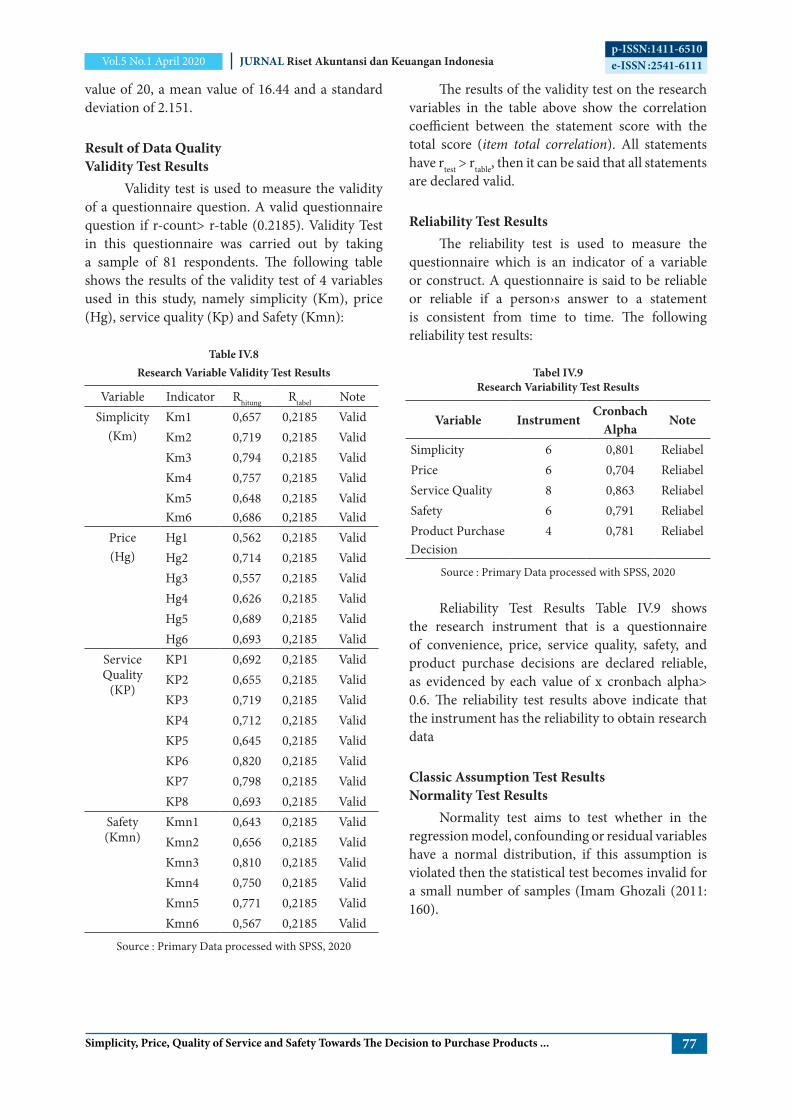
value of 20, a mean value of 16.44 and a standard deviation of 2.151.
Result of Data QualityValidity Test Results
Validity test is used to measure the validity of a questionnaire question. A valid questionnaire question if r-count> r-table (0.2185). Validity Test in this questionnaire was carried out by taking a sample of 81 respondents. The following table shows the results of the validity test of 4 variables used in this study, namely simplicity (Km), price (Hg), service quality (Kp) and Safety (Kmn):
Table IV.8Research Variable Validity Test Results
Variable Indicator Rhitung Rtabel Note Simplicity
(Km)Km1 0,657 0,2185 ValidKm2 0,719 0,2185 ValidKm3 0,794 0,2185 ValidKm4 0,757 0,2185 ValidKm5Km6
0,6480,686
0,21850,2185
ValidValid
Price (Hg)
Hg1 0,562 0,2185 ValidHg2 0,714 0,2185 ValidHg3 0,557 0,2185 ValidHg4 0,626 0,2185 ValidHg5 0,689 0,2185 ValidHg6 0,693 0,2185 Valid
Service Quality
(KP)
KP1 0,692 0,2185 ValidKP2 0,655 0,2185 ValidKP3 0,719 0,2185 ValidKP4 0,712 0,2185 ValidKP5 0,645 0,2185 ValidKP6 0,820 0,2185 ValidKP7 0,798 0,2185 ValidKP8 0,693 0,2185 Valid
Safety (Kmn)
Kmn1 0,643 0,2185 ValidKmn2 0,656 0,2185 ValidKmn3 0,810 0,2185 ValidKmn4 0,750 0,2185 ValidKmn5 0,771 0,2185 ValidKmn6 0,567 0,2185 Valid
Source : Primary Data processed with SPSS, 2020
The results of the validity test on the research variables in the table above show the correlation coefficient between the statement score with the total score (item total correlation). All statements have rtest > rtable, then it can be said that all statements are declared valid.
Reliability Test ResultsThe reliability test is used to measure the
questionnaire which is an indicator of a variable or construct. A questionnaire is said to be reliable or reliable if a person›s answer to a statement is consistent from time to time. The following reliability test results:
Tabel IV.9Research Variability Test Results
Variable InstrumentCronbach
AlphaNote
Simplicity 6 0,801 ReliabelPrice 6 0,704 ReliabelService Quality 8 0,863 ReliabelSafety 6 0,791 ReliabelProduct Purchase Decision
4 0,781 Reliabel
Source : Primary Data processed with SPSS, 2020
Reliability Test Results Table IV.9 shows the research instrument that is a questionnaire of convenience, price, service quality, safety, and product purchase decisions are declared reliable, as evidenced by each value of x cronbach alpha> 0.6. The reliability test results above indicate that the instrument has the reliability to obtain research data
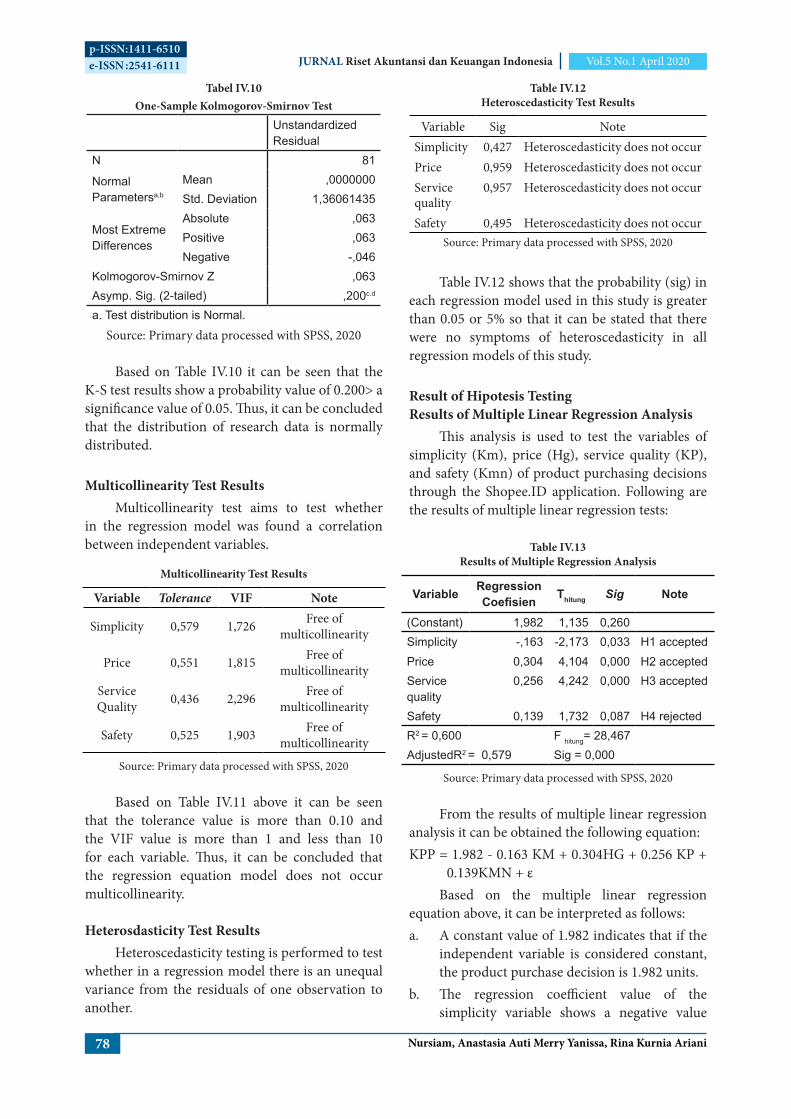
Classic Assumption Test ResultsNormality Test Results
Normality test aims to test whether in the regression model, confounding or residual variables have a normal distribution, if this assumption is violated then the statistical test becomes invalid for a small number of samples (Imam Ghozali (2011: 160).
78
p-ISSN:1411-6510e-ISSN :2541-6111
Nursiam, Anastasia Auti Merry Yanissa, Rina Kurnia Ariani
JURNAL Riset Akuntansi dan Keuangan Indonesia Vol.5 No.1 April 2020
Tabel IV.10One-Sample Kolmogorov-Smirnov Test
Unstandardized Residual
N 81
Normal Parametersa,b
Mean ,0000000Std. Deviation 1,36061435
Most Extreme Differences
Absolute ,063Positive ,063Negative -,046
Kolmogorov-Smirnov Z ,063Asymp. Sig. (2-tailed) ,200c.d
a. Test distribution is Normal.
Source: Primary data processed with SPSS, 2020
Based on Table IV.10 it can be seen that the K-S test results show a probability value of 0.200> a significance value of 0.05. Thus, it can be concluded that the distribution of research data is normally distributed.
Multicollinearity Test ResultsMulticollinearity test aims to test whether
in the regression model was found a correlation between independent variables.
Multicollinearity Test Results
Variable Tolerance VIF Note
Simplicity 0,579 1,726 Free of multicollinearity
Price 0,551 1,815 Free of multicollinearity
Service Quality 0,436 2,296 Free of
multicollinearity
Safety 0,525 1,903 Free of multicollinearity
Source: Primary data processed with SPSS, 2020
Based on Table IV.11 above it can be seen that the tolerance value is more than 0.10 and the VIF value is more than 1 and less than 10 for each variable. Thus, it can be concluded that the regression equation model does not occur multicollinearity.
Heterosdasticity Test ResultsHeteroscedasticity testing is performed to test
whether in a regression model there is an unequal variance from the residuals of one observation to another.
Table IV.12Heteroscedasticity Test Results
Variable Sig Note Simplicity 0,427 Heteroscedasticity does not occurPrice 0,959 Heteroscedasticity does not occurService quality
0,957 Heteroscedasticity does not occur
Safety 0,495 Heteroscedasticity does not occurSource: Primary data processed with SPSS, 2020
Table IV.12 shows that the probability (sig) in each regression model used in this study is greater than 0.05 or 5% so that it can be stated that there were no symptoms of heteroscedasticity in all regression models of this study.
Result of Hipotesis TestingResults of Multiple Linear Regression Analysis
This analysis is used to test the variables of simplicity (Km), price (Hg), service quality (KP), and safety (Kmn) of product purchasing decisions through the Shopee.ID application. Following are the results of multiple linear regression tests:
Table IV.13Results of Multiple Regression Analysis
Variable Regression Coefisien Thitung Sig Note
(Constant) 1,982 1,135 0,260Simplicity Price
-,1630,304
-2,1734,104
0,0330,000
H1 acceptedH2 accepted
Service quality
0,256 4,242 0,000 H3 accepted
Safety 0,139 1,732 0,087 H4 rejectedR2 = 0,600 F hitung= 28,467AdjustedR2 = 0,579 Sig = 0,000
Source: Primary data processed with SPSS, 2020
From the results of multiple linear regression analysis it can be obtained the following equation:KPP = 1.982 - 0.163 KM + 0.304HG + 0.256 KP +
0.139KMN + εBased on the multiple linear regression
equation above, it can be interpreted as follows:a. A constant value of 1.982 indicates that if the
independent variable is considered constant, the product purchase decision is 1.982 units.
b. The regression coefficient value of the simplicity variable shows a negative value
79
p-ISSN:1411-6510e-ISSN :2541-6111
Simplicity, Price, Quality of Service and Safety Towards The Decision to Purchase Products ...
JURNAL Riset Akuntansi dan Keuangan IndonesiaVol.5 No.1 April 2020
of 0.163 which means that if the simplicity variable increases by one unit, the product purchasing decision will decrease by 0.163 units with the other variables considered constant.
c. The regression coefficient of the price variable shows a positive value of 0.304, which means that if the price variable increases by one unit, then the product purchase decision will increase by 0.304 units with other variables considered constant.
d. The regression coefficient value of the service quality variable shows a positive value of 0.256 which means that if the service quality variable increases by one unit, then the product purchase decision will increase by 0.256 units with other variables considered constant.
e. The regression coefficient value of the safety variable shows a positive value of 0.139 which means that if the security variable increases by one unit, the product purchasing decision will increase by 0.139 units with other variables considered constant.
Coefficient of Determination (R2)The coefficient of determination (R2) is used
to test the goodness-fit of the regression model (Ghozali, 2011: 177). The calculation results for the adjusted R2 value with the help of the SPSS program, in the multiple regression analysis it was obtained the coefficient of determination or adjusted R2 of 0.579. This means that 57.90% of
the variations in customer satisfaction variables are explained by the variables of simplicity, price, customer quality, and safety. While the remaining 42.10% is explained by other factors that are not included in the observation of this study. Then it can be concluded that, the results of these tests indicate that the research model is goodness-fit.
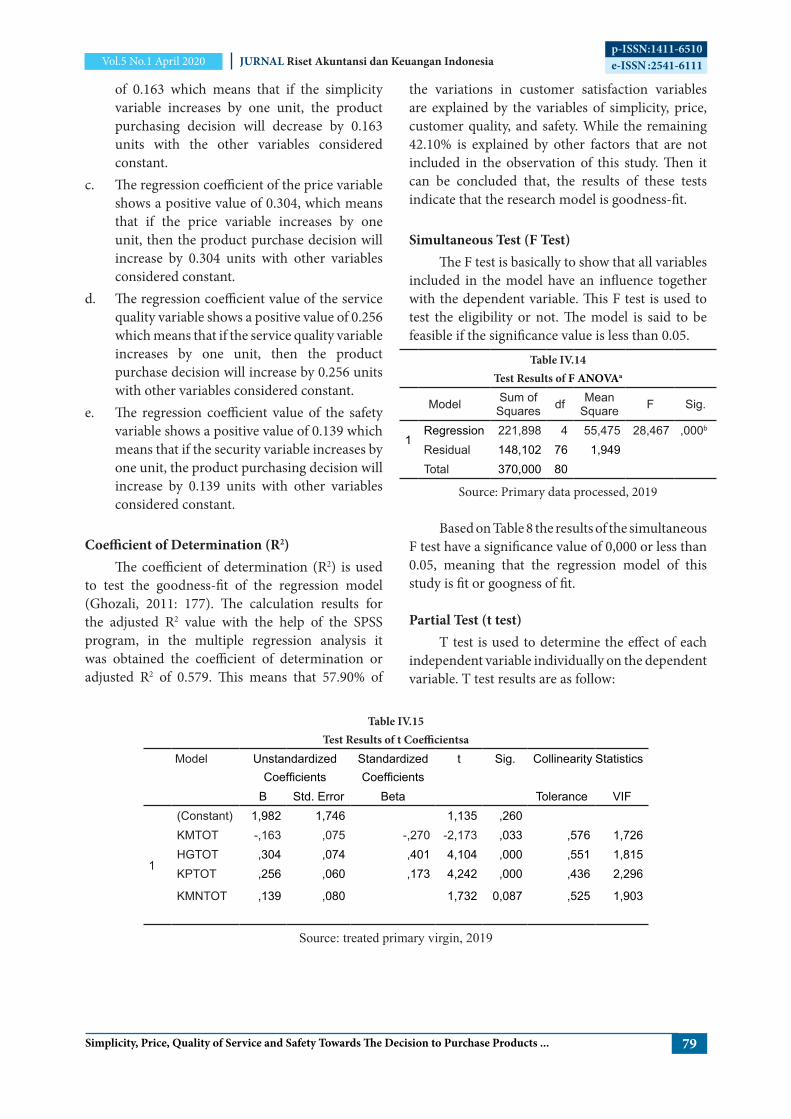
Simultaneous Test (F Test)The F test is basically to show that all variables
included in the model have an influence together with the dependent variable. This F test is used to test the eligibility or not. The model is said to be feasible if the significance value is less than 0.05.
Table IV.14Test Results of F ANOVAa
Model Sum of Squares df Mean
Square F Sig.
1Regression 221,898 4 55,475 28,467 ,000b
Residual 148,102 76 1,949Total 370,000 80
Source: Primary data processed, 2019
Based on Table 8 the results of the simultaneous F test have a significance value of 0,000 or less than 0.05, meaning that the regression model of this study is fit or googness of fit.
Partial Test (t test)T test is used to determine the effect of each
independent variable individually on the dependent variable. T test results are as follow:
Table IV.15Test Results of t Coefficientsa
Model Unstandardized Coefficients
Standardized Coefficients
t Sig. Collinearity Statistics
B Std. Error Beta Tolerance VIF
1
(Constant) 1,982 1,746 1,135 ,260KMTOT -,163 ,075 -,270 -2,173 ,033 ,576 1,726HGTOT ,304 ,074 ,401 4,104 ,000 ,551 1,815KPTOT
KMNTOT
,256
,139
,060
,080
,173 4,242
1,732
,000
0,087
,436
,525
2,296
1,903
Source: treated primary virgin, 2019
80
p-ISSN:1411-6510e-ISSN :2541-6111
Nursiam, Anastasia Auti Merry Yanissa, Rina Kurnia Ariani
JURNAL Riset Akuntansi dan Keuangan Indonesia Vol.5 No.1 April 2020
Based on the results of t test, Table IV.13 shows that:1. The results of the t test statistics for the
simplicity of variables revealed Ttest value of -2.173 < Ttable 1.99167 with a sig value of 0.033 <0.05. Thus it can be concluded that H1 is accepted which means that the simplicity variable (KM) has a significant effect on product purchasing decisions (KPP).
2. The results of the t test statistics for the price variable, it is obtained the value of Ttest 4.104> Ttable 1.99167 with a sig value of 0.000 <0.05. Thus it can be concluded that H2 is accepted which means that the price variable (HG) has a significant effect on product purchasing decisions (KPP).
3. The results of the t test statistics for the service quality variable, it is obtained the value of Ttest 4.242> Ttable 1.99167 with a sig value of 0.000 <0.05. Thus it can be concluded that H3 is accepted, which means that the service quality variable (KP) significantly influences the product purchase decision (KPP).
4. The results of the t test statistics for the safety variable showed the value of Ttest 1.732 < Ttable 1.99167 with a sig value of 0.087> 0.05. Thus it can be concluded that H4 is rejected which means that the safety variable (KMN) has no significant effect on product purchasing decisions (KPP).
Discussion The Effect of Simplicity on Product Purchasing Decisions via Shoppe.ID Application
The result of the simplicity variable showed that Ttest > Ttable, -2,173> 1.99167 with a significance value of 0.033 <0.05. Thus, it can be concluded that H1 is accepted which means that the simplicity variable (KM) has a significant effect on product purchasing decisions (KPP). This is because, the first time a buyer conducts an online transaction, ordinary buyers who are technology illiterate will have difficulty making this transaction. Some buyers want to make a purchase but don’t understand how to do transaction online. So, they will find this application difficult to use. They will look for information on how to make transactions using the application and will try to do it. However, due to software updates with the aim of making it easier for customers to make purchases by providing some
new features that are done continuously by shope.id, ordinary customers will tend to start lazy to use it. Although this application is designed to be easier to be used, but with more and more features it will make the application more complicated than when it was first used. This will make them lazy to relearn this when they will make a purchase and this makes them less likely to want to make transactions online. It can be concluded that, according to shopee.id, the addition of some application features will make it easier for customers to use it, but for some people who are too lazy to learn something new, making the new application difficult to use. This research is in line with research conducted by Hidayah (2018) and Ayuningtyas (2018).
The Effect of Prices on Product Purchasing Decisions via Shoppe.ID Application
The results of the t test statistics for the price variable, it was obtained the value of Ttest 4.104> Ttable 1.99167 with a sig value of 0.000 <0.05. Thus, it can be concluded that H2 is accepted which means that the price variable (HG) has a significant effect on product purchasing decisions (KPP). This is because price is the main factor in purchasing a product. Consumers will tend to compare the same products with prices that are more affordable. Consumers will choose to buy the same product at a cheaper price than the price which is much expensive, this is because the item is more economical. Therefore, online sellers are competing to set low prices and always hold promos to attract customers to make a purchase. The result of this study is in line with the research conducted by Syahrial (2015), Fathudin (2015), and Lubis and Hidayat (2017).
The Effect of Service Quality on Product Purchasing Decisions through Shoppe.ID Application
The result of the t test for the variable quality of service, it was obtained Ttest value of 4.242> Ttable 1.99167 with a sig value of 0.000 <0.05. Thus, it can be concluded that H3 is accepted, which means that the service quality variable (KP) significantly influences the product purchase decision (KPP). The result of this study supports the opinion expressed by Tjiptono (2010: 259) mentioning that the quality of service is an effort to meet the needs and desires of consumers, as well as the accuracy of delivery to offset consumer expectations. The Shopee.ID
81
p-ISSN:1411-6510e-ISSN :2541-6111
Simplicity, Price, Quality of Service and Safety Towards The Decision to Purchase Products ...
JURNAL Riset Akuntansi dan Keuangan IndonesiaVol.5 No.1 April 2020
application currently provides a mobile social commerce platform which can be seen from the Social Sharing, L4e Chat and hashtag features. The l4e chat feature provided by shopee makes it different from other e-commerce companies. Through this L4e Chat feature, buyers can directly communicate with the seller regarding the product purchased without the need to save the seller’s telephone number first. In addition, Shopee provides social features including hashtag functions, which can provide the best service related to trends in goods or products that are popular. The information and product description offered is enough to provide a description of the product so that it is easier for consumers to make purchasing decisions. fast, and guaranteed availability and suitability of the goods. This research is also in accordance with research conducted by Yugi Setyarko (2016).
The Effect of Safety on Product Purchase Decisions through Shoppe Application. ID
The result of the t test showed Ttest was 1.732 and it was < Ttable 1.99167 with a sig value of 0.087> 0.05. Thus, it can be concluded that H4 is rejected which means that the safety variable (KMN) has no significant effect on product purchasing decisions (KPP). This is because the level of security of shopee.id customer accounts is good enough so that customers do not feel worried when they first register at the shopee.id application. When a consumer first regrets his account to shopee.id then shopee.id will automatically provide email verification to the consumer. Shopee.id will
guarantee and maintain the confidentiality of the customer’s account. So, customers no longer need to think about the leakage of personal information to third parties. The result of this study is in line with the research conducted by Wijaya (2018).
CLOSING
ConclusionBased on the results of the study it is showed
that the variable of simplicity, price and quality of service affect the product purchase decision through the Shopee.ID application, while security does not affect the product purchase decision through the Shopee.ID application
This study is inseparable from limitations, including in collecting data using a questionnaire and only using internal factors so that the results of the study have not been maximized, and the object is only the accounting student of the 2016 Faculty of Economics and Business UMS, so that it cannot obtain a better level of generalization. It only covers one university, so it is necessary to develop research that has a broader scope by taking a larger sample. Therefore, for further research it is expected to collect data not only using questionnaires but with in-depth interviews or interviews with respondents, so that the information obtained can be more varied, in conducting further testing of variables using external factors, and further broadening the scope of research or research object so that the level of generalization to the wider population.
82
p-ISSN:1411-6510e-ISSN :2541-6111
Nursiam, Anastasia Auti Merry Yanissa, Rina Kurnia Ariani
JURNAL Riset Akuntansi dan Keuangan Indonesia Vol.5 No.1 April 2020
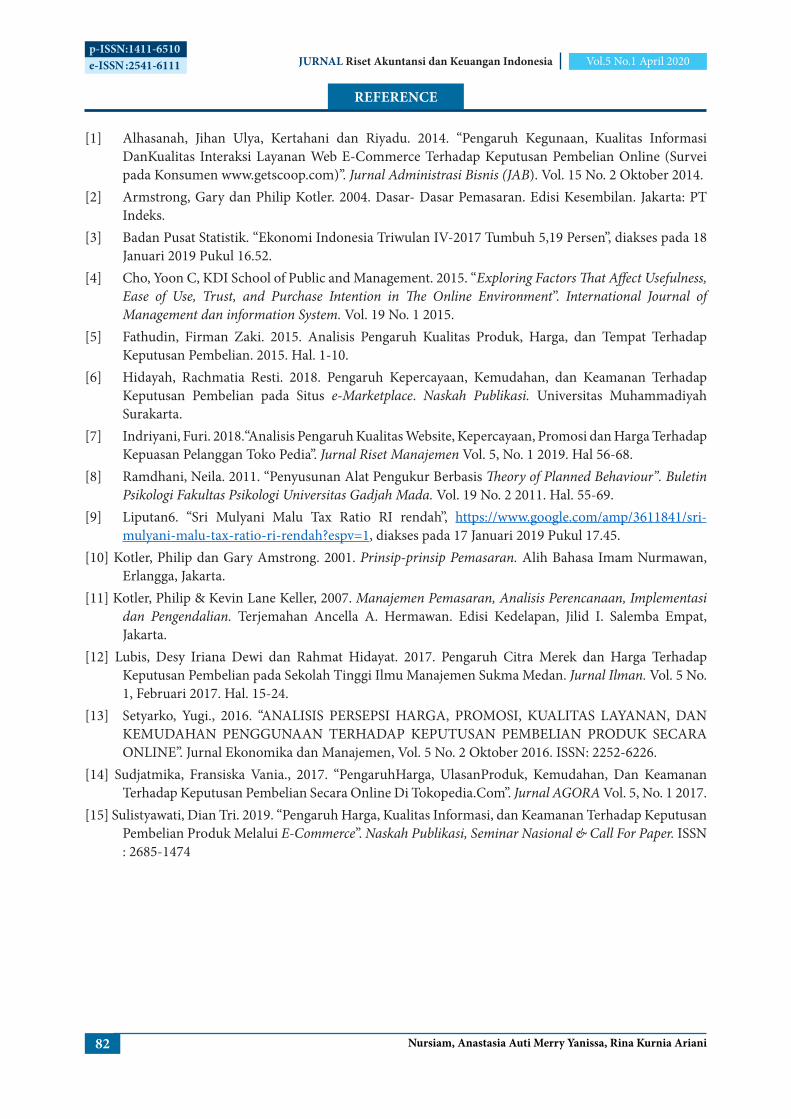
REFERENCE
[1] Alhasanah, Jihan Ulya, Kertahani dan Riyadu. 2014. “Pengaruh Kegunaan, Kualitas Informasi DanKualitas Interaksi Layanan Web E-Commerce Terhadap Keputusan Pembelian Online (Survei pada Konsumen www.getscoop.com)”. Jurnal Administrasi Bisnis (JAB). Vol. 15 No. 2 Oktober 2014.
[2] Armstrong, Gary dan Philip Kotler. 2004. Dasar- Dasar Pemasaran. Edisi Kesembilan. Jakarta: PT Indeks.
[3] Badan Pusat Statistik. “Ekonomi Indonesia Triwulan IV-2017 Tumbuh 5,19 Persen”, diakses pada 18 Januari 2019 Pukul 16.52.
[4] Cho, Yoon C, KDI School of Public and Management. 2015. “Exploring Factors That Affect Usefulness, Ease of Use, Trust, and Purchase Intention in The Online Environment”. International Journal of Management dan information System. Vol. 19 No. 1 2015.
[5] Fathudin, Firman Zaki. 2015. Analisis Pengaruh Kualitas Produk, Harga, dan Tempat Terhadap Keputusan Pembelian. 2015. Hal. 1-10.
[6] Hidayah, Rachmatia Resti. 2018. Pengaruh Kepercayaan, Kemudahan, dan Keamanan Terhadap Keputusan Pembelian pada Situs e-Marketplace. Naskah Publikasi. Universitas Muhammadiyah Surakarta.
[7] Indriyani, Furi. 2018.“Analisis Pengaruh Kualitas Website, Kepercayaan, Promosi dan Harga Terhadap Kepuasan Pelanggan Toko Pedia”. Jurnal Riset Manajemen Vol. 5, No. 1 2019. Hal 56-68.
[8] Ramdhani, Neila. 2011. “Penyusunan Alat Pengukur Berbasis Theory of Planned Behaviour”. Buletin Psikologi Fakultas Psikologi Universitas Gadjah Mada. Vol. 19 No. 2 2011. Hal. 55-69.
[9] Liputan6. “Sri Mulyani Malu Tax Ratio RI rendah”, https://www.google.com/amp/3611841/sri-mulyani-malu-tax-ratio-ri-rendah?espv=1, diakses pada 17 Januari 2019 Pukul 17.45.
[10] Kotler, Philip dan Gary Amstrong. 2001. Prinsip-prinsip Pemasaran. Alih Bahasa Imam Nurmawan, Erlangga, Jakarta.
[11] Kotler, Philip & Kevin Lane Keller, 2007. Manajemen Pemasaran, Analisis Perencanaan, Implementasi dan Pengendalian. Terjemahan Ancella A. Hermawan. Edisi Kedelapan, Jilid I. Salemba Empat, Jakarta.
[12] Lubis, Desy Iriana Dewi dan Rahmat Hidayat. 2017. Pengaruh Citra Merek dan Harga Terhadap Keputusan Pembelian pada Sekolah Tinggi Ilmu Manajemen Sukma Medan. Jurnal Ilman. Vol. 5 No. 1, Februari 2017. Hal. 15-24.
[13] Setyarko, Yugi., 2016. “ANALISIS PERSEPSI HARGA, PROMOSI, KUALITAS LAYANAN, DAN KEMUDAHAN PENGGUNAAN TERHADAP KEPUTUSAN PEMBELIAN PRODUK SECARA ONLINE”. Jurnal Ekonomika dan Manajemen, Vol. 5 No. 2 Oktober 2016. ISSN: 2252-6226.
[14] Sudjatmika, Fransiska Vania., 2017. “PengaruhHarga, UlasanProduk, Kemudahan, Dan Keamanan Terhadap Keputusan Pembelian Secara Online Di Tokopedia.Com”. Jurnal AGORA Vol. 5, No. 1 2017.
[15] Sulistyawati, Dian Tri. 2019. “Pengaruh Harga, Kualitas Informasi, dan Keamanan Terhadap Keputusan Pembelian Produk Melalui E-Commerce”. Naskah Publikasi, Seminar Nasional & Call For Paper. ISSN : 2685-1474


![[PPT]PowerPoint Presentation - Nexus Database System : …stardata.nrf.ac.za/forms/present/NETD_Hammes.ppt · Web viewWork towards simplicity and the shortest routes. Workflow –](https://img.pdfslide.us/doc/110x75/5acc87197f8b9a875a8cb4a3/pptpowerpoint-presentation-nexus-database-system-viewwork-towards-simplicity.jpg)