Embed Size (px)
Citation preview
CAN EMERGING MARKETS OFFER DIVERSIFICATIONBENEFITS TO CANADIAN INVESTORS DURING CREDIT
CRISIS?
by
Amy Chiu
And
Jacky ShenMBA University of Pittsburgh 1995
PROJECT SUBMITTED IN PARTIAL FULFILLMENTOF THE REQUIREMENTS FOR THE DEGREE OF
MASTER OF BUSINESS ADMINISTRATION
In theGlobal Asset and Wealth Management Program
of theFaculty of Business Administration
© Amy Chiu and Jacky Shen, 2007
SIMON FRASER UNIVERSITY
Fall 2007
All rights reserved. This work may not bereproduced in whole or in part, by photocopy
or other means, without permission of the author.

APPROVAL
Name:
Degree:
Title of Project:
Supervisory Committee:
Date Approved:
Amy Chiu and Jacky Shen
Master of Business Administration
Can Emerging Markets offer diversification benefitsto Canadian investors during credit crisis?
Peter KleinSenior SupervisorProfessor of Finance
George BlazenkoSecond ReaderAssociate Professor
ii

SIMON FRASER UNIVERSITYLIBRARY
Declaration ofPartial Copyright LicenceThe author, whose copyright is declared on the title page of this work, has grantedto Simon Fraser University the right to lend this thesis, project or extended essayto users of the Simon Fraser University Library, and to make partial or singlecopies only for such users or in response to a request from the library of any otheruniversity, or other educational institution, on its own behalf or for one of its users.
The author has further granted permission to Simon Fraser University to keep ormake a digital copy for use in its circulating collection (currently available to thepublic at the "Institutional Repository" link of the SFU Library website<www.lib.sfu.ca> at: <http://ir.lib.sfu.ca/handle/1892/112>) and, without changingthe content, to translate the thesis/project or extended essays, if technicallypossible, to any medium or format for the purpose of preservation of the digitalwork.
The author has further agreed that permission for multiple copying of this work forscholarly purposes may be granted by either the author or the Dean of GraduateStudies.
It is understood that copying or publication of this work for financial gain shall notbe allowed without the author's written permission.
Permission for public performance, or limited permission for private scholarly use,of any multimedia materials forming part of this work, may have been granted bythe author. This information may be found on the separately cataloguedmultimedia material and in the signed Partial Copyright Licence.
While licensing SFU to permit the above uses, the author retains copyright in thethesis, project or extended essays, including the right to change the work forsubsequent purposes, including editing and publishing the work in whole or inpart, and licensing other parties, as the author may desire.
The original Partial Copyright Licence attesting to these terms, and signed by thisauthor, may be found in the original bound copy of this work, retained in theSimon Fraser University Archive.
Simon Fraser University LibraryBurnaby, BC, Canada
Revised: Fall 2007
ABSTRACT
This paper examines whether emerging markets offer benefits to a Canadian
portfolio when it is needed most during a credit crisis. The study considers the
relationship of the monthly data of ten emerging market indices (EM) and its weighted
index with Toronto Stock Exchange Composite Index (TSX) through out 1998 to August
2007. We add S&P500 and MSCI EAFE to represent a diversified developed market
portfolio. While the findings indicate most individual emerging market and its weighted
index do not add values to a Canadian portfolio when credit risk is tight, China stands out
differently. China adds significant diversification benefits to the developed market
portfolio when credit risk is tight. When examining the subprime credit crunch in
summer 2007, the results are consistent with the sample period, that is, Canadian
investors benefit from diversifying in China during credit crisis.
Keywords: Emerging Markets, Ted Spread. Credit Risk, Diversifications
iii

ACKNOWLEDGEMENTS
We would like to thank Dr. Peter Klein for both inspiring and guiding us to
research a timely and interesting topic. We are also grateful to Dr. George Blazenko for
his insightful comments.
iv
TABLE OF CONTENTS
Approval ii
Abstract iii
Acknowledgements iv
Table of Contents v
List of Tables vi
List of Figures vii
Glossary viii
1: Introduction 1
2: Litera.ture Survey 4
3:Methods 73.1 Emerging Markets Index 73.2 Mean Variance Framework 83.3 Credit Risk 8
3.3.1 Binary Classification Approach 93.3.2 Absolute Mean Approach 9
3.4 2007 Subprime 103.5 Efficient Frontier 10
4:Results 11
4.1 Entire Sample Period 114.2 High and Low Credit Risk 124.3 2007 Subprime 134.4 Efficient Frontiers 13
4.4.1 Entire Sample Period 144.4.2 High and Low Credit Risk 15
5:Conclusions 19
Appendices 21Appendix A 21Appendix B. Tables 22Appendix C. Figures 28
Reference List 35
v
LIST OF TABLES
Table I GOP-Weighted Emerging Index 22Table II Summary Statistics for Monthly Stock Returns 23Table III Statistical Summary - Binary Approach 24Table IV Correlations with TSX 25Table V Statistical Summary - Ted Spread Mean Return Benchmark 26Table VI Summary Statistics for Daily Stock Returns 27
vi
LIST OF FIGURES
Figure 1. Efficient Frontier - Entire Sample Period 28Figure 2. Efficient Frontier - Binary Classification 29Figure 3. Efficient Frontier _High Credit Risk Period (Binary Classification) 30Figure 4. Efficient Frontier - Low Credit Risk Period (Binary Classification) 3lFigure 5. Efficient Frontier - Absolute Mean Approach .32Figure 6. Efficient Frontier - High Credit Risk Period (Absolute Mean Approach) .33Figure 7. Efficient Frontier - Low Credit Risk Period (Absolute Mean Approach) 34
vii
GLOSSARY
KOSPI
MSCI EAFEIndex
Korea Composite Stock Price Index
The Morgan Stanley Capital International (MSCI) EAFE Index is amarket capitalization index comprises of 21 MSCI country indices. Itrepresents the developed markets in Europe, Australaisa and Far East(EAFE). It is a benchmark to measure the performance of developedmarkets outside North American.
MSCIEmergingMarkets Index
PurchasingPower Parity(PPP)
Ted Spread
The Morgan Stanley Capital International Emergent Markets Index is awell recognized market capitalization index that measures equitymarket performance in the global emerging markets. It consists of 25emerging market country indices: Argentina, Brazil, Chile, China,Colombia, Czech Republic, Egypt, Hungary, India, Indonesia, Israel,Jordan Korea, Malaysia, Mexico, Morocco, Pakistan, Peru,Philippines, Poland, Russia, South Africa, Taiwan, Thailand andTurkey.
It is developed by Gustav Cassel in 1920 based on the law of one price.In an efficient market, there is only one price for the identical goods.The PPP utilized exchange rate to equalize the purchasing power ofdifferent countries. In theory, after adjustment by exchange rate, thepurchasing power of two currencies is the same for the same basket ofgoods. It is a more meaningful comparison of standards of livingamong countries rather than nominal GOP.
Ted Spread stands for Treasury Eurodollar Spread. It is the pricedifference between three-month future contracts of U.S. Treasuries andEurodollar as represented by the London Inter Bank Offered Rate(LIBOR) of the same expiration months. U.S. T-bills are consideredrisk free while Eurodollar future reflects the credit ratings of corporateborrowers. The spread are considered as an indicator of credit risk.When it diverges, it indicates credit risk is increasing.
Vlli
Subprime Subprime refers to the credit status of a borrower. Typically theborrower has deficient credit history or adverse financial situations thatdo not qualify to secure a loan at market interest rates. A subprimeloan is exposed to high default or foreclosure risk. A higher interestrate is charged to compensate for the additional risk. In this paper,subprime refers to the financial contagion created by the U.S. subprimemortgage crisis in 2007. When interest rate increased, many subprimeborrowers with flexible rate mortgages were unable to meet theirpayments, at the same time property values declined. Lenders, banksand financial institutions were unable to recoup losses which led to arestriction on the availability of credit in the world financial markets.
ix
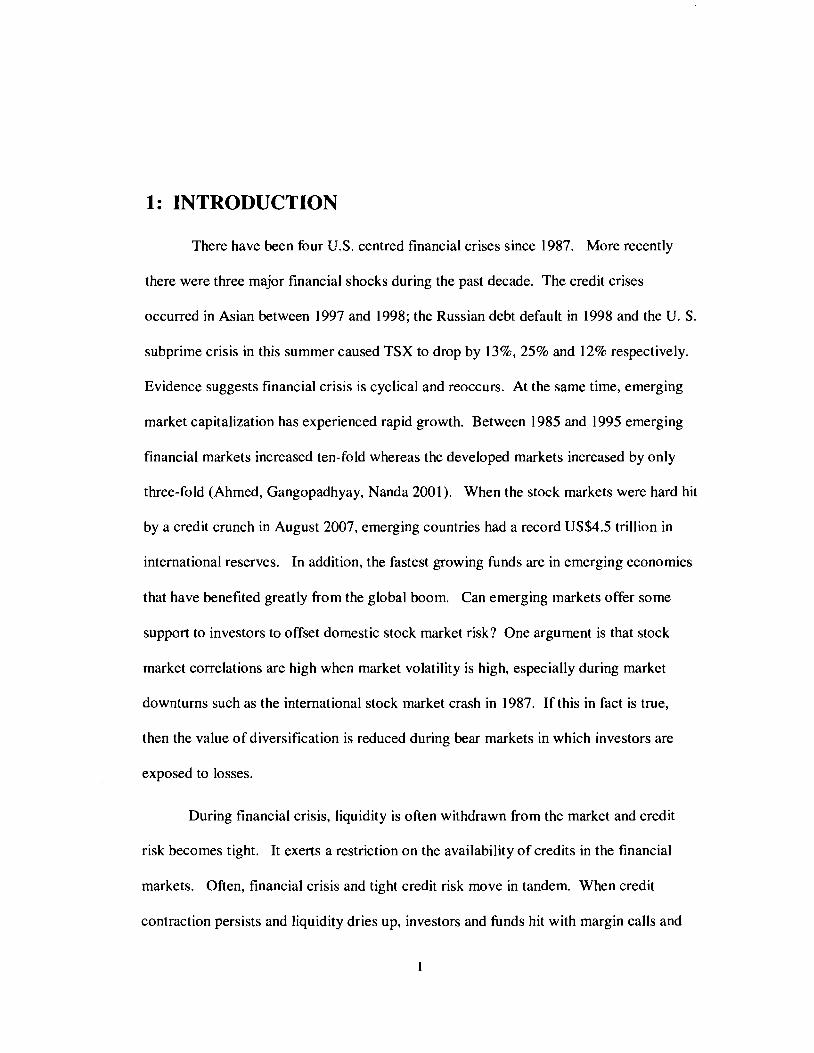
1: INTRODUCTION
There have been four U.S. centred financial crises since 1987. More recently
there were three major financial shocks during the past decade. The credit crises
occurred in Asian between 1997 and 1998; the Russian debt default in 1998 and the U. S.
subprime crisis in this summer caused TSX to drop by 13%, 25% and 12% respectively.
Evidence suggests financial crisis is cyclical and reoccurs. At the same time, emerging
market capitalization has experienced rapid growth. Between 1985 and 1995 emerging
financial markets increased ten-fold whereas the developed markets increased by only
three-fold (Ahmed, Gangopadhyay, Nanda 2001). When the stock markets were hard hit
by a credit crunch in August 2007, emerging countries had a record US$4.5 trillion in
international reserves. In addition, the fastest growing funds are in emerging economies
that have benefited greatly from the global boom. Can emerging markets offer some
support to investors to offset domestic stock market risk? One argument is that stock
market correlations are high when market volatility is high, especially during market
downturns such as the international stock market crash in 1987. If this in fact is true,
then the value of diversification is reduced during bear markets in which investors are
exposed to losses.
During financial crisis, liquidity is often withdrawn from the market and credit
risk becomes tight. It exerts a restriction on the availability of credits in the financial
markets. Often, financial crisis and tight credit risk move in tandem. When credit
contraction persists and liquidity dries up, investors and funds hit with margin calls and
withdrawal requests, investors may be forced to sell their best holdings to meet liquidity
needs. Borrowers may be forced to default and file for bankruptcy. Generally, it results
in a downturn in the stock market. This summer's credit crunch was a direct result of the
U.S. subprime nightmare. It caused the S&P 500 & TSX to decline by 9.4% and 12 %
respectively in July and August. Similar drops occurred in virtually every market in the
world hitting the emerging markets much harder, dropping them by an average 14.4%
with Brazil and Korea being hardest hit. Banks, other financial institutions and lenders
were unable to recoup their losses from thousands of subprime mortgage foreclosures and
led to a restriction on the availability of credit in the world financial markets. Several
financial companies were shut down or filed for bankruptcy. This led to a further
collapse of stock prices in August, 2007. The financial contagion has been associated
with a severe credit crunch in the greater financial markets, and worldwide stock market
melt down. Financial companies wrote off billions of subprime mortgage loans, several
hedge funds became worthless, and some mortgage lenders went bankrupt. The impact
spiIled over to the equity market causing increased volatility. A large daily drop is not
uncommon. For example the KOSPI dropped about 7% in a day. This is consistent with
the view that price volatility tends to be higher during liquidity shortage (Holmstrom,
Tirole 2000).
This paper examines whether emerging markets offer diversification benefits to
Canadian investors when stock markets experience downward pressure from credit risk
crisis. We study the local indices of ten emerging markets which represent 80% of the
GDP adjusted by the Purchasing Power Parity of MSCI Emerging Markets Index. The
sample period covers January 1998 to August 2007. It uses the Ted Spread, a well
2
recognized indicator of credit risk to separate stock markets to subperiods by high and
low credit risk. Credit risk is defined in two contexts. One is the binary classification
used by Conover, Jensen, Johnson 2002. When Ted Spread changes reverse direction
to diverge, the subperiod is considered as high credit risk period; when the spread
changes tum around to reduce the spread, the subperiod is considered as low credit risk
period. The second approach compares Ted Spread to the average spread of the sample
period. When the spread is above or below the average, it reflects high and low credit
risk environment respectively. The paper employs mean variance approach to examine
the mean returns, standard deviation, correlation of coefficient and correlation of
individual emerging country and the weighted index relative to TSX. We compare the
statistical results among the entire period, high and low risk periods of both approaches to
identify if any individual emerging market or its weighted index improves the
performance of a Canadian portfolio. The paper extends the study to the recent subprime
credit crisis in this summer; examining similar statistics and the resemblance to the ten
year sample period. Finally, the findings are tied together to form a combinations of
efficient frontiers using the mean-variance efficient framework. The asset mix includes
S&P 500, TSX, MSCI EAFE, the emerging markets weighted index and China to
optimize asset allocation for a Canadian portfolio.
3
2: LITERATURE SURVEY
A large volume of literature exists on international diversification. The rationale
for international portfolio diversification is that it expands the opportunities for gains
from portfolio diversification beyond those that are available through domestic securities.
Financial literature in the 1970s emphasized the benefits of international diversifications
among developed countries (e.g. Grubel 1968, Levy, Sarnat, 1970 and Solnick 1977).
This argument is based on stock markets that are less than perfectly correlated among
countries, and investors gain from risk reduction. Studies had mixed results in the 90's
and 2000' s while Errunza (1999); DeSantis and Gerard (1997), Stulz (1999) and Statman,
Scheid (2004) still supported international diversification offers values, Sinquefield
(1996), and Rodriguez (2007) inferred that market risk premiums are the same
throughout the developed markets. Some attributed the diminishing benefit to the
integration of the financial markets of developed countries in the past thirty-five years as
their stock market performance have became highly correlated (Campa & Fernandes
2005). Interest in diversification benefits has expanded to emerging markets in the past
20 years. Many studies demonstrate by empirical analysis that G7 stock portfolio earns
significant benefits by diversifying into emerging stock markets (Lessard 1973, Errunza
1983, Bailey and Stulz 1990, Bailey and Lim 1992, Li 2003). Theoretically the lower
correlation between emerging and developed markets leads to better risk diversification.
Some studies reveal that the liberalization of capital markets has increased the correlation
between the emerging markets index and developed markets, thus reducing the benefits
4
of pursuing indexing strategies in emerging markets. Country and stock selection
strategies are imperative in order to add significant values to a portfolio (Fernandes 2003,
Fernandes 2003, Antoniou, Olus, Paudyal 2006). Country selection attempts to identify
countries that have low correlation with the world financial markets. For instance, China
stock market was not much affected by 911 terrorist attacks and Asian crisis in 1997
compare to the world financial markets. Yao Yao (2002) explained the unusual
performance of the China stock market by the inconvertibil ity of China's currency RMB
and China's solid USD reserve.
More recent research investigates diversification strategies in specific economic
or market conditions, such as US monetary policy and market downturn. Studies have
mixed results in turbulent market, especially in market downturn (Campbell, Forbes,
Koedijk, Kofman 2006). Often, it is associated with higher correlations among
international markets and reduced diversification benefits (Butler, Joaquin 2001).
Sarkar, Patel 1998 confirms "that correlations between U.S. and other emerging markets
tend to be higher in times of market decline". Their study reveals strong evidence of
contagion within region and relates all market crises in their sample periods 1970 to 1997
to a financial crisis. The contagion effect during stock market crisis affects both
developed and developing markets. Developed markets tend to have smaller price
decline and recover faster than emerging markets. Data further confirms portfolio
benefits decrease during market crisis, in particular during emerging market crisis
(Sarkar, Patel 1998 Patev, Kanaryan 2003). These findings bring up the question if
emerging markets a poor diversification option during market crisis when it is needed
most?
5
Many studies report US monetary policy affects the performance of US and
emerging equity markets (Jensen & Johnson 1995, Conover, Jensen & Johnson 2002)
especially those with large proportions of their trade with the U.S. Johnson, Buetow and
Jensen (1999) also reveal that international equity fund indices have higher returns during
periods of U.S. monetary expansion than restrictive periods. Conover, Jensen and
Johnson (2002) confirmed similar observations. However, China is not included in the
the above studies. The contagion effect on China has yet to be tested. Especially when
Yao Yao (2002) suggests "the Dow Jones Industrial Index and The NASDAQ Composite
often reflect the world economics but fail in the case of China market" it is worth to
extend the study adding China in the emerging market mix.
Credit risk is a well recognize factor that has a close relationship with economic
conditions. Demchuk and Gibson (2004) suggest credit spreads are lower during
economic expansions and higher during recessions. Their study shows past
performance of the stock index and the correlation between firm's assets and index return
has a significant impact on credit spread. Similarly, Forte, Pena (2007) demonstrate that
stocks lead credit risk more times than the opposite. Credit risk appears to be a desirable
factor to replace monetary policy to evaluate the efficiency of diversification benefits.
6
3: METHODS
3.1 Emerging Market Index
This study follows the Conover, Jensen and Johnson 2002 (CJJ) mean variance
approach and conducts the analysis from the perspective of a Canadian investor. We
select the top ten emerging markets based on their PPP GDP in 2006. Their total PPP
GDP represents over 80% of the MSCI emerging markets index and 34.48% of the
world. CJJ uses 20 countries but these countries in total represent only 21.85% of the
world PPP GDP in 2006. Although this paper uses less than half of CJJ's number of
countries, we believe our emerging market composite index truly represents the values of
the current global emerging markets. The total emerging market GDP in our sample is
1.5 times higher than CJJ's in 2006's values. We use the returns of the country local
stock market index, converting it to Canadian currency to construct a weighted emerging
market index. The weight based on the average annual GDP in our sample period of
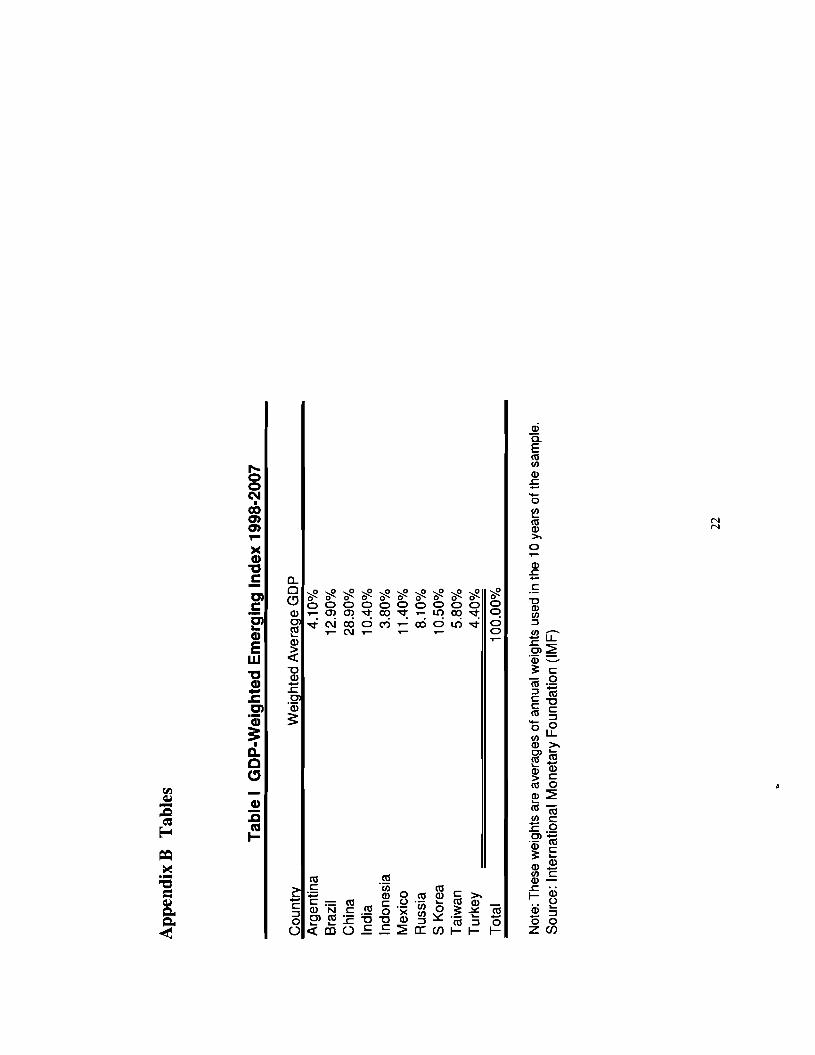
1998 to August 2007. Table I provides the average weights of each country. China
comprises almost 30% of the total weight. Brazil, India, Mexico and South Korea make
up another 45%. Although Argentina, Indonesia, Russia, Taiwan and Turkey represent
half of the top ten countries, they make up only 25% of the weighted GDP. The weight is
concentrated in the top 5 countries which represent 75% of the total GDP.
7
3.2 Mean Variance Framework
The mean variance framework developed by Markowitz (1952) is employed in
this paper. The basic assumption is to optimize expected return for a given level of
variance (or standard deviation) or vice versa, to minimize variance (or standard
deviation) given the expected return. End of the month data of the indices have been
collected from January] 998 to August, 2007, yielding a total of 116 observations per
index. With the liberalization of the emerging markets, we believe the past decade is a
better indicator of the current investment environment. We include the same sample
period for S&P 500 and MSCI EAFE to represent global developed markets. Returns on
the indices are measured in Canadian dollars, based on month end exchange rate.
Microsoft Excel is used to calculate the mean, variance, standard deviation, covariance,
correlation of coefficient, correlation with TSX, and T-test.
3.3 Credit Risk
Two approaches are used to define credit risk environment. Both are based on the
Ted Spread, a widely accepted indicator of credit risk and the liquidity of capital market.
When the Ted Spread increases, default risk is considered to be increasing, and investors
will prefer safe investments. Generally it signifies lower liquidity which translates to
higher corporate borrowing rate and an adverse effect on equity returns. A rising Ted
spread is an indicator of a market downturn as liquidity is withdrawn. Conversely, when
the spread decreases, the risk of default is considered to be decreasing. Liquidity eases
off and there is a free flow of capital for investments.
8

3.3.1 Binary Classification Approach
Similar to CJJ, we use the binary classification which was introduced by Jensen
and Johnson (1995). We classify credit risk environment as high when Ted spread
reverses direction to increase the spread, low when the spread turns around its direction
to decrease. When Ted spread changes remain in the same direction, an increasing
spread represents high credit risk environment persists while a decreasing spread stands
for low credit risk condition continues. We follow CJJ's approach and eliminate the first
month when Ted spread change in direction to remove the transition month that falls
between two different periods, in this case, the high and low credit risk periods. There
are 36 months considered as low and 20 months as high credit risk periods.
3.3.2 Absolute Mean Approach
We take 0.4, the absolute mean of the Ted Spread in our sample period as the
benchmark. When Ted spread is higher than the average, the month is considered as high
credit risk (or higher than average credit risk); spread that is lower than the average as
low credit risk environment (or lower than average credit risk). There are 73 months
below the average, and 43 months above it.
Within each approach, we calculate the mean, standard deviation, correlation of
coefficient, the correlation between returns with respect to TSX, and use t-test to verify if
the results are statistically significant.
9
3.4 2007 Subprime
We calculate the same statistical measures that are used for the above subperiods.
The daily data for the month of August, 2007 is used to represent the market turbulence
during this credit crisis. The purpose is to compare the result of a recent market
downturn with this paper's findings.
3.5 Efficient Frontier
This research employs the MATLAB frontcon function, utilizing the mean
variance approach to optimize returns for a Canadian portfolio. The portfolio maintains
a buy and hold strategy. We input the mean and covariance to generate different
combinations of efficient frontiers with constraint to short selling. The assets include
S&P 500, TSX, MSCI EAFE, Emerging Markets Weighted Index and China. It uses
three month Canadian T-bills in the same sample period as the risk free asset for the
tangency line.
10
4: RESULTS
4.1 Entire Sample Period
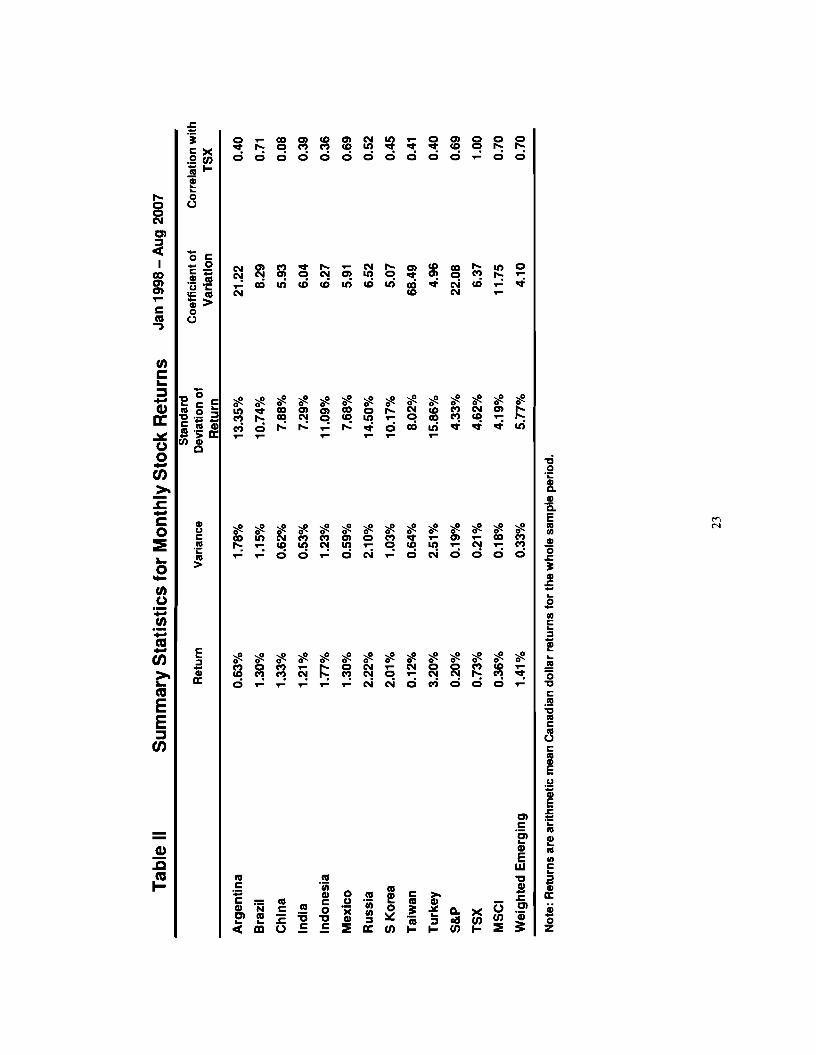
Table II provides statistical results for the entire period. The returns of all
emerging markets, except Taiwan and Argentina, are higher than TSX by 1.5 to 4.4
times. The return of the emerging markets weighted index is almost twice that of TSX.
Evidence generally suggests that emerging markets offer additional returns to a Canadian
portfolio. The standard deviation of each emerging market is 1.6 to 3.4 times higher than
TSX while the standard deviation of the emerging markets index is only 1.2 times higher
than TSX's. The volatility of emerging markets is reduced substantially when combined
together. While the standard deviation suggests emerging markets have a higher
volatility than TSX, the coefficient of variation (standard deviation divided by the mean)
is a more meaningful comparison using relative risk. Six of the emerging markets have
marginally lower coefficients of variation than TSX. These emerging markets, namely
China, India, Indonesia, Mexico, South Korea and Turkey, offer additional returns to a
Canadian investor for the same level of risk. Similar to the standard deviation, the
coefficient of variation is reduced substantially once it is combined to the weighted index.
This indicates risk is diversified away when the emerging markets are combined. The
correlation with TSX is a mixed bag. Brazil, Mexico and the weighted index exhibit a
correlation almost the same as the correlation between S&P500 and TSX. Contrary to
the view that developed markets are more integrated and higher correlated, Brazil and
Mexico resembles the correlation of a developed market with TSX during the sample
II
period. The rest of the emerging markets have an average correlation with TSX between
0.30 and 0.40 except China which stands out with a substantially lower correlation at
0.08. Of all the emerging markets, China, India, Indonesia, South Korea and Turkey
offer higher returns, lower coefficient of variation and correlation with TSX below 0.5.
They appear to be a favourable individual addition to a Canadian portfolio from the
perspective of both added returns and risk reduction.
4.2 High and Low Credit Risk
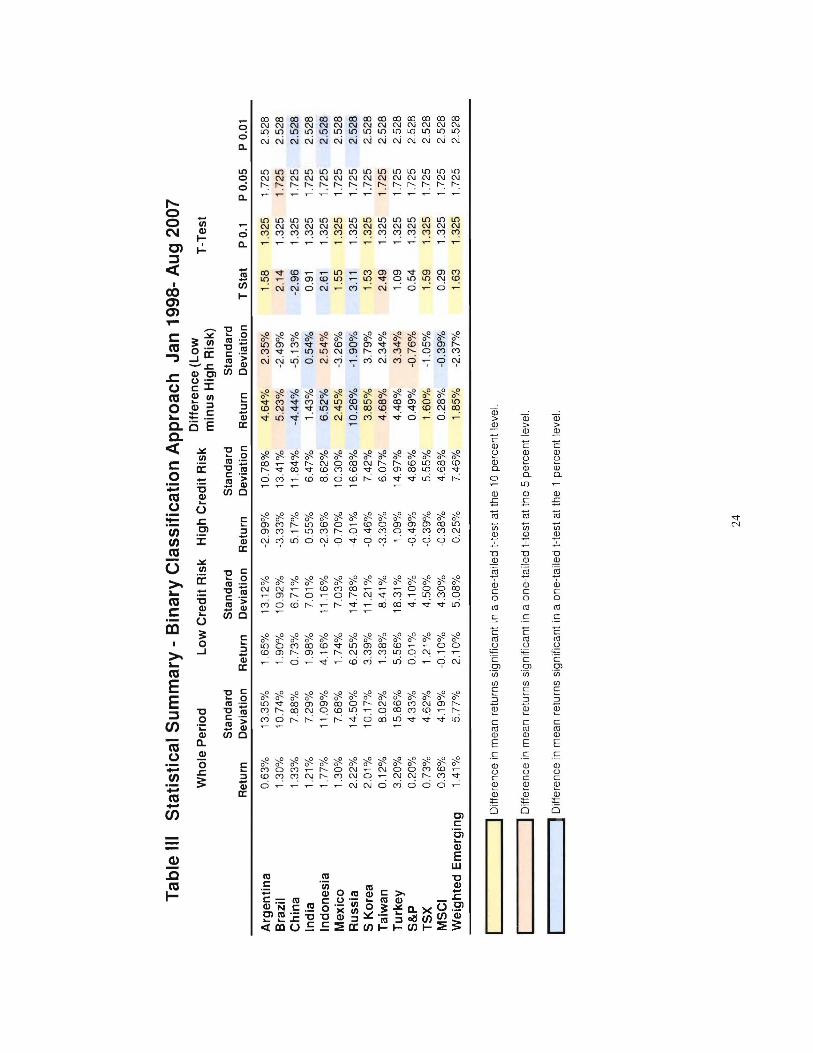
Table III exhibits statistical results based on the binary classification. Clearly,
this approach indicates that returns in a high credit risk environment are substantially
lower than a low credit risk period for all countries and composite indices except China.
Contrary to traditional beliefs that the stock market is under distress when liquidity and
credit risk is high, China's return improves from 0.73% to 5.17% (7 times). Half of the
emerging markets and all three developed market indices have higher standard deviations
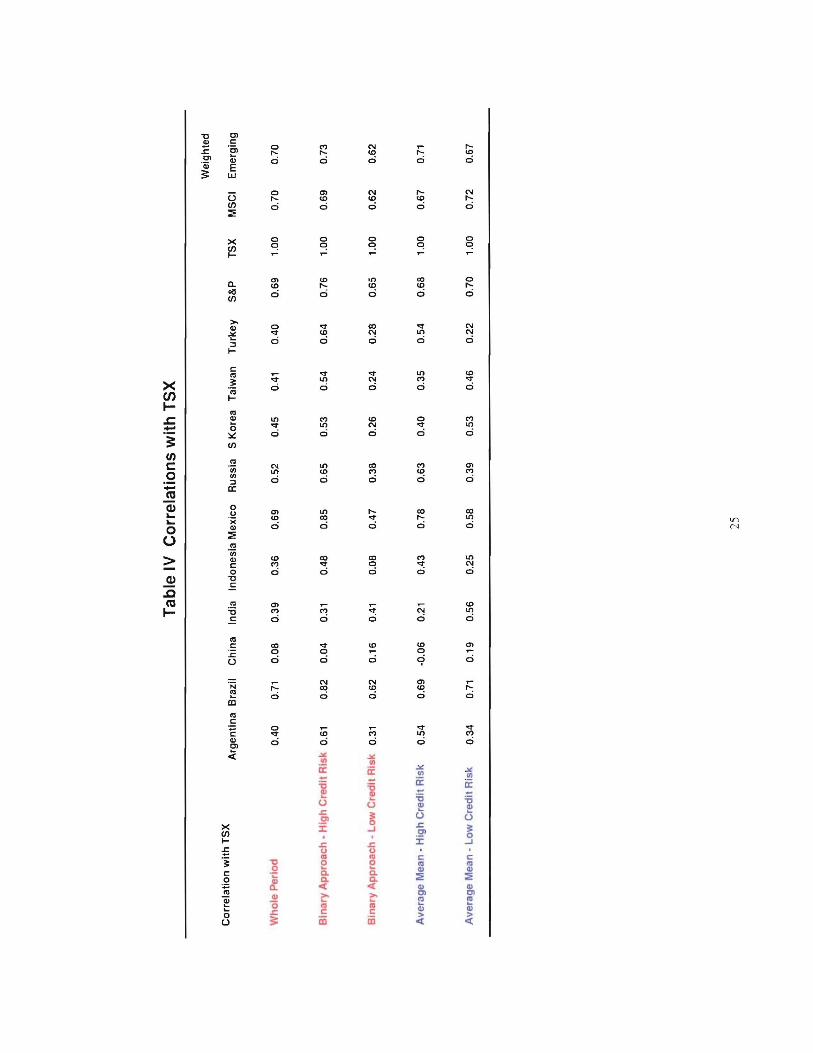
when credit risk is high. Table IV demonstrates almost all countries and composite
indices exhibit higher correlation with TSX when credit risk is high, except China and
India. China's correlation with TSX is 0.04 when credit risk is high. It is four times
lower than the correlation in low credit risk periods. This indicates China offers
substantial diversification to a Canadian portfolio when liquidity is tight. These results
are statistically significant. Correlation between India and TSX reduces from 0.41 to
0.31 (25% reduction) when credit risk reverses its direction to diverge.
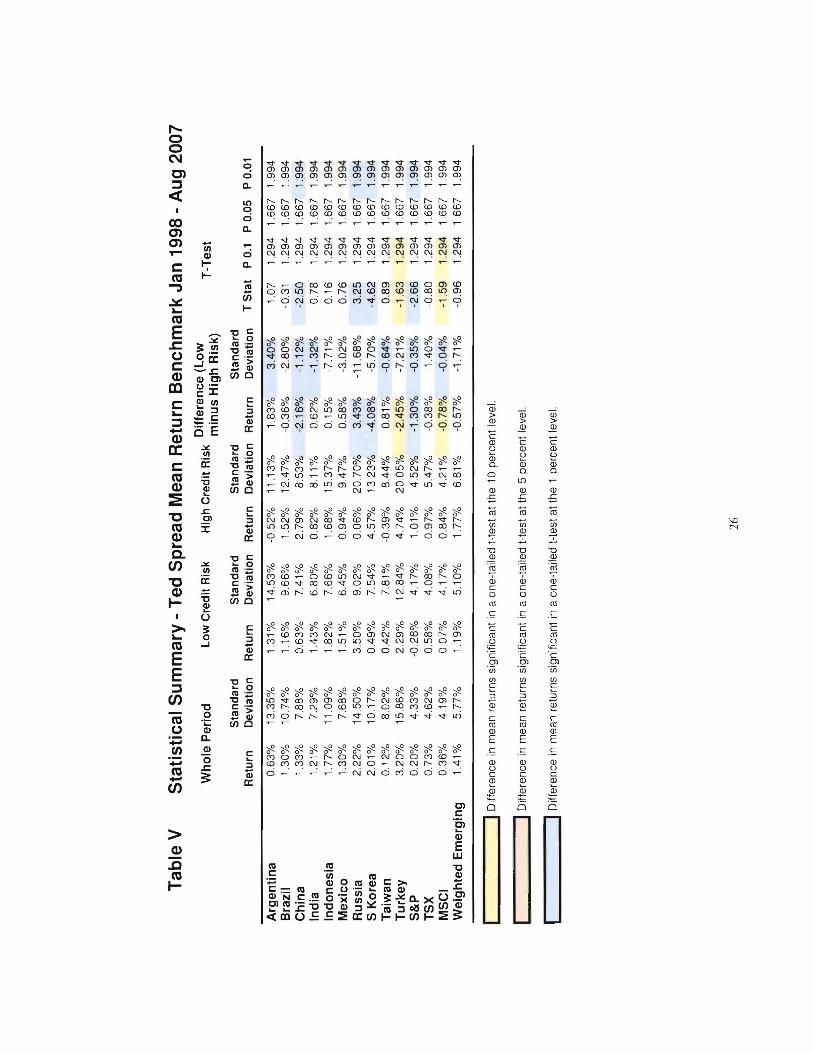
Table V presents the statistical summary using the absolute mean of the Ted
spread as a benchmark. The results are mixed. Four of the emerging markets and all four
composite indices have higher returns than TSX in high credit risk environment.
12
China's return increases from 0.63% to 2.79% (4.4 times) from low to high credit risk, a
substantial increase that is statistically significant. South Korea and Turkey also
demonstrate statistically significant higher returns when credit risk is high. Table IV
shows Brazil, China, India, Taiwan, S&P500 and MSCI EAFE have lower correlation
with TSX in high credit risk periods. China is the only index that exhibits a negative
correlation -0.06 with TSX. It is consistent with the observation of the binary
classification approach that China offers the best diversification to TSX during financial
crisis.
4.3 2007 Subprime
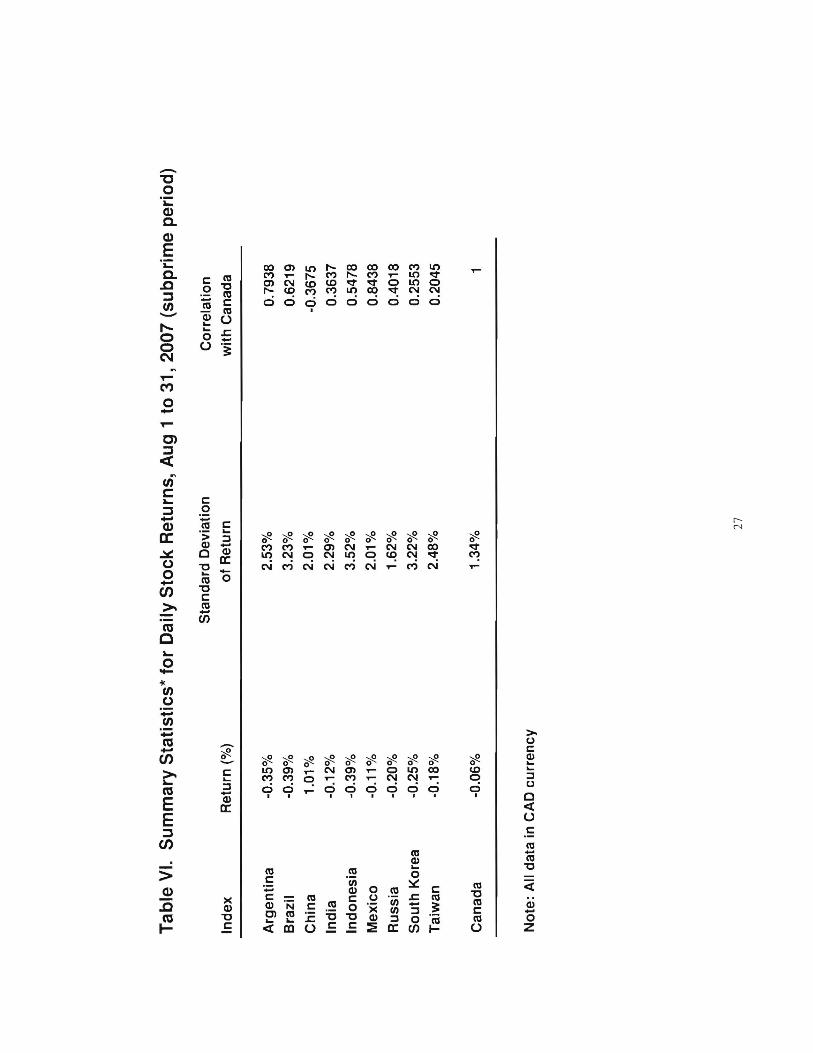
Table VI presents the statistical summary during the subprime crisis in August,
2007. All emerging stock markets were experiencing downward pressure and registered
negative returns lower than TSX, except for China, the only country that registered a
gain. Consistent with the observations in this paper's ten year sample period, China's
correlation with TSX is the lowest among all emerging markets and the weighted index.
In fact, the negative correlation suggests diversification benefits during the subprime
financial crisis in August.
4.4 Efficient Frontiers
This paper analyzes optimal investment mix for Canadian investors in a mean
variance framework and its efficiency in different credit risk periods. The benefits of
three portfolios were assessed. The I st portfolio comprises three developed market
indices S&P 500, TSX and MSCI EAFE representing US, Canada, and developed
markets in Europe, Australaisa and Far East. The 2nd portfolio is the same three
13
developed market indices plus the emerging markets weighted index. The 3rd portfolio
again consists of the three indices in the I st portfolio plus the China market index.
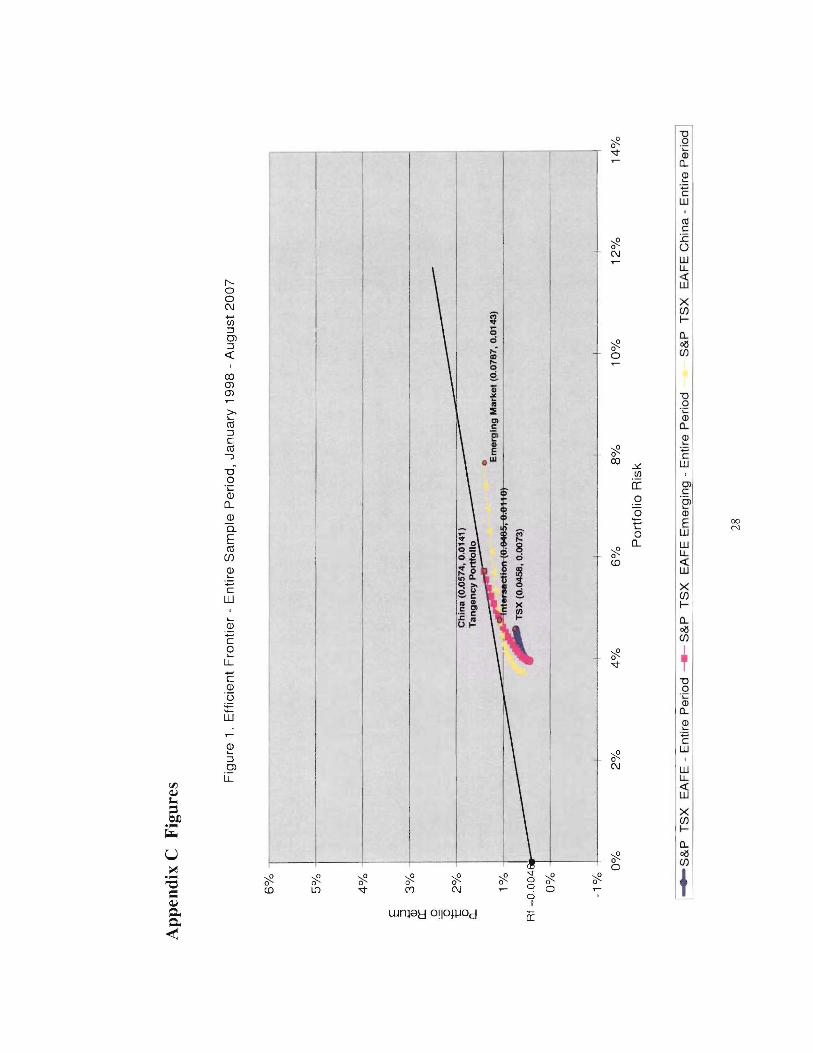
4.4.1 Entire Sample Period
Figure I examines the efficient frontiers during the entire sample period. Both
four asset frontiers on the left dominate the three asset portfolio. The portfolios shift
their weight from developed market indices to emerging economies as the frontiers
extend to the right. Portfolio 2 and 3 offer a more favourable return and risk at the
corresponding risk level or return of portfolio I. By adding emerging economies,
investors can expand the investment horizon to risk level or returns that the developed
market frontier does not offer. Portfolio 2 expands the investment horizon of the
developed market frontier from 4.58% to 5.74% risk level; and 0.73% to 1.14% returns
while portfolio 3 further expands the risk level to 7.87% and returns to 1.43% for
investors who are willing to take more risks. For risk adverse investors, portfolio 3
expands the risk level from 3.96% of the developed market portfolio to 3.74%, with
corresponding returns from 0.43% to 0.59%. Overall, the frontiers suggest investors can
gain significant diversification benefits by adding the EM or China index in their asset
mix.
Interesting to note, the frontier of portfolio 2 and 3 dominate at different risk
levels. They intersect at risk level 4.85% and monthly return 1.1 % where portfolio 2
holds 41.09% TSX, 27.26% EAFE and 31.65% of EM index without holding S&P. At
the same time portfolio 3 holds 47.14% of TSX and 52.86% of the China index, without
holding S&P and EAFE. The frontier consists of portfolio 2 dominating above the
intersection while portfolio 3 dominates below. The determining factor appears to be the
14
relative weight between the emerging markets index and the China index. The portfolio
that holds more weights of emerging economies dominates. By adding portfolio 2 to
their investment mix, investors whose risk level is above the intersection will be able to
obtain higher returns than portfolio 3 at the same level of risk. The tangency line
touches the frontier of portfolio 2 where investors can optimize investment returns at
1.41% when risk level is 5.74%. The optimal portfolio consists of 100% of emerging
markets index with no exposure to S&P, TSX and EAFE. The frontier of the four asset
portfolio including China dominates below the intersection when the weight of China
overtakes the emerging markets index. At the low risk level 3.96%, portfolio 3 holds
2.26%,57.24% 13.36% and 27.14% in S&P, TSX, EAFE and China respectively
comparing to portfolio 2 that holds 25.33%, 30.67%, 44% and 0% (no exposure to the
emerging markets index). At the same time portfolio 3 generates 0.85% return which is
significantly higher than the 0.43% of portfolio 2. When portfolio 3 continues to shift its
weight to hold larger amounts of the China index as its risk increases, the weight of the
developed market indices diminishes and so is the shift to increase the China index due to
the constraint of no short selling. Alternatively portfolio 2 starts with relatively lower
weight of EM, as risk increases its weight in emerging markets catches up, hits the
intersection and overtakes the weight of China, portfolio 2 starts to dominate. At any
level of risk, emerging countries playa critical role in an optimal portfolio.
4.4.2 High and Low Credit Risk
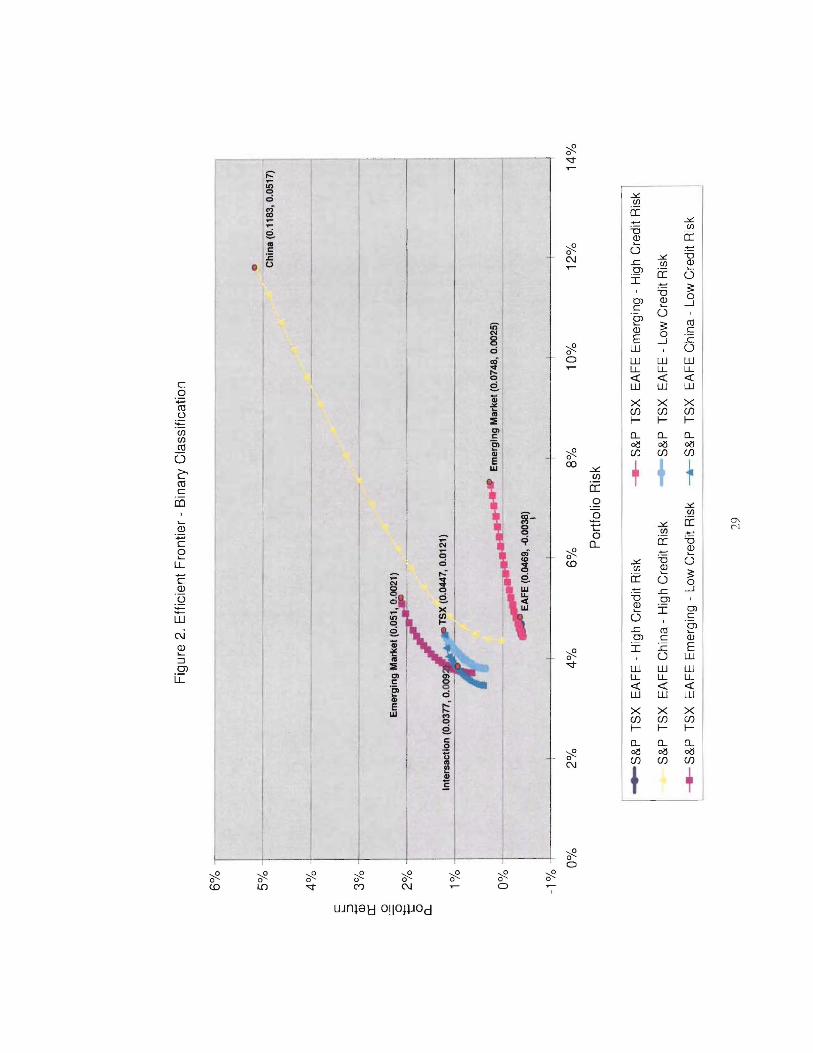
Figure 2 to 4 report subperiods based on using the binary classification.
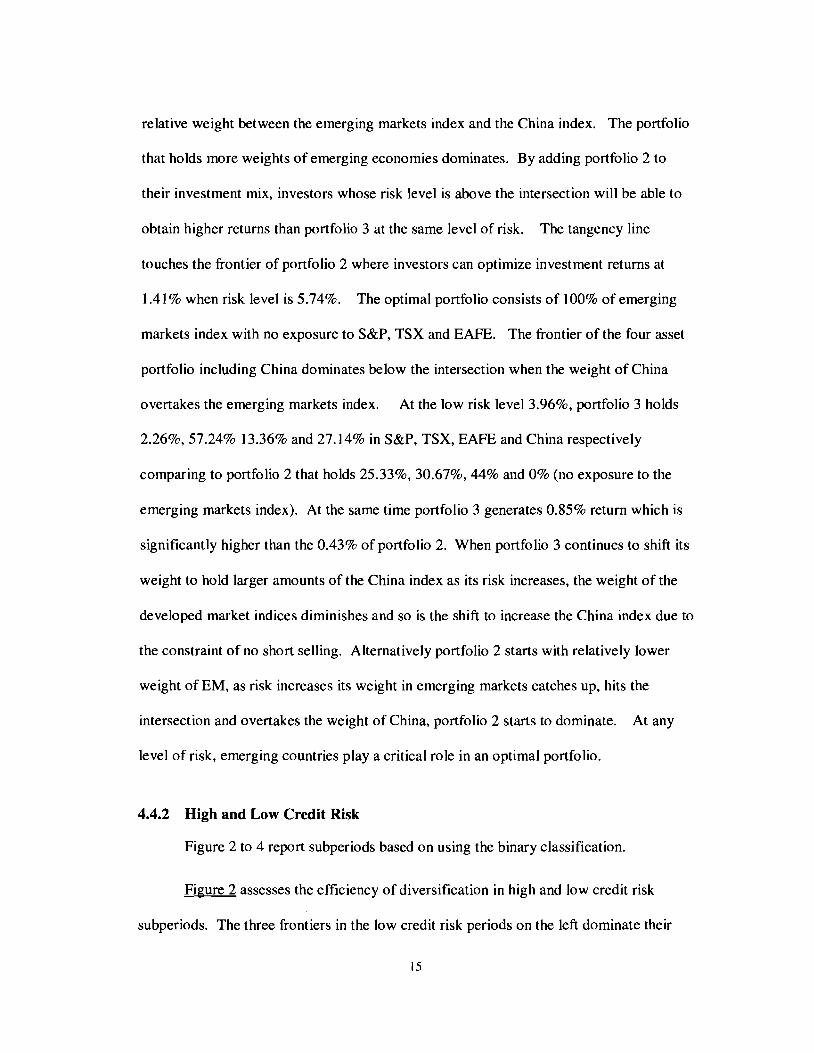
Figure 2 assesses the efficiency of diversification in high and low credit risk
subperiods. The three frontiers in the low credit risk periods on the left dominate their
15
high credit risk counter parts. This suggests investors can achieve higher returns at the
same level of standard deviation when credit risk is low. Alternatively, the frontiers in
high credit risk subperiods are inferior to their low credit risk counter parts. This appears
to be consistent with the general belief that financial turmoil and tight liquidity adversely
affects stock markets.
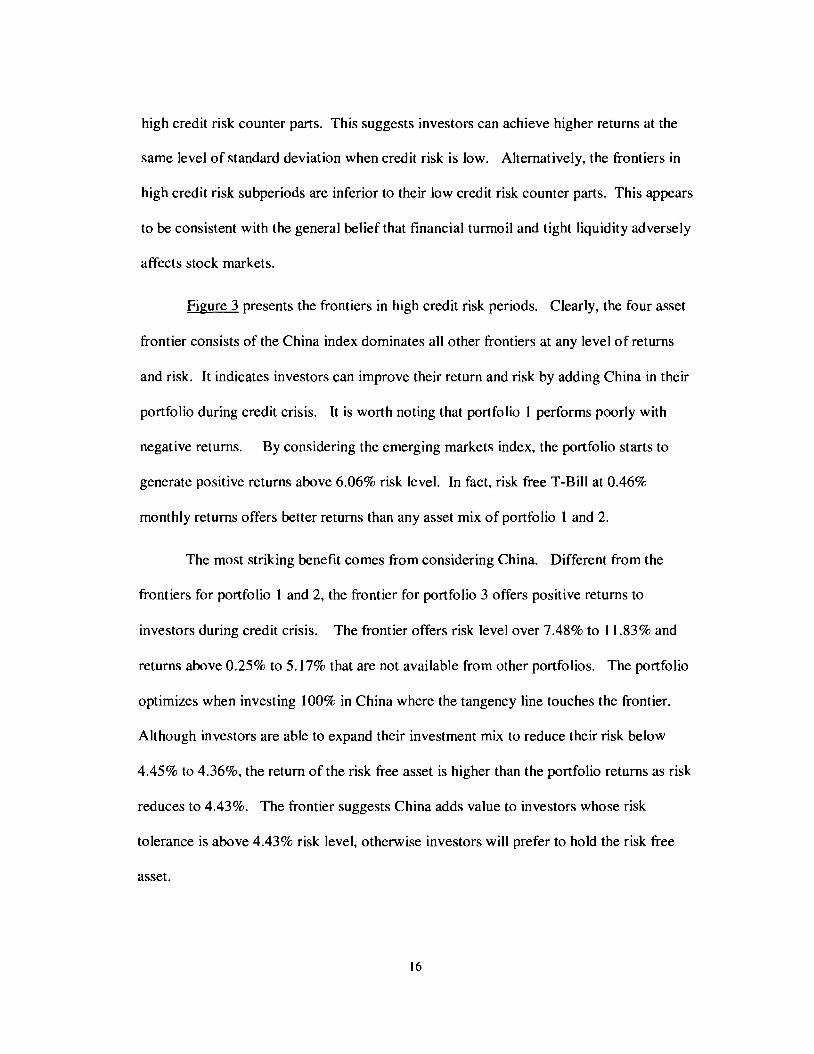
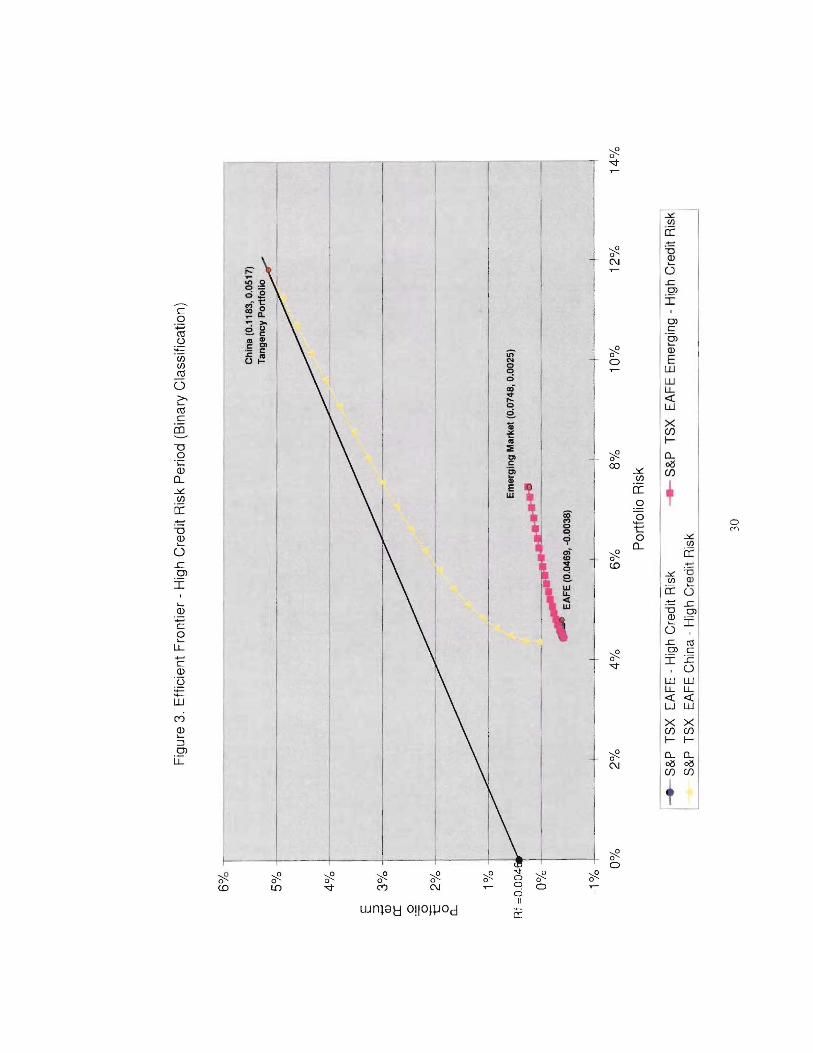
Figure 3 presents the frontiers in high credit risk periods. Clearly, the four asset
frontier consists of the China index dominates all other frontiers at any level of returns
and risk. It indicates investors can improve their return and risk by adding China in their
portfolio during credit crisis. It is worth noting that portfolio 1 performs poorly with
negative returns. By considering the emerging markets index, the portfolio starts to
generate positive returns above 6.06% risk level. In fact, risk free T-Bill at 0.46%
monthly returns offers better returns than any asset mix of portfolio 1 and 2.
The most striking benefit comes from considering China. Different from the
frontiers for portfolio 1 and 2, the frontier for portfolio 3 offers positive returns to
investors during credit crisis. The frontier offers risk level over 7.48% to 11.83% and
returns above 0.25% to 5.17% that are not available from other portfolios. The portfolio
optimizes when investing 100% in China where the tangency line touches the frontier.
Although investors are able to expand their investment mix to reduce their risk below
4.45% to 4.36%, the return of the risk free asset is higher than the portfolio returns as risk
reduces to 4.43%. The frontier suggests China adds value to investors whose risk
tolerance is above 4.43% risk level, otherwise investors will prefer to hold the risk free
asset.
16
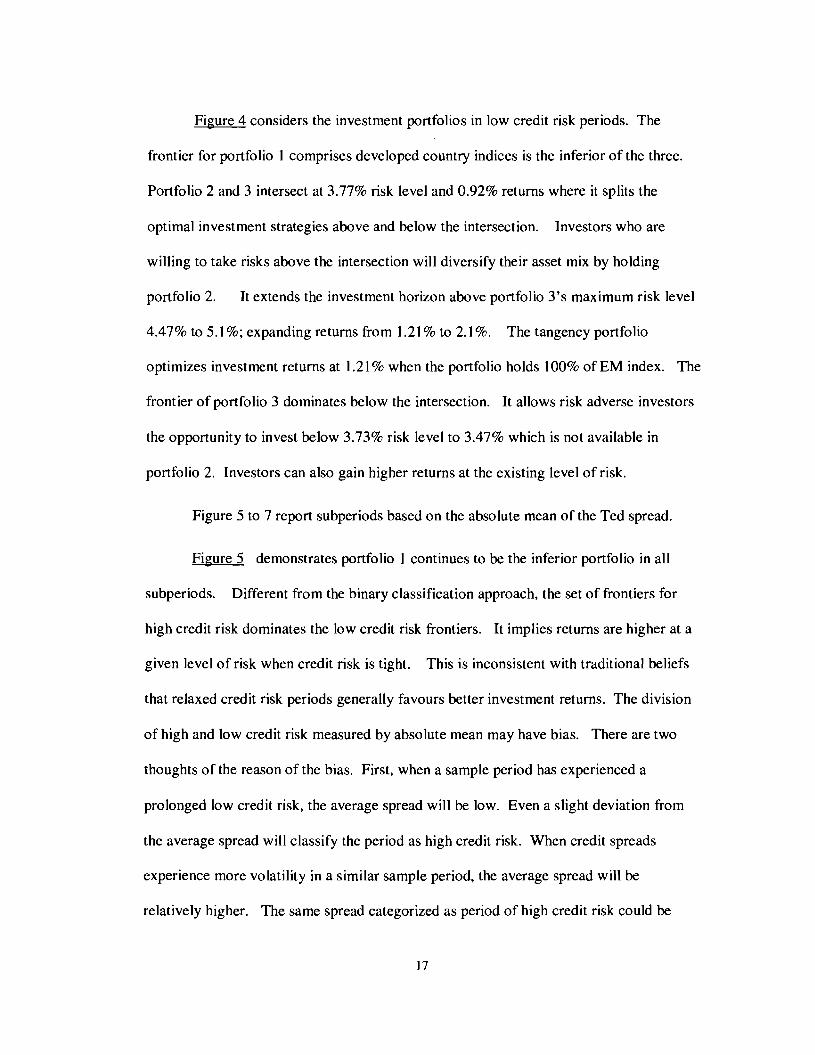
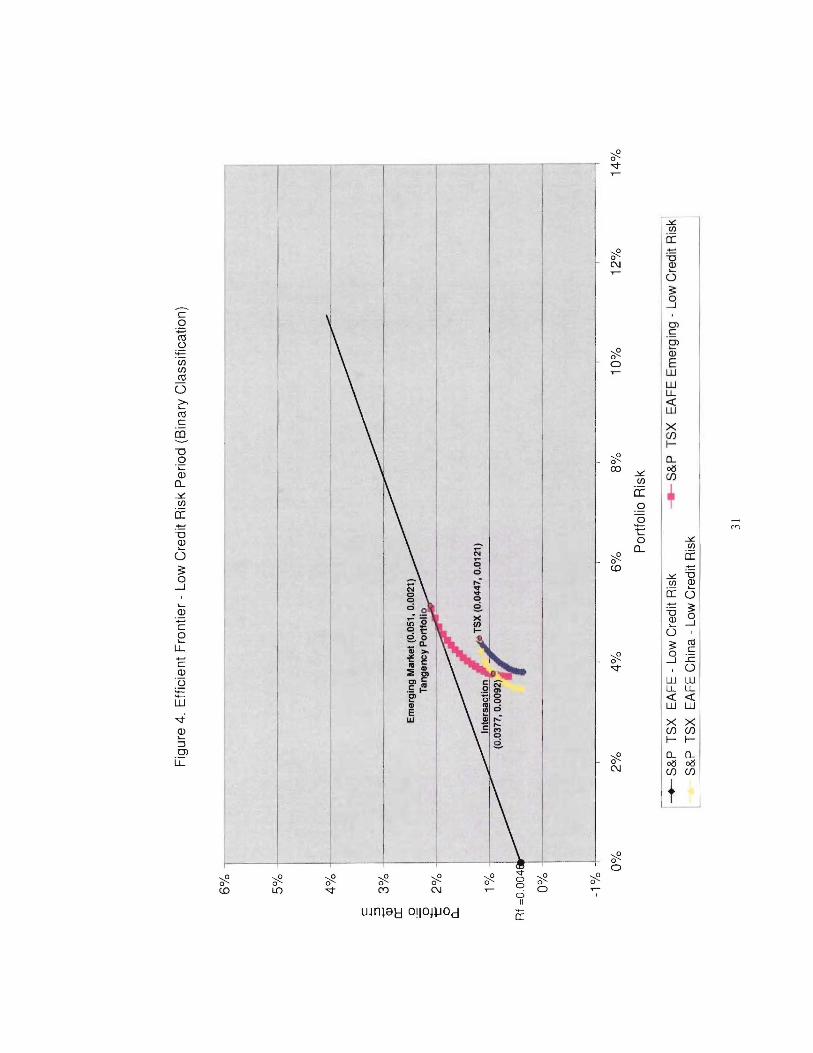
Figure 4 considers the investment portfolios in low credit risk periods. The
frontier for portfo lio 1 comprises developed country indices is the inferior of the three.
Portfolio 2 and 3 intersect at 3.77% risk level and 0.92% returns where it splits the
optimal investment strategies above and below the intersection. Investors who are
willing to take risks above the intersection will diversify their asset mix by holding
portfolio 2. It extends the investment horizon above portfolio 3's maximum risk level
4.47% to 5.1%; expanding returns from 1.21% to 2.1%. The tangency portfolio
optimizes investment returns at 1.21% when the portfolio holds 100% of EM index. The
frontier of portfolio 3 dominates below the intersection. It allows risk adverse investors
the opportunity to invest below 3.73% risk level to 3.47% which is not available in
portfolio 2. Investors can also gain higher returns at the existing level of risk.
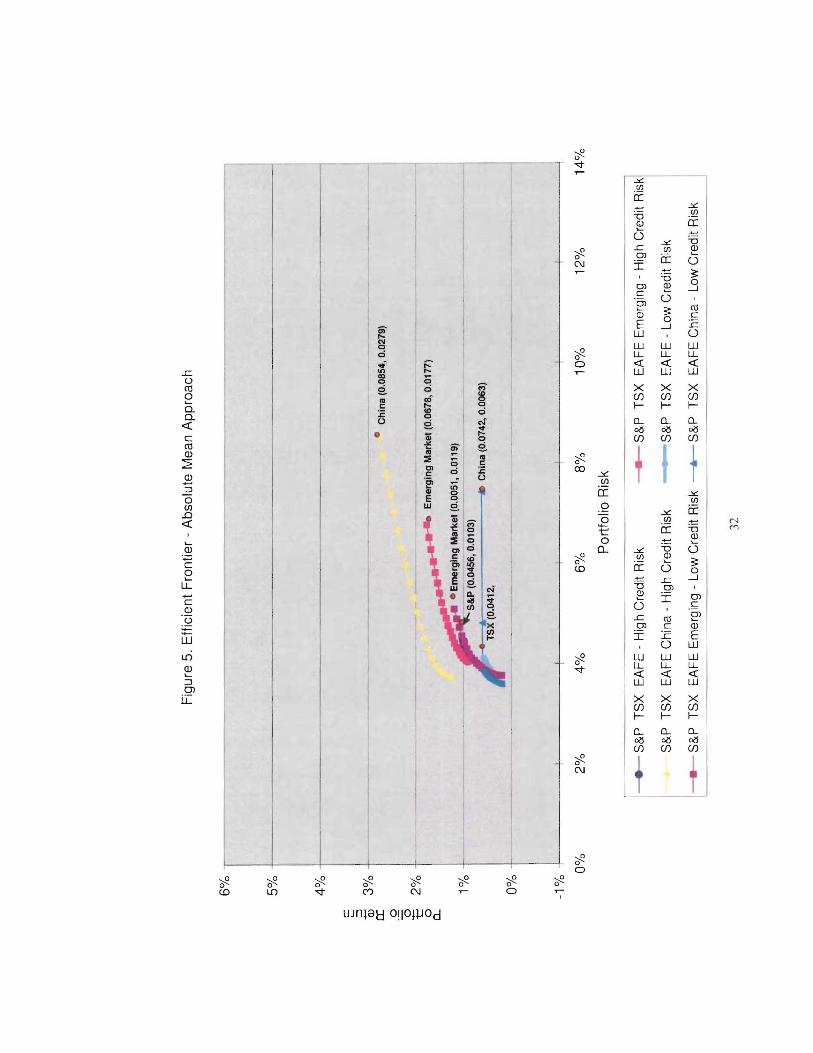
Figure 5 to 7 report subperiods based on the absolute mean of the Ted spread.
Figure 5 demonstrates portfolio 1 continues to be the inferior portfolio in all
subperiods. Different from the binary classification approach, the set of frontiers for
high credit risk dominates the low credit risk frontiers. It implies returns are higher at a
given level of risk when credit risk is tight. This is inconsistent with traditional beliefs
that relaxed credit risk periods generally favours better investment returns. The division
of high and low credit risk measured by absolute mean may have bias. There are two
thoughts of the reason of the bias. First, when a sample period has experienced a
prolonged low credit risk, the average spread will be low. Even a slight deviation from
the average spread will classify the period as high credit risk. When credit spreads
experience more volatility in a similar sample period, the average spread will be
relatively higher. The same spread categorized as period of high credit risk could be
17
defined as period of low credit risk. Please refer to appendix A for a numeric example.
Spread volatility can affect the division of the subperiods and the way to sort data
differently. Second, the confusion may be explained by spreads above the mean may not
represent credit risk is high. Credit risk could be relaxing after a tight cycle and slowly
reverting to the mean. Stock market performance would recover instead of worsen. In
this situation, the spread above average mean does not associate with stock market
downturn, rather recovery. The absolute mean approach may smooth out results of the
sample period with the possibility of producing confusing outcomes.
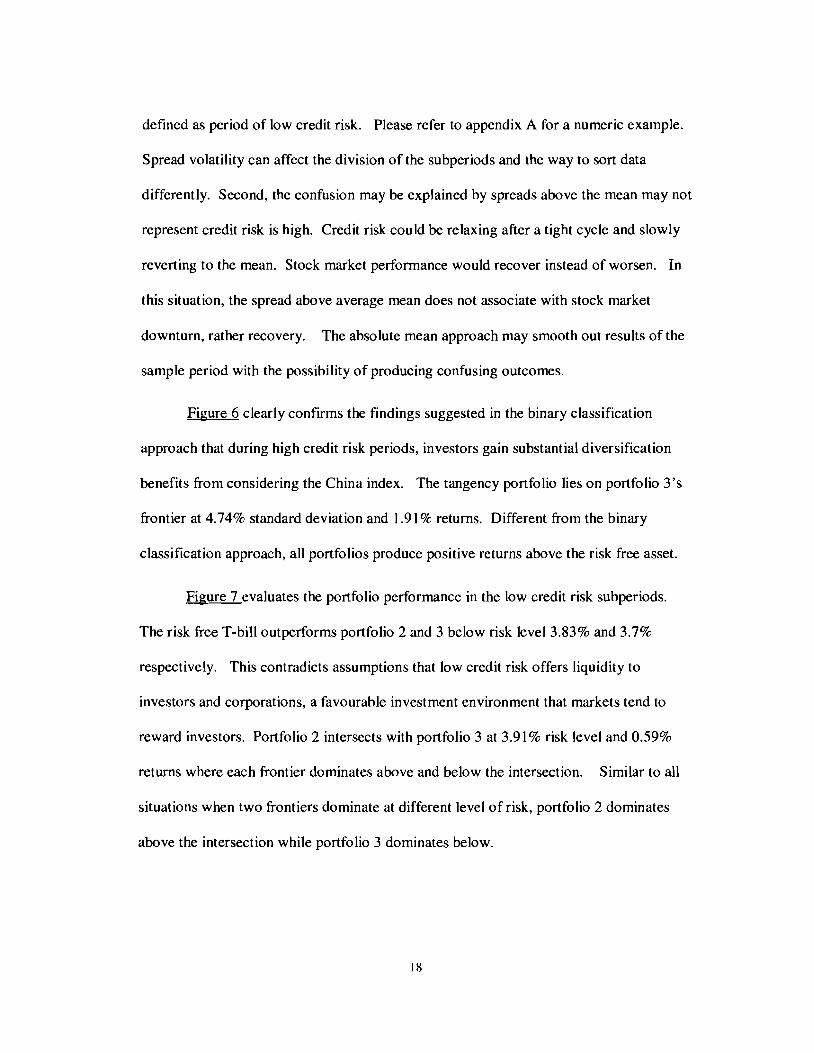
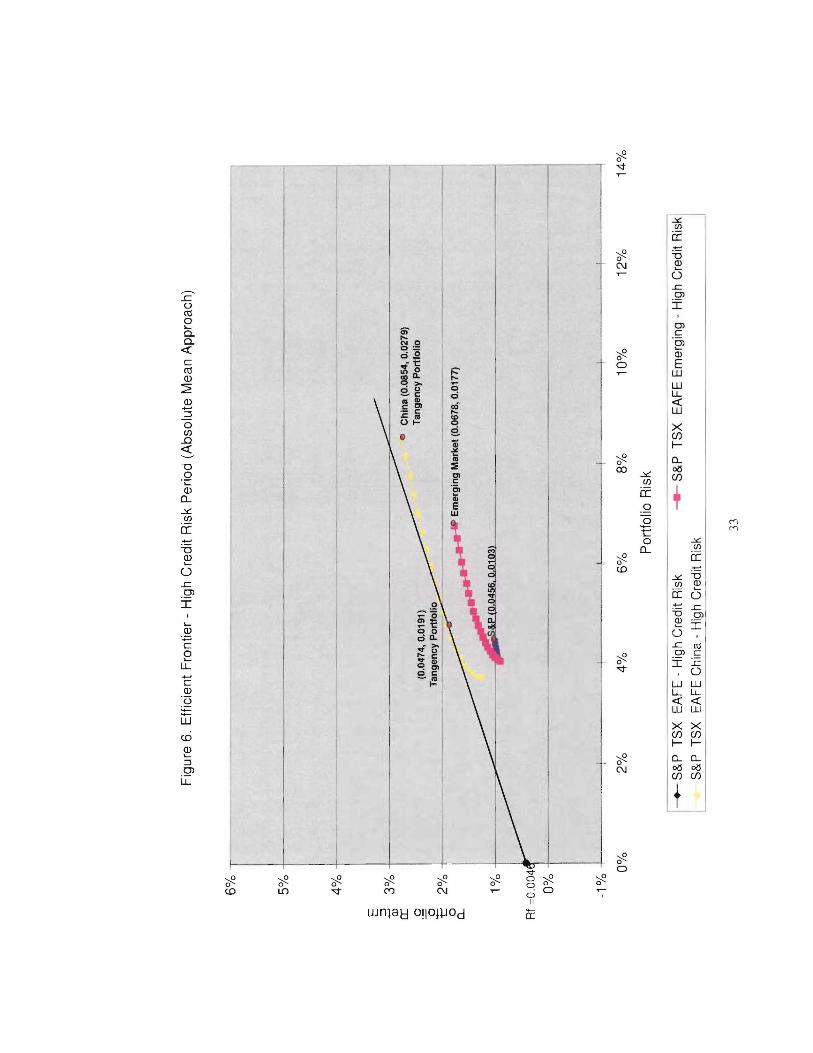
Figure 6 clearly confirms the findings suggested in the binary classification
approach that during high credit risk periods, investors gain substantial diversification
benefits from considering the China index. The tangency portfolio lies on portfolio 3's
frontier at 4.74% standard deviation and 1.91% returns. Different from the binary
classification approach, all portfolios produce positive returns above the risk free asset.
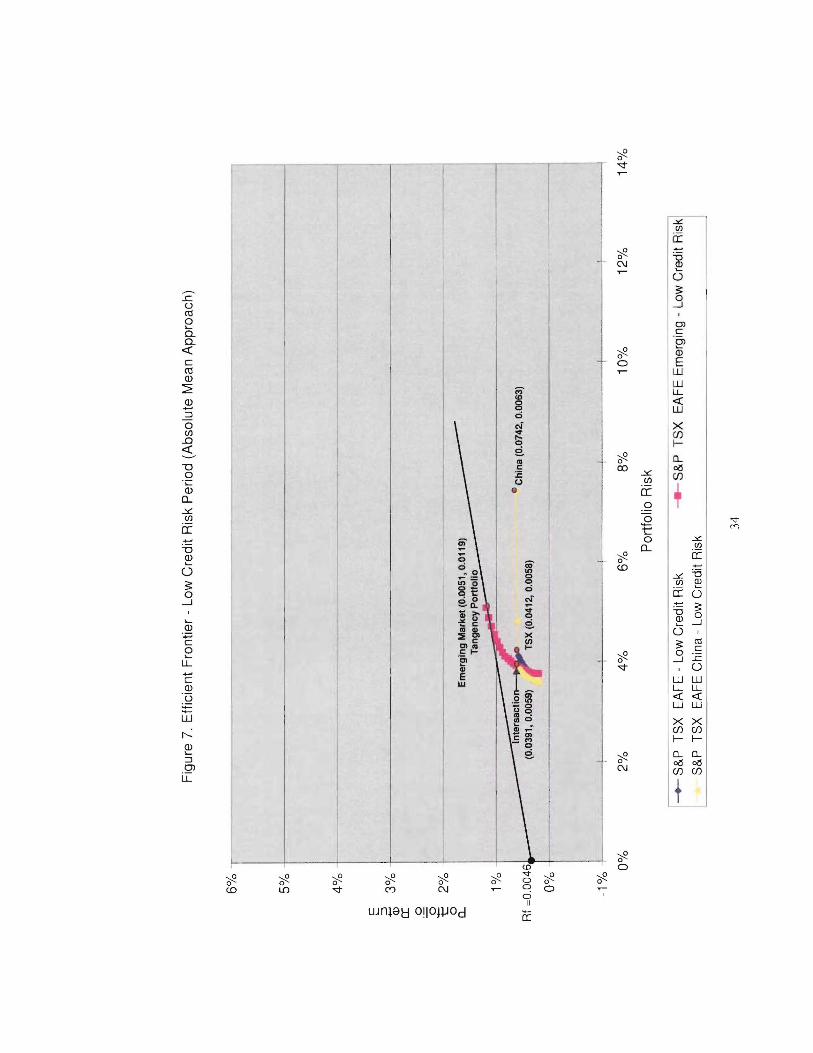
Figure 7 evaluates the portfolio performance in the low credit risk subperiods.
The risk free T-bill outperforms portfolio 2 and 3 below risk level 3.83% and 3.7%
respectively. This contradicts assumptions that low credit risk offers liquidity to
investors and corporations, a favourable investment environment that markets tend to
reward investors. Portfolio 2 intersects with portfolio 3 at 3.91% risk level and 0.59%
returns where each frontier dominates above and below the intersection. Similar to all
situations when two frontiers dominate at different level of risk, portfolio 2 dominates
above the intersection while portfolio 3 dominates below.
18
5: CONCLUSIONS
The data from the period between 1998 and 2007 supports the idea that Canadian
investors can benefit from diversifying in emerging markets. Investors can gain higher
returns at a given level of risk and also the opportunities to expand investment horizon at
risk levels that are not available from the developed market portfolio.
When we consider subperiods where credit risk is high, consistent with the
general assumption that market correlations are high, our results present reduced
diversification benefits from all emerging markets except China. Both the binary
classification and absolute mean approaches suggest China as the optimal diversification
asset. Investors who are willing to take higher risk can expand their investment horizon
significantly by 58.16% in risk level and 19.68% in returns by adding China in their asset
mix when credit risk is high. The findings are statistically significant.
In the subperiods when credit risk is low, the frontier of portfo lio 2 and 3 intersect
and each frontier dominates at a different level of risk. Both the binary classification and
absolute mean approaches report portfolio 2 dominates above the intersection while
portfolio 3 dominates below. It suggests risky investors to consider the emerging
markets index as they maximize their investment returns, and risk adverse investors add
China in their asset mix. The tangency portfolio lies on the frontier of portfolio 2 in both
approaches.
Using the absolute mean approach, frontiers of high credit risk periods prevail
rather than those in low credit risk periods. Risk free T-bill outperforms portfolio 2 and 3
19
below risk level 3.83% and 3.7% respectively. These results are not consistent with the
consensus that low credit risk generally favours stock markets for investors. It appears
the method may not always match credit spread above the mean with a financial crisis.
When the recent subprime credit crunch in this summer was examined, the results
are consistent with our findings in the ten year sample period. All indices dropped along
with TSX except China. China had a positive monthly return 1.1 % and a negative
correlation with TSX that could offer diversification benefits to a Canadian portfolio.
This paper is a preliminary study of the relationship between emerging markets
and TSX when credit risk is high and liquidity is withdrawn. It covers only ten years of
data, a relatively short period in traditional research. While it captures a more current
and relevant investment condition of the emerging markets as they liberalize, it may not
reflect a full economic cycle of the developed markets. As globalization speeds up, in
particular after China joined the World Trade Organization a few years ago, the pace of
emerging markets integrates with the world capital market will affect future
diversification benefits.
20

AP
PE
ND
ICE
S
App
endi
xA
Exa
mpl
e:so
rtin
gsu
bper
iods
base
don
the
abso
lute
mea
nap
proa
ch:
Scen
ario
I
Cre
dit
spre
ads
in10
subp
erio
ds:
0.6,
0.8,
0.9,
0.5,
0.5,
0.4,
0.6,
0.4,
0.4,
0.4;
abso
lute
mea
nis
0.55
.C
redi
tsp
read
s0.
6,0.
8,an
d0.
9in
dica
tecr
edit
risk
ishi
ghC
redi
tsp
read
s0.
5an
d0.
4in
dica
tecr
edit
risk
islo
w
Scen
ario
2
Cre
dit
spre
ads
in10
subp
erio
ds:
0.5,
0.6,
0.4,
0.4,
0.4,
0.4,
0.4,
0.4,
0.4,
0.6;
abso
lute
mea
nis
0.45
.C
redi
tsp
read
s0.
5an
d0.
6in
dica
tecr
edit
risk
ishi
ghC
redi
tsp
read
0.4
impl
ies
cred
itri
skis
low
Con
clus
ions
:W
hen
cred
itsp
read
equa
lsto
0.5,
the
peri
odco
uld
beso
rted
unde
rhi
ghor
low
cred
itri
skde
pend
ing
onth
evo
latil
ityo
f
the
spre
ad.
Subs
eque
ntly
,th
esu
bper
iod
and
itsco
rres
pond
ing
mar
ket
perf
orm
ance
may
bea
mis
mat
chan
dth
eda
tabe
com
es
irre
leva
nt.
21
App
endi
xB
Tab
les
Tab
leI
GO
P-W
eig
hte
dE
mer
gin
gIn
dex
1998
-200
7
Cou
ntry
Wei
ghte
dA
vera
geG
DP
Arg
entin
a4.
10%
Bra
zil
12.9
0%C
hina
28.9
0%In
dia
10.4
0%In
done
sia
3.80
%M
exic
o11
.40%
Rus
sia
8.10
%S
Kor
ea10
.50%
Tai
wan
5.80
%T
urke
y4.
40%
Tot
al10
0.00
%
Not
e:T
hese
we
igh
tsar
ea
vera
ge
sof
annu
alw
eigh
tsus
edin
the
10ye
ars
ofth
esa
mpl
e.S
ourc
e:In
tern
atio
nalM
onet
ary
Fou
ndat
ion
(IM
F)
22
Tab
leII
Sum
mar
yS
tatis
tics
for
Mon
thly
Sto
ckR
etur
nsJa
n19
98-
Aug
2007
Sta
ndar
dC
oeffi
cien
tof
Cor
rela
tion
with
Ret
urn
Var
ianc
eD
evia
tion
ofR
etu
rnV
ari
atio
nT
SX
Arg
en
tin
a0.
63%
1.78
%13
.35%
21.2
20.
40
Bra
zil
1.30
%1.
15%
10.7
4%8.
290.
71
Ch
ina
1.33
%0.
62%
7.88
%5.
930.
08
Ind
ia1.
21%
0.53
%7.
29%
6.04
0.39
Ind
on
esi
a1
.n%
1.23
%11
.09%
6.27
0.36
Me
xico
1.30
%0.
59%
7.68
%5.
910.
69
Ru
ssia
2.22
%2.
10%
14.5
0%6.
520.
52
5K
ore
a2.
01%
1.03
%10
.17%
5.07
0.45
Ta
iwa
n0.
12%
0.64
%8.
02%
68.4
90.
41
Tu
rke
y3.
20%
2.51
%15
.86%
4.96
0.40
S&
P0.
20%
0.19
%4.
33%
22.0
80.
69
TS
X0.
73%
0.21
%4.
62%
6.37
1.00
MS
CI
0.36
%0.
18%
4.19
%11
.75
0.70
We
igh
ted
Em
erg
ing
1.41
%0.
33%
5.n
%4.
100.
70
Not
e:R
etur
nsar
ear
ithm
etic
mea
nC
anad
ian
dolla
rre
turn
sfo
rth
ew
hole
sam
ple
perio
d.
23
Tab
leIII
Sta
tist
ical
Su
mm
ary
-B
inar
yC
lass
ific
atio
nA
pp
roac
hJa
n19
98-
Au
g20
07
Wh
ole
Per
iod
Lo
wC
red
itR
isk
Hig
hC
red
itR
isk
Dif
fere
nc
e(L
ow
T-T
es
tm
inu
sH
igh
Ris
k)
Sta
nd
ard
Sta
nd
ard
Sta
nd
ard
Sta
nd
ard
Ret
urn
Dev
iati
on
Ret
urn
Dev
iati
on
Ret
urn
Dev
iati
on
Ret
urn
Dev
iati
on
TS
tat
P0.
1P
0.05
P0.
01
Arg
en
tin
a0
.63
%13
.35
%1
.65
%13
.12
%-2
.99%
10.7
8%
4.6
4%2
.35
%1.
581
.325
1.7
252
.528
Bra
zil
1.30
%10
.74
%1.
90%
10.9
2%
-3.3
3%
13.4
1%
5.23
%-2
.49
%2.
141
.325
1.72
52
.528
Ch
ina
1.3
3%7
.88
%0.
73%
6.7
1%
5.1
7%
11
.84
%-4
.44
%-5
.13
%-2
.96
1.3
251.
725
2.5
28
Ind
ia1.
21%
7.2
9%
1.98
%7
.01%
0.5
5%6
.47
%1.
43%
0.5
4%0.
911
.325
1.7
25
2.5
28
Ind
on
es
ia1.
77%
11.0
9%
4.1
6%
11.1
6%-2
.36%
8.6
2%6
.52%
2.5
4%
2.61
1.32
51.
725
2.5
28
Me
xic
o1.
30%
7.6
8%
1.74
%7
.03%
-0.7
0%10
.30
%2.
45%
-3.2
6%1.
551
.325
1.72
52
.528
Ru
ss
ia2
.22%
14.5
0%
6.2
5%
14.7
8%-4
01%
16
.68
%1
0.2
6%
-1.9
0%3
.11
1.3
251.
725
2.5
28
SK
ore
a2
.01%
10.1
7%
3.3
9%
11.2
1%-0
.46%
7.42
%3
.85
%3
.79%
1.53
1.3
251.
725
2.5
28
Ta
iwa
n0
.12%
8.0
2%
1.38
%8
.41
%-3
.30%
6.07
%4.
68%
2.3
4%2.
491.
325
1.72
52
.528
Tu
rke
y3
.20
%1
5.8
6%
5.5
6%
18.3
1%1.
09%
14
.97
%4.
48%
3.3
4%1.
091.
325
1.72
52.
528
S&
P0
.20%
4.3
3%
0.0
1%
4.1
0%
-0.4
9%4.
86%
0.49
%-0
.76%
0.54
1.3
251.
725
2.52
8
TS
X0.
73%
4.6
2%
1.2
1%4
.50
%-0
.39%
5.55
%1.
60%
-1.0
5%
1.59
1.3
251.
725
2.52
8
MS
CI
0.3
6%4
.19%
-0.1
0%
4.3
0%-0
.38%
4.68
%0
.28
%-0
.39%
0.2
91.
325
1.72
52.
528
We
igh
ted
Em
erg
ing
1.41
%5
.77
%2
.10%
5.0
8%
0.25
%7.
46%
1.85
%-2
.37
%1.
631.
325
1.72
52.
528
IID
iffer
ence
inm
ean
retu
rns
sign
ifica
ntin
aon
e-t
aile
dt-
test
atth
e10
perc
ent
leve
l.
IID
iffer
ence
inm
ean
retu
rns
sign
ifica
ntin
aon
e-ta
iled
t-te
stat
the
5p
erc
en
tle
vel.
IID
iffer
ence
inm
ean
retu
rns
sig
nifi
can
tin
aon
e-t
aile
dt-
test
atth
e1
pe
rce
nt
leve
l.
24
Tab
leIV
Co
rrel
atio
ns
wit
hT
SX
Wei
ghte
d
Co
rre
latio
nw
ith
TS
XA
rge
ntin
aB
razi
lC
hina
Indi
aIn
do
ne
sia
Me
xico
Rus
sia
SK
orea
Tai
wan
Tu
rke
yS
&P
TS
XM
SC
IE
me
rgin
g
Wh
ole
Pe
rio
d0.
400.
710.
080.
390.
360.
690.
520.
450.
410.
400.
691.
000.
700.
70
Bin
ary
Ap
pro
ach
·H
igh
Cre
dit
Ris
k0.
610.
820.
040
.31
0.48
0.85
0.65
0.5
30.
540.
640
.76
1.00
0.69
0.73
Bin
ary
Ap
pro
ach
·L
ow
Cre
dit
Ris
k0.
310.
620.
160.
410.
080.
470.
380
.26
0.24
0.28
0.6
51.
000
.62
0.62
Ave
rag
eM
ea
n·
Hig
hC
red
itR
isk
0.5
40.
69-0
.06
0.21
0.43
0.78
0.63
0.40
0.35
0.54
0.6
81.
000.
670.
71
Ave
rag
eM
ea
n·
Lo
wC
red
itR
isk
0.3
40.
710.
190.
560.
250.
580
.39
0.53
0.46
0.22
0.7
01.
000.
720.
67
25
Tab
leV
Sta
tist
ical
Su
mm
ary
-T
edS
pre
adM
ean
Ret
urn
Ben
chm
ark
Jan
1998
-A
ug
2007
Wh
ole
Per
iod
Lo
wC
red
itR
isk
Hig
hC
red
itR
isk
Di!feren~e
(Lo
.wT
-Te
st
min
us
Hig
hR
isk)
Sta
nd
ard
Sta
nd
ard
Sta
nd
ard
Sta
nd
ard
Ret
urn
Dev
iatio
nR
etu
rnD
evia
tio
nR
etur
nD
evia
tio
nR
etu
rnD
evia
tio
nT
Sta
tP
0.1
P0.
05P
0.01
Arg
en
tin
a0
.63
%13
.35%
1.3
1%14
.53
%-0
.52%
11.1
3%
1.8
3%3
.40
%1.
071.
29
41.
667
1.9
94B
razi
l1.
30%
10.7
4%
1.1
6%9
.66%
1.52
%12
.47%
-0.3
6%-2
.80
%-0
.31
1.2
94
1.66
71.
994
Ch
ina
1.3
3%7.
88
%0
.63
%7
.41%
2.7
9%8
.53%
-2.1
6%-1
.12
%-2
.50
1.2
941
.667
1.99
4In
dia
1.21
%7
.29%
1.4
3%
6.8
0%
0.8
2%
8.1
1%0
.62
%-1
.32%
0.7
81.
294
1.66
71.
994
Ind
on
es
ia1.
77%
11.0
9%1.
82%
7.6
6%
1.6
8%15
.37
%0.
15%
-7.7
1%
0.1
61.
294
1.6
671.
994
Me
xic
o1.
30%
7.6
8%
1.5
1%6.
45%
0.9
4%9.
47%
0.5
8%-3
.02
%0.
76
1.29
41
.667
1.99
4
Ru
ss
ia2
.22
%14
.50
%3
.50
%9
.02
%0
.06%
20.7
0%3.
43%
-11.
68%
3.2
51.
294
1.66
71.
994
SK
ore
a2
.01%
10,1
7%
0.4
9%7
.54%
4.5
7%13
,23%
-4.0
8%-5
.70
%-4
.62
1.29
41.
667
1.99
4T
aiw
an
0.1
2%8
,02
%0
.42
%7
.81%
-0.3
9%8
.44%
0.8
1%-0
.64%
0.8
91.
294
1.66
71.
994
Tu
rke
y3
.20
%15
.86%
2.2
9%12
.84
%4.
74%
20.0
5%-2
.45%
-7.2
1%-1
.63
1.29
41.
667
1.9
94S
&P
0.2
0%
4.3
3%
-0.2
8%4
.17
%1.
01%
4.5
2%-1
.30%
-0.3
5%
-2.6
61.
294
1.6
671.
994
TS
X0
.73
%4
.62
%0
.58
%4
.08
%0.
97%
5.4
7%
-0.3
8%
-1.4
0%-0
.80
1.2
94
1-66
71.
994
MS
CI
0.3
6%4
.19
%0.
07%
4.1
7%0
.84%
4.2
1%-0
.78
%-0
.04%
-1.5
91.
294
1.66
71.
994
We
igh
ted
Em
erg
ing
1.41
%5.
77
%1,
19%
5.10
%1
.77
%6
.81%
-0.5
7%
-1.7
1%-0
.96
1.2
941.
667
1.99
4
II D
iffe
ren
cein
mea
nre
turn
ssi
gn
ifica
nt
ina
one-
taile
dt-
test
atth
e10
perc
ent
leve
l.
IID
iffe
renc
ein
me
an
retu
rns
sig
nifi
cant
ina
on
e-ta
iled
t-te
stat
the
5pe
rcen
tle
vel.
IID
iffer
ence
inm
ean
retu
rns
sign
ific
ant
ina
one
-ta
iled
t-te
stat
the
1p
erc
en
tle
vel.
26
Ta
ble
VI.
Su
mm
ary
Sta
tist
ics*
for
Da
ilyS
tock
Ret
urns
,A
ug1
to31
,20
07(s
ub
pri
me
pe
rio
d)
Sta
nd
ard
De
via
tion
Co
rre
latio
n
Ind
ex
Ret
urn
(%)
ofR
etur
nw
ith
Can
ada
Arg
en
tin
a-0
.35%
2.53
%0.
7938
Bra
zil
-0.3
9%3.
23%
0.62
19
Ch
ina
1.01
%2.
01%
-0.3
675
Ind
ia-0
.12%
2.29
%0.
3637
Ind
on
esi
a-0
.39%
3.52
%0.
5478
Me
xico
-0.1
1%2.
01%
0.84
38
Ru
ssia
-0.2
0%1.
62%
0.40
18
So
uth
Kor
ea-0
.25%
3.22
%0.
2553
Ta
iwa
n-0
.18%
2.48
%0.
2045
Can
ada
-0.0
6%1.
34%
1
No
te:
All
data
inC
AD
curr
en
cy
27
App
endi
xC
Fig
ures
Fig
ure
1.E
ffic
ien
tF
ron
tie
r-
En
tire
Sa
mp
leP
eri
od
,Ja
nu
ary
19
98
-A
ug
ust
20
07
14%
12
%10
%8
%• Em
erg
ing
Ma
rke
l(0
.07
87
,0
.01
43
)
6%
6%
5% 4%
C "- ::::l
3%
-Q
)0:
:.Q (5 t
2%
-0 0-
1%
Rf
=0
.00
4
0%
-
-1%
., 0%
2%4
%
Po
rtfo
lioR
isk
I~S&P
TS
XE
AF
E-
Ent
ireP
eri
od
-S
&P
TS
XE
AF
EE
me
rgin
g-
En
tire
Pe
riod
S&
PT
SX
EA
FE
Ch
ina
-E
ntire
Pe
rio
dI
28
Fig
ure
2.E
ffic
ient
Fro
ntie
r-
Bin
ary
Cla
ssifi
catio
n
6%,-
5%
-~1----
-
4%
• Ch
ina
(0.1
183,
0.05
17)
Em
erg
ing
Ma
rke
t(0
.074
8,0.
0025
)
c .... :J Q)
3%~
------
--cr: o '0
IE
me
rgin
gM
ark
et
(0.0
51,
0.00
21)
t2%
-~
o D....
1%-1
~
0%
---
-----
------
1EA
FE(0
.046
9,-0
.003
8) \
-1%
I!
I!!
I
0%2%
4%6
%8%
10%
12%
14%
Por
tfolio
Ris
k
~S&P
TS
XE
AF
E-
Hig
hC
red
itR
isk
-.-
S&
PT
SX
EA
FE
Em
ergi
ng-
Hig
hC
redi
tR
isk
S&
PT
SX
EA
FE
Chi
na-
Hig
hC
red
itR
isk
-=
-S
&P
TS
XE
AF
E-
Low
Cre
dit
Ris
k
-.-
S&
PT
SX
EA
FE
Em
ergi
ng-
Low
Cre
dit
Ris
k-.-
S&
PT
SX
EA
FE
Chi
na-
Low
Cre
dit
Ris
k
29
Fig
ure
3.E
ffic
ien
tF
ron
tier
-H
igh
Cre
dit
Ris
kP
erio
d(B
inar
yC
lass
ifica
tion
)
6% 5%
-j--
--
--
--
--
--
--
4%
c .... ::l
Q)3%
-I-
~!
a: .9 o t2%
o D...
1%I
~I
Em
erg
ing
Mar
ket
(0.0
748,
0.0
025)
I0
%2%
4%6%
8%10
%12
%14
%
Por
tfol
ioR
isk
~S
&P
TS
XE
AF
E-
Hig
hC
redi
tR
isk
S&
PT
SX
EA
FE
Chi
na-
Hig
hC
redi
tR
isk
30
-S
&P
TS
XE
AF
EE
me
rgin
g-
Hig
hC
redi
tR
isk
Fig
ure
4.E
ffic
ient
Fro
ntie
r-
Low
Cre
dit
Ris
kP
erio
d(B
inar
yC
lass
ifica
tion)
6% 5%+
1-----
----
--
----
----
-----
----
------
-----
---
----
-i
c ..... :J Q) a: .Q o t
2%o 0...
0%·1
1
-1%
Ji
0%2%
4%6%
8%1
0%
12%
14%
Por
tfolio
Ris
k
I-+
-S
&P
TS
XE
AF
E-
Low
Cre
dit
Ris
k.
S&
PT
SX
EA
FE
Chi
na-
Low
Cre
dit
Ris
k
31
--
S&
PT
SX
EA
FE
Em
ergi
ng-
Low
Cre
dit
Ris
k
Fig
ure
5.E
ffic
ient
Fro
ntie
r-
Abs
olut
eM
ean
App
roac
h
•C
hin
a(0
.085
4,0.
0279
)
Em
erg
ing
Ma
rke
l(0
.067
8,0
.017
7)
6% 5%-
4%-
c '- ::::l
Q)
3%a: 0 0
2%-.-
t 0 0...
1% 0%-
-1%
-, 0%2%
4%6%
8%10
%12
%14
%
Por
tfolio
Ris
k
~S
&P
TS
XE
AF
E-
Hig
hC
redi
tR
isk
S&
PT
SX
EA
FE
Chi
na-
Hig
hC
redi
tR
isk
----
S&
PT
SX
EA
FE
Em
erg
ing
-H
igh
Cre
dit
Ris
k
~S&P
TS
XE
AF
E-
Low
Cre
dit
Ris
k
S&
PT
SX
EA
FE
Em
ergi
ng-
Low
Cre
dit
Ris
k---.-
S&
PT
SX
EA
FE
Chi
na-
Low
Cre
dit
Ris
k
32
Fig
ure
6.E
ffic
ient
Fro
ntie
r-
Hig
hC
redi
tR
isk
Per
iod
(Abs
olut
eM
ean
App
roac
h)
6%T-~---
5%
T,----
-----
----
--
--
------
-----
--
-Ji
4%
•C
hina
(0.0
854,
0.02
79)
Ta
ng
en
cyP
ort
folio
Em
erg
ing
Ma
rke
l(0.
0678
,0.0
177)
1%I
~•
c > :::J ~
3%
rl-
--
--
--
--
--
---
-o
--
--
-
~2%
~0..
..
.
Rf
=0
.004
0%-I
I
14%
12%
10%
8%6%
4%2%
-1%
+--
-!
!
0%
Por
tfolio
Ris
k
-S
&P
TS
XE
AF
EE
mer
ging
-H
igh
Cre
dit
Ris
k-+
-S
&P
TS
XE
AF
E-
Hig
hC
red
itR
isk
S&
PT
SX
EA
FE
Chi
na-
Hig
hC
red
itR
isk
--
--
----
--
-----
--
-----'
33
Fig
ure
7.E
ffic
ient
Fro
ntie
r-
Low
Cre
dit
Ris
kP
erio
d(A
bso
lute
Mea
nA
ppro
ach
)
6%,-
-
5%
I,
•C
hin
a(0
.074
2,0.
0063
)
------
-
4%-
0%-I
-I-
-.
1%-I
==
--:I
iJiP
'-i
c ..... ::l a:;
3%-l~-
----~-
------
------
------
------
------
---0
:.Q o '§
2%_,
I
0...
14%
12%
10%
8%6%
4%2%
-1%
-!!
!I
0%
Por
tfolio
Ris
k
-+-
S&
PT
SX
EA
FE
-Lo
wC
red
itR
isk
S&
PT
SX
EA
FE
Chi
na-
Low
Cre
dit
Ris
k
-S
&P
TS
XE
AF
EE
me
rgin
g-
Low
Cre
dit
Ris
k
34
Reference List
Ahmed, Parvez, Gangopadhyay, Partha NMII and Nanda, Sudhir, (November 2001)"Performance of Emerging Market Mutual Funds and U.S. Monetary Policy".Available at SSRN: http://ssrn.com/abstract=289278
Antoniou, A, Olusi, 0., and Paudyal, Krishna N. (2006), "Why Diversify InternationallyWhen Domestic Diversification Provides Similar Benefits?" (September 2006).Available at SSRN: http://ssrn.com/abstract=936637
Bank of Canada, Rates and Statistics, Exchange Rates, Currency converter: 10-yearlookup Convert to and from Canadian dollars using rates from 1997 to thepresent.
Bailey, W, Stutz, R.M. (1990) "Benefits of International Diversification: The Case ofPacific Basin Stock Markets" Journal of Portfolio Management, 1990
Bailey, W. & Lim, 1. (1992). Evaluating the diversification benefits of the new countryfunds. Journal of Portfolio Management, 18(3), 75-80
Bengt Holmstrom, Jean Tirole (2000) "A liquidity-based Asset Pricing Model" MITDept. of Economics Working Paper No. 98-08. Available at SSRN:http://ssrn.com/abstract=237497 Revised September 2000
Butler, Kirt e. and Joaquin, Domingo e. (2001), "Are the Gains from InternationalPortfolio Diversification Exaggerated? The Influence of Downside Risk in BearMarkets" (July 9,2001). EFMA 2002 London Meetings. Available at SSRN:http://ssrn.com/abstract=221 992
Bloomberg, Argentina MERVAL Buenos Aires (MERVAL Index), Brazil IBOVESPASao Paulo ( IBOV Index), Canada S&P TSX Composite, China SSE CompositeIndex (SHCOMP Index), India BSE SENSEX (SENSEX Index), IndonesiaComposite Index (JCI Index), Mexico IPC (MEXBOL Index), Russia TradingSystem Stock Exchange (RTSI$ Equity), South Korea KOSPI Composite Index(KOSPI Index), Taiwan TSEC weighted index (TWSE Index), Turkey XU 100Equity Index (XU I00 Index), US S&P500 Index, MSCI EAFE Index Price(MXEA), monthly price (PX_LAST), Dec 1997 to Aug2007
Campa, J. Manuel and Fernandes, Nuno G. (2005), "Sources of Gains from InternationalPortfolio Diversification" (May 2004 Revised March 2005). CEPR DiscussionPaper No. 4390. Available at SSRN: http://ssrn.com/abstract=556742
Campbell, Rachel A.J., Forbes, Catherine S., Koedijk, Kees c.o. and Kofman, Paul,(2006) "Diversification Meltdown or Just Fat Tails?" (June 2006). EFA 2006Zurich Meetings Available at SSRN: http://ssrn.com/abstract=908881
35
CANSIM (Canadian Socio-Economic Information Management System) v l 22484Canada; Treasury bill auction - average yields: 3 month, average at values(Percent) from Jan I, 1998 to Aug I, 2007
Conover, C. M., Jensen, Gerald R, Johnson, Robert (2002) "Emerging Mrakets: WhenAre They Worth It?" Financial Analysts Journal, Vol. 58, No.2, March/April,2002
Demchuk, Andriy and Gibson, Rajna (2004), "Stock Market Performance and the TermStructure of Credit Spreads" (March 2004). EFA 2004 Maastricht Meetings PaperNo. 1638. Available at SSRN: http://ssrn.comlabstract=576901
DeSantis, G., Gerard, B., (1997) "International Asset Pricing and PortfolioDiversification with Time-Varying Risk" Journal of Finance, Vol.52, No.4,December 1997
Errunza, VR (1983), "Emerging Markets: A New Opportunity for Improving GlobalPortfolio Performance" Financial Analysts Journal, 1983 Vol. 39 No.5 pp. 51 58
Errunza, Vihang R, (1999) "Foreign Portfolio Equity Investments in EconomicDevelopment" (July 1999). Available at SSRN: http://ssrn.comlabstract=176939
Fernandes, Nuno G., (2003) "Market Integration and International Asset Allocation"(April 2003). Available at SSRN: http://ssrn.comlabstract=384403
Fernandes, Nuno G. (2003), "What Level of Portfolio Disaggregation in EmergingMarket Investments?" . Journal of Portfolio Management, Forthcoming Availableat SSRN: http://ssrn.comlabstract=534663
Forte, Santiago and Pena, 1. Ignacio (2007), "Credit Spreads: Theory and Evidence on theInformational Content of Stocks, Bonds, and Cds" (November 2007). Available atSSRN: http://ssrn.comlabstract=722981
Grubel, Herbert G. (1968), "Internationally Diversified Portfolios: Welfare Gains andCapital Flows" The American Economic Review, vol. 58, No.5 (December1968), pp. 1299-1314
Holmstrom, Bengt Rand Tirole, Jean (2000), "LAPM: A Liquidity-based Asset PricingModel" (September 2000). MIT Dept. of Economics Working Paper No. 98-08.Available at SSRN: http://ssrn.comlabstract=237497
International Monetary Fund, World Economic Outlook Database, world annual GDP inUS Dollar Units, GDP October 2007
Jensen, G., Johnson, RR (1995), "Discount rate changes and security returns in the U.S.,1962-1991" Journal of Banking and Finance, Volume 19, Number 1, April, 1995pp. 79-95 91)
Johnson, R R, Buetow, G. W. Jensen, G. R (1999) "International Mutual Fund Returnsand Federal Reserve Policy." Financial Services Review 8 (1999) 199-210
36
Jos 'e Manuel Campa, Nuno Fernandes (2005) " Sources of Gains from InternationalPortfolio Diversification" Date of Current Version: December 2005 CEPRDiscussion Paper No. 4390. Available at SSRN: http://ssrn.com/abstract=556742
Levy, H., Sarnat, M., (1970), "International Diversification ofInvestment Portfolios".The American Economic Review, Vol. 60, No.4, September 1970, pp.668-675
Lessard, Donald R, (1973), "International Portfolio Diversification: A MultivariateAnalysis for a Group of Latin American Countries." The Journal of Finance,Vo1.28, No.3, June 1973, pp.619-633
Li, Lingfeng (2003) "An Economic Measure of Diversification Benefits" March, 2003Yale ICF Working Paper No. 03-11. Available at SSRN:http://ssrn.com/abstract=41 0140
Markowitz, H.( 1952) "Portfolio Selection" The Journal of Finance, Vol. 7, No. I (March1952), pp.77-91
Patev, Plamen Georgiev and Kanaryan, Nigokhos Krikorov (2003), "Stock Market Crisesand Portfolio Diversification in Central and Eastern Europe" (January 2003).Tsenov Academy of Economics Department of Finance and Credit WorkingPaper No. 03-02. Available at SSRN: http://ssrn.com/abstract=367882
Rodriguez, L. Jacobo (2007) "Where are the Gains from International Diverisfications?Any Update" Dimensional Fund Advisor January 2007
Sarkar, Asani and Patel, Sandeep A. (1998), "Stock Market Crises in Developed andEmerging Markets" (April 1998). Available at SSRN:http://ssrn.com/abstract=76168
Sinquefield, R, (1996) Where are the gains from international diversification? FinancialAnalysts Journal, 52(1), 8-14
Starman, Meir and Scheid, Jonathan, (2004) "Global Diversification" (October 2004).Available at SSRN: http://ssrn.com/abstract=603681
Solnik, Bruno H., (1977), ''Why not diversify internationally rather than domesticaIly?"Financialy Analysts Journal, January - February 1995, pp.89 -94
Stulz, R M. (1999), "Globalization of Equity Markets and the Cost of Capital" (February1999). Dice Center Working Paper no. 99-1. Available at SSRN:http://ssrn.com/abstract=153669
Yao, Yao (2002), "Perspective of China Stock Market Under Global FinancialUncertainty" (November 24,2002). Available at SSRN:http://ssrn.com/abstract=354540
37