Embed Size (px)
Citation preview

1
Similarity, typicality, and category-level matching of
morphed outlines of everyday objects
Sven Panis
Joris Vangeneugden
Johan Wagemans
Laboratory of Experimental Psychology
University of Leuven, Belgium
Version: 03/07/2008
Running head: The coding of intra-categorical shape similarity
Address correspondence to:
Johan Wagemans
University of Leuven
Laboratory of Experimental Psychology
Tiensestraat 102
B-3000 Leuven
Belgium
tel: +32-16-32.59.69
fax: +32-16-32.60.99
Email: [email protected]

2

3
Abstract
During visual object categorization, a match must be found between the input image and
stored information about basic-level categories. Graf (2002) suggested the involvement of
analog transformational, shape-changing processes to align the memory representation of the
category with the perceptual representation of the current stimulus. Here we compare the
predictions of alignment models with exemplar-based models using morphing between four
exemplar outlines within each of eleven categories. Overall, with increasing transformational
distance between two exemplars of the same category, reaction times to decide whether they
belong to the same category in a sequential matching paradigm increased, while rated
similarity between both exemplars decreased. However, in contrast to alignment accounts,
exemplar-based accounts (a) can correctly predict the observed dissociation between
typicality and categorization time, and allow the observed (b) deviations from sequential
additivity, and (c) non-linear relations between transformational distance and rated similarity.
By discussing integrations of exemplar-based theories with neglected processes such as
information accumulation, response competition, response priming, and gain-modulation, a
view of the recognition process from input to response emerges, which increases the validity
and scope of modern exemplar-based categorization and recognition models.
Keywords: basic-level categorization, shape transformations, invariants, topology, sequential
additivity, prototype- versus exemplar-based categorization, view-based object recognition,
feature-based representations
4
1 Introduction
Retinal images of the same object can be highly variable due to different lighting- and
viewing-conditions. Nevertheless, humans can recognize a familiar object despite spatial
transformations such as translations or rotations in the picture-plane, changes in the size of its
image, or even rotations in depth. Similarly, retinal images of different objects from the same
category are highly variable because of additional changes in shape, color, texture, etc. Again
though, humans can categorize objects that they have never seen before as belonging to a
certain basic-level class (e.g., a car, a chair, a bird, a dog, etc.) based on the similarity of the
image with stored class information (for reviews, see Mervis and Rosch 1981; Palmeri and
Gauthier 2004). Categorization may be a useful intermediate stage on the way to more
specific identification, because it restricts the set of candidate object models and because the
use of class-specific information allows a broader generalization (Ullman 1989, 1998).
However, it is not clear yet how the visual system deals with the large range of possible
images when classifying and identifying objects.
One observation that has attracted a lot of attention is the behavioral dependence on these
image transformations. Behavioral studies in which two images of the same object are
presented sequentially and subjects have to decide whether both images belong to the same
object or not, have revealed a monotonic increase in reaction times (RTs) and/or error rates
with increasing transformational distance between the two images. This behavioral
dependence on spatial transformations has been observed for translations, size-scalings,
rotations in the picture-plane and in depth (Bundesen et al 1981, 1983; Larsen and Bundesen

5
1978; Larsen et al 1999; Lawson 1999; Shepard and Cooper 1982), and recently also for
shape-changing or topological transformations (Graf 2002, 2006).
Graf (2002, 2006, 2008) proposed a Transformational Model of Recognition and
Categorization (TMRC) based on a process-based interpretation of Felix Klein’s Erlanger
Program1. By incorporating the general class of shape-changing or topological
transformations (which includes also, as a result of the hierarchies between the geometries, all
lower-level transformations such as affine and Euclidean transformations), alignment models
for recognition can be extended to account for categorization performance. Recognition after
spatial transformations relies mostly on Euclidean transformation processes, while
categorization up to the basic level can be accounted for mostly by non-Euclidean topological
transformations. Thus, categorization and recognition are achieved by transforming (the
coordinates of) a generic perceptual coordinate system or reference frame that defines the
correspondence between positions specified in memory and positions in the current visual
field so that the category and object representations in memory and the input representation
can be more or less aligned, to compensate for the image transformation.
TMRC explains the behavioral dependency on image transformations (and other findings)
parsimoniously by hypothesizing that the transformations of the coordinates of the perceptual
reference frame are fast (in contrast to slower image transformations during mental rotation),
analog (ie they traverse intermediate points along the transformational path), and
implemented by neural gain (amplitude) modulation (Salinas and Sejnowski 2001). Evidence
for the analog nature of transformational processes comes from a study by Bundesen et al
1 In his well-known Erlanger Program, Felix Klein has established a hierarchy of progressively weaker geometries, consisting of groups of transformations with fewer and broader invariants, which give rise to progressively wider equivalence classes: from Euclidean, to similarity and affine, to projective geometry, and topology (Todd et al 1998; Van Gool et al 1994; Wagemans et al 1997).
6
(1981) who showed that RTs to decide if two sequentially presented shapes are identical
except for changes in picture-plane orientation or size, were sequentially additive, suggesting
analog rotation- and size-scaling processes in object recognition. Evidence for the
involvement of a reference frame comes from a study by Graf, Kaping, and Bülthoff (2005)
that revealed orientation-congruency effects between two familiar shapes of different basic-
level and superordinate-level categories (see also Jolicoeur 1990): higher naming accuracy
was found when both sequentially presented object images were displayed in congruent
instead of incongruent picture-plane orientations. Finally, according to TMRC, the typicality
of a stimulus for a certain category is based on the amount of topological transformation
which is necessary to align the stimulus representation with the representation of the category
prototype, while similarity between two stimuli is based on the transformational distance
between both stimuli. This latter idea is supported by studies suggesting that the similarity
between two objects – a concept at the core of any categorization theory – is based on the
transformational distance between the structural representations of those objects (Hahn et al
2003; Markman and Gentner 1993a and b).
Graf (2002) tested his transformational model of recognition and categorization (TMRC)
by studying the dependence of similarity and typicality judgments and sequential-matching
performance on topological transformations, using outlines of category exemplars and
warping software (see also Graf 2008). For each of 22 categories, he selected two exemplars
and created one or three new exemplars that were positioned at a specific transformational
distance between the selected ones in the warping sequence. As predicted by TMRC, Graf
found that RTs and errors increased monotonically with increasing topological distance
between two exemplars when subjects had to indicate whether both exemplars belong to the
same basic-level category or not, while rated similarity decreased monotonically.

7
Furthermore, the categorization latencies did not seem to be incompatible with the hypothesis
of sequential additivity, which was taken to be suggestive of analog transformational
processes. Finally, typicality ratings usually decreased monotonically with increasing distance
from the position of the exemplar that was rated as most typical; the latter presumably being
closest to the representation of the category prototype, conceptualized as a superposition of
topologically transformed images of category exemplars. The data suggested that there was
one prototypical exemplar for natural categories, while there were two for artefactual
categories.
Graf’s TMRC is interesting because it treats recognition and categorization within a
unified framework, integrating a wide variety of findings. However, it is also confronted with
a number of problems. First, the warping procedure that is used does indeed imply a change in
object shape that is more than Euclidean, affine or projective but it does not establish a well-
defined topological transformation that is easily parameterized. While shape matching under
Euclidean transformations (planar translations and rotations), similarities (uniform size-
scalings), affine (nonuniform size-scalings and shears) and projective transformations has
been studied extensively (Bundesen et al 1981, 1983; Demeyer et al 2007; Kukkonen et al
1996; Larsen and Bundesen 1978; Larsen et al 1999; Tarr 1995; Tarr et al 1998; Vanrie et al
2001, 2002; Wagemans et al 1996, 1997, 2000; Willems and Wagemans 2001), the role of
topology for visual perception is less evident. Chen (1985, 2005) has suggested that
topological transformations and the properties they leave invariant (connectedness, inside-
outside relations, the presence of holes) are useful to understand perceptual organization but
that does not mean that the human visual system implements topological transformations as
such. The only evidence so far has come from research on the perception of growth or aging

8
(Mark and Todd 1985; Mark et al 1981; Pittenger and Shaw 1975; Pittenger and Todd 1983),
which was inspired by theoretical work in biology by D’Arcy Thompson (1917/1942).
Second, it cannot be ruled out that subjects are sensitive to the invariant properties
preserved under each of these transformations (for an introduction to the mathematical
framework of transformations and invariants, see Van Gool et al 1994). As mathematical
entities, invariants are – by definition – invariant and hence independent of the parameters of
the transformation under which they are invariant. However, the way in which the visual
system extracts or computes these invariant properties may be influenced quite systematically
by the parameter values specifying the size of the transformation, which may give rise to the
same systematic effects on performance measures (Wagemans et al 1996).
Finally, with his notion of abstract category representations, Graf (2002, 2006) appears to
be swimming against the tide. During the last decades, the object recognition and
categorization literatures have been moving away from abstract category representations to
shift their focus more towards image-based exemplar representations that are size-,
orientation-, view-, and shape-specific (Gauthier and Palmeri 2002; Kruschke 1992; Medin
and Shaffer 1978; Mozer 2002; Nosofsky and Zaki 2002; Op de Beeck et al 2001, 2003,
2008; Palmeri and Gauthier 2004; Perrett et al 1998; Poggio and Bizzi 2004; Tarr and
Bülthoff 1998; Vogels 1999; Zaki et al 2003). According to exemplar-based theories, objects
are represented as collections of viewpoint-dependent features (eg the output of receptive
fields) that are present in the retinal images of the objects. Each view can then be considered a
point in a high-dimensional space that captures the appearance of all possible views.
Recognizing (or categorizing) unknown object views (or category exemplars) is based on
establishing the detailed (or coarse) location of the unknown view (or exemplar) within this
space, by measuring the similarity of its features relative to the features of the nearest known

9
views (or exemplars) in memory, known as interpolating across the view space (or
interpolation to multiple visually similar exemplars, respectively; Edelman 1998; Tarr and
Bülthoff 1998). These view-based or exemplar-based representations are able to sustain class-
based generalization without the need to assume the existence of compensation processes
such as alignment (Tarr and Gauthier 1998).
In most mathematically formulated exemplar-based models, a shape is represented by its
similarity to stored prototypical exemplars from different categories, while similarity is a
decreasing function of the distance between the input and the stored exemplars in a low-
dimensional psychological shape space (Edelman 1998, 1999; Nosofsky 1986). Selective
attention to certain dimensions systematically modifies the structure of the space in which the
exemplars are embedded, making similarity context-dependent (Nosofsky 1986).
Classification decisions are based on the similarity of a probe to exemplars of a target
category relative to exemplars of contrast categories, recognition decisions are based on the
overall summed similarity of a probe to all exemplars, and typicality judgments are governed
by summed similarity of a probe to all exemplars of the target category (Nosofsky 1988).
These arguments raise doubts about the proposal that topological transformations are used
to match images of different exemplars of a basic-level category to a category prototype (Graf
2002, 2006, 2008). In light of its potential importance, this proposal is clearly in need of
further and stronger empirical support.
The purpose of our study was two-fold. First, we wanted to create and validate a new
stimulus set in which the shape-similarity between exemplars from the same category is
systematically manipulated, to study the representation of shape-similarity at the neuronal
level (Panis et al 2008b), or to study the effects of categorization learning on the neural
representation of shape similarity (Gillebert et al 2008). Second, we wanted to compare the

10
predictions of Graf’s (2002) TMRC with those from pure exemplar-based models using this
new stimulus set because we believe that it allows remediation for possibly important
shortcomings in Graf’s experiments (see Section 2.1). In four experiments we collected
similarity and typicality ratings, and measured the performance in a sequential basic-level
matching task.
As explained below, several aspects of our results favor an exemplar-based account of
categorization over a transformational account. However, we will argue that modern
exemplar-based categorization models need to incorporate modeling of well-established but
neglected processes such as temporal integration of information, gain-modulation, response
competition, and response priming in order to account for experimental data obtained in a
large range of visual tasks.
11
2 Experiment 1: Construction of a new stimulus set.
2.1 Introduction
To test TMRC, Graf selected two exemplars per category between which to warp, by hand. As
a result, it is possible that he selected images that were both fairly (proto)typical which might
result in a large sensitivity to the single topological transformation that was subsequently
tested for each category. In contrast, for each of 11 categories, we wanted to create a larger
number of morphing sequences per category, and to select a larger number of exemplars more
objectively by collecting similarity ratings for all the category exemplars from a published set
of line-drawings (Op de Beeck and Wagemans 2001; see also Op de Beeck et al 2000). Within
each category, we then identified the four most dissimilar exemplars from a two-dimensional
multi-dimensional scaling (MDS) solution. As we will show, this selection procedure resulted
in selections of typical and atypical exemplars from the same category to morph between.
2.2 Methods
Participants. Thirty high-school student volunteers (mean age 17) participated in Experiment
1. They were tested in two sessions that lasted around 1 hour each. In this and subsequent
experiments, all participants were naïve regarding the purpose of the experiment in which
they participated, all were unfamiliar with the stimuli, and all had normal or corrected-to-
normal vision. No one participated in more than one experiment.
Stimuli. A published stimulus set of line drawings of 269 exemplars from 25 different
categories (Op de Beeck and Wagemans 2001) was changed in two ways. First, we created
silhouette and outline versions using a procedure which we have also applied to the set of line
drawings by Snodgrass and Vanderwart (1980; see Wagemans et al 2008), because this allows

12
for more experimental control over the relevant stimulus features (see also De Winter and
Wagemans 2004). Second, eight categories were deleted either because (1) the edge-
extraction algorithm failed to yield smoothly curved, closed contours, (2) the exemplar
outlines were not recognizable anymore, or (3) the exemplar outlines were too similar. 180
exemplars from 17 categories remained.
Procedure. Similarity ratings were collected for all the possible intra-categorical combinations
of two exemplars (N = 1928; 1 category with 7 exemplars, 6 with 10 exemplars, 7 with 11
exemplars, and 3 with 12 exemplars gives 49 + (6 * 100) + (7 * 121) + (3 * 144) = 1928
combinations). Each subject was tested in two sessions separated by at least 24 hours (8
randomly chosen categories in the first, 9 in the second session). Ten subjects were tested with
all the line drawings, 10 with all the silhouettes, and 10 with all the outlines. Each
experimental trial started with a fixation cross for 500 ms followed by both stimulus
presentations for 200 ms separated by an interstimulus interval of 500 ms. Subjects had to rate
the similarity between the two consecutive stimuli on a 6-point scale (1 for very dissimilar, 6
for very similar). A chin-rest was placed at 57 cm from the screen. Stimuli (400 x 300
bitmaps) were shown on a 21” monitor (1024 x 768, 60 Hz refresh, background luminance 20
cd/m2) and subtended 14.2 x 10.9 visual degrees. Similar to Graf (2002), subjects were made
familiar with the shape differences between all the exemplars from each category (in the
particular version they were tested with) before the experimental trials of that category
started: Per category, they were shown one sheet of A4 paper with all exemplars.
2.3 Results
After applying the multi-dimensional scaling technique (MDS) on the similarity ratings from
each category, 11 categories (ie airplane, beetle, bird, butterfly, car, chair, fish, guitar,

13
motorcycle, rodent, and vase) survived the following two selection criteria. First, only
categories for which a two-dimensional MDS solution was appropriate for the contour
versions were selected (the criterion was that the screeplot showed a knee at 2 dimensions and
that the d-hat stress value was less than .1 for 2 dimensions). Second, only categories were
selected for which the same 4 exemplars turned out as most dissimilar (ie were located at the
extremes of each dimension) across the line drawings, silhouette and outline versions. These
four “extreme” exemplars were selected so that they formed the largest and best possible
rectangle in the 2-D shape space.
In Figure 1 we present the MDS solutions of the original outline versions of four example
categories and the four selected “extreme” exemplars. Next, the commercially available
Magic Morph software was used to create 33% and 66% morphs between each pair of the
selected extreme exemplars from each category in the outline version. This resulted in six
morphing sequences with four positions (0 – 33 – 66 – 100) and 16 exemplar outlines for each
of 11 categories (see Figure 2 first column). Note that each of the selected original exemplars
(Figure 1) was used as a start-point (“source”) or end-point (“target”) of three morphing
sequences (Figure 2).
------------------------------
Insert Figure 1 about here
------------------------------
Interestingly, for all categories at least one original exemplar was lying in a relatively
isolated region (see Figure 1). For each of the original exemplars, the average distance to the
other original exemplars was used as a measure of “isolatedness”. All original exemplars per
category were ranked from 1 to 7, 10, 11, or 12 (depending on the category), from most to
least isolated. The numbers in the four original exemplars used to create the morphs in Figure

14
2 report these rank numbers. For nine out of eleven categories, the original exemplar with
rank 1 was one of the four selected ones.
------------------------------
Insert Figure 2 about here
------------------------------
2.4 Discussion
To compare the predictions of TMRC and exemplar-based models regarding the effect of
shape-changing transformations on similarity and typicality judgments and sequential
matching performance in the next three experiments, we created 6 morphing sequences with
sixteen unique exemplar outlines for each of eleven categories. Because other researchers
might be interested in using these stimuli, we make them available on our website (http://
ppw.kuleuven.be/labexppsy/johanw/wag_2D.htm).
Although two-dimensional MDS solutions provided a reasonable fit to the data of the
selected categories, the nature of the shape-changes differed between the morphing sequences
within each category. For example, the shape-changes were small for the category guitar, and
large for the categories fish and beetle. We just used MDS as a selection tool, and do not
assume a true two-dimensional underlying physical nor psychological space. Also, the
presence of extreme exemplars in an isolated region offers an opportunity to test another
prediction of an exemplar-based model (see Experiment 3).
3 Experiment 2. Similarity and topological transformations.
3.1 Introduction

15
In Experiment 2, we asked participants to rate the similarity for pairs of exemplars while
we manipulated the transformational distance between them. According to TMRC, the
similarity comparison is a two-stage process: The similarity of two shapes is influenced by the
alignment phase, but also by the matching itself. If exact alignment is not achieved,
remaining small shape differences are captured in the matching process (Graf 2002). TMRC
and the transformational account of similarity (Hahn et al 2003) predict a monotonic decrease
in rated similarity with increasing transformational distance between two outlines of the same
category. In contrast, according to most exemplar-based theories, similarity is a decreasing
function of the distance between the two points representing the object outlines in an
underlying psychological space, which can differ between subjects.
3.2 Methods
Participants. Twenty high-school students participated voluntarily (mean age 17) and were
tested individually in a single session that lasted around 45 minutes.
Procedure. Each participant received 11 blocks of 96 trials. In each block, all the
combinations between the four exemplars from each of the six morph sequences of one
category were presented in separate trials (4 x 4 x 6 = 96). As a result, 16 trial types were
created: four distance 0 trials (11, 22, 33, 44), six distance 1 or 33% trials (12, 21, 23, 32, 34,
43), four distance 2 or 66% trials (13, 31, 24, 42), and two distance 3 or 100% trials (14, 41).
The order of blocks (or categories) was randomized. Trials were self-paced and started with
500 ms fixation, followed by the sequential presentation of both stimuli for 150 ms each,
separated by an interstimulus interval of 500 ms. Subjects had to rate their similarity on a 6-
point scale (1 for very dissimilar, 6 for very similar) after they were made familiar with the
shape differences between all the exemplars from each category before each block of

16
experimental trials started (by showing all of them on a single A4 page). Subjects were
instructed not to think too long about their decision. A chin-rest was placed at 57 cm from the
screen. Stimuli (400 x 300 bitmaps) were shown centered on a 21” monitor (1024 x 768, 60
Hz refresh, background luminance 30 cd/m2) and subtended 14.2 x 10.9 visual degrees.
3.3 Results
First, we calculated the average similarity ratings for each combination of subject and
transformational distance (averages across categories, morphing sequences, and two to six
trials with equal distance). A one-way ANOVA showed a significant effect of distance
(F(3,57) = 1412.73, p < .0001). The average similarity ratings decreased with increasing
transformational distance (Figure 3). This was confirmed by a highly significant and negative
Spearman correlation between transformational distance and the average similarity ratings (rs
= -.965, p < .0001, N = 80). A very strong linear trend (F(1,57) = 4224.11, p < .0001) and a
weaker but highly significant quadratic trend were found (F(1,57) = 11.4, p < .002). The cubic
trend was not significant (F(1,57) = 2.67, p = .1081). Pairwise multiple comparisons showed
that all the means were significantly different from each other.
------------------------------
Insert Figure 3 about here
------------------------------
For each combination of subject and category, the Spearman rank correlation (N = 24)
between average rated similarity (across trials with equal distance) and the transformational
distance for each sequence (0, 1, 2, 3) was highly significant; the average Spearman rank

17
correlation across these 220 combinations equaled -.9 (STD = .05). For each of the 66
morphing sequences, the Spearman rank correlation (N = 4) between average similarity
(across subjects and trials) and transformational distance between stimuli equaled minus one.
Finally, the mean ratings of individual subjects (averaged across the two to six trials with
the same distance) for each of the (66 times 4) morphing sequence-positions were examined.
For the 1320 subject-specific morphing sequences (66 sequences times 20 subjects), 128
morphing sequences (9.7%) showed one or two deviations from strict monotonicity. When
considering all the possible pairs (N = 3960; 20 subjects times 66 morphing sequences times 3
pairs per morphing sequence), 134 pairs (3.38%) deviated from strict monotonicity.
3.4 Discussion
The results of Experiment 1 show that the topological transformations created by the
morphing algorithm systematically influenced the judged similarity between stimuli, as found
by Graf (2002) and predicted by TMRC and the structural alignment account of similarity
(Hahn et al 2003; Markman and Gentner 1993a and b). The similarity ratings decreased
systematically with increasing transformational distance between the exemplars.
However, although Graf (2002) found a significant linear trend, as we did, he does not
report the quadratic trend which is also significant in our data. The quadratic trend is also
present visually in Graf’s data. We believe that the significant quadratic trend and the
observed deviations from monotonicity for individual subject data are more consistent with
the conception of similarity as an exponentially decreasing function of distance.
Anyway, we can conclude that people usually could discriminate the shape changes and
that the amount of change could also be translated into corresponding similarity ratings.
Because the specific type and amount of transformation between exemplars was different for

18
different morphing sequences (see Figure 2), and because the monotonic relation between
transformational distance and average rated similarity was found for every morphing
sequence, this correspondence is far from trivial and seems to imply the involvement of
considerable cognitive processing (see also Nosofsky 1986). For instance, participants seem
to adjust the range of the rating scale to the range of the variability within a morphing
sequence or category.

19
4 Experiment 3. Sequential basic-level matching and topological transformations.
4.1 Introduction
Exemplar-based theories can and have been extended to account for categorization
performance. For example, Nosofsky and Palmeri (1997a and b) introduced the exemplar-
based random walk model (EBRW) in which categorization decisions are made by retrieving
stored exemplars from memory. These sequentially retrieved exemplars drive a random-walk
process in which evidence builds up to one of the alternative responses over time. In
Lamberts’ (2000) model, an accumulation of perceptual information about the values of the
input stimulus on different shape dimensions is used to predict categorization performance,
resulting in a similarity measure that is also time-dependent.
In Experiment 3, we used a sequential matching paradigm to investigate the effect of
transformational distance on sequential basic-level matching performance. According to
TMRC, basic level categorization is achieved by a topological transformation process, which
aligns the category representation and the stimulus representation. The transformation process
is time-consuming, error-prone, and analog (ie it traverses intermediate points in the
transformational path). Consequently, TMRC predicts (a) a systematic (monotonic) relation
between response latencies (and errors) and the extent of topological transformation (ie longer
latencies and higher error rates for larger topological transformations), and (b) sequentially
additive transformation times.
According to the particular exemplar-based model of Cohen and Nosofsky (2000),
performance in sequential matching tasks (ie speeded same-different judgments) can be
modeled by assuming that pairs of stimuli are memorized and retrieved to drive a random
20
walk process. One of the predictions of this model is that same responses are faster for objects
lying in isolated than in dense regions of similarity space.
4.2 Methods
Participants. Twenty-two university undergraduates in psychology participated voluntarily
(mean age 22) and were tested individually in two sessions of around 50 minutes each.
Procedure. Each trial started with a fixation cross for 500 ms, followed by the first stimulus
(150 ms), a mask for 500 ms, the second stimulus (150 ms), and a mask until response.
Subjects had to decide whether both stimuli belonged to the same basic-level category (same
trial) or not (different trial). The experiment consisted of 1056 same trials and 1056 different
trials. The former were created by pairing the exemplars from each sequence with each other
(4 x 4 x 6 sequences x 11 categories = 1056 same trials). The latter were created by pairing
the first stimulus from all the same trials with a stimulus from another category. For each
subject, the 2112 trials were presented randomly and divided into two sessions. Before the
experiment, subjects were made familiar with the category labels, the kind of stimuli (ie
outlines that were not extreme in the MDS solution) and the task (44 practice trials). Stimuli
(400 x 300 bitmaps) were shown centered on a 15” laptop screen (1024 x 768, 60 Hz refresh,
background luminance 20 cd/m2) and subtended 12.2 x 8.9 visual degrees. A chin-rest was
placed at 57 cm from the screen. Trials were self-paced. Reaction time and accuracy were
recorded. No feedback was given. Subjects were instructed to respond as fast and correct as
possible.
4.3 Results

21
4.3.1 Reaction time. In 4.27% (N = 993) of all the same trials (N = 23,232) an error was made,
leaving 22,239 correct same trials. Reaction times that were larger than 2500 ms and smaller
than 200 ms were excluded (ie 52 trials or .23 % of the correct same trials) leaving 22,187
trials to enter the analyses. The grand mean RT equaled 511 ms and was comparable to the
471 ms found by Graf (2002). This increase of 40 ms might be due to the fact that our stimuli
were on average more complex compared to those used by Graf (2002).
First, we calculated the average RT for each combination of subject, category, session, and
transformational distance. These average RTs were analyzed using a repeated-measures
ANOVA with category (1 to 11), session (1, 2) and transformational distance (0, 1, 2, and 3)
as within-subject factors. Results showed a significant main effect of category (F(10,210) =
8.55, p < .0001), transformational distance (F(3,63) = 67.83, p < .0001), and session (F(1,21)
= 43.96, p < .0001). RTs increased with increasing transformational distance and they
decreased from session 1 to session 2 (Figure 4). Trend analysis for transformational distance
showed a significant linear (F(1,63) = 196.88, p < .0001) and quadratic trend (F(1,63) = 6.41,
p < .014), but no significant cubic trend (F < 1). Tukey-Kramer corrected pairwise multiple
comparisons for the levels of distance showed significant differences between all pairs.
------------------------------
Insert Figure 4 about here
------------------------------
However, the interaction between distance and category was also significant (F(30,1533)
= 2.02, p < .001). Therefore, we subsequently analyzed the data separately for each category
to test the effect of transformational distance for each of the six morphing sequences in each
category. For all categories there was a significant overall effect of transformational distance.
However, for 49 out of the 66 morphing sequences (74%), the effect of transformational

22
distance on RTs was not significant. Also, only 14 morphing sequences (21%) showed a
monotonic relation between transformational distance and RT.
In Figure 2 (second column) we show the average RT for each stimulus for the same
distance 0 trials. The maximum (white) and minimum (black) RT for each category is
indicated, as well as local minima (grey; by comparing the three neighbors for each extreme
exemplar and the two neighbors for each morphed exemplar). In contrast to the prediction of
Cohen and Nosofsky (2000), the same response in distance 0 trials to extreme exemplars lying
in an isolated region (ie with rank 1 in Figure 2 first column) was not systematically the
fastest; for three categories (butterfly, bird, motorcycle) it was even the slowest. However, it is
likely that the rank 1 exemplars are not necessarily isolated in the underlying psychological
space employed by the subjects.
4.3.2 Error rates. For each subject, we calculated the percentage error for each
transformational distance. A one-way ANOVA showed a significant effect of transformational
distance on error rate for the same-category trials (F(3,63) = 18.4, p < .0001; Figure 5). The
effect of session (F(1,21) = 1.25, p = .28) and the interaction (F(3,63) = 1.1, p = .36) were not
significant.
------------------------------
Insert Figure 5 about here
------------------------------
4.3.3 Sequential additivity. In order to investigate whether the RTs were sequentially additive,
which would point to analog transformations, we followed the procedure of Graf (2002), and
first determined “pure” transformation times for each trial type containing different
exemplars. For example, for the analyses across subjects, we first calculated the average RT

23
for each combination of subject and the 16 trial types (averaged across categories and
sequences). Data for trial types with the same exemplars were collapsed, resulting in ten trial
types: ‘11’, ‘22’, ‘33’, and ‘44’ with distance 0, ‘12’ (collapsed with 21), ‘23’ (collapsed with
32), and ‘34’ (collapsed with 43) for distance 1, ‘24’ (collapsed with 42) and ‘13’ (collapsed
with 31) for distance 2, and finally ‘14’ (collapsed with 41) for distance 3. Next, pure or
“observed” transformation times were calculated. For example, the observed transformation
time for trial type 12 (TT12) equals the average RT for 12 (RT12) minus the average of RT11
and RT22. Similarly, TT13 equals RT13 minus the average of RT11 and RT33, and so on.
Next, we calculated the predicted transformation times for each of three distances: the
predicted TT13 = TT12 + TT23, the predicted TT24 = TT23 + TT34, and the predicted TT14
= TT12 + TT23 + TT34. Scatter plots of the predicted and observed TTs for this analysis
across subjects are shown in Figure 6 (left column) for each of the three distances.
Correlations between observed and predicted transformation times for distances 13, 24 and 14
equaled .75, .47, and .46, respectively (all p < .05; N = 22). T-tests showed that the difference
in mean transformation times between predicted and observed times was almost significant
for the largest distance (ie distance 14: t(21) = 1.76, p = .093) but not for distances 13 and 24.
A similar analysis was done for the 66 morphing sequences (Figure 6 right column). Here, the
correlations for 13, 24 and 14 equaled .59, .46, and .46, respectively (all p < .05; N = 66).
Again, the difference in mean transformation times between predicted and observed times was
almost significant for the largest distance (ie distance 14: t(65) = 1.76, p = .082) but not for
distances 13 and 24. Note that several predicted transformation times were negative,
indicating that the mean RT for distance-1 trials (ie RT12, RT23, and RT34) was lower than
for distance-0 trials. Interestingly, also several observed transformation times were negative
but only for the analysis across morphing sequences (Figure 6 right column).

24
------------------------------
Insert Figure 6 about here
------------------------------
4.4 Discussion
In Experiment 3 error percentages and average reaction times increased monotonically with
increasing transformational distance between both exemplars in a sequential basic-level
matching task, as found by Graf (2002).
However, in our dataset, the hypothesis of sequential additivity, which lies at the heart of
TMRC, was violated many times since (1) for 74% of the sequences no significant differences
in RTs were found, (2) only 21% of the morphing sequences showed a monotonic relation
between transformational distance and RT, (3) the correlations between predicted and
observed transformation times were not very high, and (4) for many sequences, the predicted
and/or “observed” transformation times were negative. The evidence for sequential additivity
was also not very strong in Graf’s data (which he himself also admitted; Graf 2002, pp.
142-143).
To account for sequential matching performance (ie speeded same-different judgments),
Cohen and Nosofsky (2000) extended the EBRW of Nosofsky and Palmeri (1997a) by
assuming that two processes drive the same-different judgments. First, whenever a pair of
objects is presented, subjects are assumed to make on-line judgments of perceptual similarity;
high values drive a random-walk counter toward a ‘same’ response criterion, while low values
tend to drive the counter toward a ‘different’ response criterion. Second, observers are also
assumed to store individual examples of experienced same and different pairs of objects in
memory. When presented with an input pair exemplar pairs from memory are retrieved

25
according to their similarity with the input pair; retrieval of same (different) pairs moves the
random walk toward the same (different) response criterion.
Thus, as the transformational distance between two outlines increases, the initial on-line
judgment of perceptual similarity will tend to drive the counter toward a ‘different’ response
criterion. However, since similarity is time-dependent (Lamberts 2000), continued visual
processing will eventually drive the counter toward the ‘same’ response criterion, and this will
take longer when the transformational distance is larger, producing the monotonic increase in
RT with increasing transformational distance. The improvement in RT from the first to the
second session is then due to the fact that the visual stimuli are stored in memory (during
session 1) and come to speed up the decision process (during session 2). In other words, the
sequential matching task becomes more automatic when the experience of the observers with
individual exemplars and pairs of exemplars increases (see also Palmeri et al 2004).
Although this explanation sounds valid, we believe that it does not accurately describe
human performance in sequential matching tasks. TMRC, EBRW, and Lamberts’ (2000)
information-accumulation model have one thing in common: Responses are only initiated
after a decision process. In the General Discussion we will discuss an alternative explanation
according to which the effect of image transformations on sequential matching performance
measures is localized, at least in part, at the response level.
5 Experiment 4. Typicality and topological transformations.
5.1 Introduction
In Experiment 4, we collected typicality ratings for each of the 16 exemplars of each category
to assess the ecological validity of our morph stimuli in each category. If the morph exemplars

26
are interpreted as real exemplars from a category, their typicality should be at least as high as
that for the selected extreme exemplars.
Furthermore, TMRC and exemplar-based models generate contrasting predictions.
According to TMRC, typicality is based on the transformational distance to the category
prototype representation. The most typical stimulus is regarded as being the most similar to
the category prototype representation. TMRC predicts that typicality ratings will decrease
with increasing distance from the most typical exemplar (the prototypical exemplar) in a
morphing sequence. Since categorization of a stimulus is based also on the topological
distance, TMRC predicts an association between typicality and categorization (ie higher
typicality is associated with faster RTs and vice versa).
In contrast, exemplar-based models assume that typicality is based on the summed
similarities of the stimulus to all the exemplars from that category, while categorization is
determined by the relative degree of target-category to contrast-category similarity. Therefore,
a dissociation between classification and typicality judgments can be expected as has been
observed by Nosofsky (1988).
Interestingly, it is generally assumed that category prototypes constructed to be physical
central tendencies of category exemplars are also psychological central tendencies (eg Smith
and Minda 2001). While this assumption of a fairly direct mapping between physical and
psychological dimensions may exist for stimuli with clearly defined psychological dimensions
(eg semicircles of varying sizes containing radial lines of varying angles), Palmeri and
Nosofsky (2001) argued that the mappings between physical properties and psychological
dimensions are not so clearly defined for fairly complex stimuli (eg artificial dot-patterns,
checkerboard patterns, and perhaps also for more natural stimuli). The result is that prototypes
that are physical central tendencies of category exemplars may sometimes reside not as

27
psychological central tendencies, but as psychological extreme points relative to the category
exemplars (and to the exemplars of contrast categories). In each of three experiments, Palmeri
and Nosofsky (2001) created prototypes (ie dot patterns in the shape of a triangle, a plus, and
an F; three unfamiliar dot patterns with vertical symmetry; two complex checkerboard
patterns) and distortions of these prototype patterns, the latter acting as category exemplars.
During training in each experiment, participants learned to classify a subset of the distortions
with feedback. During transfer, participants were tested on the old distortions, on new
distortions, and on the prototypes. Finally, in each experiment, participants made pairwise
similarity judgements between all possible pattern pairs to derive the psychological
coordinates of all the patterns using MDS. The most important result in the current context is
that the MDS solutions of each experiment showed that the prototypes were psychological
extremes in relation to other exemplars of their categories (and to the exemplars of contrast
categories). During categorization learning with complex physical stimuli, various emergent
dimensions, based on diagnostic, functional features may be formed, which causes the
prototypes to be respresented as psychological extremes. The similarity measure based on
these features can be quite different from the similarity measure used to create the physical
central tendencies. The MDS solutions also allowed exemplar-based models to predict the
observed extreme prototype-enhancement effects better than prototype-based models.
Based on this reasoning, it is possible that participants have created such functional
features during categorization learning of real-life objects, and that the exemplar outline rated
as most typical will occupy extreme positions.
5.2 Methods

28
Participants. 56 high-school students participated voluntarily (mean age 17) and were tested
collectively in one of three groups. The experiment lasted around 30 minutes.
Procedure. The 16 exemplar outlines (4 extremes + 12 morphs) of each category were printed
on one A4 page, in a random order for each participant. For each of the 11 categories, subjects
had to rate the typicality of each exemplar on a 6 point scale (1 for very atypical, 6 for very
typical) which was also printed on each page. Subjects were encouraged to use all points of
the scale.
5.3 Results
First, we calculated the average typicality for each combination of subject and the four
exemplar positions within a sequence. Like Graf (2002), we did not necessarily expect that
the effect of position would be significant because the position of the category prototypes
might be distributed over categories and sequences. Still, a one-way repeated-measures
ANOVA showed a significant effect of exemplar position (F(3,159) = 18.576, p < .0001). On
average, the typicality ratings were higher for exemplars in the middle positions than for the
exemplars at the extreme positions of the sequences (Figure 7). Trend analyses showed a
significant linear (F(1,159) = 16.69, p < .0001) and an even stronger quadratic trend (F(1,159)
= 39.6, p < .0001), but no significant cubic trend (F < 1). Pairwise multiple comparisons
showed that positions 2 and 3, and positions 2 and 4 did not differ significantly from one
another, while the others did.
------------------------------
Insert Figure 7 about here
------------------------------

29
Second, to investigate the prototypicality gradients for each sequence in each category,
Figure 2 (right column) shows the mean typicality ratings of each exemplar of each category
(averaged across subjects) with the maximum (black) and minimum (white) values indicated.
Similar to Graf (2002), we define a prototypical exemplar as an exemplar for which the
average typicality is higher than that of their neighboring exemplars (ie three neighbors for
each extreme exemplar and two neighbors for each morphed exemplar; grey squares in Figure
2 right column; the black square indicates maximum typicality). Based on this definition, the
number of prototypical exemplars for a category ranged from 1 to 6. Figure 8 shows the
position of the four extremes for each category when the sixteen stimuli are sorted from low
to high typicality.
------------------------------
Insert Figure 8 about here
------------------------------
Two interesting observations can be made. First, a clear dissociation between typicality
and categorization is evident by comparing the positions of the white, black, and grey squares
in the middle and right column of Figure 2. TMRC would predict the same locations of the
different colored squares in both columns for each category. Second, Figure 8 shows that the
exemplar that was rated as the most typical occupied an extreme position for five out of
eleven categories, while this was also the case for the second-most typical for three other
categories. For nine categories the exemplar rated on average as least typical was also an
extreme stimulus.
5.4 Discussion

30
In Experiment 4 we found that the rated typicality was on average higher for the intermediate
morph stimuli compared to the extreme stimuli, replicating the findings of Graf (2002). The
position of the exemplar that was rated as most typical, however, was an extreme position for
five out of eleven categories (car, guitar, chair, vase, bird). This finding is inconsistent with
the idea that the category prototype representation is the central tendency of the exemplars,
and therefore should occupy a central position in the underlying psychological space.
However, just as exemplar-based models, TMRC allows the existence of multiple prototypes
(in analogy with multiple views in object recognition). The observed range of (local)
prototypes across categories (ie one to six) might resemble the existence of a different number
of subcategories for different basic-level categories. Crucially, the observed dissociation
between typicality and categorization clearly favors an exemplar-based account over an
alignment account.
Finally, the observation that an extreme exemplar was rated as most typical for five
categories is not inconsistent with the idea put forward by Palmeri and Nosofsky (2001) who,
as mentioned in the Introduction, found that prototypes that are physical central tendencies of
category instances may become represented psychologically as extreme points. They
suggested that the extreme-point prototype representation might arise from the emergence of
diagnostic, functional features that may be created as part of the process of category learning
(Schyns 1997, 1998; see also Schyns and Rodet 1997). Neurophysiological studies found that
neurons in IT respond strongest to stimuli with extreme values on shape dimensions (De
Baene et al 2007, 2008; Kayaert et al 2005). Thus, although prototypes are never observed
during natural vision, the prototypes used in vision research (e.g., stimuli with perfect
symmetry, averages of a large number of faces, etc.), and our exemplars that are rated as most

31
typical, might have extreme values on the diagnostic shape dimensions from exemplar-based
models.

32
6 General Discussion
We created and validated a new stimulus set using morphing between four selected exemplar
outlines from the same category, and investigated the predictions from a transformational
alignment model and from exemplar-based models. The non-linear relation between similarity
and topological distance (Experiment 2), the deviations from sequential additivity
(Experiment 3), and the dissociation between typicality and categorization (Experiment 4),
contradict the idea of an analog transformational alignment process, but not of exemplar-
based representations.
However, we believe current exemplar-based categorization models do not yet adequately
describe human visual performance. In this section we will first discuss two principles – the
world as an outside memory and the continuous flow model of information processing – that
have been neglected in the literature. Subsequently, we will argue that when exemplar-based
models also incorporate the second principle, they can quite easily explain the behavioral
dependency on all kinds of image transformations. Next, we discuss the concept of
transformation and its relation to gain-modulation. We end by discussing other time-
consuming and error-prone processes that can contribute to the behavioral dependency on
image transformations.
6.1 The world as an outside memory
O’Regan (1992) noted, as many before him, that despite all kinds of defects in the
construction of the eye and retina (eg the fovea is not a region of uniform acuity), the world
we perceive does not seem of different resolution or color at different eccentricities, and the
displacement of the retinal image caused by saccades and fixational instability is usually not

33
noticed. Traditional theories, including TMRC, incorporate some kind of compensatory
mechanisms that implicitly assume the existence of an internal representation like a kind of
“internal screen” or “scale model” which has metric properties like the outside world.
However, O’Regan (1992) discusses experiments that suggest an alternative view in which
the outside world is considered a form of ever-present external memory that can be sampled at
leisure via eye-movements. According to this view there is no need to reconstruct shape to
compensate for eye-movements or image transformations, and not many details are
remembered across saccades. The goal is simply to extract enough visual information to
decide on an appropriate action. Vision is an active process where eye-movements cause a
change in sensation which is used to modify or confirm an interpretation, which guides further
action (O’Regan 1992; see also Rybak et al 1998; Trick and Enns 1997).
While TMRC and classical structural description theories like Recognition By
Components (Biederman 1987) reconstruct shape or parts, and thus represent shape
information through the similarity between input and memory (first-order isomorphism),
exemplar-based models do not try to reconstruct shape but convey information about shape by
representing the similarity between shapes itself (second-order isomorphism; Edelman 1998)
by means of an interpolation process (see above). Nevertheless, the structure of objects can be
represented in exemplar-based models if shape-tuned units are also selective to the location of
its preferred shape feature (“what + where” units; Edelman and Intrator 2000; see also Newell
et al 2005). In this view, exemplars are defined as image fragments (in contrast to holistic
images or generic parts), and the spatial relations between them are continous and coarsely
coded. In general, features that co-occur more frequently will become more strongly
associated, and extensive experience with the same features in a consistent configuration will
give rise to more complex features. In contrast to rigid templates, the relative positions of

34
features might be represented probabilistically instead of deterministically, thereby providing
flexible or “deformable” templates for recognition (Barenholtz and Tarr 2008; Tarr and
Bülthoff 1998).
For example, Kukkonen et al (1996; see also Wagemans et al 1996, 2000) showed that
relatively simple cues such as parallelism, collinearity and curvature sign (convexities versus
concavities), which are easy to extract during different fixations, are used when judging
whether two retinal images arise from the same object viewed from different positions. These
image-based properties, resulting from perceptual organization, can be described as
‘qualitative or quasi-invariant properties’ – by themselves special cases of mathematical
invariant properties – and might partly underlie the fast assessment of affine, projective, and
Euclidean shape equivalence and topological class equivalence.
6.2 The continuous flow model of human information processing
The continuous flow model of information processing (Eriksen and Schultz 1979; see also
Coles et al 1985) suggests that the latency and accuracy of overt behavioral responses are a
function of (a) a response activation process controlled by a stimulus evaluation process that
accumulates evidence gradually, (b) a response priming process that is independent of
stimulus evaluation, and (c) a response competition process. Although this model was
invented in the context of visual search tasks, where RT increases with increasing number of
distracters, we will elaborate on these processes and provide recent studies that are consistent
with the predictions of this model although they were not set up to test them directly. Current
exemplar-based categorization models are largely neglecting these processes.
First, Eriksen and Schultz (1979) discuss how improvement in acuity with increased
viewing time or exposure duration of the stimulus can be attributed in most instances to

35
increased energy summation over the longer temporal interval. Such summation of energy
implies that the accumulation of information about a stimulus in a sensory register or the
percept is a temporally distributed process. The gradual accumulation of stimulus information
in the visual system is consistent with (a) the gradual increase in neural activity of single cells
and cell populations in object-related areas (Eger et al 2006; Mruczek and Sheinberg 2007),
(b) the Reverse Hierarchy Theory (Hochstein and Ahissar 2002) which states that the local
properties or details are only available later when focused attention is directed to them, (c) the
finding that object-selective neurons first convey global, categorical information before they
convey local, fine identity information (Sugase et al 1999), and (d) recent computational and
neurophysiological research that use time as a coding dimension for neural representations
(Perrett et al 1998; Wyss et al 2003). For example, Perrett et al (1998) suggest that the speed
of recognition of an object depends on the rate of accumulation of activity from responsive
neurons that is evoked by the input view, which depends on the extent that the object has been
experienced before under the same viewing conditions. Activity amongst the population of
cells selective to the object’s appearance will accumulate more slowly when the object is seen
in an unusual view, orientation, or size, compared to the training experience. Furthermore, if
the evidence for a particular object at a particular orientation is small (because of degraded
input or short presentation durations) more information needs to be gathered by covert and
overt attentional selection processes (Perrett et al 1998). However, it is not clear whether such
a process is sufficient to explain the behavioral dependency on image transformations in
sequential matching tasks.
Second, according to the continuous flow model, response activation begins as soon as
some visual information is accumulated. Thus, the process of stimulus evaluation
continuously feeds information about the stimulus to associated response activation systems.

36
Early in the process, the information is consistent with a wide range of responses, and these
receive initial activation. As the information continues to accumulate, response activation
becomes increasingly focused on responses that remain viable alternatives, given the
accumulated data. A given response is only evoked when the activation of its channel exceeds
a threshold. Crucially, responses can compete with each other. The speed with which a correct
response is executed depends, in part, on the extent of response competition. The greater this
competition, the longer the latency of the correct response.
Thus, this continuous flow model does not provide for a separate decision stage
responsible for activating or initiating responses; responses are emitted whenever one of the
response channels exceeds a criterion level (which can fluctuate from trial to trial).
Furthermore, it implies that the duration of the evaluation process cannot always be inferred
from RT (which is an implicit assumption in TMRC). Initial evidence for these processes in a
nonsearch task comes from a study from Coles et al (1985) who used an analog response
device (two dynamometers) and measures of the electromyogram of the hand muscles to show
the reality of partial response activation and response competition. By measuring also the
latency of the P300 component of the event-related brain potential (probably related to a
process that is invoked only after stimulus evaluation has been completed), Coles et al (1985)
could confirm the predictions of the continuous flow model.
Recent evidence for response competition in the context of a categorization task comes
from Spivey and Dale (2006) and Dale et al (2007) who used eye-tracking and mouse-
tracking evidence. Also, neurophysiological and neuroimaging research on decision-making is
consistent with the idea of a continuous flow of information up to response systems
(Heekeren et al 2004; Hernández et al 2002; McKeeff and Tong 2007; Rorie and Newsome
2005). For example, Hernández et al (2004) trained monkeys to discriminate between two

37
vibrations applied sequentially to the fingertips; monkeys had to recall the frequency of the
first vibration, compare it to the second one, and indicate with a hand movement which of the
two vibrations had the higher frequency. They found that the responses of single neurons in
medial premotor cortex correlated with these diverse stages of the discrimination process (ie
coding the first, coding the second, comparison, response). Finally, the idea that multiple
object representations can be activated and compete is recently taken up by Bar et al (2003,
2006), Gabroi and Lisman (2003), Panis et al. (2008a), and Panis and Wagemans (2008). For
example, Gabroi and Lisman (2003) show how bidirectional flow of information in
reciprocally connected hierarchical cortical areas can be organized to produce recognition of
objects and categories through the detection of combinations of features, and how the serial
process of attention can be integrated with the parallel recognition processes. After the early
activation of a set of candidate objects (and responses) based on early and coarse information
(eg low spatial frequencies), later bottom-up flow of detailed information through a narrow
window of attention then leads to the inactivation (exclusion) of candidate object
representations (eg activated flexible hierarchical feature templates) that are inconsistent with
the sampled information, thereby reducing the set of possible objects and responses.
Algorithms for moving attention make use of top-down connections to compute the relative
probability of each feature or spatial relation between features, given the set of still-possible
object representations, after which attention will move to the most informative feature.
Recognition occurs after a few cycles when the serially sampled information leads to the
inactivation of all but one candidate object (Gabroi & Lisman 2003).
Third, another way in which response channels can be activated is through a response
priming process that is independent of the nature of the input stimulus and may even precede

38
stimulus presentation. Such aspecific priming may be triggered by factors as instructions,
expectancy, pay-off schedules, and the like (Coles et al 1985).
We argue that the continuous flow model can, at least in part, explain the behavioral
dependency on topological and other image transformations. In particular, the increase in RT
(and error percentage) with increasing topological distance in Experiment 3 is caused by a
greater competition between the responses of both hands: yes (same) or no (different).
Response competition is lowest in distance 0 trials since there is no evidence in the stimuli for
the no response. However, a low number of errors are made because of the aspecific priming
process, which will sometimes activate the incorrect response. For distance 1 to distance 3
tirals, the initial evidence is increasingly activating the no response because of the greater
shape changes and the image-based sensitivity of the visual system, leading to stronger
response competition, and the observed higher error probabilities and latencies of the correct
yes response.
Furthermore, negative transformation times for distance 1 trials (TT12, TT23, or TT34),
resulting in negative subject- and sequence-specific, predicted transformation times for
distance 2 and 3 trials (TT13, TT24, and TT14), are not surprising: Trial-by-trial fluctuations
in the threshold and/or fluctuations in the amount of a-specific priming can result in a faster
crossing of the threshold in some distance 1 trials compared to distance 0 trials, when the
competition is weak. However, when the shape changes reach a critical size (as in distance 2
and distance 3 trials), the competition between responses is strong enough to prevent a quick
crossing of the threshold of the correct response; no observed subject-specific transformation
times (averaged across all morphing sequences) for distance 2 and 3 were negative (Figure 6
left column). In contrast, observed morphing sequence-specific transformation times for
distance 2 and 3 trials can be negative because they are averaged across subjects which differ

39
on the speed of information transmission, the threshold level, the amount of aspecific priming,
category knowledge, muscle strength, etc.
6.3 Transformations and gain-modulation
Although our data reject TMRC, analog transformations of visual information might occur in
the system. Information processing of visual information can be considered as a progressive
series of visual re-representations or transformations of the retinal representations, from V1 to
V2 to V4 to IT, in order to make objectively similar stimuli closer to each other, and
dissimilar stimuli farther apart (Connor et al 2007; DiCarlo and Cox 2007; Weiss and
Edelman 1995). Furthermore, gain-modulation is a nonlinear way in which neurons combine
information from two or more sources, and it can serve as a basis for a general class of
computations, namely coordinate transformations and the generation of invariant responses
(Salinas and Sejnowski 2001). For example, the receptive fields of some neurons in parietal
cortex are gain-modulated by head and eye positions, resulting in a change from retinal, or
eye-centered, to body-centered coordinates. Also, neurons in V4 which respond to
combinations of curvature and orientation, are gain-modulated by the location where attention
is directed, and leads downstream IT neurons that are driven by the gain-modulated ones, to
become responding in a coordinate frame centered on the location where attention is directed,
ie they are insensitive to the absolute location of the input pattern or translation invariant
(Salinas and Sejnowski 2001).
These attention-centered responses in V4 might explain the orientation-congruency effects
as observed by Graf et al (2005). They presented a first stimulus for 104 ms immediately
followed by a second stimulus for 82 ms (on average across subjects). Both stimuli were
either in congruent or incongruent orientations. Six different objects could appear as the first

40
target and 18 objects as the second target. Furthermore, left-facing objects were flipped so that
all objects were oriented to the right. The orientation-congruency effect found by Graf et al
(2005), namely, higher naming accuracy of both objects in the correct order for congruent
than for incongruent orientations, was independent of superordinate category membership and
was found for objects with different main axes of elongation (eg tree vs fish).
Gauthier and Tarr (1997) and Tarr and Gauthier (1998) found (picture-plane and 3D)
orientation priming only for visually similar shapes. Indeed, in an exemplar-based system in
which objects are represented in a viewpoint-dependent manner, including information of the
shape and orientation or pose, the same view of two different exemplars of the same class
may be more similar than two different views of the same exemplar. The most salient
difference between the study of Gauthier and Tarr (1997) and that of Graf et al (2005) is the
difference in stimulus duration. Presenting stimuli as short as Graf et al (2005) did, will not
allow extraction of details of shape and location (ie full accumulation of visual information
about shape and location). Rather than concluding that orientation congruency effects argue
for models in which recognition is achieved by an adjustment of a perceptual coordinate
system, we believe that a much more basic process such as gain-modulation by attention can
be responsible: First, we assume that accuracy is mostly dependent on the correct recognition
of the second object. Second, it is known that covert spatial attentional selection effects start
around 80 ms post stimulus onset peaking about 20 ms later (Hillyard et al 1998). Third, if the
first object, eg a fish rotated by 50 degrees in the picture plane, is categorized around 150 ms
after its onset, the system knows that the feature on the upper right of the fixation cross
(where covert attention might be focused at that moment) is the top of the fish (eg its dorsal
fin or a sharp convexity pointing to the upper right). Thus, when suddenly the second object
(eg a tree rotated by 50 degrees) replaces the first object at 104 ms after the onset of stimulus

41
1, the top-down gain-modulatory influences based on the location of attention might still
continue when initial and coarse shape and location information of (fragments of) the second
stimulus reaches V4; this will lead to the correct interpretation of the location of the new input
only when both objects have the same orientation regardless of superordinate or main axis
congruency (ie if this new feature on the upper right of the fixation cross is also located on
top, then it must be a tree). Indeed, because only 18 objects could appear as the second target
(and each object was seen many times), accumulating details about the shape of the new
feature – together with the interpretation of its coarse location – will often allow rejection of
all the incorrect responses. In contrast, when the second stimulus has a different picture-plane
orientation (eg a tree rotated by 140 degrees), then interpreting the new feature as lying on top
of the object, will interfere with the recognition process.
6.4 Other time-consuming and error-prone processes
Response competition is not the only time-consuming and error-prone process that might lead
to the observed behavioral dependence on image transformations. First, the statistical
properties of images of a certain category (eg face, dog, car, etc.) might allow easy or difficult
generalization performance (Jäkel et al 2007). For example, Vanucci and Viggiano (2000)
examined the effects of plane rotations on the identification of line-drawings of exemplars
from three categories (animals, vegetables, and inanimate objects). While a clear effect of
rotation on response time was found for animals (which have been seen usually in the up-right
orientation), no effect at all was found for vegetables (which have been seen in all orientations
before) and only partial effects for inanimate objects. Interestingly, the minimum amount of
visual information necessary to identify rotated stimuli also varied as a function of category.
42
Second, departures from a monotonic increase in reaction times (RTs) and/or error rates
with increasing spatial transformations have been observed, resulting from practice with
certain views of the same object, or of visually similar objects (Lawson and Humphreys 1998;
Tarr and Gauthier 1998).
Third, previous experiences with objects will lead to repetition priming effects (Schacter
1992). This unconscious or implicit form of memory refers to the fact that object recognition
is improved for repeated compared to new stimuli. Furthermore, repetition priming is shape-
specific, gradual and long-lasting, and reduced but not eliminated with changes in an object’s
exemplar (Vuilleumier et al 2002). Since Wiggs and Martin (1998) concluded that all changes
in physical attributes that are essential to the representation of object form do influence
perceptual priming, we conclude that this process could contribute to differences in RT in
sequential matching tasks. Note that neurophysiological manifestations of repetition priming
and familiarity can also explain asymmetries in similarity judgments (Op de Beeck et al
2003).
The result is that different processes might be used for different transformations. For
example, the results of Lawson et al (2000) suggest that compensation for plane rotation starts
relatively early in processing, before compensation for depth rotation has begun. First, plane-
rotated stimuli may be processed differently from upright stimuli because spatial relations
between features may be harder to extract for plane-disoriented views of familiar objects,
whereas local features may be analyzed equally efficiently at all plane rotations. Also, certain
perceptual attributes that can be extracted before the identification of an object (eg based on
low spatial frequencies; Bar 2003) could provide important information about the probable
orientation of the object in the plane, for instance, the orientation of any axes of symmetry, the
main axis of extension, and the likely base of the object. In contrast, these attributes may not

43
be as informative about the depth orientation of an object. Identifying objects rotated in depth
may depend on additional perceptual processing (if a more accurate representation is required
compared to canonical views) or prolonged memory retrieval (if, for example, only fragments
of foreshortened views could initially be identified since the bounding contour or outline is
not diagnostic; Lawson et al 2000). It is also quite likely that the shape of the parts of
foreshortened objects and the spatial relationships between them differ so radically from the
correct stored, view-specific object representations, that it takes longer to accumulate enough
evidence to rule out all the activated but incorrect candidates (see also Panis et al 2008a; Panis
and Wagemans 2008). Similarly, the finding that RTs to decide if two sequentially presented
shapes are identical except for changes in picture-plane orientation or size are sequentially
additive (Bundesen et al 1981) is also consistent with the idea that two sequential and
dissociable processes are involved, eg attentional selection of a spatial area of a certain size
(see also Cave and Kosslyn 1989) and the extraction of low spatial frequencies that contain
information about the probable orientation (see above).
6.4 Conclusion
It is perhaps not surprising that view- and exemplar-based theories do a better job in
explaining categorization data, since they store more information and therefore can convey
more information about the stimulus during a certain period in comparison to prototype-based
models. In contrast to the idea that categorization involves analog frame coordinate
transformations implemented by gain-modulation, we conclude that our results and other
findings are consistent with exemplar-based, view-specific accounts of recognition for
matching the input with stored representations when taking into account well established
processes such as accumulation of visual information, perceptual organization, attentional

44
selection, covert model selection, perceptual priming, response priming, and response
competition.

45
References
Bar M, 2003 “A cortical mechanism for triggering top-down facilitation in visual object recognition” Journal of Cognitive Neuroscience 15 600-609
Bar M, Kassam K S, Ghuman A S, Boshyan J, Schmid A M, Dale A M, Hämäläinen M S, Marinkovic K, Schacter D L, Rosen B R, Halgren E, 2006 “Top-down facilitation of visual recognition” Proceedings of the National Academy of Sciences of the U.S.A. 103 449 – 454
Barenholtz E, Tarr M J, 2008 “Visual judgment of similarity across shape transformations: Evidence for a compositional model of articulated objects” Acta Psychologica 128 331 – 338
Biederman I, 1987 “Recognition-by-components: A theory of human image understanding” Psychological Review 94 115 – 147
Bundesen C, Larsen A, Farrell J E, 1981 “Mental transformations of size and orientation”, in Attention and Performance Eds. J Long & A Baddeley (Hillsdale, NJ: Erlbaum) pp 279 – 294
Bundesen C, Larsen A, Farrell J E, 1983 “Visual apparent movement: Transformations of size and orientation” Perception 12 549 – 558
Cave K R, Kosslyn S M, 1989 “Varieties of size-specific visual selection” Journal of Experimental Psychology: General 118 148 – 164
Chen L, 1985 “Topological structure in the perception of apparent motion” Perception 14 197 – 208
Chen L, 2005 “The topological approach to perceptual organization” Visual Cognition 12 553 – 637
Cohen A L, Nosofsky R M, 2000 “An exemplar-retrieval model of speeded same-different judgments” Journal of Experimental Psychology: Human Perception and Performance 26 1549 – 1569
Coles M G H, Gratton G, Bashore T R, Eriksen C W, Donchin E, 1985 “A psychophysiological investigation of the continuous flow model of human information processing” Journal of Experimental Psychology: Human Perception and Performance 11 529 – 553
Connor C E, Brincat S L, Pasupathy A, 2007 “Transformation of shape information in the ventral visual pathway” Current Opinion in Neurobiology 17 140 – 147
Dale R, Kehoe C, Spivey M J, 2007 “Graded motor responses in the time course of categorizing exemplars” Memory & Cognition 35 15 – 28
D’Arcy Thompson W, 1942 On growth and form 2nd edition (Cambridge U.K.: Cambridge University Press Original edition from 1917)
De Baene W, Ons B, Wagemans J, Vogels R, 2008 “Effects of category learning on the stimulus selectivity of macaque inferior temporal neurons” Learning & Memory in press
De Baene W, Premereur E, Vogels R, 2007 “Properties of shape tuning of macaque inferior temporal neurons examined using Rapid Serial Visual Presentation” Journal of Neurophysiology 97 2900 – 2916
Demeyer M, Zaenen P, Wagemans J, 2007 “Low-level correlations between object properties and viewpoint can cause viewpoint-dependent object recognition” Spatial Vision 20 79 – 106

46
De Winter J, Wagemans J, 2004 “Contour-based object identification and segmentation: Stimuli, norms and data, and software tools” Behavior Research Methods, Instruments, & Computers 36 604 – 624
DiCarlo J J, Cox D D, 2007 “Untangling invariant object recognition” Trends in Cognitive Sciences 11 333 – 341
Edelman S, 1998 “Representation is representation of similarities” Behavioral and Brain Sciences 21 449 – 498
Edelman S, 1999 Representation and recognition in vision (Cambridge, MA: MIT Press)Edelman S, Intrator N, 2000 “(Coarse coding of shape fragments) + (Retinotopy) ≈
Representation of structure” Spatial Vision 13 255 – 264Eger E, Henson R N, Driver J, Dolan R J, 2006 “Mechanisms of top-down facilitation in
perception of visual objects studied by fMRI” Cerebral Cortex 17 2123 – 2133Eriksen C W, Schultz D W, 1979 “Information processing in visual search: A continuous flow
conception and experimental results” Perception & Psychophysics 25 249 – 263Gabroi D, Lisman J, 2003 “Recognition by top-down and bottom-up processing in cortex: The
control of selective attention” Journal of Neurophysiology 90 798 – 810Gauthier I, Palmeri T J, 2002 “Visual neurons: Categorization-based selectivity” Current
Biology 12 R282-R284Gauthier I, Tarr M J, 1997 “Orientation priming of novel shapes in the context of viewpoint-
dependent recognition” Perception 26 51 – 73Gillebert C R, Op de Beeck H P, Panis S,Wagemans J, 2008 “Subordinate categorization
enhances the neural- selectivity in the human object-selective cortex for fine shape differences” Journal of Cognitive Neuroscience in press
Graf M, 2002 Form, space and object: Geometrical transformations in object recognition and categorization (Berlin, Germany: Wissenschaftlicher Verlag Berlin)
Graf M, 2006 “Coordinate transformations in object recognition” Psychological Bulletin 132 920 – 945
Graf M, 2008 “Categorization and object shape”, in Understanding thinking. Volume II. Towards a theory of thinking: Structures, dynamics, genesis Eds B Glatzeder, A von Müller, V Goel (Berlin: Springer Verlag) in press
Graf M, Kaping D, Bülthoff H H, 2005 “Orientation -congruency effects for familiar objects: Coordinate transformations in object recognition” Psychological Science 16 214 – 221
Hahn U, Chater N, Richardson LB, 2003 “Similarity as transformation” Cognition 87 1 – 32Heekeren H R, Marrett S, Bandettini P A, Ungerleider L G, 2004 “A general mechanism for
perceptual decision-making in the human brain” Nature 431 859 – 862Hernández A, Zainos A, Romo R, 2002 “Temporal evolution of a decision-making process in
medial premotor cortex” Neuron 33 959 – 972Hillyard S A, Teder-Sälejärvi W A, Münte T F, 1998 “Temporal dynamics of early perceptual
processing” Current Opinion in Neurobiology 8 202 – 210Hochstein S, Ahissar M, 2002 “View from the top: Hierarchies and reverse hierarchies in the
visual system” Neuron 36 791 – 804Jäkel F, Schölkopf B, Wichmann F A, 2007 “Generalization and similarity in exemplar
models of categorization: Insights from machine learning” Psychonomic Bulletin and Review 15 256 – 271
Jolicoeur P, 1990 “Orientation-congruency effects on the identification of disoriented shapes” Journal of Experimental Psychology: Human Perception and Performance 16 351 – 364

47
Kayaert G, Biederman I, Op de Beeck H, Vogels R, 2005 “Tuning for shape dimensions in macaque inferior temporal cortex” European Journal of Neuroscience 22 212 – 224
Kruschke J K, 1992 “ALCOVE: An exemplar-based connectionist model of category learning” Psychological Review 99 22 – 44
Kukkonen H T, Foster D H, Wood J R, Wagemans J, Van Gool L, 1996 “Qualitative cues in the discrimination of affine-transformed minimal patterns” Perception 25 195 – 206
Lamberts K, 2000 “Information-accumulation theory of speeded categorization” Psychological Review 107 227 – 260
Larsen A, Bundesen C, 1978 “Size scaling in visual pattern recognition” Journal of Experimental Psychology: Human Perception and Performance 4 1 – 20
Larsen A, McIlhagga W, Bundesen C, 1999 “Visual pattern matching: Effects of size ratio, complexity, and similarity in simultaneous and successive matching” Psychological Research 62 280 – 288
Lawson R, 1999 “Achieving visual object constancy across plane rotation and depth rotation” Acta Psychologica 102 221 – 245
Lawson R, Humphreys G W, 1998 “View-specific effects of depth rotation and foreshortening on the initial recognition and priming of familiar objects” Perception & Psychophysics 60 1052 – 1066
Lawson R, Humphreys G W, Jolicoeur P, 2000 “The combined effects of plane disorientation and foreshortening on picture naming: One manipulation or two?” Journal of Experimental Psychology: Human Perception and Performance 26 568 – 581
Mark L S, Todd J T, 1985 “Describing perceptual information about human growth in terms of geometric invariants” Perception & Psychophysics 37 249 – 256
Mark L S, Todd J T, Shaw R E, 1981 “Perception of growth: A geometric analysis of how different styles of change are distinguished” Journal of Experimental Psychology: Human Perception and Performance 7 855 – 868
Markman A B, Gentner D, 1993a “Structural alignment during similarity comparisons” Cognitive Psychology 25 431 – 467
Markman A B, Gentner D, 1993b “Splitting the differences: A structural alignment view of similarity” Journal of Memory and Language 32 517 – 535
McKeeff T J, Tong F, 2007 “The timing of perceptual decisions for ambiguous face stimuli in the human ventral visual cortex” Cerebral Cortex 17 669 – 678
Medin D L, Schaffer M M, 1978 “Context theory of classification learning” Psychological Review 85 207 – 238
Mervis C B, Rosch E, 1981 “Categorization of natural objects” Annual Review of Psychology 32 89 – 115
Mozer M C, 2002 “Frames of reference in unilateral neglect and visual perception: A computational perspective” Psychological Review 109 156 – 185
Mruczek R E B, Sheinberg D L, 2007 “Activity of inferior temporal cortical neurons predicts recognition choice behavior and recognition time during visual search” The Journal of Neuroscience 27 2825 – 2836
Newell F N, Sheppard D M, Edelman S, Shapiro K L, 2005 “The interaction of shape- and location-based priming in object categorization: Evidence for a hybrid “what+where” representation stage” Vision Research 45 2065 – 2080
Nosofsky R M, 1986 “Attention, similarity, and the identification-categorization relationship” Journal of Experimental Psychology: General 115 39 – 57

48
Nosofsky R M, 1988 “Exemplar-based accounts of relations between classification, recognition, and typicality” Journal of Experimental Psychology: Learning, Memory, and Cognition 14 700 – 708
Nosofsky R M, Palmeri T J, 1997a “An exemplar-based random walk model of speeded classification” Psychological Review 104 266 – 300
Nosofsky R M, Palmeri T J, 1997b “Comparing exemplar-retrieval and decision-bound models of speeded perceptual classification” Perception & Psychophysics 59 1027 – 1048
Nosofsky R M, Zaki S R, 2002 “Exemplar and prototype models revisited: Response strategies, selective attention, and stimulus generalization” Journal of Experimental Psychology: Learning, Memory, and Cognition 28 924 – 940
Op de Beeck H P, Béatse E, Wagemans J, Sunaert S, Van Hecke P, 2000 “The representation of shape in the context of visual object categorisation tasks” Neuroimage 12 28 – 40
Op de Beeck H P, Wagemans J, 2001 “Visual object categorization at distinct levels of abstraction: a new stimulus set” Perception 30 1337 – 1361
Op de Beeck H P, Wagemans J, Vogels R, 2001 “Inferotemporal neurons represent low-dimensional configurations of parameterized shapes” Nature Neuroscience 4 1244 – 1252
Op de Beeck H P, Wagemans J, Vogels R, 2003 “Asymmetries in stimulus comparisons by monkey and man” Current Biology 13 1803 – 1808
Op de Beeck H P, Wagemans J, Vogels R, 2008 “The representation of perceived shape similarity and its role for category learning in monkeys: A modeling study” Vision Research 48 598 – 610
O’Regan J K, 1992 “Solving the “real” mysteries of visual perception: The world as an outside memory” Canadian Journal of Psychology 46 461 – 488
Palmeri T J, Gauthier I, 2004 “Visual object understanding” Nature Reviews Neuroscience 5 291 – 304
Palmeri T J, Nosofsky R M, 2001 “Central tendencies, extreme points, and prototype enhancement effects in ill-defined perceptual categorization” The Quarterly Journal of Experimental Psychology 54A 197 – 235
Palmeri T J, Wong A C-N, Gauthier I, 2004 “Computational approaches to the development of perceptual expertise” Trends in Cognitive Sciences 8 378 – 386
Panis S, De Winter J, Vandekerckhove J, Wagemans J, 2008a “Identification of everyday objects on the basis of fragmented versions of outlines” Perception 37 271 – 289
Panis S, Vangeneugden J, Op de Beeck H, Wagemans J, 2008b “The representation of subordinate shape similarity in human occipitotemporal cortex” Journal of Vision, in press
Panis S, Wagemans J, 2008 “Time-course contingencies in perceptual organization and identification of fragmented object outlines” Journal of Experimental Psychology: Human Perception and Performance, in press
Perrett D I, Oram M W, Ashbridge E, 1998 “Evidence accumulation in cell populations responsive to faces: an account of generalization of recognition without mental transformations” Cognition 67 111 – 145
Pittenger J B, Shaw R E, 1975 “Aging faces as viscal elastic events: Implications for a theory of nonrigid shape perception” Journal of Experimental Psychology: Human Perception and Performance 1 374 – 382

49
Pittenger J B, Todd J T, 1983 “Perception of growth from changes in body proportions” Journal of Experimental Psychology: Human Perception and Performance 9 945 – 954
Poggio T, Bizzi E, 2004 “Generalization in vision and motor control” Nature 431 768 – 774Rorie A E, Newsome W T, 2005 “A general mechanism for decision-making in the human
brain?” Trends in Cognitive Sciences 9 41 – 43Rybak I A, Gusakova V I, Golovan A V, Podladchikova L N, Shevtsova N A, 1998 “A model
of attention-guided visual perception and recognition” Vision Research 38 2387 – 2400 Salinas E, Sejnowski T, 2001 “Gain modulation in the central nervous system: Where
behavior, neurophysiology, and computation meet” The Neuroscientist 7 430 – 440Schacter D L, 1992 “Priming and multiple memory systems: Perceptual mechanisms of
implicit memory” Journal of Cognitive Neuroscience 4 244 – 256Schyns P G, 1997 “Categories and percepts: A bi-directional framework for categorization”
Trends in Cognitive Sciences 1 183 – 189Schyns P G, 1998 “Diagnostic recognition: task constraints, object information, and their
interaction” Cognition 67 147 – 179Schyns P G, Rodet L, 1997 “Categorization creates functional features” Journal of
Experimental Psychology: Learning, Memory, and Cognition 23 681 – 696Shepard R N, Cooper L A, 1982 Mental images and their transformations (Cambridge, MA:
MIT Press)Smith J D, Minda J P, 2001 “Journey to the center of the category: The dissociation in
amnesia between categorization and recognition” Journal of Experimental Psychology: Learning, Memory, and Cognition 27 984 – 1002
Snodgrass J G, Vanderwart M, 1980 “A standardized set of 260 pictures: norms for name agreement, image agreement, familiarity, and visual complexity” Journal of Experimental Psychology: Human Learning and Memory 6 174 – 215
Spivey M J, Dale R, 2006 “Continuous dynamics in real-time cognition” Current Directions in Psychological Science 15 207 – 211
Sugase Y, Yamane S, Ueno S, Kawano K, 1999 “Global and fine information coded by single neurons in the temporal visual cortex” Nature 400 869-873
Tarr M J, 1995 “Rotating objects to recognize them: A case study on the role of viewpoint dependency in the recognition of three-dimensional objects” Psychonomic Bulletin & Review 2 55 – 82
Tarr M J, Bülthoff H H, 1998 “Image-based object recognition in man, monkey and machine” Cognition 67 1 – 20
Tarr M J, Gauthier I, 1998 “Do viewpoint-dependent mechanisms generalize across members of a class?” Cognition 67 73 – 110
Tarr M J, Williams P, Hayward W G, Gauthier I, 1998 “Three-dimensional object recognition is viewpoint dependent” Nature Neuroscience 1 275 – 277
Todd J T, Chen L, Norman J F, 1998 “On the relative salience of Euclidean, affine, and topological structure for 3-D form discrimination” Perception 27 273 – 282
Trick L M, Enns J T, 1997 “Clusters precede shapes in perceptual organization” Psychological Science 8 124 – 129
Ullman S, 1989 “Aligning pictorial descriptions: An approach to object recognition” Cognition 32 193 – 254
Ullman S, 1998 “Three-dimensional object recognition based on the combination of views” Cognition 67 21 – 44

50
Van Gool L, Moons T, Pauwels E, Wagemans J, 1994 “Invariance from the Euclidean geometer’s perspective” Perception 23 547 – 561
Vanrie J, Béatse E, Wagemans J, Sunaert S, Van Hecke P, 2002 “Mental rotation versus invariant features in object perception from different viewpoints: An fMRI study” Neuropsychologia 40 917 – 930
Vanrie J, Willems B, Wagemans J, 2001 “Multiple routes to object matching from different viewpoints: Mental rotation versus invariant features” Perception 30 1047 – 1056
Vanucci M, Viggiano M P, 2000 “Category effects on the processing of plane-rotated objects” Perception 29 287 – 302
Vogels R, 1999 “Categorization of complex visual images by rhesus monkeys: Part 2. Single-cell study” European Journal of Neuroscience 11 1239 – 1255
Vuilleumier P, Henson R N, Driver J, Dolan R J, 2002 “Multiple levels of visual object constancy revealed by event-related fMRI of repetition priming” Nature Neuroscience 5 491 – 499
Wagemans J, De Winter J, Op de Beeck H, Ploeger A, Beckers T, Vanroose P, 2008 “Identification of everyday objects on the basis of silhouette and outline versions” Perception 37 207 – 244
Wagemans J, Lamote C, Van Gool L, 1997 “Shape equivalence under perspective and projective transformations” Psychonomic Bulletin & Review 4 248 – 253
Wagemans J, Van Gool L, Lamote C, 1996 “The visual system’s measurement of invariants need not itself be invariant” Psychological Science 7 232 – 236
Wagemans J, Van Gool L, Lamote C, Foster D H, 2000 “Minimal information to determine affine shape equivalence” Journal of Experimental Psychology: Human Perception and Performance 26 443 – 468
Weiss Y, Edelman S, 1995 “Representation of similarity as a goal of early visual processing” Computation in Neural Systems 6 19 – 41
Wiggs C L, Martin A, 1998 “Properties and mechanisms of perceptual priming” Current Opinion in Neurobiology 8 227 – 233
Willems B, Wagemans J, 2001 “Matching multi-component objects from different viewpoints: Mental rotation as normalization?” Journal of Experimental Psychology: Human Perception and Performance 27 1090 – 1115
Wyss R, König P, Verschure P F M J, 2003 “Invariant representations of visual patterns in a temporal population code” Proceedings of the National Academy of Sciences of the USA 100 324 – 329
Zaki S R, Nosofsky R M, Stanton R D, Cohen A L, 2003 “Prototype and exemplar accounts of category learning and attentional allocation: A reassessment” Journal of Experimental Psychology: Learning, Memory, and Cognition 29 1160 – 1173

51
Acknowledgements
This research was supported by a research grant from the Fund for Scientific Research (FWO
Flanders, G.0281.06). This study is also part of larger research programs with financial
support from the University Research Council (GOA/2005/03-TBA and IDO/02/004). We
want to thank Wouter De Baene, Céline Gillebert, Bart Ons, Hans Op de Beeck, Gert Storms,
Wolf Vanpaemel, and Rufin Vogels, for interesting discussions regarding this study. We also
want to thank one anonymous reviewer and Rebecca Lawson for interesting suggestions
regarding a previous version of this manuscript.

52
Figure Captions
Figure 1. Two-dimensional MDS solutions for four example categories. Circles are drawn
around the four selected exemplars used to create morphing sequences (see Figure 3). (A)
Birds. (B) Airplanes. (C) Vases. (D) Chairs. Although the MDS solutions for the outlines are
shown, the shapes are drawn as silhouettes for clarity.
Figure 2. Stimulus illustration (column 1), average RT in distance-0 trials (column 2) and
rated typicality (column 3) of all exemplars. In column 1, numbers within the selected
extreme exemplars are their ranks for “isolatedness”. These exemplars could lie alone in a
visually isolated region (*) or together with another original exemplar (**). In column 2,
lowest (black) and highest (white) reaction times are indicated together with local minima
(grey). In column 3, highest (black) and lowest (white) typicality ratings are indicated
together with local maxima (grey). The inset on the bottom shows the six morphing sequences
and the four extreme (white squares) and 12 morphed exemplars (black squares). Thus, both
central horizontal and both central vertical lines do not correspond to a morphing sequence.
Figure 3. Rated similarity between two exemplars as a function of the transformational
distance between them, averaged across categories, sequences, and trial types. In this and
subsequent graphs the error bars represent the standard error of the mean.
Figure 4. Mean RT for correct same-category trials, as a function of transformational distance
and session.

53
Figure 5. Error rate as a function of transformational distance for the same-category trials.
Errors increase systematically when people have to respond ‘yes’ to increasing shape
differences.
Figure 6. (left) Scatter plots of the predicted and observed transformation times (TT) of 22
subjects for each of three distances (13, 24, and 14). (right) Scatter plots of the predicted and
observed categorization times of 66 morphing sequences for each of three distances (13, 24,
and 14; both directions). Different symbols indicate different categories.
Figure 7. Rated typicality for exemplars at each position in a sequence, averaged across
categories, morphing sequences, and trial types. Extreme exemplars occupy the first and
fourth positions; morphed exemplars occupy the second and third positions. Note that the
average typicality for position 1 and 4 differs because only one direction of positions in a
morphing sequence was used (ie 1 – 2 – 3 – 4, or 4 – 3 – 2 – 1).
Figure 8. Positions of the four extreme exemplars (white) and the morphed exemplars (black)
when stimuli are sorted from low to high typicality. Numbers on top correspond to the rank of
the extreme exemplars in Figure 2.

54
Figures
Figure 1

55
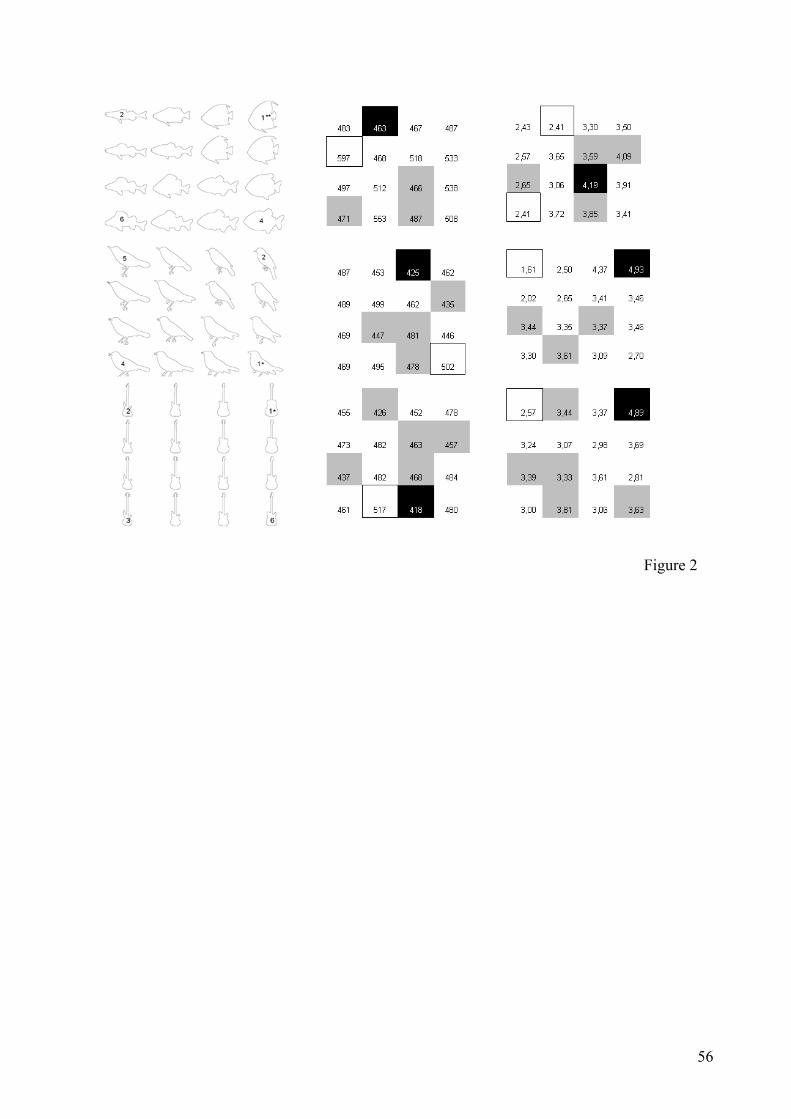
56
Figure 2

57

58
Figure 2 (cont.)
Figure 3

59
Figure 4

60
Figure 5

61
Figure 6

62
Figure 7

63
Figure 8


![Optimizing parameters for similarity-based spatial matching · Spatial data matching [LM04] is a branch of data matching where the data being match-ed is spatial. Spatial data has](https://img.pdfslide.us/doc/110x75/5d67a0f788c993660d8b7631/optimizing-parameters-for-similarity-based-spatial-spatial-data-matching-lm04.jpg)