Embed Size (px)
Citation preview

Page 1 of 20
Marketing 2101. Debbie Campbell. Final Project. 6/27/14
SIM SIDHU
Ryan Smith Fagan
Kuldeep Naresh Shah
Zachary Shumar
Simerjot Sidhu

Page 2 of 20
TABLE OF CONTENTS
Section 1.1
Executive Overview ………………….………………………………………….……….3
Executive Summary……………………………………………………………………...4
Simulation Experience…………………………………………………………………..4
Section 2.1
Company Name……………………………………………….…………………………5
Mission Statement…………………………………….…………………………………5
Objectives………………………………………………….……………………………..5
Tagline…………………………………………………….………………………….…..6
Brand Name………………………………………………………………………….…..6
Target Market……………………………………………………………….……….…..6
Positioning Statement………………………………………………………………....…6
SWOT Analysis……………..…………………………………………...........................7
Section 2.2
Decision Periods………………………………………………………………....……….7
Decision Period 1………………………………………………………………....7
Decision Period 2………………………………………………………………....8
Decision Period 3………………………………………………………………....9
Decision Period 4………………………………………………………………....9
Decision Period 5………………………………………………………………...10
Decision Period 6………………………………………………………………...10
Decision Period 7………………………………………………………………...11
Decision Period 8………………………………………………………………...12
Decision Period 9………………………………………………………………...12
Decision Period 10……………….…………..…………………………………..13
Decision Period 11……………….……………………………………………....13
Integrated Communications Marketing Plan…………………………………...….15
Section 3.1
Reflective Summaries……………………………………………………………............21

Page 3 of 20
Section 1.1
Executive Overview
This report will go in depth of the “New Shoes Simulation” that our company “Sim Sidhu” was a
part of. The “New Shoes Simulation” is a computer based simulation of a shoe which focuses on
the four P’s of marketing; that uses the basic process of market planning to give students an
opportunity to apply their recently acquired marketing skills in real life situations where they and
a small group of students will: (Following content can also be found in NewShoes Intro PPoint)
Design a simple marketing plan
Use basic marketing research
Experience dynamic competition
Learn about group decision-making
Understand financial implications
Get comfortable with ambiguity
The four P’s; Product, Price, Promotion, Place, will play a very important part as further
decisions will be explained in section 2.2.
Players will also come in contact with multiple markets which have different needs and wants.
The two regions are Home and Domestic. Further continuity of the simulation will open up the
foreign market. Contract bids will also be given where each team has an opportunity to bid
against each other to win for store brands. All competitors will start off in the same place where
they will have an option to sell to the home and domestic regions or both. Market Research can
be bought and will give insight about the decisions made by competitors along with knowing the
Customer Satisfactions.
There are many decisions that can be changed each year which include: Price, Consumer
Advertising, Consumer Sales Promotion, Personal Selling, Dealer Sales Promotion, Product
Development and much more. There are also various amounts of tools that will guide the group
through the decision process which include: Income Statement, Market Share, Breakeven
Analysis and Return on Sales results.
Performance will be based upon: (Following content can also be found in NewShoes Intro
PPoint)
Profit
Return on Sales
Market Share
Customer Satisfaction
Page 4 of 20
Section 1.1
Executive Summary
Sim Sidhu presents an 11 year analysis of the company. This report will be discussing all the
marketing concepts and strategies used to make the simulation as smooth as possible. Sim Sidhu
is based out of Philadelphia, Pennsylvania. We have made superior outcomes due to our Product
Development and much more. The following section labeled as Section 2.1 will include the
Mission Statement, Overall Objectives, the Brand/Company name and the explanations of how
we chose the following materials. Following these items will contain our Positing Statement,
Logo, Tagline, Target Market and SWOT as well. Succeeding this information will include a
depth description of all decisions made for each decision period. Ending Section 2.1 will include
our Integrated Marketing Communication Plan which will exhibit all creative techniques that our
company will use.
In Section 3.1, each team member will discuss their experience they had with the simulation and
explain how it helped them to understand the concept of Marketing.
Simulation Experience
The actual NewShoes Simulation was a fantastic experience for all students to familiarize
themselves with the basic understanding of marketing so that they can run a shoe company
proficiently. Each team was supposed to make a decision every other day which would resemble
decisions made every year. These decisions would either impact your company in a negative way
or positive way.
Many things can be learned from the Simulation that would consider this a “real life” game. One
thing is that, no matter how negative your company goes, there is always a way to make profit.
Another thing is that, don’t always rely on one market, other markets might be more beneficial
towards the product that your company is trying to sell.
Consumer Promotions and Advertising are two main components of attracting new consumers.
These added with the Price, Dealer Promotions, and Product Development should earn your
company profit throughout the years. Competition may be stiff so buying Market Research
should allow your company to make decisions based on the competitive team’s information.
Market Share will also increase as more of your product is sold.
Customer Satisfaction is very important; with a low customer satisfaction, sales tend to decrease
or linger in the same area as before. If the company has a high customer satisfaction, those
consumers will always return to buy more making increases on profit. Also with a higher rating,
the price of the product can be set higher, so more profit can be made with increases on the
return on sales.

Page 5 of 20
Section 2.1
Company Name
“Sim Sidhu”
Like most footwear companies, two syllables names are common in our generation. A name that
cannot be easily associated with the statement: “I always hear that name”. Our company name is
genuinely unique since it was never heard of.
Our logo consists of two S’s that are attached to show our relationship value with our customers.
A 3 pointed crown is placed to show the value of this relation and how it will always be
respected. Around the S’s is a royal wreath which represents our highest quality and how we will
perfect our product that will be bought by our loyal customers.
Mission Statement
“Our mission is to craft premium footwear to be recognized globally for the
highest quality and class”
Our mission as stated was made to show our consumers that our product will be known for its
premier quality and how it represents them in a higher standing of class. Everything from the
stitching to the vamp of the dress shoe will be hand crafted to precision. Our shoe will be known
across the globe for its remarkable shoe design. Customers can know walk with pride as they
know that their dress shoe came from a company that represents class, excellence and style.
Objectives
Design and market the premium dress shoe
Create a brand that is associated with quality and class
To support underprivileged youth through the “Sim Sidhu Dress to Impress Charity”
Our objectives were selected based upon our mission statement. We want to create and then
market the ultimate dress shoe for professional and casual wear; the perfect shoe, for any man.
Our product development rating was ranked among the highest clearly stating how our company
and brand will be associated with the highest quality and class. Lastly, we support the
underprivileged youth through our charity event called “Sim Sidhu Dress to Impress Charity”
where our customers can come and donate funds to the youth public who are dressed up with
professional clothing. It consists of a “Fun-Run”, as well as numerous other playful activities in
which our customers can participate in as well. These funds are solely used to further provide

Page 6 of 20
any kinds of resources that might assist these children now and in the further as well in various
charities.
Tagline
“Class, Excellence, Style”
Like our Mission Statement, our tagline is to show our consumers their importance in our
company. These 3 qualities will be pointed out if a consumer buys our product. Our dress shoe
makes the consumer experience these qualities. One should be proud while wearing such a
superior dress shoes.
Brand Name
“Series One”
Our Brand name is “Series One”. The name itself is simple and regarded with a high standard to
compete in a competitive market. The short version of the name is “S1”. The logo is a shield that
is supported by its wings. The shield itself is a sign of royalty and power. Inside is a 3 pointed
crown which represents the relationship the company has with its customers and how it will
always respected. Below the crown in the short version of Series One “S1” which shows that this
Brand will always respect the Consumer as a buyer as we make them the highest quality shoe.
Target Market
Upper Middle and upper class men globally are primarily targeted. These consumers should be
looking for dress shoes that can be worn at social events and professional events. These shoes are
socially acceptable as business footwear. High level corporate shoe for people who are looking
for durability and excellent product development.
Positioning Statement
“Quality Matters: Finest materials for the finest you”

Page 7 of 20
When thinking of a phrase that our customers should remember our company, one word defined
it over and over again, Quality. Why would someone by a shoe that will not hold up in in the
future. Our mission is quality and that is one thing should know remember us by.
SWOT Analysis
Strengths: High Product Development
High Customer Satisfaction
Market Share in Foreign Market
Expanded into Foreign Market
Superior Quality
Weaknesses: Past Decisions concerning high prices
Initial Cumulative Net Profit
Opportunities: Market Share in every Market
Growing Foreign Market
Advertising more, more consumers
Threats: New Competitors
Decrease in Foreign Market
Losing Market Share to Competitors
Undercuts
Decision Periods
Decision Period 1
This was our first actual decision that counted. We strategy we used at first was “Value-Plus
Pricing”. We were doing this because we were charging a higher price than the Cost of Goods
Sold. We did this because the shoe has an added “value” associated above the actual shoe
product. Since this was the first decision we did not know who our competitors were or what
price they have used to sell their product. We placed our Home Market Price at $125 because
Region Details Home Domestic
Price $125 $100
Advertising $2,000,000 $750,000
Consumer Promotions $0 $0
Dealer Promotions $1,000,000 $500,000
Sales People 10 7
Product Development $1,000,000

Page 8 of 20
dress shoes normally cost around there. We were going to set a higher price but it had
consequences if higher prices were set. We wanted to start out strong and get our name out there
so we made Advertising $2,000,000 so more people would see our commercials and such visit
our stores to buy the product. We didn’t give Consumer Promotions as that would just make this
shoe not as valued. We gave $1,000,000 to dealers as well, with 10 Sales People. Our purpose in
the home market was to hit hard and gain most of the market share as fast as possible. For
Domestic, our approach changed, we made the shoe only $100 dollars while spending less to see
what would happen. Our Product Development for this Period was $1,000,000.
Our total sales reached to only 43,940 with an overall 47.5% Customer Satisfaction which was
severely lower than all the other teams. Our Net Profit reached $-3,383,643 which was
something we could not really understand what had happened. Our COGS was also lower than
other teams at the amount of $1,660,493. Our strategy had become weak and we knew we were
competing with teams who had lower prices which made it extremely difficult to earn any profit.
Our market share in the Home Market was 3.7%, while in the Domestic, it was 3.8%. Overall,
first year of the company always takes a huge hit. Plan to change strategy and focus on the next
year.
Decision Period 2
This second year, Our company, Sim Sidhu decided on making an increase in our Product
Development by a massive $1,000,000 from last year totaling $2,000,000. We really wanted to
build and spend more on the actual shoe so it is hands on with the quality of the shoe. Both the
Price in the Home Market and Domestic Market was decreased by $5 so we could hopefully
make back all the profit we had lost in year one. We also wanted to increase the level of
Customer Satisfaction with these Prices. We also decreased Advertising because the company
was trying to save money this year. We kept Consumer Promotions at $0 since we wanted to
keep the shoe valued. We lost less in Domestic so we changed the Sales People from 10 to 6
with only $300,000 in Dealer Promotions. We wanted to get back in the home market a little so
we increased Dealer Promotions by $300,000 from last year while keeping the initial Sales
People the same amount
As a result, we sold 78,035 total units with a 51.8 Overall Customer Satisfaction. Our Net Profit
was $-1,145,125 for this year making our Cumulative Net Profit $-4,528,768. Our goal was to
increase our Market Share value in both markets which has happened. 6.1% in Home Market
and 4.3% in Domestic Market. Overall, our strategy of going after the Home Market with an
increase in Dealer Promotions and decreased Price had brought our Market Share up. We now
needed to focus on both markets and increase Profit in both while not having negative return on
sales.
Region Details Home Domestic
Price $120 $95
Advertising $1,500,000 $500,000
Consumer Promotions $0 $0
Dealer Promotions $1,300,000 $300,000
Sales People 10 6
Product Development $2,000,000

Page 9 of 20
Decision Period 3
For Period number 3, we kept the prices same as Period 2 while going after the Domestic Market
more this Period. The reason for this is we still wanted to keep the value of the shoe, a point of
buying it from us. For the first time in 3 years, we also gave out $250,000 Consumer Promotions
in both markets to see if more consumers were willing to buy our product. We also decreased
Dealer Promotions in Home Market while increasing them in the Domestic Market. Our strategy
this round was to figure out a way to balance both markets and not go as negative as last time.
The results showed that we sold 88,012 total units with a Customer Satisfaction rating of 51.9%.
Our rating went up by only .1% which does not help. We made a Net Profit of $-665,140 and a
Cumulative Net Profit of -5,193,908. At this point, nothing is really working, out strategies are
not performing as well due to the competition and their low prices. Our Cumulative Return on
Marketing was a huge -33.7. We also lost Market Sale in Home Market and it went down to
4.3% while we slightly gained some share in the Domestic Market making it a total of 6.2%. So
far, strategies are not working, we have to change the strategy and overcome the negative
Cumulative Net Profit.
Decision Period 4
For Period 4, the Foreign Market open, this was our chance to make all our money back. For the
Foreign Price, we made the Price $125 since we wanted to make a bigger amount of profit from
the foreign market. We were also wary about the other amounts of Promotions so we made them
around the same amount as the Home and Domestic Market. We kept the same prices in the
Home and Domestic Market since we wanted to focus on the Foreign Market for this round. The
Domestic Market was our second concern following the Foreign Market. This is why we kept
everything in the Domestic Market the same except the Dealer Promotions and Sales People.
Region Details Home Domestic
Price $120 $95
Advertising $750,000 $1,250,000
Consumer Promotions $250,000 $250,000
Dealer Promotions $500,000 $725,000
Sales People 7 8
Product Development $2,000,000
Region Details Home Domestic Foreign
Price $120 $95 $125
Advertising $650,000 $1,200,00 $500,000
Consumer Promotions $100,000 $250,000 $100,000
Dealer Promotions $500,000 $100,000 $750,000
Sales People 6 10 5
Product Development $2,000,000

Page 10 of 20
As a result of these decisions, we sold 118,641 total units with an Overall Customer Satisfaction
of 58.1. Our Net Profit was $-761,675 making our Cumulative Net Profit $-5,955,583. Our
strategy once again was a disappointment. Our strategy to make our profit back in the Foreign
Market did not work. Yes we had a 50.0% Customer Satisfaction in the Foreign Market but we
only had 2.4% of the whole market. Our competitor in the Foreign Market had a lower Price,
more money spent on Advertising, Consumer Promotions, and Dealer Promotions. They owned
the whole market with a 97.6% Market Share. We now changed our strategy from a Dynamic
Pricing to Competition-based Pricing.
Decision Period 5
Competition-Based Pricing is what our company is going to go. We are going to undercut our
competition in the Foreign Market to have the upper advantage. We also increase Advertising a
lot from last period. We are taking a huge risk; the competitors price needs to be higher than ours
in the Foreign Market, from this point on, all pricing changes will be based of Competition-
Based Pricing.
The results were incredibly delightful; we made 267,264 Total Unit Sales, with an Overall
Customer Satisfaction of 73.5%, which ranked 4th in the Simulation. Our Net Profit was
$10,096,094 with a Cumulative Net Profit of $4,140,511. Our Product Level Rank was also
ranked number 1 in the simulation. Our COGS consisted of $6,788,506 which was considerably
higher than all the other teams. Our Return on Market was 133.4 with a Cumulative Share
Market of 14.5%. Our Foreign Market Customer Satisfaction was 78.6% while having 64.7% of
the Foreign Market Share. This period was beneficial since this is our first positive net profit
within the last 5 years.
Decision Period 6
Region Details Home Domestic Foreign
Price $120 $90 $100
Advertising $400,000 $750,000 $1,250,000
Consumer Promotions $200,000 $250,000 $500,000
Dealer Promotions $200,000 $1,000,000 $150,000
Sales People 6 6 7
Product Development $ 2,000,000
Region Details Home Domestic Foreign
Price $105 $90 $94
Advertising $375,000 $800,000 $2,000,000
Consumer Promotions $225,000 $325,000 $750,000
Dealer Promotions $175,000 $1,100,000 $2,000,000
Sales People 3 7 10
Product Development $2,000,000

Page 11 of 20
For Period 6, we want to compete with teams in the Home Market, so we lowered our price to
$105 while dropping everything else in the Home Market category a tad bit. We kept the
Domestic Market the same with just a little tweaks to the Promotions and such. Foreign Market
is where we wanted to grow a lot. So this to occur, we lowered the price by $6 making the Price
$94. We raised everything else tremendously so we have the upper advantage on the Foreign
Market. Our strategy is to fore say, take over the Foreign Market and have the highest Market
Share Value.
As the results showed up, most of the data did not show up due to the fact that had to buy the
research to figure out most things. However it states that in the Foreign Market that our
Customer Satisfaction rating was 81% and that we owned 44% of the Foreign Market. Our
Cumulative Profit was $6,159,630, slightly less than our competition in the Foreign Market. For
the Domestic Market, our Cumulative Profit was $5,595,225 with a 45.6% Customer Satisfaction
Rating when we owned 1.2% of the Market. The Domestic Market was our lowest Market where
we only had 1.2% of the Market. Home Market consisted of $1,334,245 as the Cumulative Profit
while we owned 6% of the Market with a 64.4% Customer Satisfaction Rating. Our Strategy of
having the most Market Share Value in the Foreign Market was successful.
Decision Period 7
For Period 7, our goal was to increase our profits in each Market. We kept the same prices but
increased everything else except for Sales People the Home Market and Foreign Market. Our
goal is to steal some consumers of other consumers so they join us. This is why we have
increased more Promotions and Advertising. We also want to increase our Customer Satisfaction
in all sectors. Also Product Development is maxed out because we want to make the best shoe
for our customers.
As results of these decisions, we ranked number one in Customer Satisfaction and number two in
Return on Sales. Our Total Revenue was $37,252,637. We also ranked number 1 in Product
Development. Our Cumulative Profit in the Foreign Market was $14,784,452 with an 87.7%
Customer Satisfaction Rating. We also gained Market Share Value making the total amount at
57.7%. Domestic Market had a Cumulative Profit of $10,444,247 with a 75 Customer
Satisfaction rating. Also with the Home Market, Customer Satisfaction also increased to the
amount 71.2%. We were successful in our strategy to increase our Customer Satisfaction in all
markets.
Region Details Home Domestic Foreign
Price $105 $90 $94
Advertising $425,000 $1,000,000 $2,050,000
Consumer Promotions $400,000 $450,000 $800,000
Dealer Promotions $300,000 $1,000,000 $2,100,000
Sales People 2 8 9
Product Development $2,000,000

Page 12 of 20
Decision Period 8
For Period 8 we wanted to have more Customer Satisfaction; based on Competition-Based
Pricing, we lower our Price in the Home Market, $105 to $95; also in the Domestic Marker as
well, $90 to $85. We kept the Price of the Foreign Marker the same because our company was
doing well in the Foreign Market. Everything else was adjusted according to the Price. We are a
solely making decisions based on our competition in each market. In the Domestic Market,
Advertising changed from $1,000,000 to $900,000 while we increased Consumer Promotions
from $450,000 to $650,000. We also increased Dealer Promotions by $300,000.
As the results of these decisions, our Total Revenue was $46,215,965 while we owned a
cumulative 10.8% of the Total Market Share. Like last Period, our Product Development Rank is
ranked number 2. This Period we also received the rank of 1in Overall Customer Satisfaction.
Our Customer Satisfaction in the Domestic Market was 85.1% while we owned 15.9% of the
Domestic Market Share. In the Foreign Market our Cumulative Profit was $28,808,868 with the
Customer Satisfaction of 91.3% while we owned 44.8% of the Market. In the Home Market we
had an 88% Customer Satisfaction Rating. We successfully received the rank of number 1 of
Customer Satisfaction which was our goal.
Decision Period 9
For Period 9, we only changed the Home Marker Price from $95 to $94. We also increased the
Foreign Market Prince by .50 cents. Our strategy is to make more profit in every market. This is
why we increased the amount of Advertising in all the markets along with the Consumer
Promotions except in the Foreign Market were we decrease it to save a little bit of money.
We were successful in our goal of making more profit overall in the Markets. Our Total Revenue
was $49,469,216 while we own 12.2% of all the Total Market Share in all the Markets. Our
Product Development was ranked 2nd Overall. In the Home Market our Cumulative Profit was
Region Details Home Domestic Foreign
Price $95 $85 $94
Advertising $400,000 $900,000 $2,000,000
Consumer Promotions $425,000 $650,000 $750,000
Dealer Promotions $200,000 $750,000 $2,000,000
Sales People 3 6 10
Product Development $2,000,000
Region Details Home Domestic Foreign
Price $94 $85 $94.50
Advertising $600,000 $1,250,000 $2,050,000
Consumer Promotions $500,000 $1,250,000 $650,000
Dealer Promotions $150,000 $1,250,000 $2,050,000
Sales People 1 8 10
Product Development $2,000,000

Page 13 of 20
$14,791,093 with 86.2% Customer Satisfaction while owning 10.5% of the Market. In the
Domestic Market we had a Cumulative Profit of $24,253,951 with an 82% Customer Satisfaction
Rating while ranking 2nd in the Market Share with 17.7% under our company. Lastly in the
Foreign Market, our Cumulative Profit was $43,955,991 with the Customer Satisfaction of
87.6% while owning 42.7% of the market. Our strategy was successful since we made more
profit this round was well.
Decision 10
For Decision Period 10, we really wanted to make more revenue and become number one in
everything. We were competing with the company that ranked one right now. To do this, we
lowered the prices and keeping spending on everything mostly the same. For the Home Market
we lowered the Price from $94 to $92. Our other sections were primarily the same as in Period 9.
For Domestic Market, we lowered the Price from $85 to $83. Other decision reflected based
upon last year’s decisions. Lastly we changed the Price in the Foreign Market $94.50 to $92 to
increase sales. Product Development was still maxed to show that we offer the best shoe.
As the results of these decisions, we rank number one in Return on Sales Rank, Overall
Customer Satisfaction, as well as Product Development Rank. We rank second in Overall
Weighted Score. Our Total Revenue is $57,401,118 which is the highest overall. We have a
91.4% Customer Satisfaction in the Home Period, 86.9% in Domestic Market and the highest
ever 93.2% in the Foreign Market. Overall, we made more revenue as that was our goal this
Period.
Decision 11
Region Details Home Domestic Foreign
Price $92 $83 $92
Advertising $650,000 $1,150,000 $2,000,000
Consumer Promotions $600,000 $1,750000 $550,000
Dealer Promotions $50,000 $1,000,000 $2,000,000
Sales People 1 8 10
Product Development $2,000,000
Region Details Home Domestic Foreign
Price $92 $83 $92.50
Advertising $651,000 $1,000,000 $2,001,000
Consumer Promotions $601,000 $1,765,000 $575,000
Dealer Promotions $50,000 $975,000 $2,001,000
Sales People 1 7 10
Product Development $0

Page 14 of 20
We really tried to keep everything the same from decision 10, except for Product Development
which was made to zero because we didn’t want to have more than 4-5 versions of the shoe, we
also thought that our competition would lower theirs too.
As for the results of these decisions, Total Unit Sales were 621,000 with a Total Net Profit (in
Decision 11) as $36,026,382 with a 22.95% Market Share Value. In the Home Market we made a
Net Profit of $5,642,082 with a Customer Satisfaction of 91.3%. In the Domestic Market we
made a Net Profit of $975,000 with a Customer Satisfaction of 86.8%. We made most of our Net
Profit in the Foreign Market with $22,010,800; along with a 92.4% on Customer Satisfaction.
Another thing that was pointed out was that SWAG was not our only competitor; U’Niche was
our hidden competitor which was discussed in class.

Page 15 of 20
Integrated Marketing Communications Plan
Attached in the email which also be a PowerPoint that has our Integrated Marketing
Communication Plan
GQ Magazine Ads

Page 16 of 20
Charity Event Flyer
Page 17 of 20
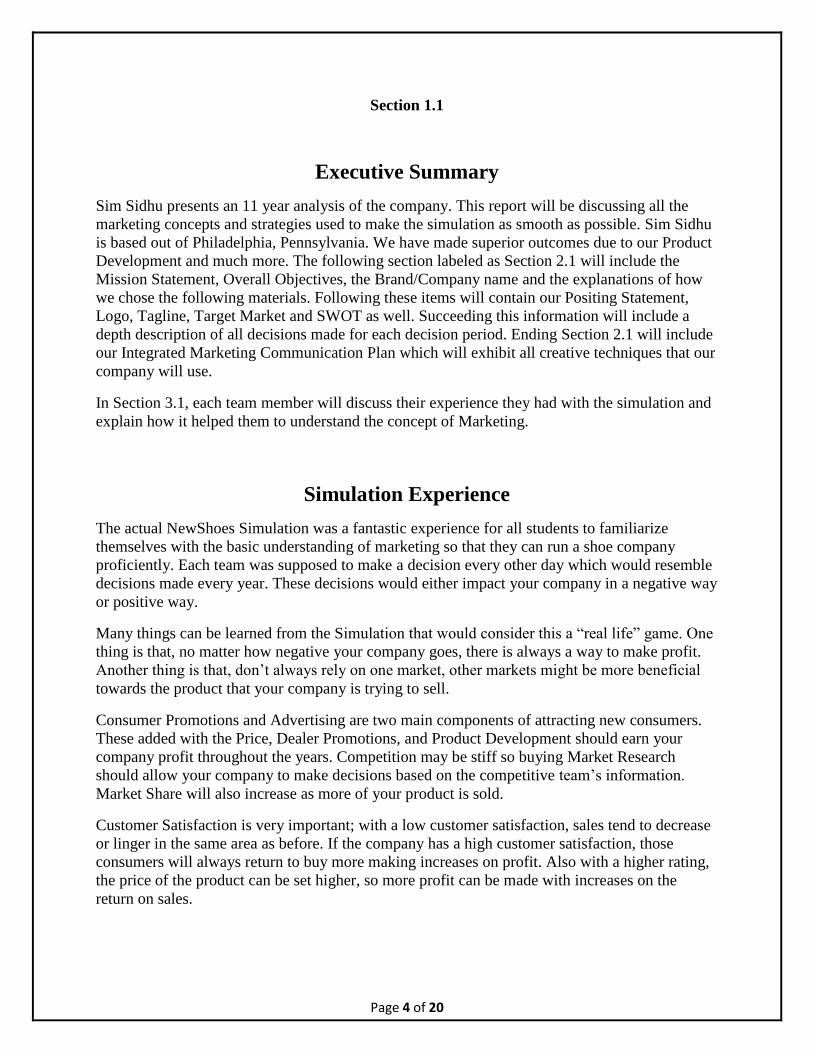
Trade In Offer as Consumer and Dealer Promotions
Head 2 Head with Competition

Page 18 of 20
Official Website with Facebook fan page
Sales, Promotions

Page 19 of 20
Sponsorships
Spokesperson(s) - Shah Rukh Khan, Jackie Chan, Justin
Tuck, Will Smith
Page 20 of 20
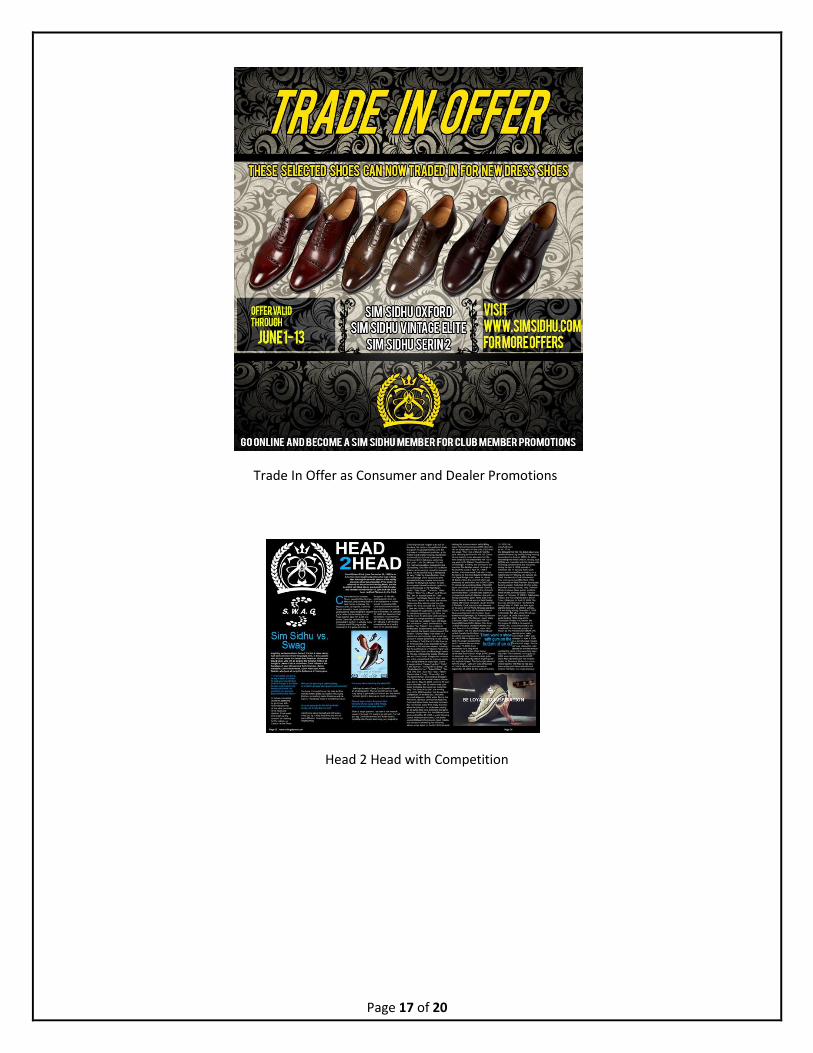
Ads and billboards


![2005-[Sachdev S. Sidhu] Phage Display in Biotechnology](https://img.pdfslide.us/doc/110x75/552b81704a795963588b46ae/2005-sachdev-s-sidhu-phage-display-in-biotechnology.jpg)