Embed Size (px)
Citation preview
July 4, 2021
ST
RAT
EG
Y
Mala
ysi
a
THIS REPORT HAS BEEN PREPARED BY MAYBANK INVESTMENT BANK BERHAD
SEE PAGE 114 FOR IMPORTANT DISCLOSURES AND ANALYST CERTIFICATIONS PP16832/01/2013 (031128)
Malaysia 2H21 Outlook and Lookouts
Silver linings amidst the pandemic cloud
For Malaysia macro, we reiterate our revised 2021 real GDP growth
forecast of +4.2% (+5.1% previously); 2020: -5.6%) due to tighter restriction
in May 2021 and lockdown since June 2021. We cut growth forecasts for
non-manufacturing sectors on the supply side, and private expenditure on
the demand side. Global economic recovery plus higher commodity ASPs
cushioned downside to GDP via upgrades in manufacturing and external
trade growth forecasts. Sizeable positive impulse from economic stimulus
– and direct fiscal injection – remains given the additional PEMULIH
package that adds to the yet to be utilized parts of earlier stimulus and
Budget 2021 spending allocation, thus upward revision to Government
consumption expenditure growth and unchanged outlook with regards
anticipated public investment rebound.
We raised 2021 budget deficit/GDP forecast to 6.8%, from 6.0%, and
expect no change in current record-low 1.75% Overnight Policy Rate (OPR).
A silver lining amid the pandemic cloud is the acceleration in COVID-19
vaccinations hence rising share of population fully-vaccinated, which is
one of the conditions for exit from the current full lockdown,
easing/lifting of restrictions, and re-opening of the economy.
For Malaysia equities, bucking our bullish expectations, as articulated in
our 2021 Strategy report (“Malaysia 2021 Market Outlook: Goldilocks makes
a comeback”, dated Dec 14), of sustained recovery following broad uptrend
over 4Q20, the KLCI’s momentum stalled into Jan, brought up short by the
twin shocks of a renewed national Movement Control Order (MCO) and
Proclamation of Emergency. Fiscal limitations and sustained institutional
selling have also weighed negatively. However, while the path to full re-
opening from the current lockdown (since June 1) looks to be an extended
one, corporate earnings have proven resilient, and rapidly rising vaccination
rates should allow investors to refocus on equities-supportive positives into
4Q21 i.e. accelerated earnings recovery, continued albeit moderated fiscal
and monetary support, ample liquidity, commodities price recovery and
relative attraction vs. fixed income. Re thematics, GLC restructuring is
unlikely to gain traction (though revival of the Axiata-DiGi merger is
welcome) given backdrop of political volatility and continuing GLC/GLIC
management changes. The dividend yield and supply chain relocation
thematics offer much greater structural investability, as does sustainability
/ ESG investing, as detailed in our recently-published Malaysia ESG
Compendium (“Sustainability: No longer optional”, dated April 8).
In the wake of 1Q21 reporting, we continue to expect the KLCI to see sharp
earnings recovery in 2021 (2020/2021F: -11.9%/+49.0%; if excluding glove
stocks, adjusted 2021F: +35% YoY) after three straight years of earnings
contraction. However, in factoring in extended NRP and political risks, we
moderate end-2021 KLCI target to 1,720 (15x forward earnings, -0.5 SD vs.
mean), from 1,830 (16x, in line with historical mean) previously. Re sector
positioning changes, we downgrade Construction (preferred sector picks are
Gamuda, IJM), Utilities (Tenaga, MFCB) and Gloves (Hartalega) to Neutral
(Fig 69), and raise Gaming to overweight (GENM, BST). We continue to like
Mid-cap Financials (HLBK, RHB, Allianz), Tech/Semicon (Inari, Greatech),
Large-cap Oil & Gas (Dialog, Yinson), Plantations (KLK, BPlant) and Auto
(BAuto). We are selective on Telcos (Telekom), REITs (Axis), Property (SP
Setia) and Logistics (MISC); we stay Underweight Aviation and Mid-cap O&G.
Top BUYs (Fig 70) and Top SELLs (Fig 71) are detailed on pages 68-70,
recommended ESG stock picks are per Fig 61, while conviction dividend picks
(providing 5-9% cash yield) are in Fig 51.
Analysts
Suhaimi Ilias (Economics)
(+603) 2297 8682
Anand Pathmakanthan (Equity Strategy)
(+603) 2282 3730
Wong Chew Hann (Equity Research)
(+603) 2297 8686
Malaysia Economics, FX, Fixed Income and
Equities Research Teams
(please refer to backpages for the full list)
July 4, 2021 2
Strategy Research
Table of Contents
Malaysia Macro Update ................................................................................................................ 3
2H 2021 Outlook and Lookouts .................................................................................................... 21
Thematic 1: GLC Restructuring .................................................................................................... 46
Thematic 2: Interest rates vs. dividend yields ................................................................................. 52
Thematic 3: Sustainability / ESG investing ...................................................................................... 55
Thematic 4: Capex revival, trade war opportunities ......................................................................... 60
Balanced positioning, with ESG and yield overlays ............................................................................ 65
AUTOMOTIVE: EV excited? .......................................................................................................... 75
AVIATION: Worst may be over but still tough ................................................................................... 77
BANKING: Showing recovery ........................................................................................................ 79
CONSTRUCTION / INFRA: Going gets tough ...................................................................................... 81
Consumer: Coping with lockdown déjà vu ...................................................................................... 84
GAMING: Vaccination is key ......................................................................................................... 86
GLOVES: Entering a phase of declining ASP trend ............................................................................. 88
Media: We have growth! ............................................................................................................. 90
OIL & GAS: Commodity super-cycle? .............................................................................................. 92
PETROCHEMICAL: A Regression to the Mean .................................................................................... 94
PLANTATION: Higher HoH output in 2H21 to buffer anticipated weaker CPO ASP ..................................... 96
PROPERTY DEVELOPERS: Temporary hiccups? .................................................................................. 99
REITs: Awaiting recovery .......................................................................................................... 101
SHIPPING & PORTS: A Mixed Bag ................................................................................................. 103
TECHNOLOGY: Positive momentum to sustain ................................................................................ 105
TELECOM: Some uncertainties ................................................................................................... 107
UTILITY: Mostly about Tenaga .................................................................................................... 109
APPENDIX: Foreign shareholding trend ......................................................................................... 111
July 4, 2021
ST
RAT
EG
Y
Mala
ysi
a
July 4, 2021 3
Malaysia Macro Update
Slower 2021 GDP rebound
With the country into tighter restrictions in May 2021 and lockdown since 1 June 2021, we cut 2021 real GDP growth forecast to +4.2% from +5.1% previously (2020: -5.6%). This mainly reflects lower growth forecasts for the largest segment of supply-side and demand-side of the economy i.e. services sector (2021E: to +4.2% from +5.1% previously; 1Q 2021: -2.3% YoY; 2020: -5.5%) and private consumption (2021E: to +3.9% from +5.9% previously; 1Q 2021: -1.5% YoY; 2020: -4.3%). Both are 58% and 59.5% of 2020 GDP respectively. Cushioning the downside to the revised 2021 GDP growth forecast is global economic recovery (2021E +6.1%; 1Q 2021 +2.8% YoY; 2020: -3.3%) which is positive for the export-oriented manufacturing and external trade, hence the upgrades in this year’s growth forecasts for manufacturing sector (2021E: to +6.3% from +5.2% previously; 1Q 2021: +6.6% YoY; 2020: -2.6%), exports of goods and services (2021E: to +15.5% from +7.5% previously; 1Q 2021: +11.9% YoY; 2020: -8.9%), and imports of goods & services (2021E: to +18.0% from +8.0% previously; 1Q 2021: +13.0% YoY; 2020: -8.4%). Upward revisions in external trade growth forecasts also reflect upgrades in the in-house forecasts for this year’s ASPs for crude oil (Brent) to USD65/bbl (USD55-60/bbl previously; 2020: USD42.3/bbl) and crude palm oil (CPO) to MYR3,100/tonne (MYR2,700/tonne previously; 2020: MYR2,781/tonne).
Acknowledging the challenging business and operating environment given the ins-and-outs of restrictions and lockdowns, we lowered this year’s private investment growth forecast to +4.1% from +6.3% (2020: -11.9%). Positively, 1Q 2021 private investment grew for the first time since 4Q 2019 by +1.3% YoY (4Q 2020: -6.6% YoY), driven by the first quarterly growth of “machinery & equipment” segment after nine quarters of contractions, signaling positive impact of budget incentives and economic stimulus measures to spur capital expenditure in technology adoption, automation and digitalization. Furthermore, corporate earnings rebounded since 4Q 2020 and total approved investment recovered strongly by +95.6% YoY in 1Q 2021 (2020: -19.5%), which augurs well for private investment outlook.
There are still sizeable positive impulse left from economic and fiscal stimulus i.e. around 60% of the eight economic stimulus packages totaling MYR530b and of Budget 2021’s MYR322.5b spending allocation, as well as around a quarter of the MYR65b COVID-19 Fund, to be spent. Thus we raised Government consumption growth forecast (2021E: to +5.0% from +2.8% previously; 1Q 2021: +5.9% YoY; 2020: +3.9%) and maintain public investment’s double-digit growth outlook (2021E: no change at +15.3%; 1Q 2021: -18.6% YoY; 2020: -21.4%) amid on-going major infrastructure projects and rollout of digital infrastructure capex.
Silver linings amid the pandemic clouds are rising trends in registrations for vaccinations, daily vaccinations and vaccinated population; as well as ramp up in vaccine supplies since June 2021.
We raised our 2021 budget deficit/GDP forecast to 6.8% from 6.0% previously, factoring in the additional direct fiscal injections from the economic stimulus packages year-to-date; revenue and denominator impact of slower GDP growth forecast; and upsides to commodity-related revenues from higher crude oil and CPO price assumptions.
We are sticking to our call of no change in current record-low 1.75% Overnight Policy Rate (OPR) this year amid “passive easing” from negative real OPR; easing in financial condition indicators (i.e. yield and credit spreads); the above-mentioned remaining positive impulse in economic/fiscal stimulus; and active use of other BNM policy tools e.g. loan moratorium; SME financing and microcredit schemes.
Click here to enter text.
Click here to enter text.
Click here to enter text.
Analysts
Suhaimi Ilias (Economics)
(+603) 2297 8682
Dr Zamros Dzulkafli
(603) 2082 6818
Ramesh Lankanathan
(603) 2297 8685
July 4, 2021 4
Strategy Research
Economic indicators jumped in Apr 2021
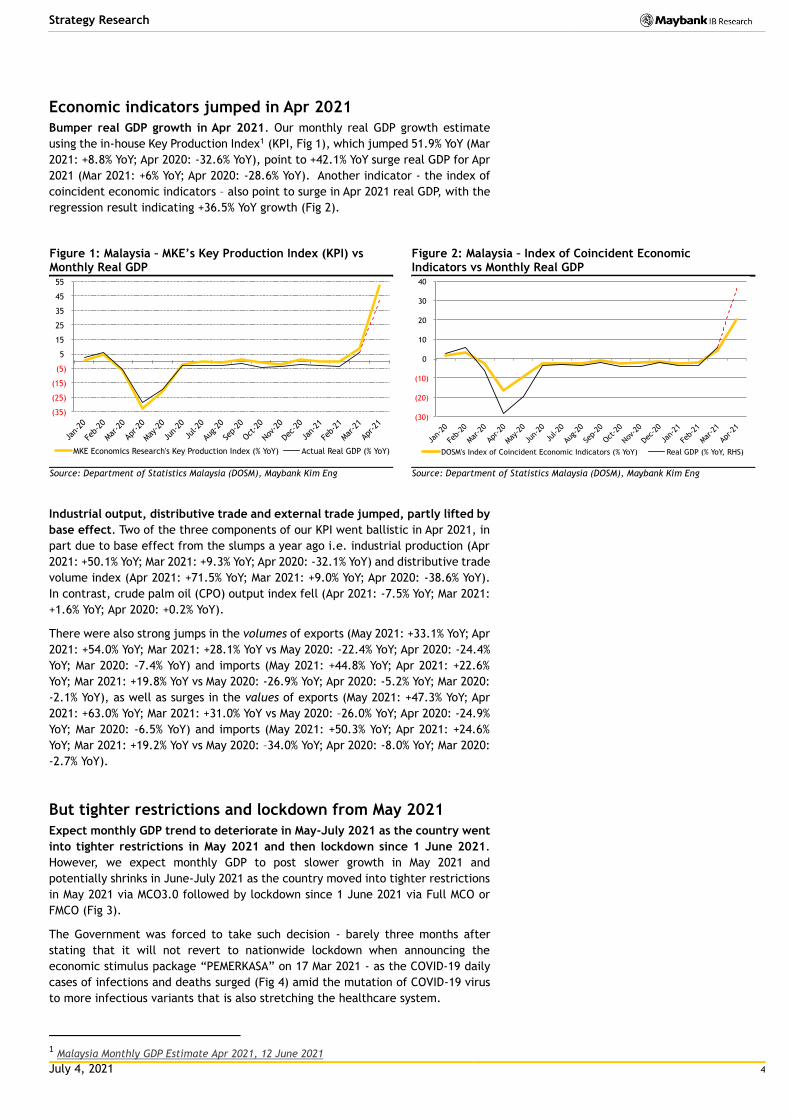
Bumper real GDP growth in Apr 2021. Our monthly real GDP growth estimate
using the in-house Key Production Index1 (KPI, Fig 1), which jumped 51.9% YoY (Mar
2021: +8.8% YoY; Apr 2020: -32.6% YoY), point to +42.1% YoY surge real GDP for Apr
2021 (Mar 2021: +6% YoY; Apr 2020: -28.6% YoY). Another indicator - the index of
coincident economic indicators – also point to surge in Apr 2021 real GDP, with the
regression result indicating +36.5% YoY growth (Fig 2).
Figure 1: Malaysia – MKE’s Key Production Index (KPI) vs Monthly Real GDP
Figure 2: Malaysia – Index of Coincident Economic Indicators vs Monthly Real GDP
Source: Department of Statistics Malaysia (DOSM), Maybank Kim Eng Source: Department of Statistics Malaysia (DOSM), Maybank Kim Eng
Industrial output, distributive trade and external trade jumped, partly lifted by
base effect. Two of the three components of our KPI went ballistic in Apr 2021, in
part due to base effect from the slumps a year ago i.e. industrial production (Apr
2021: +50.1% YoY; Mar 2021: +9.3% YoY; Apr 2020: -32.1% YoY) and distributive trade
volume index (Apr 2021: +71.5% YoY; Mar 2021: +9.0% YoY; Apr 2020: -38.6% YoY).
In contrast, crude palm oil (CPO) output index fell (Apr 2021: -7.5% YoY; Mar 2021:
+1.6% YoY; Apr 2020: +0.2% YoY).
There were also strong jumps in the volumes of exports (May 2021: +33.1% YoY; Apr
2021: +54.0% YoY; Mar 2021: +28.1% YoY vs May 2020: -22.4% YoY; Apr 2020: -24.4%
YoY; Mar 2020: -7.4% YoY) and imports (May 2021: +44.8% YoY; Apr 2021: +22.6%
YoY; Mar 2021: +19.8% YoY vs May 2020: -26.9% YoY; Apr 2020: -5.2% YoY; Mar 2020:
-2.1% YoY), as well as surges in the values of exports (May 2021: +47.3% YoY; Apr
2021: +63.0% YoY; Mar 2021: +31.0% YoY vs May 2020: –26.0% YoY; Apr 2020: -24.9%
YoY; Mar 2020: -6.5% YoY) and imports (May 2021: +50.3% YoY; Apr 2021: +24.6%
YoY; Mar 2021: +19.2% YoY vs May 2020: –34.0% YoY; Apr 2020: -8.0% YoY; Mar 2020:
-2.7% YoY).
But tighter restrictions and lockdown from May 2021
Expect monthly GDP trend to deteriorate in May-July 2021 as the country went
into tighter restrictions in May 2021 and then lockdown since 1 June 2021.
However, we expect monthly GDP to post slower growth in May 2021 and
potentially shrinks in June-July 2021 as the country moved into tighter restrictions
in May 2021 via MCO3.0 followed by lockdown since 1 June 2021 via Full MCO or
FMCO (Fig 3).
The Government was forced to take such decision - barely three months after
stating that it will not revert to nationwide lockdown when announcing the
economic stimulus package “PEMERKASA” on 17 Mar 2021 - as the COVID-19 daily
cases of infections and deaths surged (Fig 4) amid the mutation of COVID-19 virus
to more infectious variants that is also stretching the healthcare system.
1 Malaysia Monthly GDP Estimate Apr 2021, 12 June 2021
(35)
(25)
(15)
(5)
5
15
25
35
45
55
Jan-
20
Feb-
20
Mar
-20
Apr-20
May
-20
Jun-
20
Jul-2
0
Aug-
20
Sep-
20
Oct
-20
Nov-20
Dec-
20
Jan-
21
Feb-
21
Mar
-21
Apr-21
MKE Economics Research's Key Production Index (% YoY) Actual Real GDP (% YoY)
(30)
(20)
(10)
0
10
20
30
40
Jan-
20
Feb-
20
Mar
-20
Apr-20
May
-20
Jun-
20
Jul-2
0
Aug-
20
Sep-
20
Oct-2
0
Nov-2
0
Dec-
20
Jan-
21
Feb-
21
Mar
-21
Apr-21
DOSM's Index of Coincident Economic Indicators (% YoY) Real GDP (% YoY, RHS)
July 4, 2021 5
Strategy Research
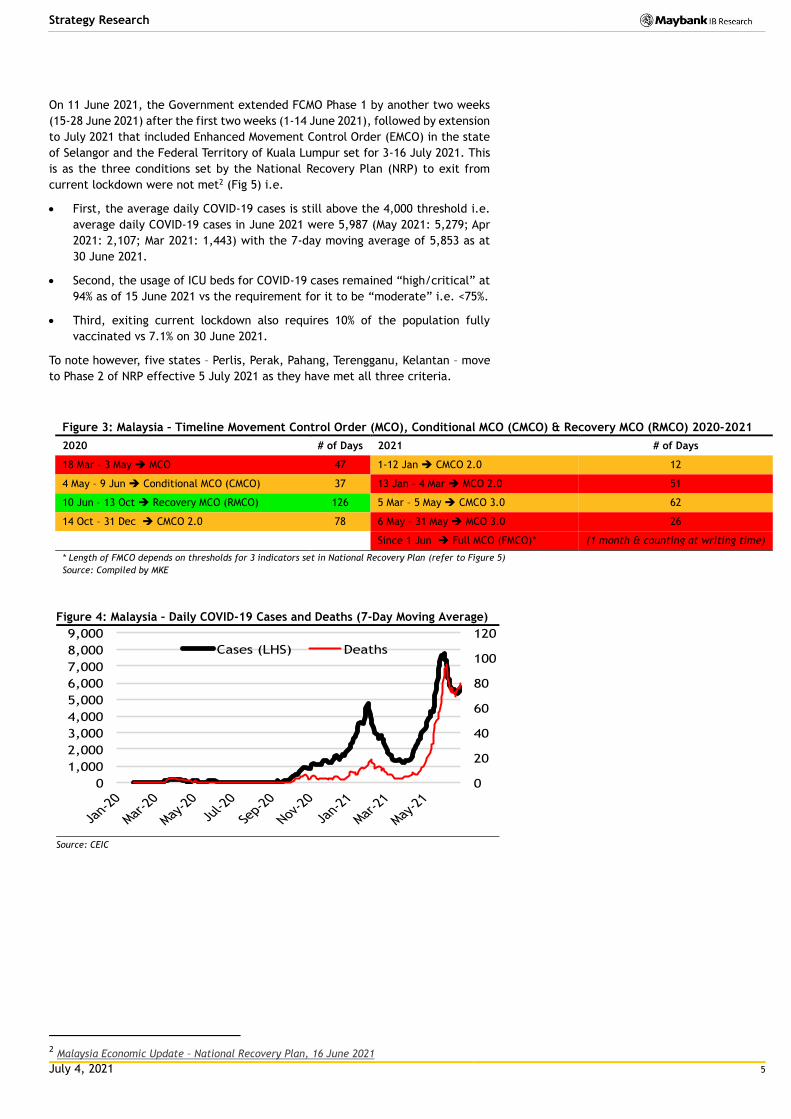
On 11 June 2021, the Government extended FCMO Phase 1 by another two weeks
(15-28 June 2021) after the first two weeks (1-14 June 2021), followed by extension
to July 2021 that included Enhanced Movement Control Order (EMCO) in the state
of Selangor and the Federal Territory of Kuala Lumpur set for 3-16 July 2021. This
is as the three conditions set by the National Recovery Plan (NRP) to exit from
current lockdown were not met2 (Fig 5) i.e.
First, the average daily COVID-19 cases is still above the 4,000 threshold i.e.
average daily COVID-19 cases in June 2021 were 5,987 (May 2021: 5,279; Apr
2021: 2,107; Mar 2021: 1,443) with the 7-day moving average of 5,853 as at
30 June 2021.
Second, the usage of ICU beds for COVID-19 cases remained “high/critical” at
94% as of 15 June 2021 vs the requirement for it to be “moderate” i.e. <75%.
Third, exiting current lockdown also requires 10% of the population fully
vaccinated vs 7.1% on 30 June 2021.
To note however, five states – Perlis, Perak, Pahang, Terengganu, Kelantan – move
to Phase 2 of NRP effective 5 July 2021 as they have met all three criteria.
Figure 3: Malaysia – Timeline Movement Control Order (MCO), Conditional MCO (CMCO) & Recovery MCO (RMCO) 2020-2021
2020 # of Days 2021 # of Days
18 Mar – 3 May MCO 47 1-12 Jan CMCO 2.0 12
4 May – 9 Jun Conditional MCO (CMCO) 37 13 Jan – 4 Mar MCO 2.0 51
10 Jun – 13 Oct Recovery MCO (RMCO) 126 5 Mar – 5 May CMCO 3.0 62
14 Oct – 31 Dec CMCO 2.0 78 6 May – 31 May MCO 3.0 26
Since 1 Jun Full MCO (FMCO)* (1 month & counting at writing time)
* Length of FMCO depends on thresholds for 3 indicators set in National Recovery Plan (refer to Figure 5)
Source: Compiled by MKE
Figure 4: Malaysia – Daily COVID-19 Cases and Deaths (7-Day Moving Average)
Source: CEIC
2 Malaysia Economic Update – National Recovery Plan, 16 June 2021
0
20
40
60
80
100
120
0
1,000
2,000
3,000
4,000
5,000
6,000
7,000
8,000
9,000
Jan-
20
Mar-2
0
May-2
0
Jul-2
0
Sep-
20
Nov-2
0
Jan-
21
Mar-2
1
May-2
1
Cases (LHS) Deaths
July 4, 2021 6
Strategy Research
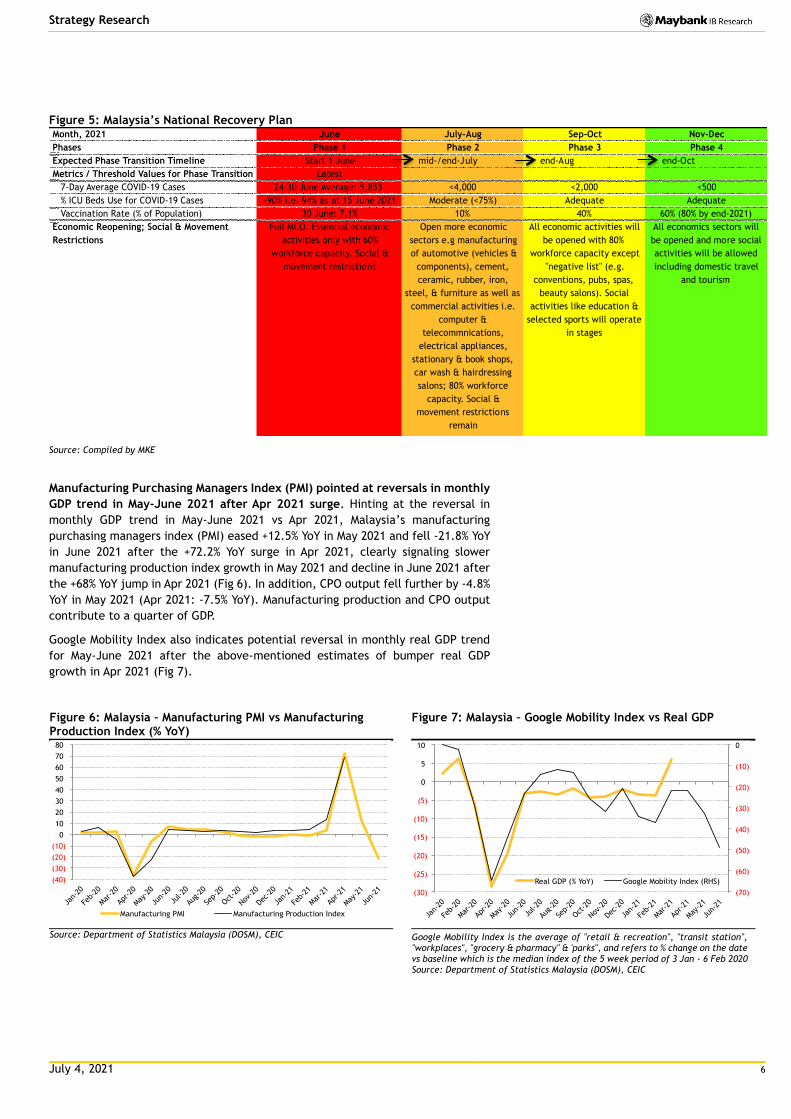
Figure 5: Malaysia’s National Recovery Plan
Source: Compiled by MKE
Manufacturing Purchasing Managers Index (PMI) pointed at reversals in monthly
GDP trend in May-June 2021 after Apr 2021 surge. Hinting at the reversal in
monthly GDP trend in May-June 2021 vs Apr 2021, Malaysia’s manufacturing
purchasing managers index (PMI) eased +12.5% YoY in May 2021 and fell -21.8% YoY
in June 2021 after the +72.2% YoY surge in Apr 2021, clearly signaling slower
manufacturing production index growth in May 2021 and decline in June 2021 after
the +68% YoY jump in Apr 2021 (Fig 6). In addition, CPO output fell further by -4.8%
YoY in May 2021 (Apr 2021: -7.5% YoY). Manufacturing production and CPO output
contribute to a quarter of GDP.
Google Mobility Index also indicates potential reversal in monthly real GDP trend
for May-June 2021 after the above-mentioned estimates of bumper real GDP
growth in Apr 2021 (Fig 7).
Figure 6: Malaysia – Manufacturing PMI vs Manufacturing Production Index (% YoY)
Figure 7: Malaysia – Google Mobility Index vs Real GDP
Source: Department of Statistics Malaysia (DOSM), CEIC Google Mobility Index is the average of "retail & recreation", "transit station", "workplaces", "grocery & pharmacy" & 'parks", and refers to % change on the date vs baseline which is the median index of the 5 week period of 3 Jan - 6 Feb 2020 Source: Department of Statistics Malaysia (DOSM), CEIC
Month, 2021 June July-Aug Sep-Oct Nov-Dec
Phases Phase 1 Phase 2 Phase 3 Phase 4
Expected Phase Transition Timeline Start 1 June mid-/end-July end-Aug end-Oct
Metrics / Threshold Values for Phase Transition Latest
7-Day Average COVID-19 Cases 24-30 June Average: 5,853 <4,000 <2,000 <500
% ICU Beds Use for COVID-19 Cases >90% i.e. 94% as at 15 June 2021 Moderate (<75%) Adequate Adequate
Vaccination Rate (% of Population) 30 June: 7.1% 10% 40% 60% (80% by end-2021)
Economic Reopening; Social & Movement
Restrictions
Full MCO. Essential economic
activities only with 60%
workforce capacity. Social &
movement restrictions
Open more economic
sectors e.g manufacturing
of automotive (vehicles &
components), cement,
ceramic, rubber, iron,
steel, & furniture as well as
commercial activities i.e.
computer &
telecommnications,
electrical appliances,
stationary & book shops,
car wash & hairdressing
salons; 80% workforce
capacity. Social &
movement restrictions
remain
All economic activities will
be opened with 80%
workforce capacity except
"negative list" (e.g.
conventions, pubs, spas,
beauty salons). Social
activities like education &
selected sports will operate
in stages
All economics sectors will
be opened and more social
activities will be allowed
including domestic travel
and tourism
(40)
(30)
(20)
(10)
0
10
20
30
40
50
60
70
80
Jan-
20
Feb-
20
Mar
-20
Apr-20
May
-20
Jun-
20
Jul-2
0
Aug-
20
Sep-
20
Oct-2
0
Nov-2
0
Dec-
20
Jan-
21
Feb-
21
Mar
-21
Apr-21
May
-21
Jun-
21
Manufacturing PMI Manufacturing Production Index
(70)
(60)
(50)
(40)
(30)
(20)
(10)
0
(30)
(25)
(20)
(15)
(10)
(5)
0
5
10
Jan-
20
Feb-
20
Mar
-20
Apr-20
May
-20
Jun-
20
Jul-2
0
Aug-
20
Sep-
20
Oct
-20
Nov-2
0
Dec-
20
Jan-
21
Feb-
21
Mar
-21
Apr-21
May
-21
Jun-
21
Real GDP (% YoY) Google Mobility Index (RHS)
July 4, 2021 7
Strategy Research
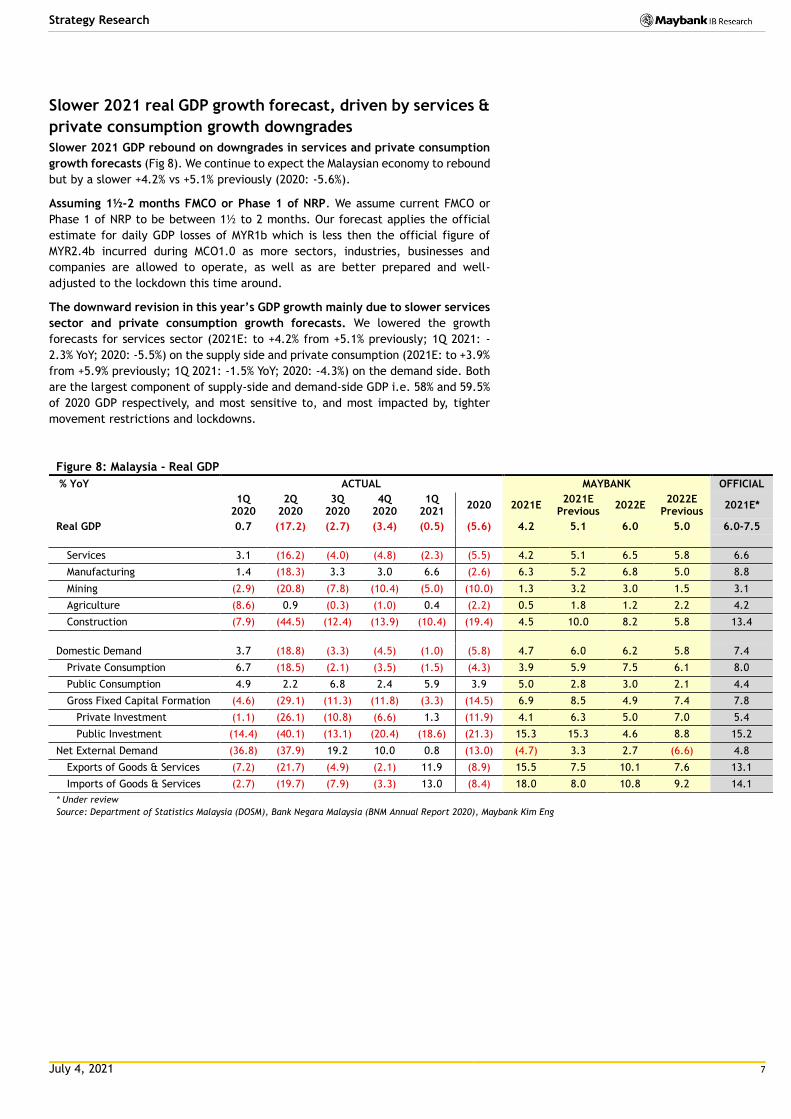
Slower 2021 real GDP growth forecast, driven by services &
private consumption growth downgrades
Slower 2021 GDP rebound on downgrades in services and private consumption
growth forecasts (Fig 8). We continue to expect the Malaysian economy to rebound
but by a slower +4.2% vs +5.1% previously (2020: -5.6%).
Assuming 1½-2 months FMCO or Phase 1 of NRP. We assume current FMCO or
Phase 1 of NRP to be between 1½ to 2 months. Our forecast applies the official
estimate for daily GDP losses of MYR1b which is less then the official figure of
MYR2.4b incurred during MCO1.0 as more sectors, industries, businesses and
companies are allowed to operate, as well as are better prepared and well-
adjusted to the lockdown this time around.
The downward revision in this year’s GDP growth mainly due to slower services
sector and private consumption growth forecasts. We lowered the growth
forecasts for services sector (2021E: to +4.2% from +5.1% previously; 1Q 2021: -
2.3% YoY; 2020: -5.5%) on the supply side and private consumption (2021E: to +3.9%
from +5.9% previously; 1Q 2021: -1.5% YoY; 2020: -4.3%) on the demand side. Both
are the largest component of supply-side and demand-side GDP i.e. 58% and 59.5%
of 2020 GDP respectively, and most sensitive to, and most impacted by, tighter
movement restrictions and lockdowns.
Figure 8: Malaysia - Real GDP
% YoY ACTUAL MAYBANK OFFICIAL
1Q
2020 2Q
2020 3Q
2020 4Q
2020 1Q
2021 2020 2021E
2021E Previous
2022E 2022E
Previous 2021E*
Real GDP 0.7 (17.2) (2.7) (3.4) (0.5) (5.6) 4.2 5.1 6.0 5.0 6.0-7.5
Services 3.1 (16.2) (4.0) (4.8) (2.3) (5.5) 4.2 5.1 6.5 5.8 6.6
Manufacturing 1.4 (18.3) 3.3 3.0 6.6 (2.6) 6.3 5.2 6.8 5.0 8.8
Mining (2.9) (20.8) (7.8) (10.4) (5.0) (10.0) 1.3 3.2 3.0 1.5 3.1
Agriculture (8.6) 0.9 (0.3) (1.0) 0.4 (2.2) 0.5 1.8 1.2 2.2 4.2
Construction (7.9) (44.5) (12.4) (13.9) (10.4) (19.4) 4.5 10.0 8.2 5.8 13.4
Domestic Demand 3.7 (18.8) (3.3) (4.5) (1.0) (5.8) 4.7 6.0 6.2 5.8 7.4
Private Consumption 6.7 (18.5) (2.1) (3.5) (1.5) (4.3) 3.9 5.9 7.5 6.1 8.0
Public Consumption 4.9 2.2 6.8 2.4 5.9 3.9 5.0 2.8 3.0 2.1 4.4
Gross Fixed Capital Formation (4.6) (29.1) (11.3) (11.8) (3.3) (14.5) 6.9 8.5 4.9 7.4 7.8
Private Investment (1.1) (26.1) (10.8) (6.6) 1.3 (11.9) 4.1 6.3 5.0 7.0 5.4
Public Investment (14.4) (40.1) (13.1) (20.4) (18.6) (21.3) 15.3 15.3 4.6 8.8 15.2
Net External Demand (36.8) (37.9) 19.2 10.0 0.8 (13.0) (4.7) 3.3 2.7 (6.6) 4.8
Exports of Goods & Services (7.2) (21.7) (4.9) (2.1) 11.9 (8.9) 15.5 7.5 10.1 7.6 13.1
Imports of Goods & Services (2.7) (19.7) (7.9) (3.3) 13.0 (8.4) 18.0 8.0 10.8 9.2 14.1
* Under review
Source: Department of Statistics Malaysia (DOSM), Bank Negara Malaysia (BNM Annual Report 2020), Maybank Kim Eng
July 4, 2021 8
Strategy Research
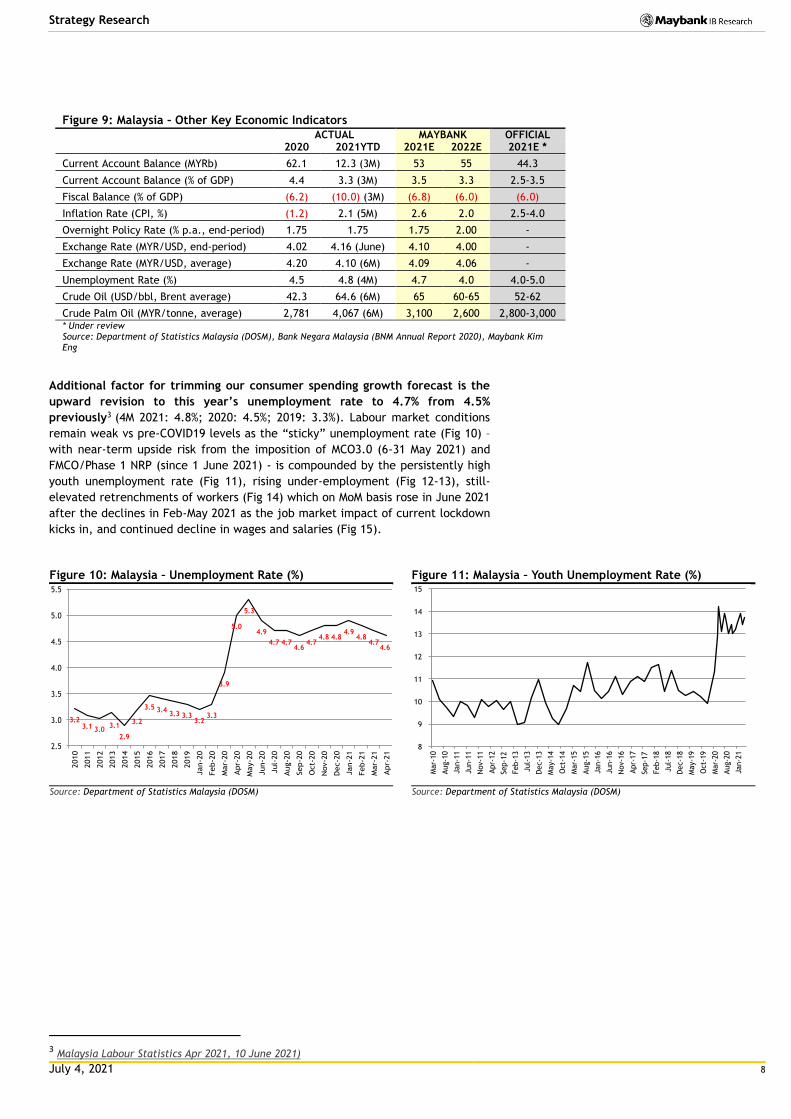
Figure 9: Malaysia – Other Key Economic Indicators
ACTUAL MAYBANK OFFICIAL 2020 2021YTD 2021E 2022E 2021E *
Current Account Balance (MYRb) 62.1 12.3 (3M) 53 55 44.3
Current Account Balance (% of GDP) 4.4 3.3 (3M) 3.5 3.3 2.5-3.5
Fiscal Balance (% of GDP) (6.2) (10.0) (3M) (6.8) (6.0) (6.0)
Inflation Rate (CPI, %) (1.2) 2.1 (5M) 2.6 2.0 2.5-4.0
Overnight Policy Rate (% p.a., end-period) 1.75 1.75 1.75 2.00 -
Exchange Rate (MYR/USD, end-period) 4.02 4.16 (June) 4.10 4.00 -
Exchange Rate (MYR/USD, average) 4.20 4.10 (6M) 4.09 4.06 -
Unemployment Rate (%) 4.5 4.8 (4M) 4.7 4.0 4.0-5.0
Crude Oil (USD/bbl, Brent average) 42.3 64.6 (6M) 65 60-65 52-62
Crude Palm Oil (MYR/tonne, average) 2,781 4,067 (6M) 3,100 2,600 2,800-3,000 * Under review Source: Department of Statistics Malaysia (DOSM), Bank Negara Malaysia (BNM Annual Report 2020), Maybank Kim Eng
Additional factor for trimming our consumer spending growth forecast is the
upward revision to this year’s unemployment rate to 4.7% from 4.5%
previously3 (4M 2021: 4.8%; 2020: 4.5%; 2019: 3.3%). Labour market conditions
remain weak vs pre-COVID19 levels as the “sticky” unemployment rate (Fig 10) –
with near-term upside risk from the imposition of MCO3.0 (6-31 May 2021) and
FMCO/Phase 1 NRP (since 1 June 2021) - is compounded by the persistently high
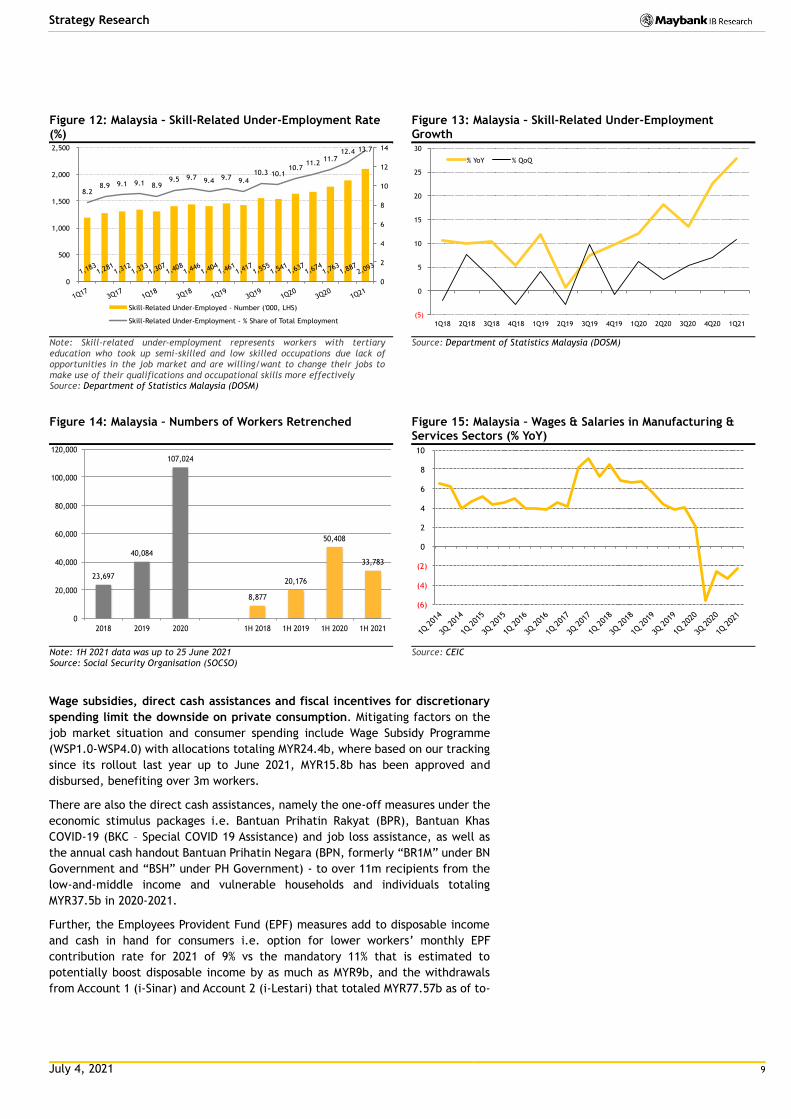
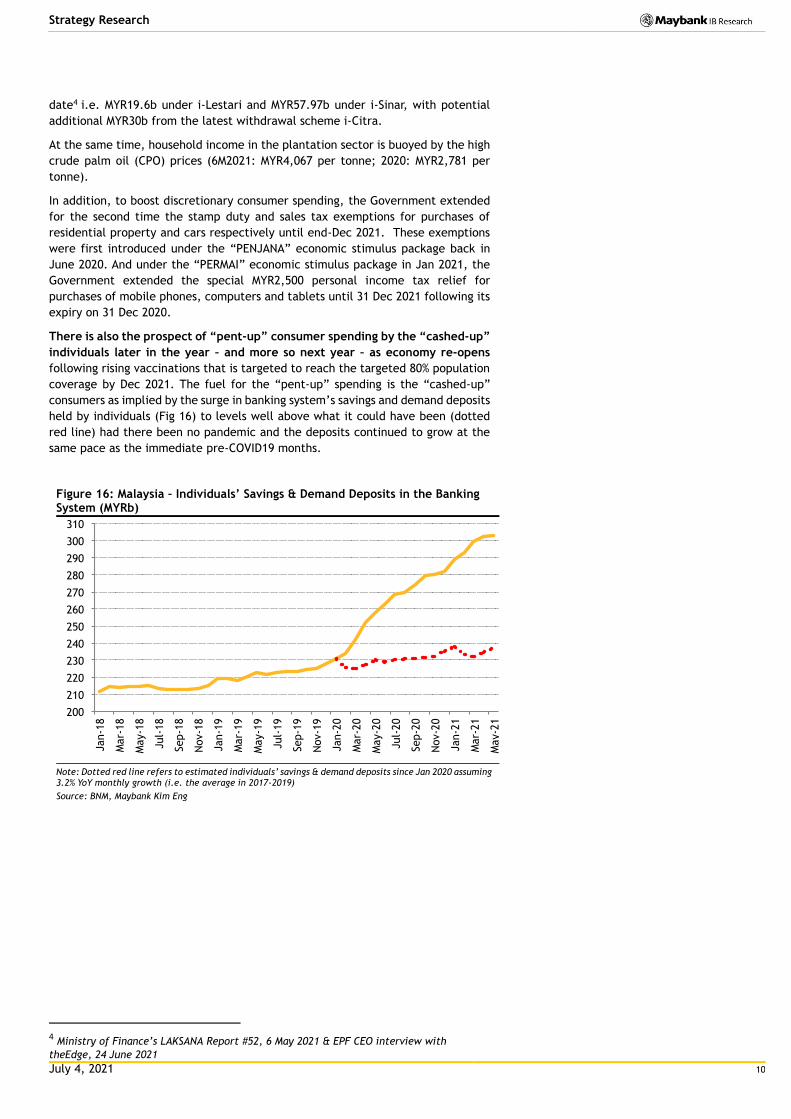
youth unemployment rate (Fig 11), rising under-employment (Fig 12-13), still-
elevated retrenchments of workers (Fig 14) which on MoM basis rose in June 2021
after the declines in Feb-May 2021 as the job market impact of current lockdown
kicks in, and continued decline in wages and salaries (Fig 15).
Figure 10: Malaysia – Unemployment Rate (%) Figure 11: Malaysia – Youth Unemployment Rate (%)
Source: Department of Statistics Malaysia (DOSM) Source: Department of Statistics Malaysia (DOSM)
3 Malaysia Labour Statistics Apr 2021, 10 June 2021)
3.2 3.1 3.0
3.1
2.9
3.2
3.5 3.4 3.3 3.3
3.2 3.3
3.9
5.0
5.3
4.9
4.7 4.7 4.6
4.7 4.8 4.8
4.9 4.8
4.7 4.6
2.5
3.0
3.5
4.0
4.5
5.0
5.5
2010
2011
2012
2013
2014
2015
2016
2017
2018
2019
Jan-2
0
Feb-2
0
Mar-
20
Apr-
20
May-2
0
Jun-2
0
Jul-
20
Aug-2
0
Sep-2
0
Oct-
20
Nov-2
0
Dec-2
0
Jan-2
1
Feb-2
1
Mar-
21
Apr-
21 8
9
10
11
12
13
14
15
Mar-
10
Aug-1
0
Jan-1
1
Jun-1
1
Nov-1
1
Apr-
12
Sep-1
2
Feb-1
3
Jul-
13
Dec-1
3
May-1
4
Oct-
14
Mar-
15
Aug-1
5
Jan-1
6
Jun-1
6
Nov-1
6
Apr-
17
Sep-1
7
Feb-1
8
Jul-
18
Dec-1
8
May-1
9
Oct-
19
Mar-
20
Aug-2
0
Jan-2
1
July 4, 2021 9
Strategy Research
Figure 12: Malaysia – Skill-Related Under-Employment Rate (%)
Figure 13: Malaysia – Skill-Related Under-Employment Growth
Note: Skill-related under-employment represents workers with tertiary education who took up semi-skilled and low skilled occupations due lack of opportunities in the job market and are willing/want to change their jobs to make use of their qualifications and occupational skills more effectively Source: Department of Statistics Malaysia (DOSM)
Source: Department of Statistics Malaysia (DOSM)
Figure 14: Malaysia – Numbers of Workers Retrenched Figure 15: Malaysia – Wages & Salaries in Manufacturing & Services Sectors (% YoY)
Note: 1H 2021 data was up to 25 June 2021 Source: Social Security Organisation (SOCSO)
Source: CEIC
Wage subsidies, direct cash assistances and fiscal incentives for discretionary
spending limit the downside on private consumption. Mitigating factors on the
job market situation and consumer spending include Wage Subsidy Programme
(WSP1.0-WSP4.0) with allocations totaling MYR24.4b, where based on our tracking
since its rollout last year up to June 2021, MYR15.8b has been approved and
disbursed, benefiting over 3m workers.
There are also the direct cash assistances, namely the one-off measures under the
economic stimulus packages i.e. Bantuan Prihatin Rakyat (BPR), Bantuan Khas
COVID-19 (BKC – Special COVID 19 Assistance) and job loss assistance, as well as
the annual cash handout Bantuan Prihatin Negara (BPN, formerly “BR1M” under BN
Government and “BSH” under PH Government) - to over 11m recipients from the
low-and-middle income and vulnerable households and individuals totaling
MYR37.5b in 2020-2021.
Further, the Employees Provident Fund (EPF) measures add to disposable income
and cash in hand for consumers i.e. option for lower workers’ monthly EPF
contribution rate for 2021 of 9% vs the mandatory 11% that is estimated to
potentially boost disposable income by as much as MYR9b, and the withdrawals
from Account 1 (i-Sinar) and Account 2 (i-Lestari) that totaled MYR77.57b as of to-
1,183 1,281
1,312 1,333
1,307 1,408
1,446 1,404
1,461 1,417
1,555 1,541
1,637 1,674
1,763 1,887
2,093
8.2 8.9 9.1 9.1 8.9
9.5 9.7 9.4 9.7 9.4 10.3 10.1
10.7 11.2
11.7 12.4 13.7
0
2
4
6
8
10
12
14
0
500
1,000
1,500
2,000
2,500
1Q17 3Q17
1Q18 3Q18
1Q19 3Q19
1Q20 3Q20
1Q21
Skill-Related Under-Employed - Number ('000, LHS)
Skill-Related Under-Employment - % Share of Total Employment (5)
0
5
10
15
20
25
30
1Q18 2Q18 3Q18 4Q18 1Q19 2Q19 3Q19 4Q19 1Q20 2Q20 3Q20 4Q20 1Q21
% YoY % QoQ
23,697
40,084
107,024
8,877
20,176
50,408
33,783
0
20,000
40,000
60,000
80,000
100,000
120,000
2018 2019 2020 1H 2018 1H 2019 1H 2020 1H 2021
(6)
(4)
(2)
0
2
4
6
8
10
1Q 201
4
3Q 201
4
1Q 201
5
3Q 201
5
1Q 201
6
3Q 201
6
1Q 201
7
3Q 201
7
1Q 201
8
3Q 201
8
1Q 201
9
3Q 201
9
1Q 202
0
3Q 202
0
1Q 202
1
July 4, 2021 10
Strategy Research
date4 i.e. MYR19.6b under i-Lestari and MYR57.97b under i-Sinar, with potential
additional MYR30b from the latest withdrawal scheme i-Citra.
At the same time, household income in the plantation sector is buoyed by the high
crude palm oil (CPO) prices (6M2021: MYR4,067 per tonne; 2020: MYR2,781 per
tonne).
In addition, to boost discretionary consumer spending, the Government extended
for the second time the stamp duty and sales tax exemptions for purchases of
residential property and cars respectively until end-Dec 2021. These exemptions
were first introduced under the “PENJANA” economic stimulus package back in
June 2020. And under the “PERMAI” economic stimulus package in Jan 2021, the
Government extended the special MYR2,500 personal income tax relief for
purchases of mobile phones, computers and tablets until 31 Dec 2021 following its
expiry on 31 Dec 2020.
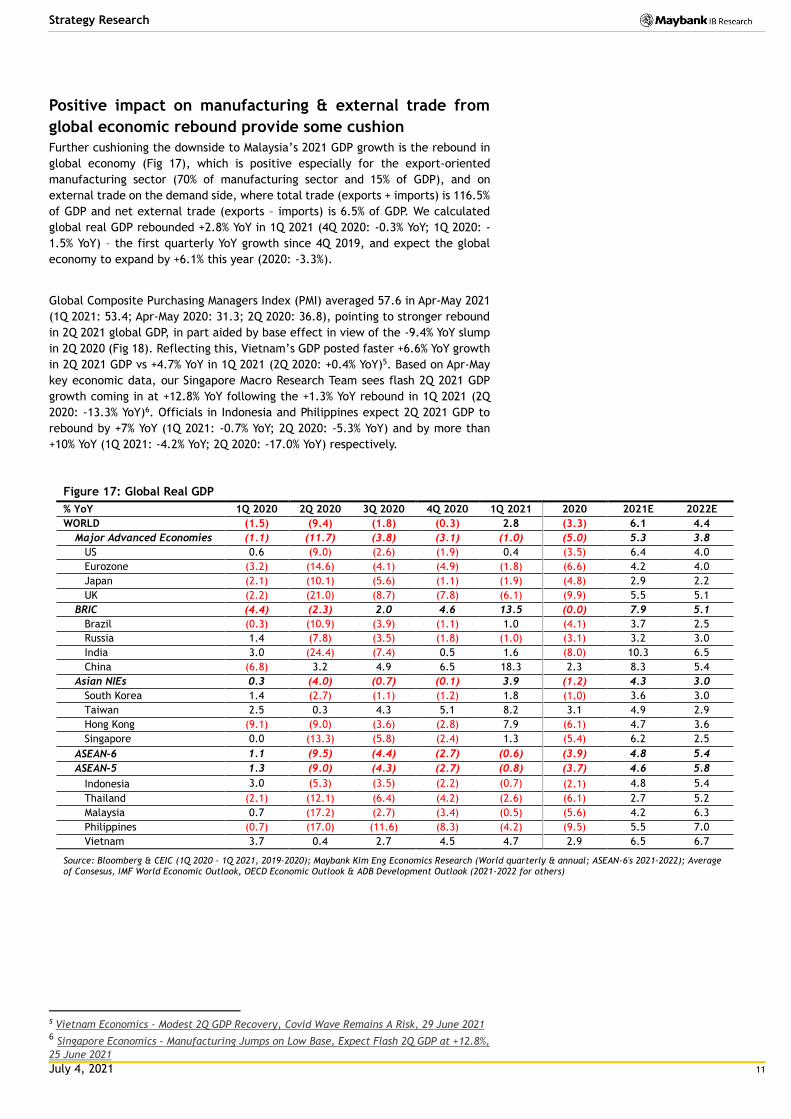
There is also the prospect of “pent-up” consumer spending by the “cashed-up”
individuals later in the year – and more so next year – as economy re-opens
following rising vaccinations that is targeted to reach the targeted 80% population
coverage by Dec 2021. The fuel for the “pent-up” spending is the “cashed-up”
consumers as implied by the surge in banking system’s savings and demand deposits
held by individuals (Fig 16) to levels well above what it could have been (dotted
red line) had there been no pandemic and the deposits continued to grow at the
same pace as the immediate pre-COVID19 months.
Figure 16: Malaysia – Individuals’ Savings & Demand Deposits in the Banking System (MYRb)
Note: Dotted red line refers to estimated individuals’ savings & demand deposits since Jan 2020 assuming 3.2% YoY monthly growth (i.e. the average in 2017-2019)
Source: BNM, Maybank Kim Eng
4 Ministry of Finance’s LAKSANA Report #52, 6 May 2021 & EPF CEO interview with
theEdge, 24 June 2021
200
210
220
230
240
250
260
270
280
290
300
310
Jan-1
8
Mar-
18
May-1
8
Jul-
18
Sep-1
8
Nov-1
8
Jan-1
9
Mar-
19
May-1
9
Jul-
19
Sep-1
9
Nov-1
9
Jan-2
0
Mar-
20
May-2
0
Jul-
20
Sep-2
0
Nov-2
0
Jan-2
1
Mar-
21
May-2
1
July 4, 2021 11
Strategy Research
Positive impact on manufacturing & external trade from
global economic rebound provide some cushion
Further cushioning the downside to Malaysia’s 2021 GDP growth is the rebound in
global economy (Fig 17), which is positive especially for the export-oriented
manufacturing sector (70% of manufacturing sector and 15% of GDP), and on
external trade on the demand side, where total trade (exports + imports) is 116.5%
of GDP and net external trade (exports – imports) is 6.5% of GDP. We calculated
global real GDP rebounded +2.8% YoY in 1Q 2021 (4Q 2020: -0.3% YoY; 1Q 2020: -
1.5% YoY) – the first quarterly YoY growth since 4Q 2019, and expect the global
economy to expand by +6.1% this year (2020: -3.3%).
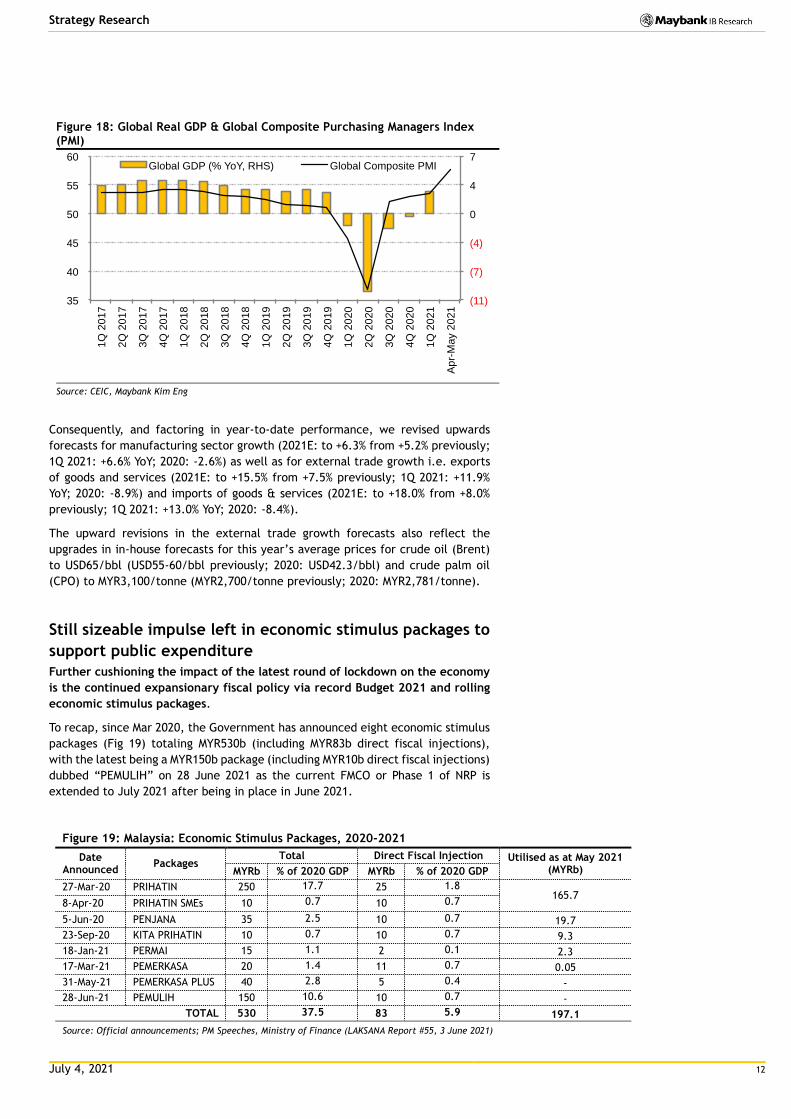
Global Composite Purchasing Managers Index (PMI) averaged 57.6 in Apr-May 2021
(1Q 2021: 53.4; Apr-May 2020: 31.3; 2Q 2020: 36.8), pointing to stronger rebound
in 2Q 2021 global GDP, in part aided by base effect in view of the -9.4% YoY slump
in 2Q 2020 (Fig 18). Reflecting this, Vietnam’s GDP posted faster +6.6% YoY growth
in 2Q 2021 GDP vs +4.7% YoY in 1Q 2021 (2Q 2020: +0.4% YoY)5. Based on Apr-May
key economic data, our Singapore Macro Research Team sees flash 2Q 2021 GDP
growth coming in at +12.8% YoY following the +1.3% YoY rebound in 1Q 2021 (2Q
2020: -13.3% YoY)6. Officials in Indonesia and Philippines expect 2Q 2021 GDP to
rebound by +7% YoY (1Q 2021: -0.7% YoY; 2Q 2020: -5.3% YoY) and by more than
+10% YoY (1Q 2021: -4.2% YoY; 2Q 2020: -17.0% YoY) respectively.
Figure 17: Global Real GDP
% YoY 1Q 2020 2Q 2020 3Q 2020 4Q 2020 1Q 2021 2020 2021E 2022E
WORLD (1.5) (9.4) (1.8) (0.3) 2.8 (3.3) 6.1 4.4
Major Advanced Economies (1.1) (11.7) (3.8) (3.1) (1.0) (5.0) 5.3 3.8
US 0.6 (9.0) (2.6) (1.9) 0.4 (3.5) 6.4 4.0
Eurozone (3.2) (14.6) (4.1) (4.9) (1.8) (6.6) 4.2 4.0
Japan (2.1) (10.1) (5.6) (1.1) (1.9) (4.8) 2.9 2.2
UK (2.2) (21.0) (8.7) (7.8) (6.1) (9.9) 5.5 5.1
BRIC (4.4) (2.3) 2.0 4.6 13.5 (0.0) 7.9 5.1
Brazil (0.3) (10.9) (3.9) (1.1) 1.0 (4.1) 3.7 2.5
Russia 1.4 (7.8) (3.5) (1.8) (1.0) (3.1) 3.2 3.0
India 3.0 (24.4) (7.4) 0.5 1.6 (8.0) 10.3 6.5
China (6.8) 3.2 4.9 6.5 18.3 2.3 8.3 5.4
Asian NIEs 0.3 (4.0) (0.7) (0.1) 3.9 (1.2) 4.3 3.0
South Korea 1.4 (2.7) (1.1) (1.2) 1.8 (1.0) 3.6 3.0
Taiwan 2.5 0.3 4.3 5.1 8.2 3.1 4.9 2.9
Hong Kong (9.1) (9.0) (3.6) (2.8) 7.9 (6.1) 4.7 3.6
Singapore 0.0 (13.3) (5.8) (2.4) 1.3 (5.4) 6.2 2.5
ASEAN-6 1.1 (9.5) (4.4) (2.7) (0.6) (3.9) 4.8 5.4
ASEAN-5 1.3 (9.0) (4.3) (2.7) (0.8) (3.7) 4.6 5.8
Indonesia 3.0 (5.3) (3.5) (2.2) (0.7) (2.1) 4.8 5.4
Thailand (2.1) (12.1) (6.4) (4.2) (2.6) (6.1) 2.7 5.2
Malaysia 0.7 (17.2) (2.7) (3.4) (0.5) (5.6) 4.2 6.3
Philippines (0.7) (17.0) (11.6) (8.3) (4.2) (9.5) 5.5 7.0
Vietnam 3.7 0.4 2.7 4.5 4.7 2.9 6.5 6.7
Source: Bloomberg & CEIC (1Q 2020 - 1Q 2021, 2019-2020); Maybank Kim Eng Economics Research (World quarterly & annual; ASEAN-6's 2021-2022); Average of Consesus, IMF World Economic Outlook, OECD Economic Outlook & ADB Development Outlook (2021-2022 for others)
5 Vietnam Economics - Modest 2Q GDP Recovery, Covid Wave Remains A Risk, 29 June 2021 6 Singapore Economics - Manufacturing Jumps on Low Base, Expect Flash 2Q GDP at +12.8%,
25 June 2021
July 4, 2021 12
Strategy Research
Figure 18: Global Real GDP & Global Composite Purchasing Managers Index (PMI)
Source: CEIC, Maybank Kim Eng
Consequently, and factoring in year-to-date performance, we revised upwards
forecasts for manufacturing sector growth (2021E: to +6.3% from +5.2% previously;
1Q 2021: +6.6% YoY; 2020: -2.6%) as well as for external trade growth i.e. exports
of goods and services (2021E: to +15.5% from +7.5% previously; 1Q 2021: +11.9%
YoY; 2020: -8.9%) and imports of goods & services (2021E: to +18.0% from +8.0%
previously; 1Q 2021: +13.0% YoY; 2020: -8.4%).
The upward revisions in the external trade growth forecasts also reflect the
upgrades in in-house forecasts for this year’s average prices for crude oil (Brent)
to USD65/bbl (USD55-60/bbl previously; 2020: USD42.3/bbl) and crude palm oil
(CPO) to MYR3,100/tonne (MYR2,700/tonne previously; 2020: MYR2,781/tonne).
Still sizeable impulse left in economic stimulus packages to
support public expenditure
Further cushioning the impact of the latest round of lockdown on the economy
is the continued expansionary fiscal policy via record Budget 2021 and rolling
economic stimulus packages.
To recap, since Mar 2020, the Government has announced eight economic stimulus
packages (Fig 19) totaling MYR530b (including MYR83b direct fiscal injections),
with the latest being a MYR150b package (including MYR10b direct fiscal injections)
dubbed “PEMULIH” on 28 June 2021 as the current FMCO or Phase 1 of NRP is
extended to July 2021 after being in place in June 2021.
Figure 19: Malaysia: Economic Stimulus Packages, 2020-2021
Date Announced
Packages Total Direct Fiscal Injection Utilised as at May 2021
(MYRb) MYRb % of 2020 GDP MYRb % of 2020 GDP
27-Mar-20 PRIHATIN 250 17.7 25 1.8 165.7
8-Apr-20 PRIHATIN SMEs 10 0.7 10 0.7
5-Jun-20 PENJANA 35 2.5 10 0.7 19.7
23-Sep-20 KITA PRIHATIN 10 0.7 10 0.7 9.3
18-Jan-21 PERMAI 15 1.1 2 0.1 2.3
17-Mar-21 PEMERKASA 20 1.4 11 0.7 0.05
31-May-21 PEMERKASA PLUS 40 2.8 5 0.4 -
28-Jun-21 PEMULIH 150 10.6 10 0.7 -
TOTAL 530 37.5 83 5.9 197.1
Source: Official announcements; PM Speeches, Ministry of Finance (LAKSANA Report #55, 3 June 2021)
(11)
(7)
(4)
0
4
7
35
40
45
50
55
60
1Q
20
17
2Q
20
17
3Q
20
17
4Q
20
17
1Q
20
18
2Q
20
18
3Q
20
18
4Q
20
18
1Q
20
19
2Q
20
19
3Q
20
19
4Q
20
19
1Q
20
20
2Q
20
20
3Q
20
20
4Q
20
20
1Q
20
21
Ap
r-M
ay 2
021
Global GDP (% YoY, RHS) Global Composite PMI
July 4, 2021 13
Strategy Research
62% of the total MYR530b economic stimulus packages still available after 38%
disbursed since 2020 up to June 2021. According to the Ministry of Finance, as
of May 2021, almost 60% of the measures and initiatives in the first six economic
stimulus packages totaling MYR340b have been implemented and MYR197.1b have
been disbursed7, with the latest tally at over MYR200b as of June 2021 according
to PM Speech when announcing the PEMULIH economic stimulus package on 28
June 2021. Thus there are around MYR330b left the total MYR530b from the eight
stimulus packages announced to-date.
Plus MYR185.5b or 57.5% of Budget 2021 spending allocation - and MYR17b or
26% of COVID-19 Fund - to be utilized. Further, of the record-high MYR322.5b
Budget 2021 total expenditure allocation, with MYR137b or 42.5% spent in Jan-May
2021, there are still MYR185.5b or 57.5% left for the rest of the year. In addition,
on the approved total for COVID-19 Fund of MYR65b, after the MYR38b spent in
2020 and MYR10b used in Jan-Apr 2021, there are MYR17b available which we
expect to be fully utilized by end-2021.
We estimated every MYR100b of these stimuli can boost GDP by 1.1-1.2 ppts.
Consequently, in view of the still sizeable positive impulse left from Budget
2021, economic stimulus packages and COVID-19 Fund, we raised our growth
forecasts for Government consumption (2021E: to +5.0% from +2.8% previously;
1Q 2021: +5.9% YoY; 2020: +3.9%) and maintain the mid-teen public investment
growth projection (2021E: +15.3%; 1Q 2021: -18.6% YoY; 2020: -21.4%). These take
into account of the implied acceleration in growth of Federal Government’s
operating and development expenditures in 2Q-4Q 2021 averaging +16.2% YoY (1Q
2021: +0.2% YoY) and +68.6% YoY per quarter (1Q 2021: +34.9% YoY) respectively.
Public investment is also supported by the on-going major infrastructure projects
as well as the rollout of digital infrastructure capex.
We also changed our 2021 budget deficit forecast to 6.8% of GDP from 6.0% of
GDP previously (note: original Budget 2021 target was 5.4% of GDP), factoring
in the additional direct fiscal injection from the latest economic stimulus package;
revenue and denominator impact of the downward revision in this year’s GDP
growth; and upsides to oil-related income from higher crude oil price assumption
(note: our sensitivity analysis showed every USD10/bbl increase in annual average
crude oil price can lift Government’s oil tax revenues by MYR4b and Petronas
dividend by MYR3.4b).
Private investment on the mend
We cut our private investment growth forecast for this year to +4.1% from
+6.3% previously (2020: -11.9%) amid the challenging business and operating
environment given the ins-and-outs of MCOs.
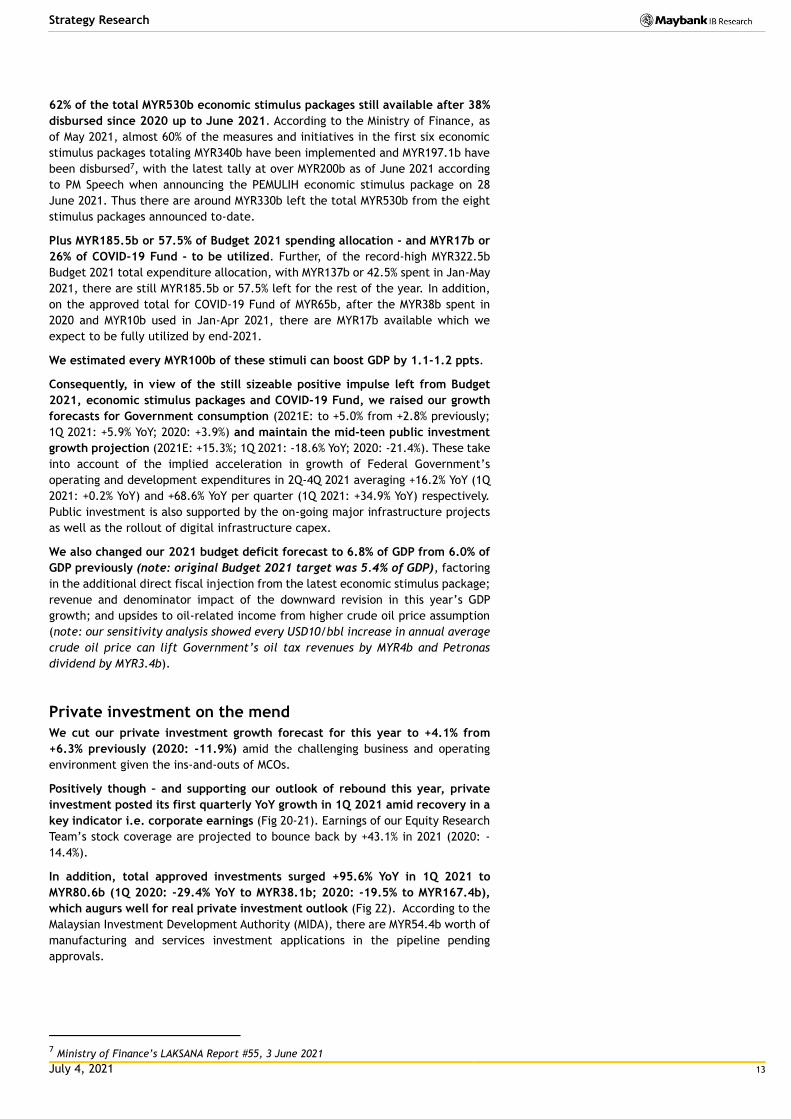
Positively though – and supporting our outlook of rebound this year, private
investment posted its first quarterly YoY growth in 1Q 2021 amid recovery in a
key indicator i.e. corporate earnings (Fig 20-21). Earnings of our Equity Research
Team’s stock coverage are projected to bounce back by +43.1% in 2021 (2020: -
14.4%).
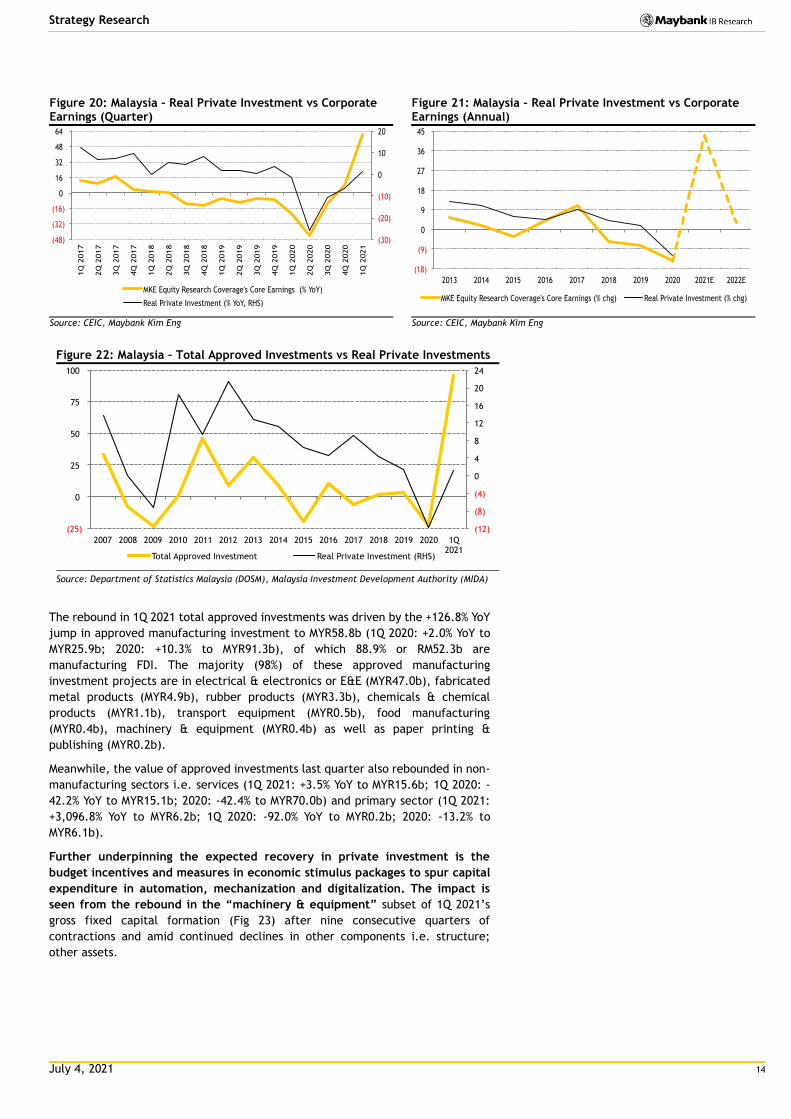
In addition, total approved investments surged +95.6% YoY in 1Q 2021 to
MYR80.6b (1Q 2020: -29.4% YoY to MYR38.1b; 2020: -19.5% to MYR167.4b),
which augurs well for real private investment outlook (Fig 22). According to the
Malaysian Investment Development Authority (MIDA), there are MYR54.4b worth of
manufacturing and services investment applications in the pipeline pending
approvals.
7 Ministry of Finance’s LAKSANA Report #55, 3 June 2021
July 4, 2021 14
Strategy Research
Figure 20: Malaysia – Real Private Investment vs Corporate Earnings (Quarter)
Figure 21: Malaysia – Real Private Investment vs Corporate Earnings (Annual)
Source: CEIC, Maybank Kim Eng Source: CEIC, Maybank Kim Eng
Figure 22: Malaysia – Total Approved Investments vs Real Private Investments
Source: Department of Statistics Malaysia (DOSM), Malaysia Investment Development Authority (MIDA)
The rebound in 1Q 2021 total approved investments was driven by the +126.8% YoY
jump in approved manufacturing investment to MYR58.8b (1Q 2020: +2.0% YoY to
MYR25.9b; 2020: +10.3% to MYR91.3b), of which 88.9% or RM52.3b are
manufacturing FDI. The majority (98%) of these approved manufacturing
investment projects are in electrical & electronics or E&E (MYR47.0b), fabricated
metal products (MYR4.9b), rubber products (MYR3.3b), chemicals & chemical
products (MYR1.1b), transport equipment (MYR0.5b), food manufacturing
(MYR0.4b), machinery & equipment (MYR0.4b) as well as paper printing &
publishing (MYR0.2b).
Meanwhile, the value of approved investments last quarter also rebounded in non-
manufacturing sectors i.e. services (1Q 2021: +3.5% YoY to MYR15.6b; 1Q 2020: -
42.2% YoY to MYR15.1b; 2020: -42.4% to MYR70.0b) and primary sector (1Q 2021:
+3,096.8% YoY to MYR6.2b; 1Q 2020: -92.0% YoY to MYR0.2b; 2020: -13.2% to
MYR6.1b).
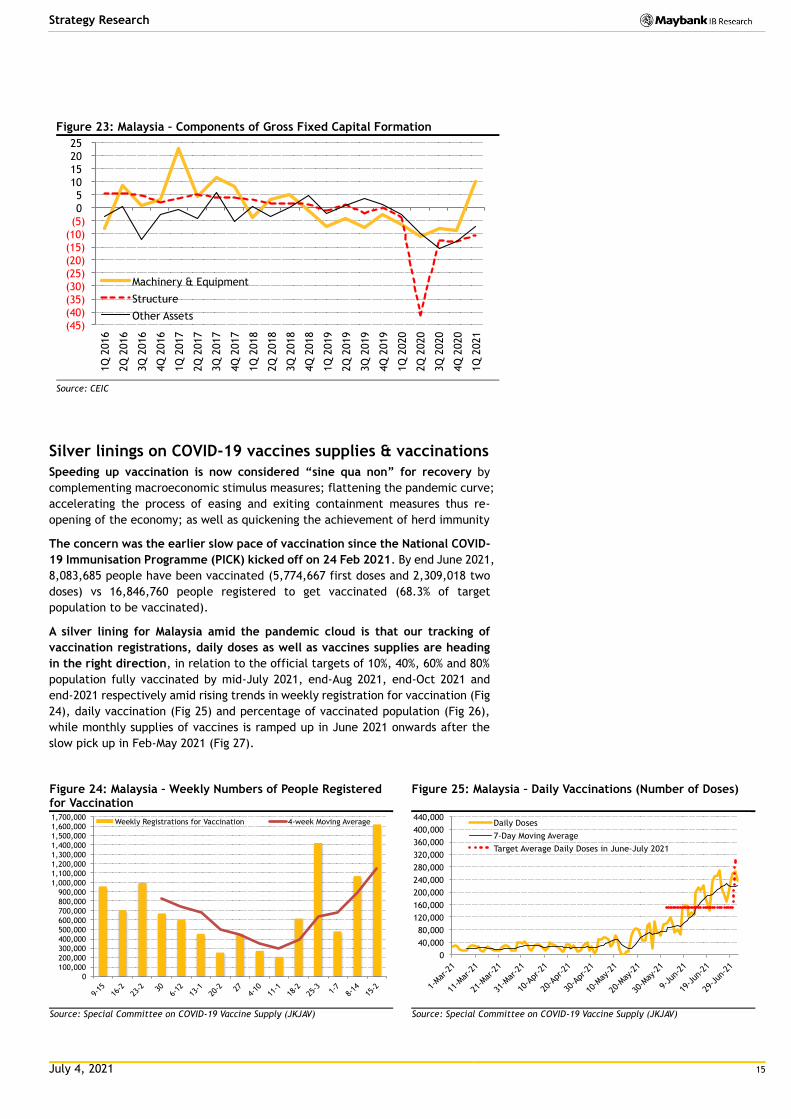
Further underpinning the expected recovery in private investment is the
budget incentives and measures in economic stimulus packages to spur capital
expenditure in automation, mechanization and digitalization. The impact is
seen from the rebound in the “machinery & equipment” subset of 1Q 2021’s
gross fixed capital formation (Fig 23) after nine consecutive quarters of
contractions and amid continued declines in other components i.e. structure;
other assets.
(30)
(20)
(10)
0
10
20
(48)
(32)
(16)
0
16
32
48
64
1Q
2017
2Q
2017
3Q
2017
4Q
2017
1Q
2018
2Q
2018
3Q
2018
4Q
2018
1Q
2019
2Q
2019
3Q
2019
4Q
2019
1Q
2020
2Q
2020
3Q
2020
4Q
2020
1Q
2021
MKE Equity Research Coverage's Core Earnings (% YoY)
Real Private Investment (% YoY, RHS)
(18)
(9)
0
9
18
27
36
45
2013 2014 2015 2016 2017 2018 2019 2020 2021E 2022E
MKE Equity Research Coverage's Core Earnings (% chg) Real Private Investment (% chg)
(12)
(8)
(4)
0
4
8
12
16
20
24
(25)
0
25
50
75
100
2007 2008 2009 2010 2011 2012 2013 2014 2015 2016 2017 2018 2019 2020 1Q 2021
Total Approved Investment Real Private Investment (RHS)
July 4, 2021 15
Strategy Research
Figure 23: Malaysia – Components of Gross Fixed Capital Formation
Source: CEIC
Silver linings on COVID-19 vaccines supplies & vaccinations
Speeding up vaccination is now considered “sine qua non” for recovery by
complementing macroeconomic stimulus measures; flattening the pandemic curve;
accelerating the process of easing and exiting containment measures thus re-
opening of the economy; as well as quickening the achievement of herd immunity
The concern was the earlier slow pace of vaccination since the National COVID-
19 Immunisation Programme (PICK) kicked off on 24 Feb 2021. By end June 2021,
8,083,685 people have been vaccinated (5,774,667 first doses and 2,309,018 two
doses) vs 16,846,760 people registered to get vaccinated (68.3% of target
population to be vaccinated).
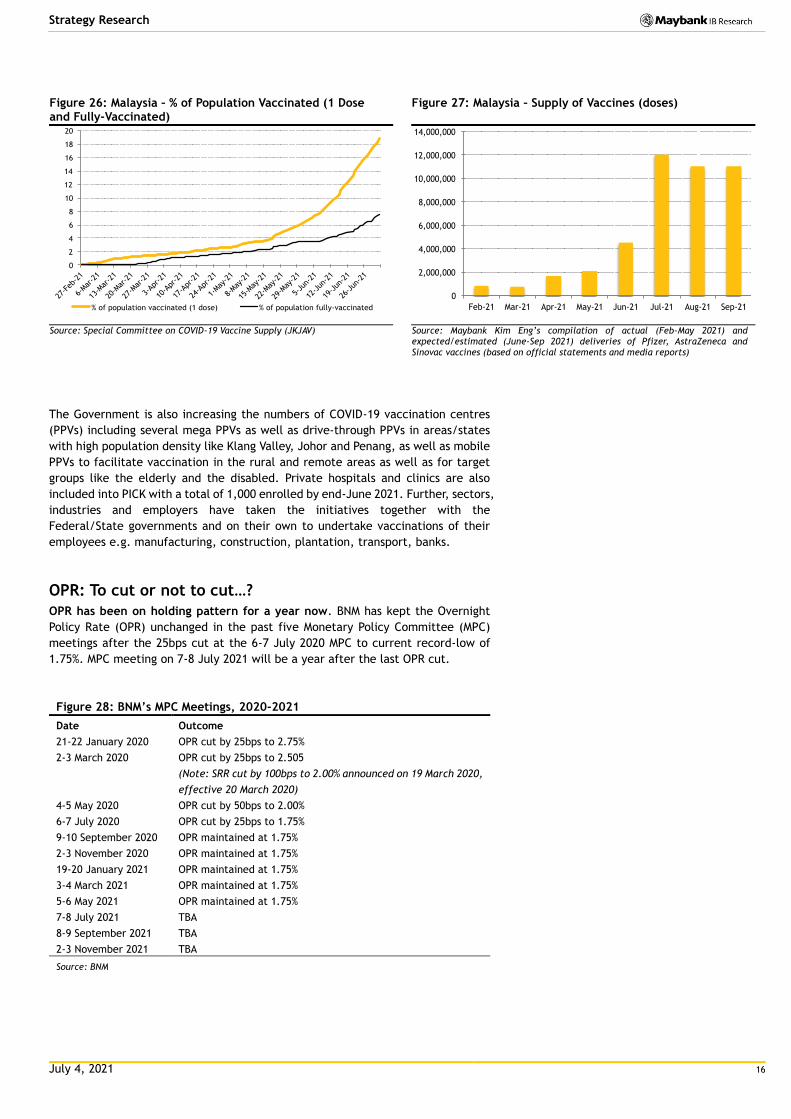
A silver lining for Malaysia amid the pandemic cloud is that our tracking of
vaccination registrations, daily doses as well as vaccines supplies are heading
in the right direction, in relation to the official targets of 10%, 40%, 60% and 80%
population fully vaccinated by mid-July 2021, end-Aug 2021, end-Oct 2021 and
end-2021 respectively amid rising trends in weekly registration for vaccination (Fig
24), daily vaccination (Fig 25) and percentage of vaccinated population (Fig 26),
while monthly supplies of vaccines is ramped up in June 2021 onwards after the
slow pick up in Feb-May 2021 (Fig 27).
Figure 24: Malaysia – Weekly Numbers of People Registered for Vaccination
Figure 25: Malaysia – Daily Vaccinations (Number of Doses)
Source: Special Committee on COVID-19 Vaccine Supply (JKJAV) Source: Special Committee on COVID-19 Vaccine Supply (JKJAV)
(45)
(40)
(35)
(30)
(25)
(20)
(15)
(10)
(5)
0
5
10
15
20
25
1Q
2016
2Q
2016
3Q
2016
4Q
2016
1Q
2017
2Q
2017
3Q
2017
4Q
2017
1Q
2018
2Q
2018
3Q
2018
4Q
2018
1Q
2019
2Q
2019
3Q
2019
4Q
2019
1Q
2020
2Q
2020
3Q
2020
4Q
2020
1Q
2021
Machinery & Equipment
Structure
Other Assets
0
100,000
200,000
300,000
400,000
500,000
600,000
700,000
800,000
900,000
1,000,000
1,100,000
1,200,000
1,300,000
1,400,000
1,500,000
1,600,000
1,700,000
9-15
16-2
23-2 30
6-12
13-1
20-2 27
4-10
11-1
18-2
25-3 1-
7
8-14
15-2
Weekly Registrations for Vaccination 4-week Moving Average
0
40,000
80,000
120,000
160,000
200,000
240,000
280,000
320,000
360,000
400,000
440,000
1-Mar
-21
11-M
ar-2
1
21-M
ar-2
1
31-M
ar-2
1
10-A
pr-2
1
20-A
pr-2
1
30-A
pr-2
1
10-M
ay-2
1
20-M
ay-2
1
30-M
ay-2
1
9-Ju
n-21
19-J
un-2
1
29-J
un-2
1
Daily Doses
7-Day Moving Average
Target Average Daily Doses in June-July 2021
July 4, 2021 16
Strategy Research
Figure 26: Malaysia – % of Population Vaccinated (1 Dose and Fully-Vaccinated)
Figure 27: Malaysia – Supply of Vaccines (doses)
Source: Special Committee on COVID-19 Vaccine Supply (JKJAV) Source: Maybank Kim Eng’s compilation of actual (Feb-May 2021) and expected/estimated (June-Sep 2021) deliveries of Pfizer, AstraZeneca and Sinovac vaccines (based on official statements and media reports)
The Government is also increasing the numbers of COVID-19 vaccination centres
(PPVs) including several mega PPVs as well as drive-through PPVs in areas/states
with high population density like Klang Valley, Johor and Penang, as well as mobile
PPVs to facilitate vaccination in the rural and remote areas as well as for target
groups like the elderly and the disabled. Private hospitals and clinics are also
included into PICK with a total of 1,000 enrolled by end-June 2021. Further, sectors,
industries and employers have taken the initiatives together with the
Federal/State governments and on their own to undertake vaccinations of their
employees e.g. manufacturing, construction, plantation, transport, banks.
OPR: To cut or not to cut…?
OPR has been on holding pattern for a year now. BNM has kept the Overnight
Policy Rate (OPR) unchanged in the past five Monetary Policy Committee (MPC)
meetings after the 25bps cut at the 6-7 July 2020 MPC to current record-low of
1.75%. MPC meeting on 7-8 July 2021 will be a year after the last OPR cut.
Figure 28: BNM’s MPC Meetings, 2020-2021
Date Outcome
21-22 January 2020 OPR cut by 25bps to 2.75%
2-3 March 2020 OPR cut by 25bps to 2.505
(Note: SRR cut by 100bps to 2.00% announced on 19 March 2020,
effective 20 March 2020)
4-5 May 2020 OPR cut by 50bps to 2.00%
6-7 July 2020 OPR cut by 25bps to 1.75%
9-10 September 2020 OPR maintained at 1.75%
2-3 November 2020 OPR maintained at 1.75%
19-20 January 2021 OPR maintained at 1.75%
3-4 March 2021 OPR maintained at 1.75%
5-6 May 2021 OPR maintained at 1.75%
7-8 July 2021 TBA
8-9 September 2021 TBA
2-3 November 2021 TBA
Source: BNM
0
2
4
6
8
10
12
14
16
18
20
27-F
eb-2
1
6-Mar
-21
13-M
ar-2
1
20-M
ar-2
1
27-M
ar-2
1
3-Ap
r-21
10-A
pr-2
1
17-A
pr-2
1
24-A
pr-2
1
1-May
-21
8-May
-21
15-M
ay-2
1
22-M
ay-2
1
29-M
ay-2
1
5-Ju
n-21
12-J
un-2
1
19-J
un-2
1
26-J
un-2
1
% of population vaccinated (1 dose) % of population fully-vaccinated
0
2,000,000
4,000,000
6,000,000
8,000,000
10,000,000
12,000,000
14,000,000
Feb-21 Mar-21 Apr-21 May-21 Jun-21 Jul-21 Aug-21 Sep-21
July 4, 2021 17
Strategy Research
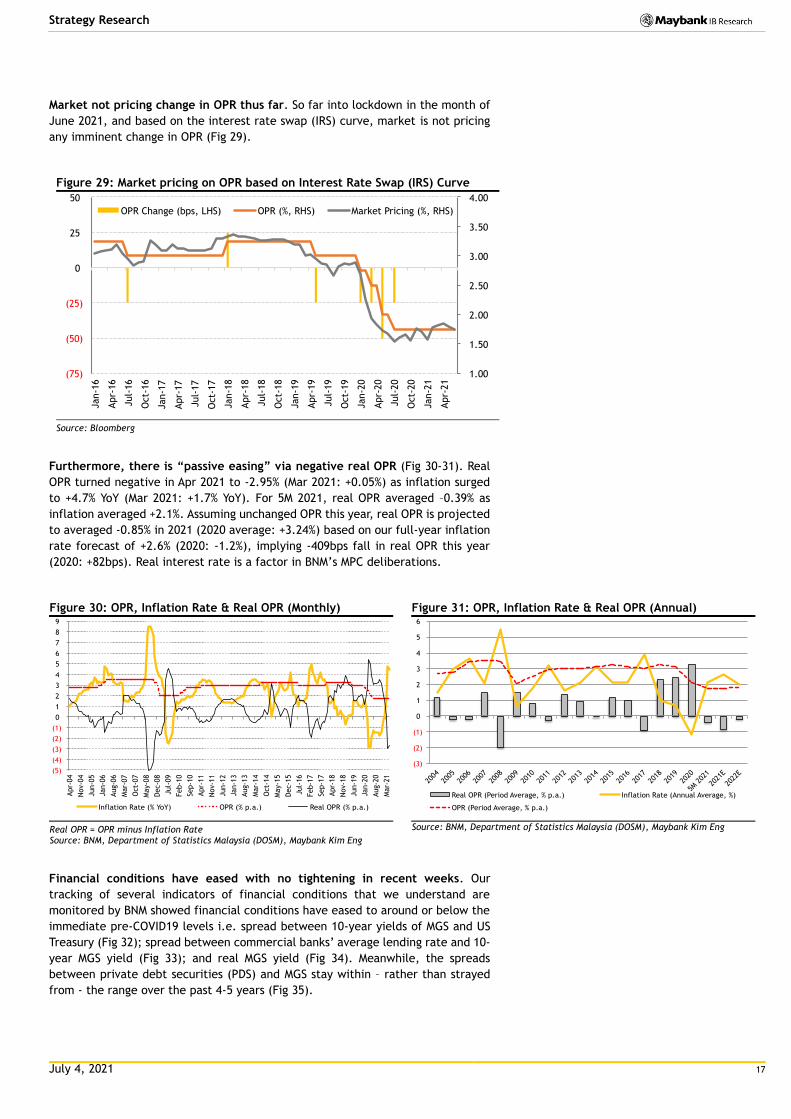
Market not pricing change in OPR thus far. So far into lockdown in the month of
June 2021, and based on the interest rate swap (IRS) curve, market is not pricing
any imminent change in OPR (Fig 29).
Figure 29: Market pricing on OPR based on Interest Rate Swap (IRS) Curve
Source: Bloomberg
Furthermore, there is “passive easing” via negative real OPR (Fig 30-31). Real
OPR turned negative in Apr 2021 to -2.95% (Mar 2021: +0.05%) as inflation surged
to +4.7% YoY (Mar 2021: +1.7% YoY). For 5M 2021, real OPR averaged –0.39% as
inflation averaged +2.1%. Assuming unchanged OPR this year, real OPR is projected
to averaged -0.85% in 2021 (2020 average: +3.24%) based on our full-year inflation
rate forecast of +2.6% (2020: -1.2%), implying -409bps fall in real OPR this year
(2020: +82bps). Real interest rate is a factor in BNM’s MPC deliberations.
Figure 30: OPR, Inflation Rate & Real OPR (Monthly) Figure 31: OPR, Inflation Rate & Real OPR (Annual)
Real OPR = OPR minus Inflation Rate Source: BNM, Department of Statistics Malaysia (DOSM), Maybank Kim Eng
Source: BNM, Department of Statistics Malaysia (DOSM), Maybank Kim Eng
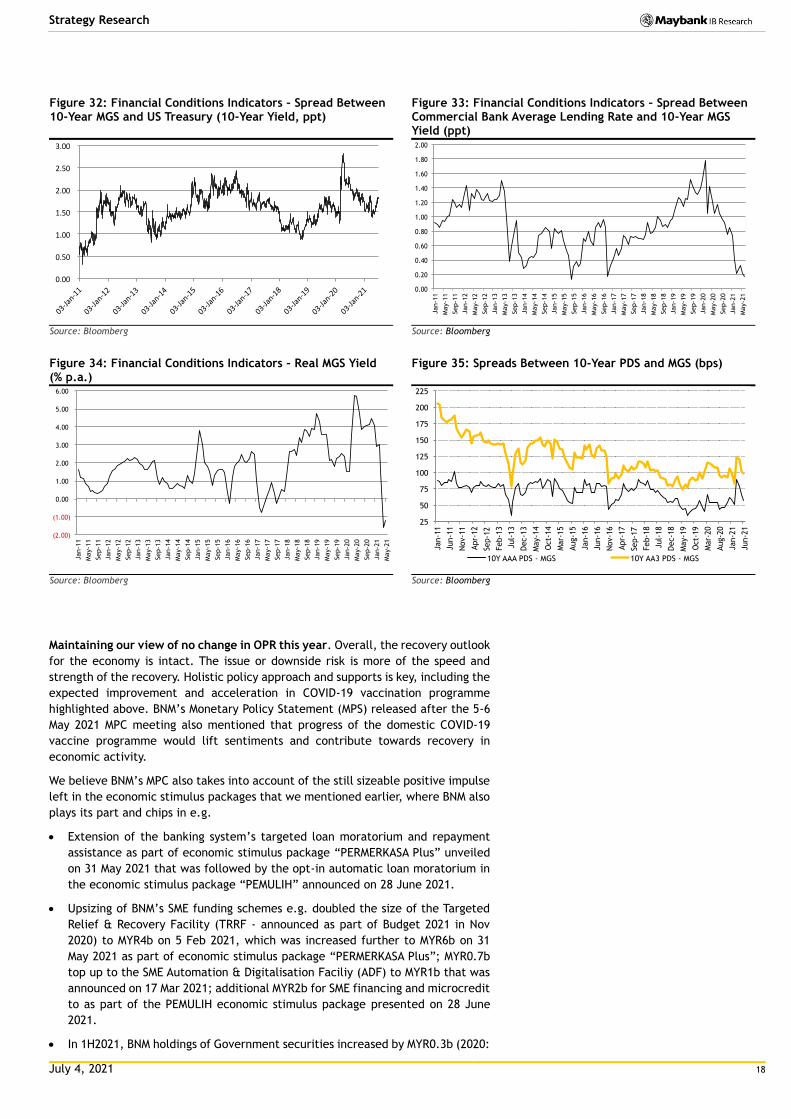
Financial conditions have eased with no tightening in recent weeks. Our
tracking of several indicators of financial conditions that we understand are
monitored by BNM showed financial conditions have eased to around or below the
immediate pre-COVID19 levels i.e. spread between 10-year yields of MGS and US
Treasury (Fig 32); spread between commercial banks’ average lending rate and 10-
year MGS yield (Fig 33); and real MGS yield (Fig 34). Meanwhile, the spreads
between private debt securities (PDS) and MGS stay within – rather than strayed
from - the range over the past 4-5 years (Fig 35).
1.00
1.50
2.00
2.50
3.00
3.50
4.00
(75)
(50)
(25)
0
25
50
Jan-1
6
Apr-
16
Jul-
16
Oct-
16
Jan-1
7
Apr-
17
Jul-
17
Oct-
17
Jan-1
8
Apr-
18
Jul-
18
Oct-
18
Jan-1
9
Apr-
19
Jul-
19
Oct-
19
Jan-2
0
Apr-
20
Jul-
20
Oct-
20
Jan-2
1
Apr-
21
OPR Change (bps, LHS) OPR (%, RHS) Market Pricing (%, RHS)
(5)
(4)
(3)
(2)
(1)
0
1
2
3
4
5
6
7
8
9
Apr-
04
Nov-
04
Jun-0
5
Jan-0
6
Aug-0
6
Mar-
07
Oct-
07
May-0
8
Dec-0
8
Jul-
09
Feb-1
0
Sep-1
0
Apr-
11
Nov-
11
Jun-1
2
Jan-1
3
Aug-1
3
Mar-
14
Oct-
14
May-1
5
Dec-1
5
Jul-
16
Feb-1
7
Sep-1
7
Apr-
18
Nov-
18
Jun-1
9
Jan-2
0
Aug-2
0
Mar-
21
Inflation Rate (% YoY) OPR (% p.a.) Real OPR (% p.a.)
(3)
(2)
(1)
0
1
2
3
4
5
6
2004
2005
2006
2007
2008
2009
2010
2011
2012
2013
2014
2015
2016
2017
2018
2019
2020
5M 202
1
2021
E
2022
E
Real OPR (Period Average, % p.a.) Inflation Rate (Annual Average, %)
OPR (Period Average, % p.a.)
July 4, 2021 18
Strategy Research
Figure 32: Financial Conditions Indicators – Spread Between 10-Year MGS and US Treasury (10-Year Yield, ppt)
Figure 33: Financial Conditions Indicators – Spread Between Commercial Bank Average Lending Rate and 10-Year MGS Yield (ppt)
Source: Bloomberg Source: Bloomberg
Figure 34: Financial Conditions Indicators – Real MGS Yield (% p.a.)
Figure 35: Spreads Between 10-Year PDS and MGS (bps)
Source: Bloomberg Source: Bloomberg
Maintaining our view of no change in OPR this year. Overall, the recovery outlook
for the economy is intact. The issue or downside risk is more of the speed and
strength of the recovery. Holistic policy approach and supports is key, including the
expected improvement and acceleration in COVID-19 vaccination programme
highlighted above. BNM’s Monetary Policy Statement (MPS) released after the 5-6
May 2021 MPC meeting also mentioned that progress of the domestic COVID-19
vaccine programme would lift sentiments and contribute towards recovery in
economic activity.
We believe BNM’s MPC also takes into account of the still sizeable positive impulse
left in the economic stimulus packages that we mentioned earlier, where BNM also
plays its part and chips in e.g.
Extension of the banking system’s targeted loan moratorium and repayment
assistance as part of economic stimulus package “PERMERKASA Plus” unveiled
on 31 May 2021 that was followed by the opt-in automatic loan moratorium in
the economic stimulus package “PEMULIH” announced on 28 June 2021.
Upsizing of BNM’s SME funding schemes e.g. doubled the size of the Targeted
Relief & Recovery Facility (TRRF - announced as part of Budget 2021 in Nov
2020) to MYR4b on 5 Feb 2021, which was increased further to MYR6b on 31
May 2021 as part of economic stimulus package “PERMERKASA Plus”; MYR0.7b
top up to the SME Automation & Digitalisation Faciliy (ADF) to MYR1b that was
announced on 17 Mar 2021; additional MYR2b for SME financing and microcredit
to as part of the PEMULIH economic stimulus package presented on 28 June
2021.
In 1H2021, BNM holdings of Government securities increased by MYR0.3b (2020:
0.00
0.50
1.00
1.50
2.00
2.50
3.00
03-Jan-11
03-Jan-12
03-Jan-13
03-Jan-14
03-Jan-15
03-Jan-16
03-Jan-17
03-Jan-18
03-Jan-19
03-Jan-20
03-Jan-21 0.00
0.20
0.40
0.60
0.80
1.00
1.20
1.40
1.60
1.80
2.00
Jan-1
1
May-1
1
Sep-1
1
Jan-1
2
May-1
2
Sep-1
2
Jan-1
3
May-1
3
Sep-1
3
Jan-1
4
May-1
4
Sep-1
4
Jan-1
5
May-1
5
Sep-1
5
Jan-1
6
May-1
6
Sep-1
6
Jan-1
7
May-1
7
Sep-1
7
Jan-1
8
May-1
8
Sep-1
8
Jan-1
9
May-1
9
Sep-1
9
Jan-2
0
May-2
0
Sep-2
0
Jan-2
1
May-2
1
(2.00)
(1.00)
0.00
1.00
2.00
3.00
4.00
5.00
6.00
Jan-1
1
May-1
1
Sep-1
1
Jan-1
2
May-1
2
Sep-1
2
Jan-1
3
May-1
3
Sep-1
3
Jan-1
4
May-1
4
Sep-1
4
Jan-1
5
May-1
5
Sep-1
5
Jan-1
6
May-1
6
Sep-1
6
Jan-1
7
May-1
7
Sep-1
7
Jan-1
8
May-1
8
Sep-1
8
Jan-1
9
May-1
9
Sep-1
9
Jan-2
0
May-2
0
Sep-2
0
Jan-2
1
May-2
1
25
50
75
100
125
150
175
200
225
Jan-1
1
Jun-1
1
Nov-
11
Apr-
12
Sep-1
2
Feb-1
3
Jul-
13
Dec-1
3
May-1
4
Oct-
14
Mar-
15
Aug-1
5
Jan-1
6
Jun-1
6
Nov-
16
Apr-
17
Sep-1
7
Feb-1
8
Jul-
18
Dec-1
8
May-1
9
Oct-
19
Mar-
20
Aug-2
0
Jan-2
1
Jun-2
1
10Y AAA PDS - MGS 10Y AA3 PDS - MGS
July 4, 2021 19
Strategy Research
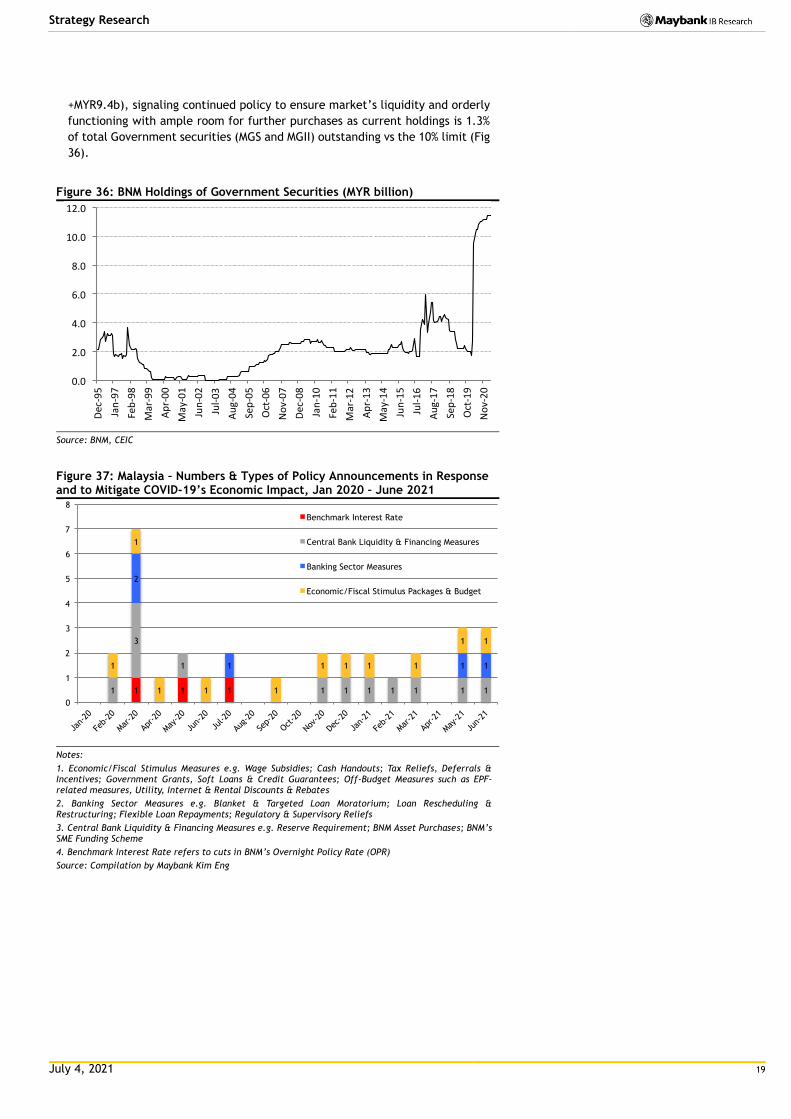
+MYR9.4b), signaling continued policy to ensure market’s liquidity and orderly
functioning with ample room for further purchases as current holdings is 1.3%
of total Government securities (MGS and MGII) outstanding vs the 10% limit (Fig
36).
Figure 36: BNM Holdings of Government Securities (MYR billion)
Source: BNM, CEIC
Figure 37: Malaysia – Numbers & Types of Policy Announcements in Response and to Mitigate COVID-19’s Economic Impact, Jan 2020 – June 2021
Notes:
1. Economic/Fiscal Stimulus Measures e.g. Wage Subsidies; Cash Handouts; Tax Reliefs, Deferrals & Incentives; Government Grants, Soft Loans & Credit Guarantees; Off-Budget Measures such as EPF-related measures, Utility, Internet & Rental Discounts & Rebates
2. Banking Sector Measures e.g. Blanket & Targeted Loan Moratorium; Loan Rescheduling & Restructuring; Flexible Loan Repayments; Regulatory & Supervisory Reliefs
3. Central Bank Liquidity & Financing Measures e.g. Reserve Requirement; BNM Asset Purchases; BNM’s SME Funding Scheme
4. Benchmark Interest Rate refers to cuts in BNM’s Overnight Policy Rate (OPR)
Source: Compilation by Maybank Kim Eng
0.0
2.0
4.0
6.0
8.0
10.0
12.0
Dec-95
Jan-97
Feb-98
Mar-99
Apr-00
May-01
Jun-02
Jul-03
Aug-04
Sep-05
Oct-06
Nov-07
Dec-08
Jan-10
Feb-11
Mar-12
Apr-13
May-14
Jun-15
Jul-16
Aug-17
Sep-18
Oct-19
Nov-20
1 1 1 1
3
1
1 1 1 1 1 1 1
2
1 1 1 1
1
1 1 1
1 1 1 1
1 1
0
1
2
3
4
5
6
7
8
Jan-
20
Feb-
20
Mar
-20
Apr-20
May
-20
Jun-
20
Jul-2
0
Aug-
20
Sep-
20
Oct-2
0
Nov-2
0
Dec-
20
Jan-
21
Feb-
21
Mar
-21
Apr-21
May
-21
Jun-
21
Benchmark Interest Rate
Central Bank Liquidity & Financing Measures
Banking Sector Measures
Economic/Fiscal Stimulus Packages & Budget

July 4, 2021 20
Strategy Research
EQUITIES
July 4, 2021
ST
RAT
EG
Y
Mala
ysi
a
July 4, 2021 21
2H 2021 Outlook and Lookouts
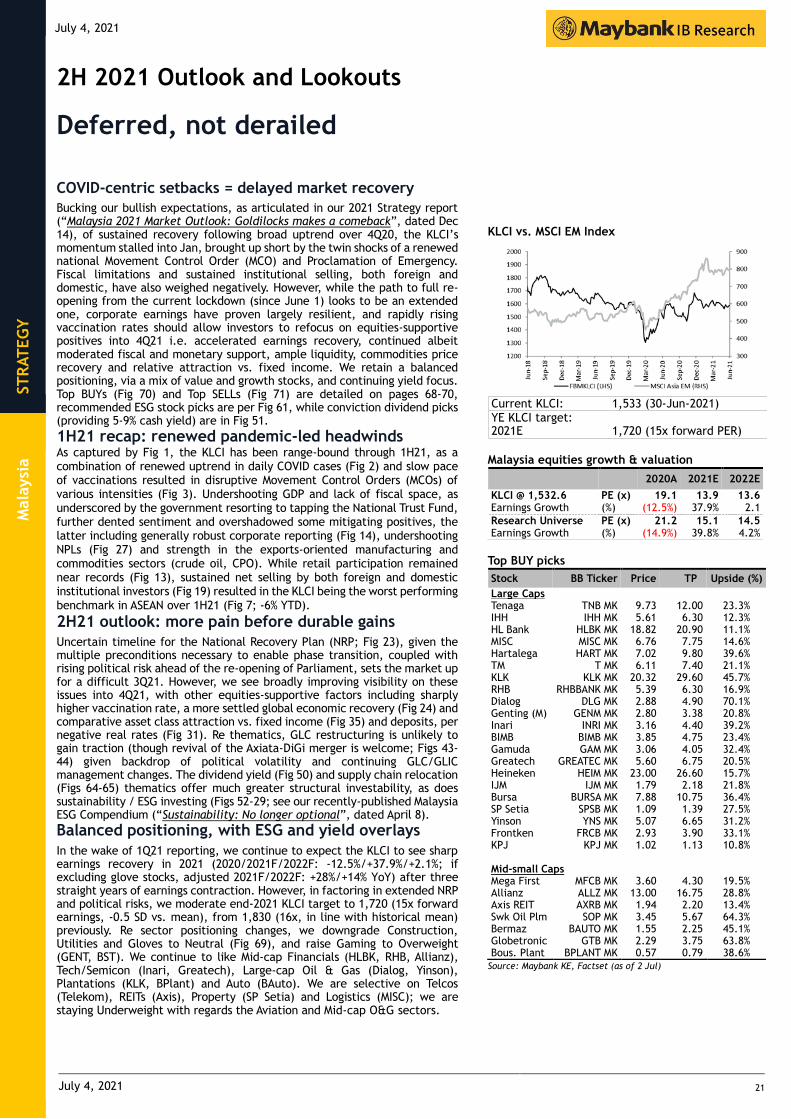
Deferred, not derailed
COVID-centric setbacks = delayed market recovery
Bucking our bullish expectations, as articulated in our 2021 Strategy report (“Malaysia 2021 Market Outlook: Goldilocks makes a comeback”, dated Dec 14), of sustained recovery following broad uptrend over 4Q20, the KLCI’s momentum stalled into Jan, brought up short by the twin shocks of a renewed national Movement Control Order (MCO) and Proclamation of Emergency. Fiscal limitations and sustained institutional selling, both foreign and domestic, have also weighed negatively. However, while the path to full re-opening from the current lockdown (since June 1) looks to be an extended one, corporate earnings have proven largely resilient, and rapidly rising vaccination rates should allow investors to refocus on equities-supportive positives into 4Q21 i.e. accelerated earnings recovery, continued albeit moderated fiscal and monetary support, ample liquidity, commodities price recovery and relative attraction vs. fixed income. We retain a balanced positioning, via a mix of value and growth stocks, and continuing yield focus. Top BUYs (Fig 70) and Top SELLs (Fig 71) are detailed on pages 68-70, recommended ESG stock picks are per Fig 61, while conviction dividend picks (providing 5-9% cash yield) are in Fig 51.
1H21 recap: renewed pandemic-led headwinds As captured by Fig 1, the KLCI has been range-bound through 1H21, as a combination of renewed uptrend in daily COVID cases (Fig 2) and slow pace of vaccinations resulted in disruptive Movement Control Orders (MCOs) of various intensities (Fig 3). Undershooting GDP and lack of fiscal space, as underscored by the government resorting to tapping the National Trust Fund, further dented sentiment and overshadowed some mitigating positives, the latter including generally robust corporate reporting (Fig 14), undershooting NPLs (Fig 27) and strength in the exports-oriented manufacturing and commodities sectors (crude oil, CPO). While retail participation remained near records (Fig 13), sustained net selling by both foreign and domestic institutional investors (Fig 19) resulted in the KLCI being the worst performing benchmark in ASEAN over 1H21 (Fig 7; -6% YTD).
2H21 outlook: more pain before durable gains
Uncertain timeline for the National Recovery Plan (NRP; Fig 23), given the multiple preconditions necessary to enable phase transition, coupled with rising political risk ahead of the re-opening of Parliament, sets the market up for a difficult 3Q21. However, we see broadly improving visibility on these issues into 4Q21, with other equities-supportive factors including sharply higher vaccination rate, a more settled global economic recovery (Fig 24) and comparative asset class attraction vs. fixed income (Fig 35) and deposits, per negative real rates (Fig 31). Re thematics, GLC restructuring is unlikely to gain traction (though revival of the Axiata-DiGi merger is welcome; Figs 43-44) given backdrop of political volatility and continuing GLC/GLIC management changes. The dividend yield (Fig 50) and supply chain relocation (Figs 64-65) thematics offer much greater structural investability, as does sustainability / ESG investing (Figs 52-29; see our recently-published Malaysia ESG Compendium (“Sustainability: No longer optional”, dated April 8).
Balanced positioning, with ESG and yield overlays
In the wake of 1Q21 reporting, we continue to expect the KLCI to see sharp earnings recovery in 2021 (2020/2021F/2022F: -12.5%/+37.9%/+2.1%; if excluding glove stocks, adjusted 2021F/2022F: +28%/+14% YoY) after three straight years of earnings contraction. However, in factoring in extended NRP and political risks, we moderate end-2021 KLCI target to 1,720 (15x forward earnings, -0.5 SD vs. mean), from 1,830 (16x, in line with historical mean) previously. Re sector positioning changes, we downgrade Construction, Utilities and Gloves to Neutral (Fig 69), and raise Gaming to Overweight (GENT, BST). We continue to like Mid-cap Financials (HLBK, RHB, Allianz), Tech/Semicon (Inari, Greatech), Large-cap Oil & Gas (Dialog, Yinson), Plantations (KLK, BPlant) and Auto (BAuto). We are selective on Telcos (Telekom), REITs (Axis), Property (SP Setia) and Logistics (MISC); we are staying Underweight with regards the Aviation and Mid-cap O&G sectors.
KLCI vs. MSCI EM Index
Current KLCI: 1,533 (30-Jun-2021) YE KLCI target: 2021E 1,720 (15x forward PER)
Malaysia equities growth & valuation
2020A 2021E 2022E
KLCI @ 1,532.6 PE (x) 19.1 13.9 13.6 Earnings Growth (%) (12.5%) 37.9% 2.1
Research Universe PE (x) 21.2 15.1 14.5 Earnings Growth (%) (14.9%) 39.8% 4.2%
Top BUY picks
Stock BB Ticker Price TP Upside (%)
Large Caps Tenaga TNB MK 9.73 12.00 23.3% IHH IHH MK 5.61 6.30 12.3% HL Bank HLBK MK 18.82 20.90 11.1% MISC MISC MK 6.76 7.75 14.6% Hartalega HART MK 7.02 9.80 39.6% TM T MK 6.11 7.40 21.1% KLK KLK MK 20.32 29.60 45.7% RHB RHBBANK MK 5.39 6.30 16.9% Dialog DLG MK 2.88 4.90 70.1% Genting (M) GENM MK 2.80 3.38 20.8% Inari INRI MK 3.16 4.40 39.2% BIMB BIMB MK 3.85 4.75 23.4% Gamuda GAM MK 3.06 4.05 32.4% Greatech GREATEC MK 5.60 6.75 20.5% Heineken HEIM MK 23.00 26.60 15.7% IJM IJM MK 1.79 2.18 21.8% Bursa BURSA MK 7.88 10.75 36.4% SP Setia SPSB MK 1.09 1.39 27.5% Yinson YNS MK 5.07 6.65 31.2% Frontken FRCB MK 2.93 3.90 33.1% KPJ KPJ MK 1.02 1.13 10.8% Mid-small Caps Mega First MFCB MK 3.60 4.30 19.5% Allianz ALLZ MK 13.00 16.75 28.8% Axis REIT AXRB MK 1.94 2.20 13.4% Swk Oil Plm SOP MK 3.45 5.67 64.3% Bermaz BAUTO MK 1.55 2.25 45.1% Globetronic GTB MK 2.29 3.75 63.8% Bous. Plant BPLANT MK 0.57 0.79 38.6%
Source: Maybank KE, Factset (as of 2 Jul)
July 4, 2021 22
Strategy Research
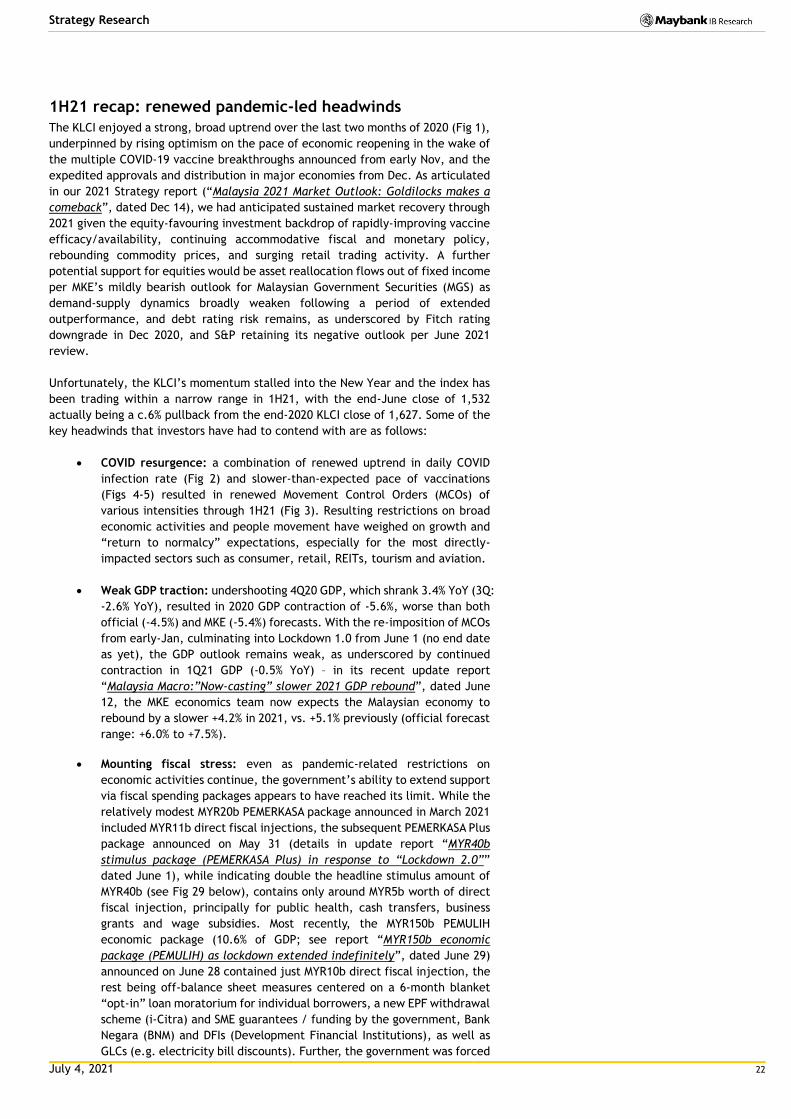
1H21 recap: renewed pandemic-led headwinds
The KLCI enjoyed a strong, broad uptrend over the last two months of 2020 (Fig 1),
underpinned by rising optimism on the pace of economic reopening in the wake of
the multiple COVID-19 vaccine breakthroughs announced from early Nov, and the
expedited approvals and distribution in major economies from Dec. As articulated
in our 2021 Strategy report (“Malaysia 2021 Market Outlook: Goldilocks makes a
comeback”, dated Dec 14), we had anticipated sustained market recovery through
2021 given the equity-favouring investment backdrop of rapidly-improving vaccine
efficacy/availability, continuing accommodative fiscal and monetary policy,
rebounding commodity prices, and surging retail trading activity. A further
potential support for equities would be asset reallocation flows out of fixed income
per MKE’s mildly bearish outlook for Malaysian Government Securities (MGS) as
demand-supply dynamics broadly weaken following a period of extended
outperformance, and debt rating risk remains, as underscored by Fitch rating
downgrade in Dec 2020, and S&P retaining its negative outlook per June 2021
review.
Unfortunately, the KLCI’s momentum stalled into the New Year and the index has
been trading within a narrow range in 1H21, with the end-June close of 1,532
actually being a c.6% pullback from the end-2020 KLCI close of 1,627. Some of the
key headwinds that investors have had to contend with are as follows:
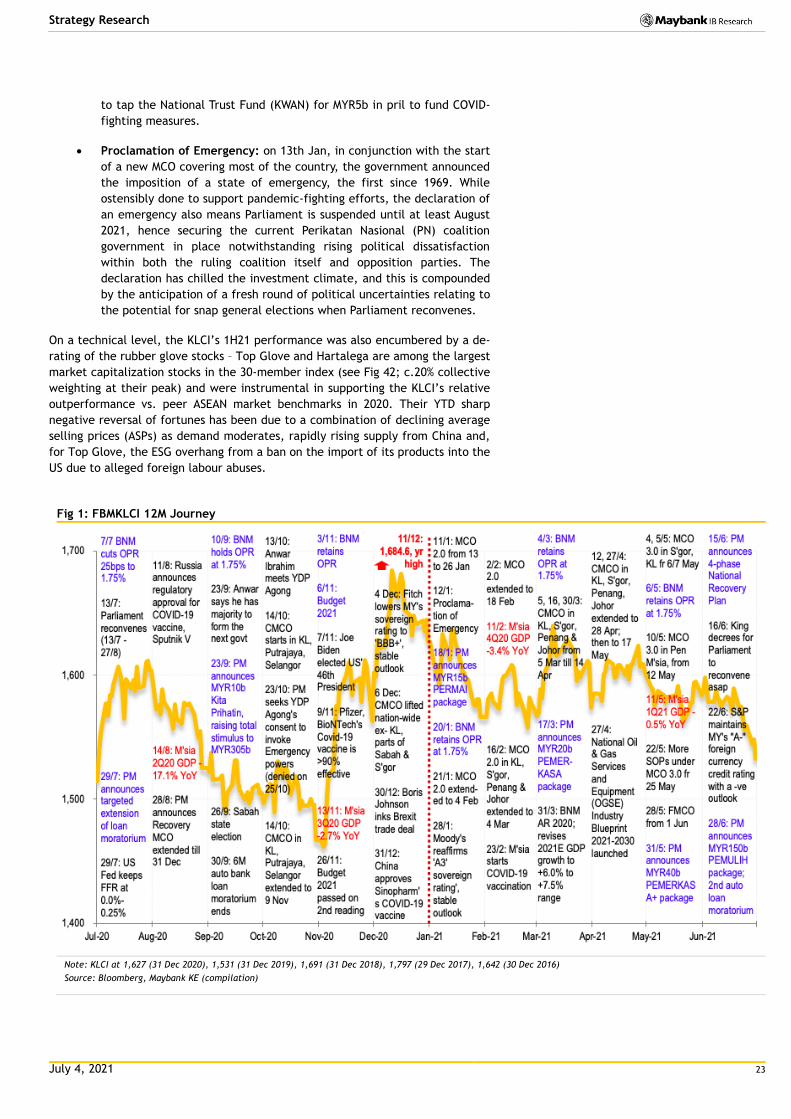
COVID resurgence: a combination of renewed uptrend in daily COVID
infection rate (Fig 2) and slower-than-expected pace of vaccinations
(Figs 4-5) resulted in renewed Movement Control Orders (MCOs) of
various intensities through 1H21 (Fig 3). Resulting restrictions on broad
economic activities and people movement have weighed on growth and
“return to normalcy” expectations, especially for the most directly-
impacted sectors such as consumer, retail, REITs, tourism and aviation.
Weak GDP traction: undershooting 4Q20 GDP, which shrank 3.4% YoY (3Q:
-2.6% YoY), resulted in 2020 GDP contraction of -5.6%, worse than both
official (-4.5%) and MKE (-5.4%) forecasts. With the re-imposition of MCOs
from early-Jan, culminating into Lockdown 1.0 from June 1 (no end date
as yet), the GDP outlook remains weak, as underscored by continued
contraction in 1Q21 GDP (-0.5% YoY) – in its recent update report
“Malaysia Macro:”Now-casting” slower 2021 GDP rebound”, dated June
12, the MKE economics team now expects the Malaysian economy to
rebound by a slower +4.2% in 2021, vs. +5.1% previously (official forecast
range: +6.0% to +7.5%).
Mounting fiscal stress: even as pandemic-related restrictions on
economic activities continue, the government’s ability to extend support
via fiscal spending packages appears to have reached its limit. While the
relatively modest MYR20b PEMERKASA package announced in March 2021
included MYR11b direct fiscal injections, the subsequent PEMERKASA Plus
package announced on May 31 (details in update report “MYR40b
stimulus package (PEMERKASA Plus) in response to “Lockdown 2.0””
dated June 1), while indicating double the headline stimulus amount of
MYR40b (see Fig 29 below), contains only around MYR5b worth of direct
fiscal injection, principally for public health, cash transfers, business
grants and wage subsidies. Most recently, the MYR150b PEMULIH
economic package (10.6% of GDP; see report “MYR150b economic
package (PEMULIH) as lockdown extended indefinitely”, dated June 29)
announced on June 28 contained just MYR10b direct fiscal injection, the
rest being off-balance sheet measures centered on a 6-month blanket
“opt-in” loan moratorium for individual borrowers, a new EPF withdrawal
scheme (i-Citra) and SME guarantees / funding by the government, Bank
Negara (BNM) and DFIs (Development Financial Institutions), as well as
GLCs (e.g. electricity bill discounts). Further, the government was forced
July 4, 2021 23
Strategy Research
to tap the National Trust Fund (KWAN) for MYR5b in pril to fund COVID-
fighting measures.
Proclamation of Emergency: on 13th Jan, in conjunction with the start
of a new MCO covering most of the country, the government announced
the imposition of a state of emergency, the first since 1969. While
ostensibly done to support pandemic-fighting efforts, the declaration of
an emergency also means Parliament is suspended until at least August
2021, hence securing the current Perikatan Nasional (PN) coalition
government in place notwithstanding rising political dissatisfaction
within both the ruling coalition itself and opposition parties. The
declaration has chilled the investment climate, and this is compounded
by the anticipation of a fresh round of political uncertainties relating to
the potential for snap general elections when Parliament reconvenes.
On a technical level, the KLCI’s 1H21 performance was also encumbered by a de-
rating of the rubber glove stocks – Top Glove and Hartalega are among the largest
market capitalization stocks in the 30-member index (see Fig 42; c.20% collective
weighting at their peak) and were instrumental in supporting the KLCI’s relative
outperformance vs. peer ASEAN market benchmarks in 2020. Their YTD sharp
negative reversal of fortunes has been due to a combination of declining average
selling prices (ASPs) as demand moderates, rapidly rising supply from China and,
for Top Glove, the ESG overhang from a ban on the import of its products into the
US due to alleged foreign labour abuses.
Fig 1: FBMKLCI 12M Journey
Note: KLCI at 1,627 (31 Dec 2020), 1,531 (31 Dec 2019), 1,691 (31 Dec 2018), 1,797 (29 Dec 2017), 1,642 (30 Dec 2016)
Source: Bloomberg, Maybank KE (compilation)
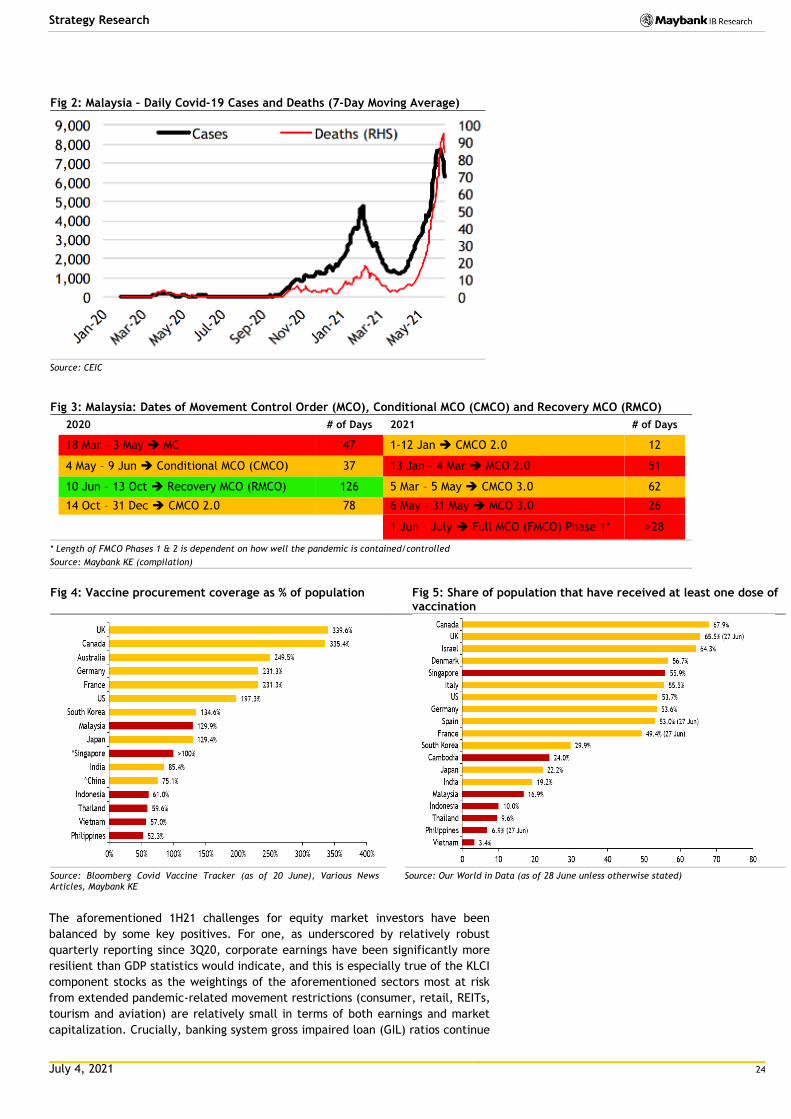
July 4, 2021 24
Strategy Research
Fig 2: Malaysia – Daily Covid-19 Cases and Deaths (7-Day Moving Average)
Source: CEIC
Fig 3: Malaysia: Dates of Movement Control Order (MCO), Conditional MCO (CMCO) and Recovery MCO (RMCO)
2020 # of Days 2021 # of Days
18 Mar – 3 May MC 47 1-12 Jan CMCO 2.0 12
4 May – 9 Jun Conditional MCO (CMCO) 37 13 Jan – 4 Mar MCO 2.0 51
10 Jun – 13 Oct Recovery MCO (RMCO) 126 5 Mar – 5 May CMCO 3.0 62
14 Oct – 31 Dec CMCO 2.0 78 6 May – 31 May MCO 3.0 26
1 Jun – July Full MCO (FMCO) Phase 1* >28
* Length of FMCO Phases 1 & 2 is dependent on how well the pandemic is contained/controlled
Source: Maybank KE (compilation)
Fig 4: Vaccine procurement coverage as % of population Fig 5: Share of population that have received at least one dose of
vaccination
Source: Bloomberg Covid Vaccine Tracker (as of 20 June), Various News Articles, Maybank KE
Source: Our World in Data (as of 28 June unless otherwise stated)
The aforementioned 1H21 challenges for equity market investors have been
balanced by some key positives. For one, as underscored by relatively robust
quarterly reporting since 3Q20, corporate earnings have been significantly more
resilient than GDP statistics would indicate, and this is especially true of the KLCI
component stocks as the weightings of the aforementioned sectors most at risk
from extended pandemic-related movement restrictions (consumer, retail, REITs,
tourism and aviation) are relatively small in terms of both earnings and market
capitalization. Crucially, banking system gross impaired loan (GIL) ratios continue
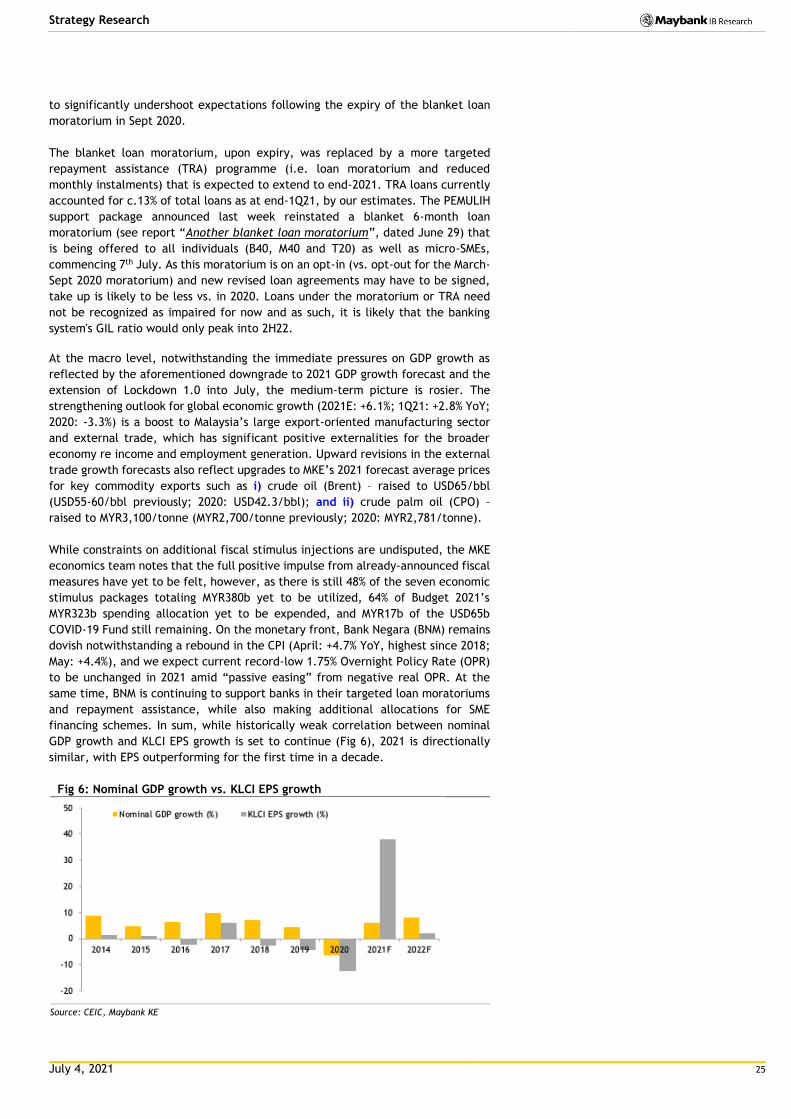
July 4, 2021 25
Strategy Research
to significantly undershoot expectations following the expiry of the blanket loan
moratorium in Sept 2020.
The blanket loan moratorium, upon expiry, was replaced by a more targeted
repayment assistance (TRA) programme (i.e. loan moratorium and reduced
monthly instalments) that is expected to extend to end-2021. TRA loans currently
accounted for c.13% of total loans as at end-1Q21, by our estimates. The PEMULIH
support package announced last week reinstated a blanket 6-month loan
moratorium (see report “Another blanket loan moratorium”, dated June 29) that
is being offered to all individuals (B40, M40 and T20) as well as micro-SMEs,
commencing 7th July. As this moratorium is on an opt-in (vs. opt-out for the March-
Sept 2020 moratorium) and new revised loan agreements may have to be signed,
take up is likely to be less vs. in 2020. Loans under the moratorium or TRA need
not be recognized as impaired for now and as such, it is likely that the banking
system's GIL ratio would only peak into 2H22.
At the macro level, notwithstanding the immediate pressures on GDP growth as
reflected by the aforementioned downgrade to 2021 GDP growth forecast and the
extension of Lockdown 1.0 into July, the medium-term picture is rosier. The
strengthening outlook for global economic growth (2021E: +6.1%; 1Q21: +2.8% YoY;
2020: -3.3%) is a boost to Malaysia’s large export-oriented manufacturing sector
and external trade, which has significant positive externalities for the broader
economy re income and employment generation. Upward revisions in the external
trade growth forecasts also reflect upgrades to MKE’s 2021 forecast average prices
for key commodity exports such as i) crude oil (Brent) – raised to USD65/bbl
(USD55-60/bbl previously; 2020: USD42.3/bbl); and ii) crude palm oil (CPO) –
raised to MYR3,100/tonne (MYR2,700/tonne previously; 2020: MYR2,781/tonne).
While constraints on additional fiscal stimulus injections are undisputed, the MKE
economics team notes that the full positive impulse from already-announced fiscal
measures have yet to be felt, however, as there is still 48% of the seven economic
stimulus packages totaling MYR380b yet to be utilized, 64% of Budget 2021’s
MYR323b spending allocation yet to be expended, and MYR17b of the USD65b
COVID-19 Fund still remaining. On the monetary front, Bank Negara (BNM) remains
dovish notwithstanding a rebound in the CPI (April: +4.7% YoY, highest since 2018;
May: +4.4%), and we expect current record-low 1.75% Overnight Policy Rate (OPR)
to be unchanged in 2021 amid “passive easing” from negative real OPR. At the
same time, BNM is continuing to support banks in their targeted loan moratoriums
and repayment assistance, while also making additional allocations for SME
financing schemes. In sum, while historically weak correlation between nominal
GDP growth and KLCI EPS growth is set to continue (Fig 6), 2021 is directionally
similar, with EPS outperforming for the first time in a decade.
Fig 6: Nominal GDP growth vs. KLCI EPS growth
Source: CEIC, Maybank KE
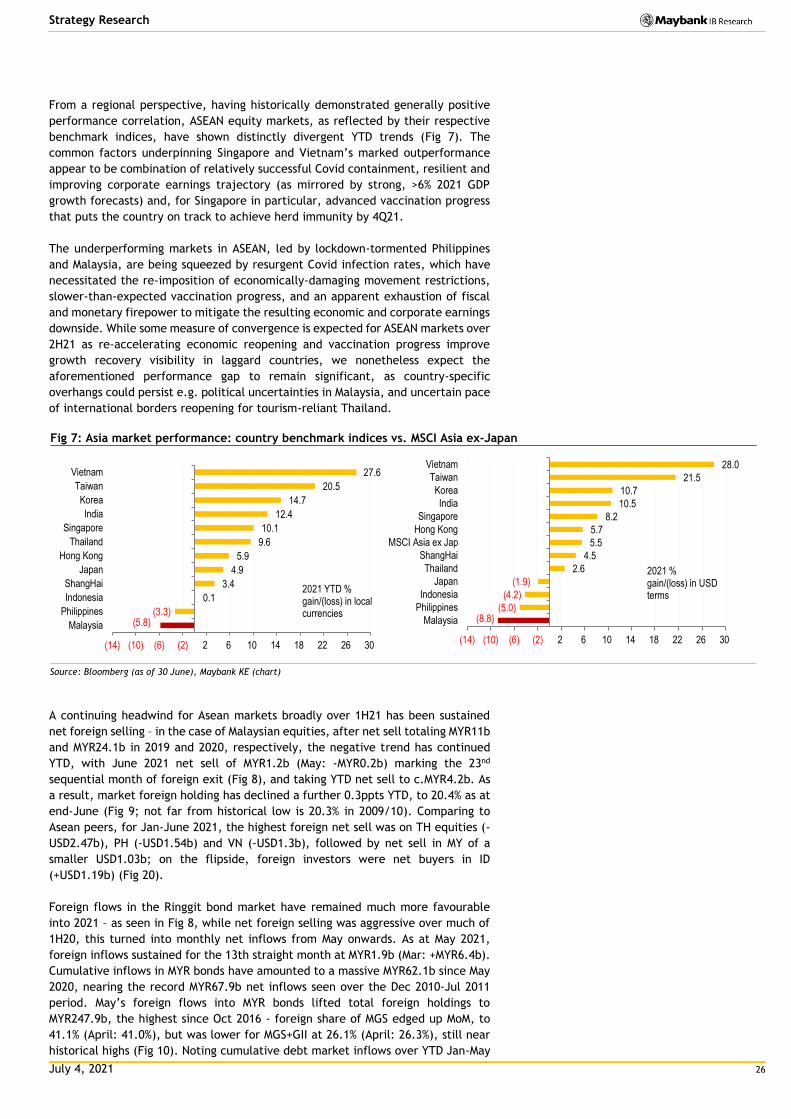
July 4, 2021 26
Strategy Research
From a regional perspective, having historically demonstrated generally positive
performance correlation, ASEAN equity markets, as reflected by their respective
benchmark indices, have shown distinctly divergent YTD trends (Fig 7). The
common factors underpinning Singapore and Vietnam’s marked outperformance
appear to be combination of relatively successful Covid containment, resilient and
improving corporate earnings trajectory (as mirrored by strong, >6% 2021 GDP
growth forecasts) and, for Singapore in particular, advanced vaccination progress
that puts the country on track to achieve herd immunity by 4Q21.
The underperforming markets in ASEAN, led by lockdown-tormented Philippines
and Malaysia, are being squeezed by resurgent Covid infection rates, which have
necessitated the re-imposition of economically-damaging movement restrictions,
slower-than-expected vaccination progress, and an apparent exhaustion of fiscal
and monetary firepower to mitigate the resulting economic and corporate earnings
downside. While some measure of convergence is expected for ASEAN markets over
2H21 as re-accelerating economic reopening and vaccination progress improve
growth recovery visibility in laggard countries, we nonetheless expect the
aforementioned performance gap to remain significant, as country-specific
overhangs could persist e.g. political uncertainties in Malaysia, and uncertain pace
of international borders reopening for tourism-reliant Thailand.
Fig 7: Asia market performance: country benchmark indices vs. MSCI Asia ex-Japan
Source: Bloomberg (as of 30 June), Maybank KE (chart)
A continuing headwind for Asean markets broadly over 1H21 has been sustained
net foreign selling – in the case of Malaysian equities, after net sell totaling MYR11b
and MYR24.1b in 2019 and 2020, respectively, the negative trend has continued
YTD, with June 2021 net sell of MYR1.2b (May: -MYR0.2b) marking the 23nd
sequential month of foreign exit (Fig 8), and taking YTD net sell to c.MYR4.2b. As
a result, market foreign holding has declined a further 0.3ppts YTD, to 20.4% as at
end-June (Fig 9; not far from historical low is 20.3% in 2009/10). Comparing to
Asean peers, for Jan-June 2021, the highest foreign net sell was on TH equities (-
USD2.47b), PH (-USD1.54b) and VN (-USD1.3b), followed by net sell in MY of a
smaller USD1.03b; on the flipside, foreign investors were net buyers in ID
(+USD1.19b) (Fig 20).
Foreign flows in the Ringgit bond market have remained much more favourable
into 2021 – as seen in Fig 8, while net foreign selling was aggressive over much of
1H20, this turned into monthly net inflows from May onwards. As at May 2021,
foreign inflows sustained for the 13th straight month at MYR1.9b (Mar: +MYR6.4b).
Cumulative inflows in MYR bonds have amounted to a massive MYR62.1b since May
2020, nearing the record MYR67.9b net inflows seen over the Dec 2010-Jul 2011
period. May’s foreign flows into MYR bonds lifted total foreign holdings to
MYR247.9b, the highest since Oct 2016 - foreign share of MGS edged up MoM, to
41.1% (April: 41.0%), but was lower for MGS+GII at 26.1% (April: 26.3%), still near
historical highs (Fig 10). Noting cumulative debt market inflows over YTD Jan-May
(5.8)(3.3)
0.1
3.4
4.9
5.9
9.6
10.1
12.4
14.7
20.5
27.6
(14) (10) (6) (2) 2 6 10 14 18 22 26 30
Malaysia
Philippines
Indonesia
ShangHai
Japan
Hong Kong
Thailand
Singapore
India
Korea
Taiwan
Vietnam
2021 YTD % gain/(loss) in local currencies
(8.8)(5.0)
(4.2)
(1.9)
2.6
4.5
5.5
5.7
8.2
10.5
10.7
21.5
28.0
(14) (10) (6) (2) 2 6 10 14 18 22 26 30
Malaysia
Philippines
Indonesia
Japan
Thailand
ShangHai
MSCI Asia ex Jap
Hong Kong
Singapore
India
Korea
Taiwan
Vietnam
2021 % gain/(loss) in USD terms
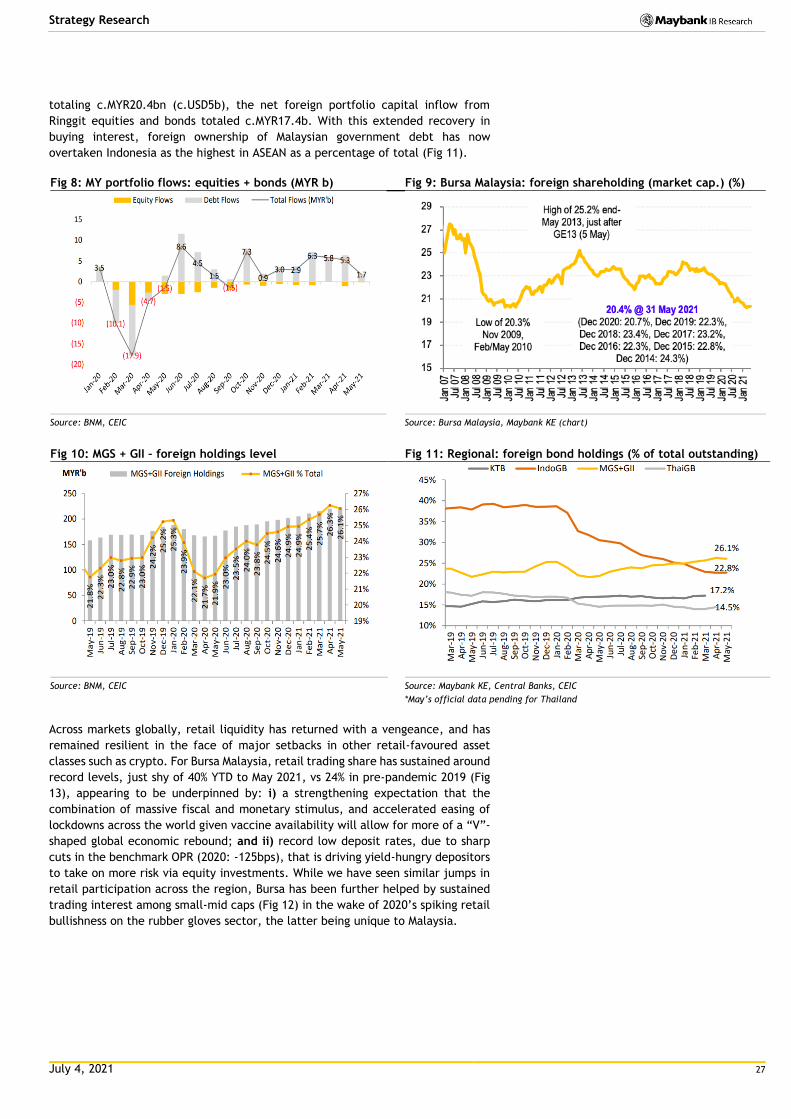
July 4, 2021 27
Strategy Research
totaling c.MYR20.4bn (c.USD5b), the net foreign portfolio capital inflow from
Ringgit equities and bonds totaled c.MYR17.4b. With this extended recovery in
buying interest, foreign ownership of Malaysian government debt has now
overtaken Indonesia as the highest in ASEAN as a percentage of total (Fig 11).
Fig 8: MY portfolio flows: equities + bonds (MYR b) Fig 9: Bursa Malaysia: foreign shareholding (market cap.) (%)
Source: BNM, CEIC Source: Bursa Malaysia, Maybank KE (chart)
Fig 10: MGS + GII – foreign holdings level Fig 11: Regional: foreign bond holdings (% of total outstanding)
Source: BNM, CEIC Source: Maybank KE, Central Banks, CEIC
*May’s official data pending for Thailand
Across markets globally, retail liquidity has returned with a vengeance, and has
remained resilient in the face of major setbacks in other retail-favoured asset
classes such as crypto. For Bursa Malaysia, retail trading share has sustained around
record levels, just shy of 40% YTD to May 2021, vs 24% in pre-pandemic 2019 (Fig
13), appearing to be underpinned by: i) a strengthening expectation that the
combination of massive fiscal and monetary stimulus, and accelerated easing of
lockdowns across the world given vaccine availability will allow for more of a “V”-
shaped global economic rebound; and ii) record low deposit rates, due to sharp
cuts in the benchmark OPR (2020: -125bps), that is driving yield-hungry depositors
to take on more risk via equity investments. While we have seen similar jumps in
retail participation across the region, Bursa has been further helped by sustained
trading interest among small-mid caps (Fig 12) in the wake of 2020’s spiking retail
bullishness on the rubber gloves sector, the latter being unique to Malaysia.
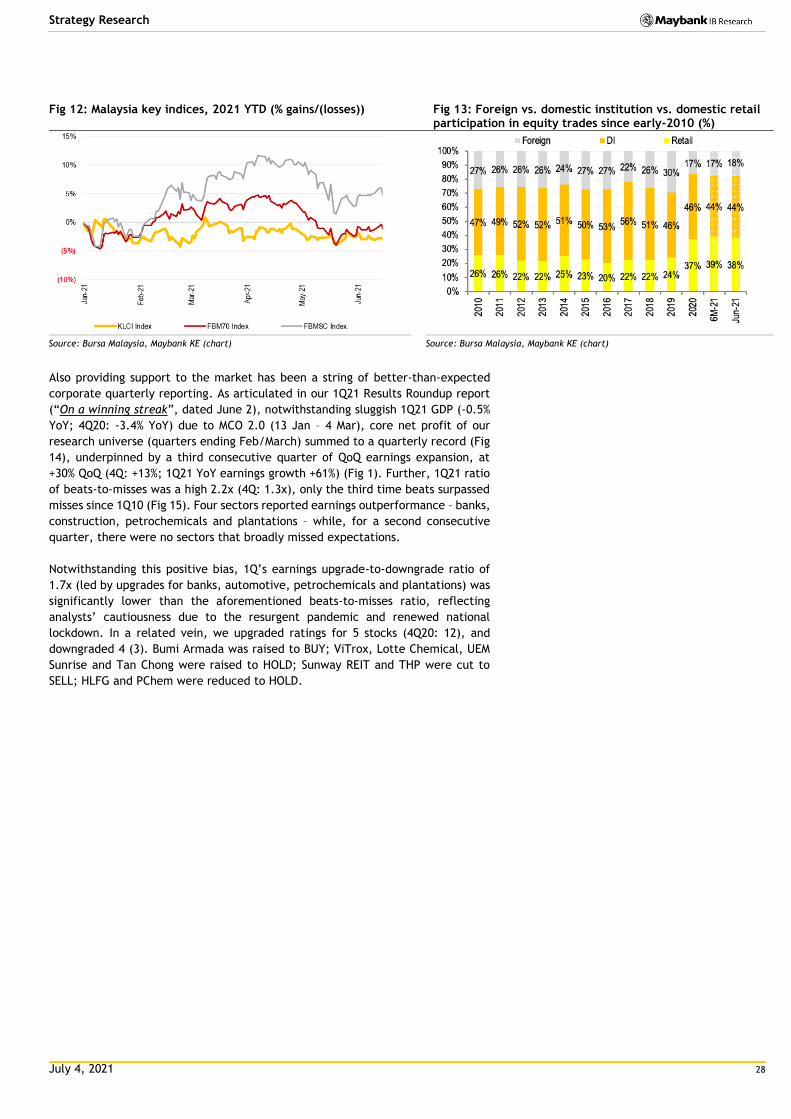
July 4, 2021 28
Strategy Research
Also providing support to the market has been a string of better-than-expected
corporate quarterly reporting. As articulated in our 1Q21 Results Roundup report
(“On a winning streak”, dated June 2), notwithstanding sluggish 1Q21 GDP (-0.5%
YoY; 4Q20: -3.4% YoY) due to MCO 2.0 (13 Jan – 4 Mar), core net profit of our
research universe (quarters ending Feb/March) summed to a quarterly record (Fig
14), underpinned by a third consecutive quarter of QoQ earnings expansion, at
+30% QoQ (4Q: +13%; 1Q21 YoY earnings growth +61%) (Fig 1). Further, 1Q21 ratio
of beats-to-misses was a high 2.2x (4Q: 1.3x), only the third time beats surpassed
misses since 1Q10 (Fig 15). Four sectors reported earnings outperformance – banks,
construction, petrochemicals and plantations – while, for a second consecutive
quarter, there were no sectors that broadly missed expectations.
Notwithstanding this positive bias, 1Q’s earnings upgrade-to-downgrade ratio of
1.7x (led by upgrades for banks, automotive, petrochemicals and plantations) was
significantly lower than the aforementioned beats-to-misses ratio, reflecting
analysts’ cautiousness due to the resurgent pandemic and renewed national
lockdown. In a related vein, we upgraded ratings for 5 stocks (4Q20: 12), and
downgraded 4 (3). Bumi Armada was raised to BUY; ViTrox, Lotte Chemical, UEM
Sunrise and Tan Chong were raised to HOLD; Sunway REIT and THP were cut to
SELL; HLFG and PChem were reduced to HOLD.
Fig 12: Malaysia key indices, 2021 YTD (% gains/(losses))
Fig 13: Foreign vs. domestic institution vs. domestic retail participation in equity trades since early-2010 (%)
Source: Bursa Malaysia, Maybank KE (chart) Source: Bursa Malaysia, Maybank KE (chart)
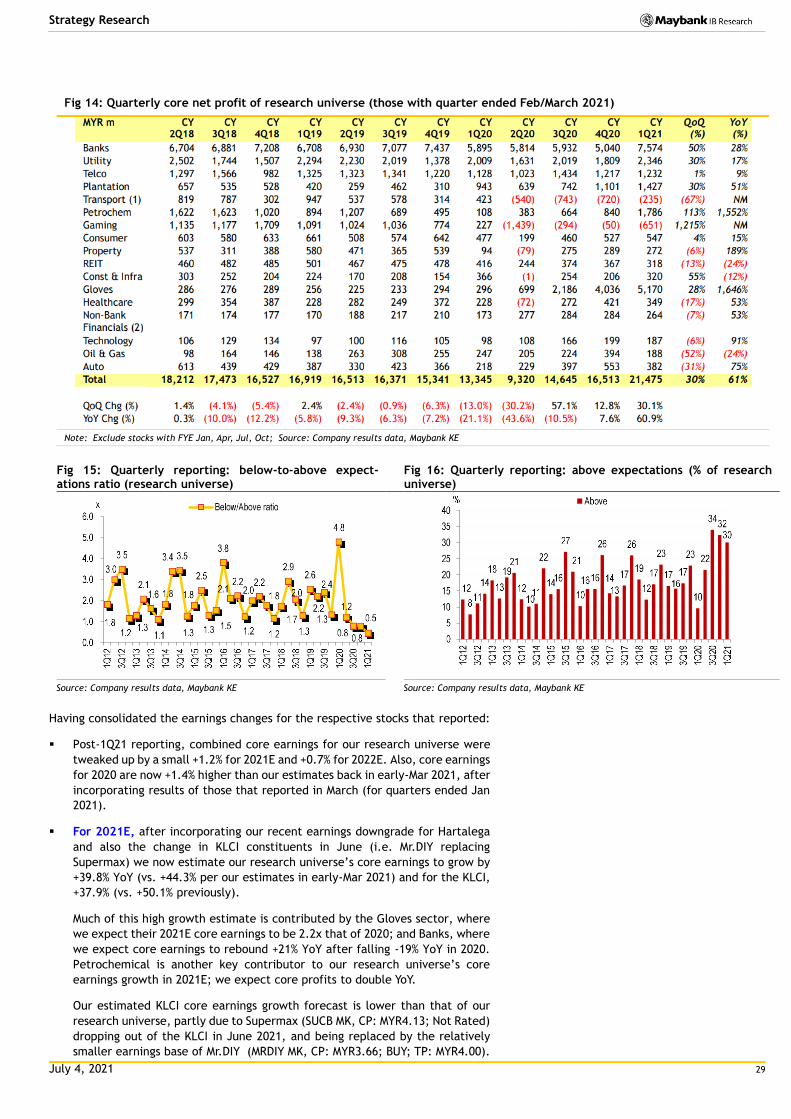
July 4, 2021 29
Strategy Research
Fig 14: Quarterly core net profit of research universe (those with quarter ended Feb/March 2021)
Note: Exclude stocks with FYE Jan, Apr, Jul, Oct; Source: Company results data, Maybank KE
Fig 15: Quarterly reporting: below-to-above expect-ations ratio (research universe)
Fig 16: Quarterly reporting: above expectations (% of research universe)
Source: Company results data, Maybank KE Source: Company results data, Maybank KE
Having consolidated the earnings changes for the respective stocks that reported:
Post-1Q21 reporting, combined core earnings for our research universe were
tweaked up by a small +1.2% for 2021E and +0.7% for 2022E. Also, core earnings
for 2020 are now +1.4% higher than our estimates back in early-Mar 2021, after
incorporating results of those that reported in March (for quarters ended Jan
2021).
For 2021E, after incorporating our recent earnings downgrade for Hartalega
and also the change in KLCI constituents in June (i.e. Mr.DIY replacing
Supermax) we now estimate our research universe’s core earnings to grow by
+39.8% YoY (vs. +44.3% per our estimates in early-Mar 2021) and for the KLCI,
+37.9% (vs. +50.1% previously).
Much of this high growth estimate is contributed by the Gloves sector, where
we expect their 2021E core earnings to be 2.2x that of 2020; and Banks, where
we expect core earnings to rebound +21% YoY after falling -19% YoY in 2020.
Petrochemical is another key contributor to our research universe’s core
earnings growth in 2021E; we expect core profits to double YoY.
Our estimated KLCI core earnings growth forecast is lower than that of our
research universe, partly due to Supermax (SUCB MK, CP: MYR4.13; Not Rated)
dropping out of the KLCI in June 2021, and being replaced by the relatively
smaller earnings base of Mr.DIY (MRDIY MK, CP: MYR3.66; BUY; TP: MYR4.00).
Fig 2: Below-to-above expectation ratio (research universe)
Source: Company results data, Maybank KE
Fig 3: Above expectation (% of research universe)
Source: Company results data, Maybank KE
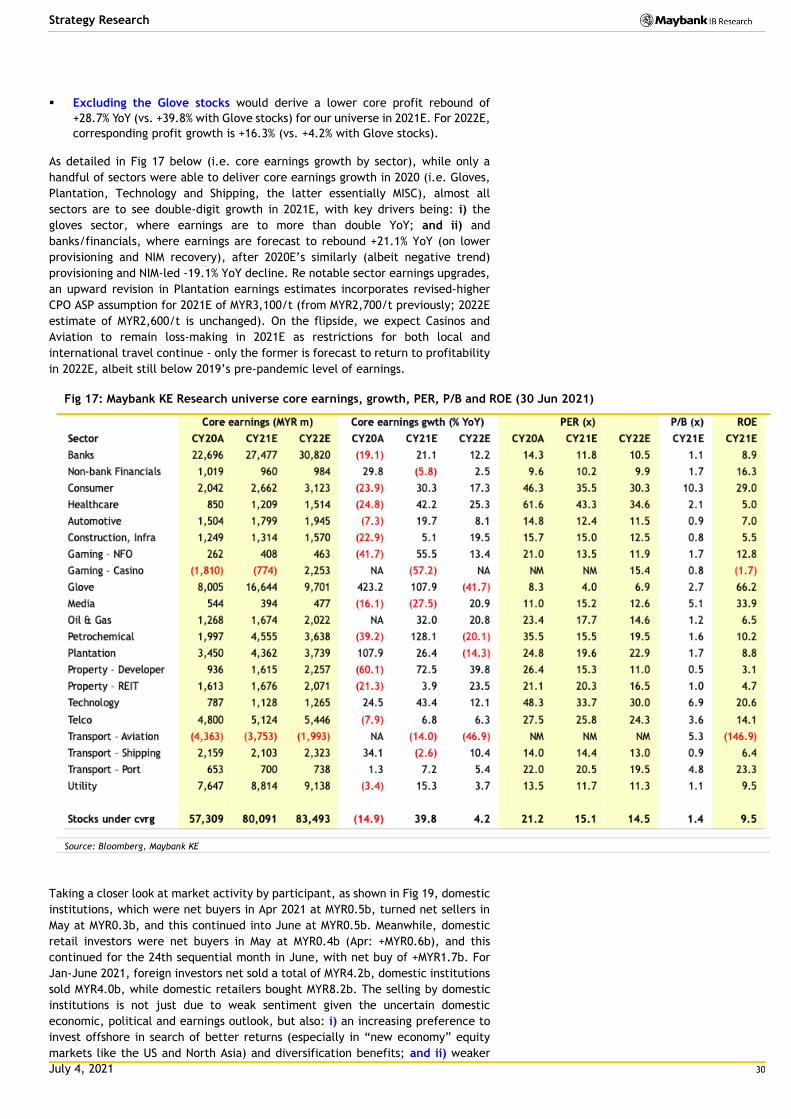
July 4, 2021 30
Strategy Research
Excluding the Glove stocks would derive a lower core profit rebound of
+28.7% YoY (vs. +39.8% with Glove stocks) for our universe in 2021E. For 2022E,
corresponding profit growth is +16.3% (vs. +4.2% with Glove stocks).
As detailed in Fig 17 below (i.e. core earnings growth by sector), while only a
handful of sectors were able to deliver core earnings growth in 2020 (i.e. Gloves,
Plantation, Technology and Shipping, the latter essentially MISC), almost all
sectors are to see double-digit growth in 2021E, with key drivers being: i) the
gloves sector, where earnings are to more than double YoY; and ii) and
banks/financials, where earnings are forecast to rebound +21.1% YoY (on lower
provisioning and NIM recovery), after 2020E’s similarly (albeit negative trend)
provisioning and NIM-led -19.1% YoY decline. Re notable sector earnings upgrades,
an upward revision in Plantation earnings estimates incorporates revised-higher
CPO ASP assumption for 2021E of MYR3,100/t (from MYR2,700/t previously; 2022E
estimate of MYR2,600/t is unchanged). On the flipside, we expect Casinos and
Aviation to remain loss-making in 2021E as restrictions for both local and
international travel continue - only the former is forecast to return to profitability
in 2022E, albeit still below 2019’s pre-pandemic level of earnings.
Fig 17: Maybank KE Research universe core earnings, growth, PER, P/B and ROE (30 Jun 2021)
Source: Bloomberg, Maybank KE
Taking a closer look at market activity by participant, as shown in Fig 19, domestic
institutions, which were net buyers in Apr 2021 at MYR0.5b, turned net sellers in
May at MYR0.3b, and this continued into June at MYR0.5b. Meanwhile, domestic
retail investors were net buyers in May at MYR0.4b (Apr: +MYR0.6b), and this
continued for the 24th sequential month in June, with net buy of +MYR1.7b. For
Jan-June 2021, foreign investors net sold a total of MYR4.2b, domestic institutions
sold MYR4.0b, while domestic retailers bought MYR8.2b. The selling by domestic
institutions is not just due to weak sentiment given the uncertain domestic
economic, political and earnings outlook, but also: i) an increasing preference to
invest offshore in search of better returns (especially in “new economy” equity
markets like the US and North Asia) and diversification benefits; and ii) weaker
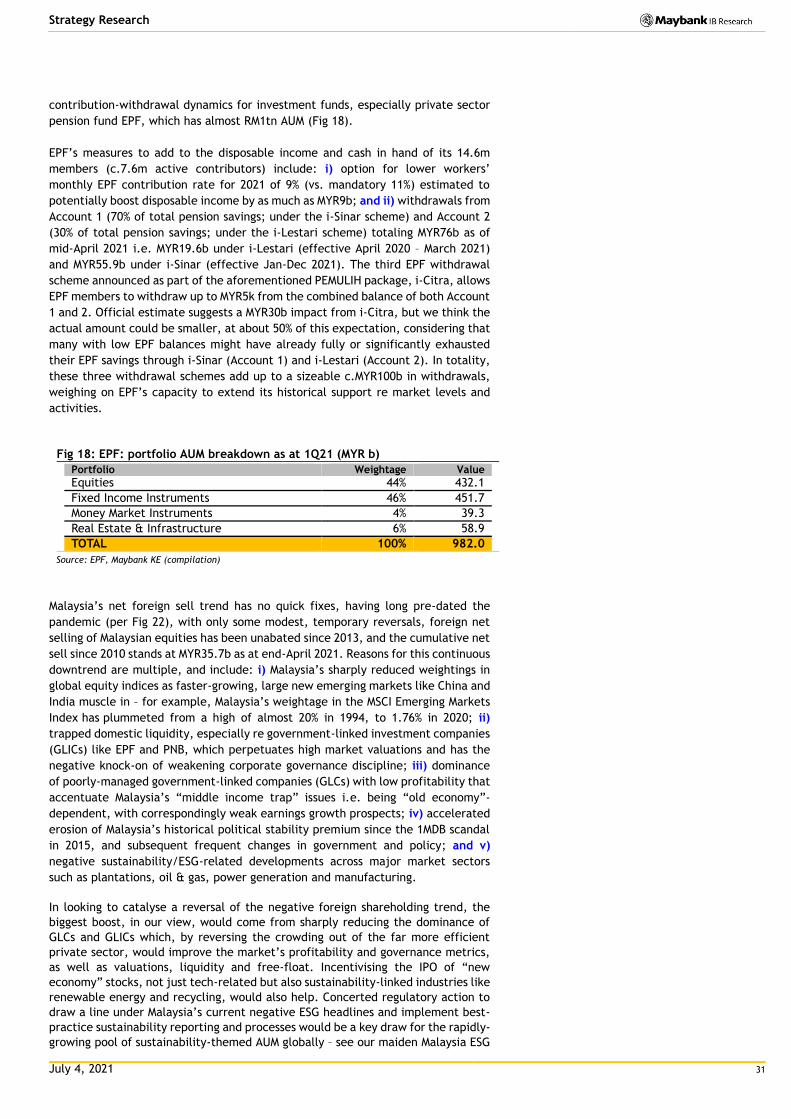
July 4, 2021 31
Strategy Research
contribution-withdrawal dynamics for investment funds, especially private sector
pension fund EPF, which has almost RM1tn AUM (Fig 18).
EPF’s measures to add to the disposable income and cash in hand of its 14.6m
members (c.7.6m active contributors) include: i) option for lower workers’
monthly EPF contribution rate for 2021 of 9% (vs. mandatory 11%) estimated to
potentially boost disposable income by as much as MYR9b; and ii) withdrawals from
Account 1 (70% of total pension savings; under the i-Sinar scheme) and Account 2
(30% of total pension savings; under the i-Lestari scheme) totaling MYR76b as of
mid-April 2021 i.e. MYR19.6b under i-Lestari (effective April 2020 – March 2021)
and MYR55.9b under i-Sinar (effective Jan-Dec 2021). The third EPF withdrawal
scheme announced as part of the aforementioned PEMULIH package, i-Citra, allows
EPF members to withdraw up to MYR5k from the combined balance of both Account
1 and 2. Official estimate suggests a MYR30b impact from i-Citra, but we think the
actual amount could be smaller, at about 50% of this expectation, considering that
many with low EPF balances might have already fully or significantly exhausted
their EPF savings through i-Sinar (Account 1) and i-Lestari (Account 2). In totality,
these three withdrawal schemes add up to a sizeable c.MYR100b in withdrawals,
weighing on EPF’s capacity to extend its historical support re market levels and
activities.
Fig 18: EPF: portfolio AUM breakdown as at 1Q21 (MYR b)
Portfolio Weightage Value
Equities 44% 432.1
Fixed Income Instruments 46% 451.7
Money Market Instruments 4% 39.3
Real Estate & Infrastructure 6% 58.9
TOTAL 100% 982.0
Source: EPF, Maybank KE (compilation)
Malaysia’s net foreign sell trend has no quick fixes, having long pre-dated the
pandemic (per Fig 22), with only some modest, temporary reversals, foreign net
selling of Malaysian equities has been unabated since 2013, and the cumulative net
sell since 2010 stands at MYR35.7b as at end-April 2021. Reasons for this continuous
downtrend are multiple, and include: i) Malaysia’s sharply reduced weightings in
global equity indices as faster-growing, large new emerging markets like China and
India muscle in – for example, Malaysia’s weightage in the MSCI Emerging Markets
Index has plummeted from a high of almost 20% in 1994, to 1.76% in 2020; ii)
trapped domestic liquidity, especially re government-linked investment companies
(GLICs) like EPF and PNB, which perpetuates high market valuations and has the
negative knock-on of weakening corporate governance discipline; iii) dominance
of poorly-managed government-linked companies (GLCs) with low profitability that
accentuate Malaysia’s “middle income trap” issues i.e. being “old economy”-
dependent, with correspondingly weak earnings growth prospects; iv) accelerated
erosion of Malaysia’s historical political stability premium since the 1MDB scandal
in 2015, and subsequent frequent changes in government and policy; and v)
negative sustainability/ESG-related developments across major market sectors
such as plantations, oil & gas, power generation and manufacturing.
In looking to catalyse a reversal of the negative foreign shareholding trend, the
biggest boost, in our view, would come from sharply reducing the dominance of
GLCs and GLICs which, by reversing the crowding out of the far more efficient
private sector, would improve the market’s profitability and governance metrics,
as well as valuations, liquidity and free-float. Incentivising the IPO of “new
economy” stocks, not just tech-related but also sustainability-linked industries like
renewable energy and recycling, would also help. Concerted regulatory action to
draw a line under Malaysia’s current negative ESG headlines and implement best-
practice sustainability reporting and processes would be a key draw for the rapidly-
growing pool of sustainability-themed AUM globally – see our maiden Malaysia ESG
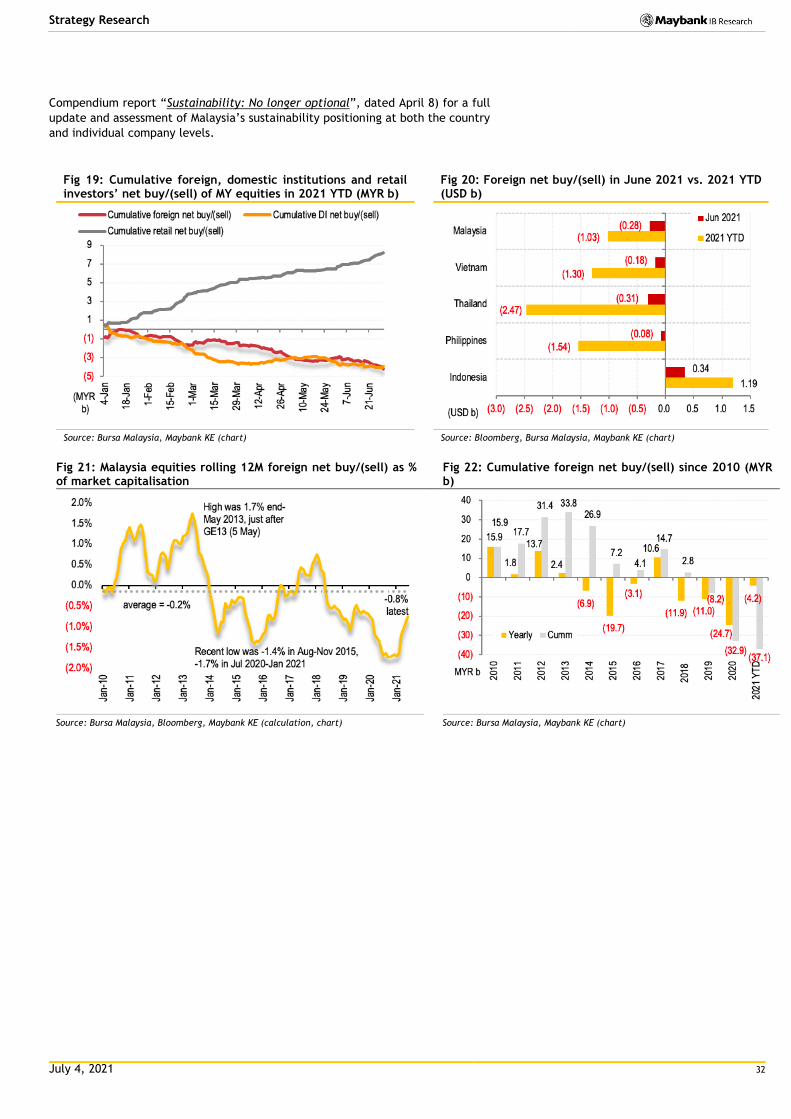
July 4, 2021 32
Strategy Research
Compendium report “Sustainability: No longer optional”, dated April 8) for a full
update and assessment of Malaysia’s sustainability positioning at both the country
and individual company levels.
Fig 19: Cumulative foreign, domestic institutions and retail investors’ net buy/(sell) of MY equities in 2021 YTD (MYR b)
Fig 20: Foreign net buy/(sell) in June 2021 vs. 2021 YTD (USD b)
Source: Bursa Malaysia, Maybank KE (chart) Source: Bloomberg, Bursa Malaysia, Maybank KE (chart)
Fig 21: Malaysia equities rolling 12M foreign net buy/(sell) as % of market capitalisation
Fig 22: Cumulative foreign net buy/(sell) since 2010 (MYR b)
Source: Bursa Malaysia, Bloomberg, Maybank KE (calculation, chart) Source: Bursa Malaysia, Maybank KE (chart)
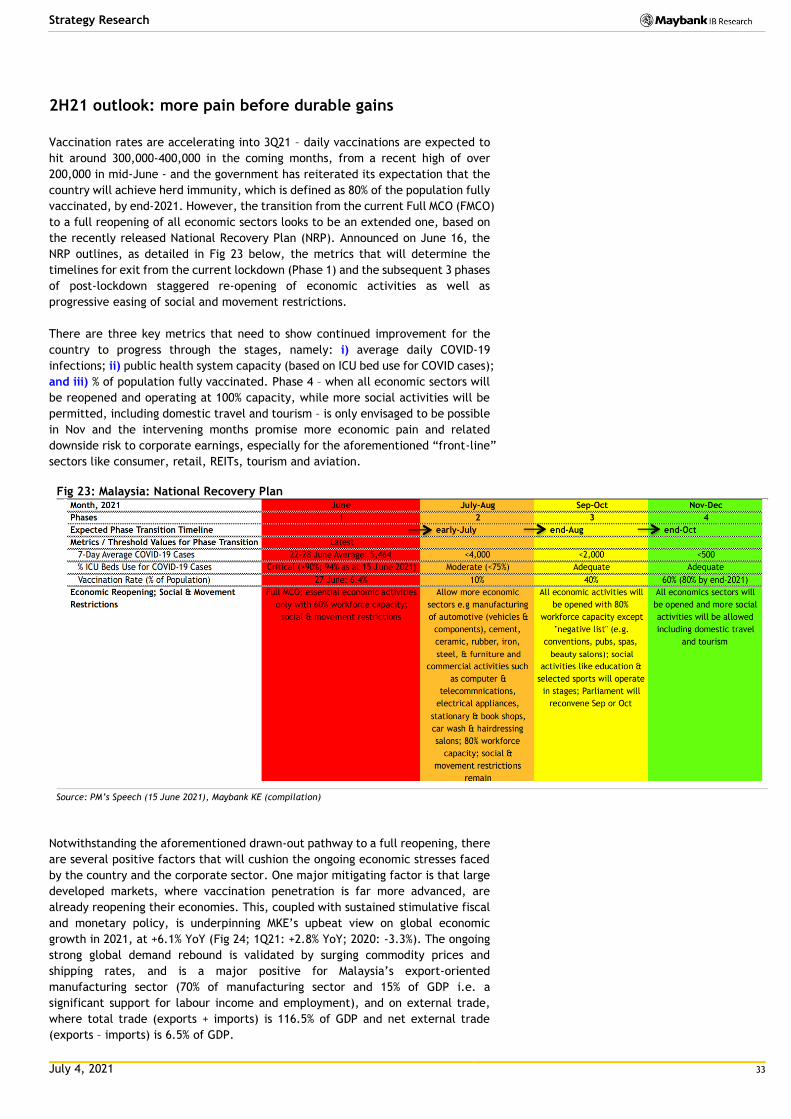
July 4, 2021 33
Strategy Research
2H21 outlook: more pain before durable gains
Vaccination rates are accelerating into 3Q21 – daily vaccinations are expected to
hit around 300,000-400,000 in the coming months, from a recent high of over
200,000 in mid-June - and the government has reiterated its expectation that the
country will achieve herd immunity, which is defined as 80% of the population fully
vaccinated, by end-2021. However, the transition from the current Full MCO (FMCO)
to a full reopening of all economic sectors looks to be an extended one, based on
the recently released National Recovery Plan (NRP). Announced on June 16, the
NRP outlines, as detailed in Fig 23 below, the metrics that will determine the
timelines for exit from the current lockdown (Phase 1) and the subsequent 3 phases
of post-lockdown staggered re-opening of economic activities as well as
progressive easing of social and movement restrictions.
There are three key metrics that need to show continued improvement for the
country to progress through the stages, namely: i) average daily COVID-19
infections; ii) public health system capacity (based on ICU bed use for COVID cases);
and iii) % of population fully vaccinated. Phase 4 – when all economic sectors will
be reopened and operating at 100% capacity, while more social activities will be
permitted, including domestic travel and tourism – is only envisaged to be possible
in Nov and the intervening months promise more economic pain and related
downside risk to corporate earnings, especially for the aforementioned “front-line”
sectors like consumer, retail, REITs, tourism and aviation.
Fig 23: Malaysia: National Recovery Plan
Source: PM’s Speech (15 June 2021), Maybank KE (compilation)
Notwithstanding the aforementioned drawn-out pathway to a full reopening, there
are several positive factors that will cushion the ongoing economic stresses faced
by the country and the corporate sector. One major mitigating factor is that large
developed markets, where vaccination penetration is far more advanced, are
already reopening their economies. This, coupled with sustained stimulative fiscal
and monetary policy, is underpinning MKE’s upbeat view on global economic
growth in 2021, at +6.1% YoY (Fig 24; 1Q21: +2.8% YoY; 2020: -3.3%). The ongoing
strong global demand rebound is validated by surging commodity prices and
shipping rates, and is a major positive for Malaysia’s export-oriented
manufacturing sector (70% of manufacturing sector and 15% of GDP i.e. a
significant support for labour income and employment), and on external trade,
where total trade (exports + imports) is 116.5% of GDP and net external trade
(exports – imports) is 6.5% of GDP.
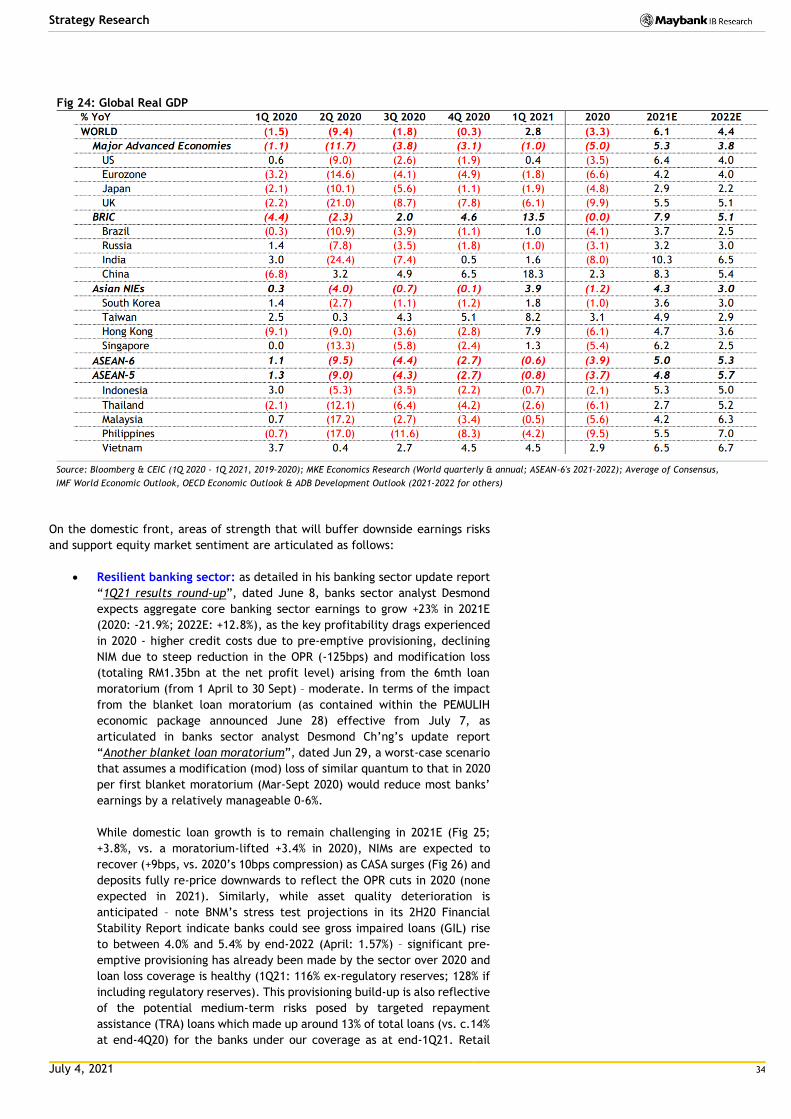
July 4, 2021 34
Strategy Research
Fig 24: Global Real GDP
Source: Bloomberg & CEIC (1Q 2020 - 1Q 2021, 2019-2020); MKE Economics Research (World quarterly & annual; ASEAN-6's 2021-2022); Average of Consensus,
IMF World Economic Outlook, OECD Economic Outlook & ADB Development Outlook (2021-2022 for others)
On the domestic front, areas of strength that will buffer downside earnings risks
and support equity market sentiment are articulated as follows:
Resilient banking sector: as detailed in his banking sector update report
“1Q21 results round-up”, dated June 8, banks sector analyst Desmond
expects aggregate core banking sector earnings to grow +23% in 2021E
(2020: -21.9%; 2022E: +12.8%), as the key profitability drags experienced
in 2020 - higher credit costs due to pre-emptive provisioning, declining
NIM due to steep reduction in the OPR (-125bps) and modification loss
(totaling RM1.35bn at the net profit level) arising from the 6mth loan
moratorium (from 1 April to 30 Sept) – moderate. In terms of the impact
from the blanket loan moratorium (as contained within the PEMULIH
economic package announced June 28) effective from July 7, as
articulated in banks sector analyst Desmond Ch’ng’s update report
“Another blanket loan moratorium”, dated Jun 29, a worst-case scenario
that assumes a modification (mod) loss of similar quantum to that in 2020
per first blanket moratorium (Mar-Sept 2020) would reduce most banks’
earnings by a relatively manageable 0-6%.
While domestic loan growth is to remain challenging in 2021E (Fig 25;
+3.8%, vs. a moratorium-lifted +3.4% in 2020), NIMs are expected to
recover (+9bps, vs. 2020’s 10bps compression) as CASA surges (Fig 26) and
deposits fully re-price downwards to reflect the OPR cuts in 2020 (none
expected in 2021). Similarly, while asset quality deterioration is
anticipated – note BNM’s stress test projections in its 2H20 Financial
Stability Report indicate banks could see gross impaired loans (GIL) rise
to between 4.0% and 5.4% by end-2022 (April: 1.57%) – significant pre-
emptive provisioning has already been made by the sector over 2020 and
loan loss coverage is healthy (1Q21: 116% ex-regulatory reserves; 128% if
including regulatory reserves). This provisioning build-up is also reflective
of the potential medium-term risks posed by targeted repayment
assistance (TRA) loans which made up around 13% of total loans (vs. c.14%
at end-4Q20) for the banks under our coverage as at end-1Q21. Retail
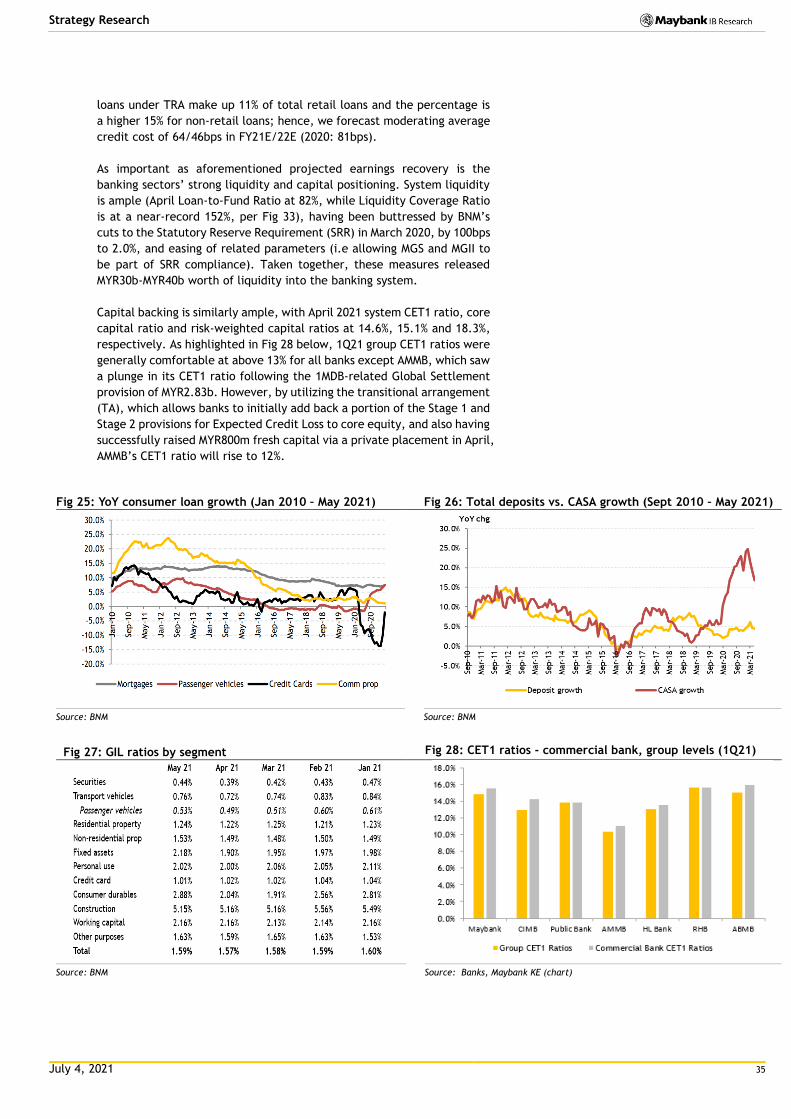
July 4, 2021 35
Strategy Research
loans under TRA make up 11% of total retail loans and the percentage is
a higher 15% for non-retail loans; hence, we forecast moderating average
credit cost of 64/46bps in FY21E/22E (2020: 81bps).
As important as aforementioned projected earnings recovery is the
banking sectors’ strong liquidity and capital positioning. System liquidity
is ample (April Loan-to-Fund Ratio at 82%, while Liquidity Coverage Ratio
is at a near-record 152%, per Fig 33), having been buttressed by BNM’s
cuts to the Statutory Reserve Requirement (SRR) in March 2020, by 100bps
to 2.0%, and easing of related parameters (i.e allowing MGS and MGII to
be part of SRR compliance). Taken together, these measures released
MYR30b-MYR40b worth of liquidity into the banking system.
Capital backing is similarly ample, with April 2021 system CET1 ratio, core
capital ratio and risk-weighted capital ratios at 14.6%, 15.1% and 18.3%,
respectively. As highlighted in Fig 28 below, 1Q21group CET1 ratios were
generally comfortable at above 13% for all banks except AMMB, which saw
a plunge in its CET1 ratio following the 1MDB-related Global Settlement
provision of MYR2.83b. However, by utilizing the transitional arrangement
(TA), which allows banks to initially add back a portion of the Stage 1 and
Stage 2 provisions for Expected Credit Loss to core equity, and also having
successfully raised MYR800m fresh capital via a private placement in April,
AMMB’s CET1 ratio will rise to 12%.
Fig 25: YoY consumer loan growth (Jan 2010 – May 2021) Fig 26: Total deposits vs. CASA growth (Sept 2010 – May 2021)
Source: BNM Source: BNM
Fig 27: GIL ratios by segment Fig 28: CET1 ratios - commercial bank, group levels (1Q21)
Source: BNM Source: Banks, Maybank KE (chart)
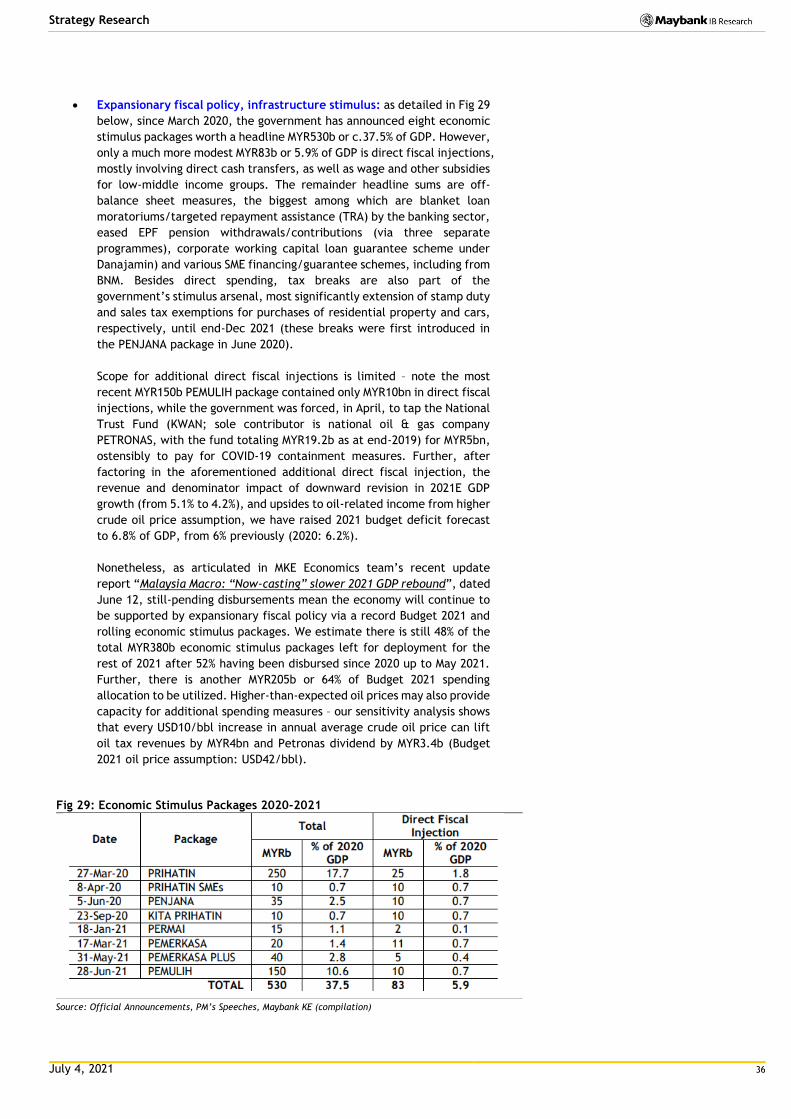
July 4, 2021 36
Strategy Research
Expansionary fiscal policy, infrastructure stimulus: as detailed in Fig 29
below, since March 2020, the government has announced eight economic
stimulus packages worth a headline MYR530b or c.37.5% of GDP. However,
only a much more modest MYR83b or 5.9% of GDP is direct fiscal injections,
mostly involving direct cash transfers, as well as wage and other subsidies
for low-middle income groups. The remainder headline sums are off-
balance sheet measures, the biggest among which are blanket loan
moratoriums/targeted repayment assistance (TRA) by the banking sector,
eased EPF pension withdrawals/contributions (via three separate
programmes), corporate working capital loan guarantee scheme under
Danajamin) and various SME financing/guarantee schemes, including from
BNM. Besides direct spending, tax breaks are also part of the
government’s stimulus arsenal, most significantly extension of stamp duty
and sales tax exemptions for purchases of residential property and cars,
respectively, until end-Dec 2021 (these breaks were first introduced in
the PENJANA package in June 2020).
Scope for additional direct fiscal injections is limited – note the most
recent MYR150b PEMULIH package contained only MYR10bn in direct fiscal
injections, while the government was forced, in April, to tap the National
Trust Fund (KWAN; sole contributor is national oil & gas company
PETRONAS, with the fund totaling MYR19.2b as at end-2019) for MYR5bn,
ostensibly to pay for COVID-19 containment measures. Further, after
factoring in the aforementioned additional direct fiscal injection, the
revenue and denominator impact of downward revision in 2021E GDP
growth (from 5.1% to 4.2%), and upsides to oil-related income from higher
crude oil price assumption, we have raised 2021 budget deficit forecast
to 6.8% of GDP, from 6% previously (2020: 6.2%).
Nonetheless, as articulated in MKE Economics team’s recent update
report “Malaysia Macro: “Now-casting” slower 2021 GDP rebound”, dated
June 12, still-pending disbursements mean the economy will continue to
be supported by expansionary fiscal policy via a record Budget 2021 and
rolling economic stimulus packages. We estimate there is still 48% of the
total MYR380b economic stimulus packages left for deployment for the
rest of 2021 after 52% having been disbursed since 2020 up to May 2021.
Further, there is another MYR205b or 64% of Budget 2021 spending
allocation to be utilized. Higher-than-expected oil prices may also provide
capacity for additional spending measures – our sensitivity analysis shows
that every USD10/bbl increase in annual average crude oil price can lift
oil tax revenues by MYR4bn and Petronas dividend by MYR3.4b (Budget
2021 oil price assumption: USD42/bbl).
Fig 29: Economic Stimulus Packages 2020-2021
Source: Official Announcements, PM’s Speeches, Maybank KE (compilation)
July 4, 2021 37
Strategy Research
Infrastructure stimulus was expected to play a key role in meeting the
government’s 2021 GDP growth projection, as underpinned by Budget
2021’s 38% increase in GDE, to a record MYR69b. Longer term, under the
government’s Medium-Term Fiscal Framework (MTFF) 2021-23 which
provides fiscal projections for the next three years, the projected GDE
allocation for 2021-23 is MYR212.5b. With MYR69b GDE already set aside
for 2021, this leaves MYR143.5b for 2022-23, or MYR72b per annum,
implying sustained, if not higher infrastructure roll-outs over the medium
term, boding well for construction sector order books.
However, due to various MCO disruptions, government net development
expenditure in 1Q21 fell 24% QoQ, to MYR15.3b, which is 22% of the
Budget 2021 allocation. Construction activities (except for critical works)
have been halted again from June 1st under Malaysia’s FMCO. This came
just one week after a 60% workforce capacity directive was enforced from
25 May under MCO 3.0. With FMCO being in full-force in June and an 80%
workforce capacity cap under FMCO Phase 2 (anticipated in Jul/Aug), we
expect activities will remain subdued for much of the rest of the year,
hence limiting the multiplier impact on the economy for now –
nonetheless, we see spending / construction activity accelerating once
again into 2022 as the pandemic is brought under control, with a number
of big-ticket projects in the pipeline (Fig 30), including the National
Digital Infrastructure Plan (JENDELA), KVMRT3 and the High Speed Rail
(HSR). Given fiscal constraints, the public-private partnership (PPP;
JENDELA is an example, with 60% funding by industry players) model is
likely to be prioritized, with new major infrastructure projects such as
the KVMRT3 being implemented via Private Finance Initiatives (PFI) cum
deferred payment financing model.
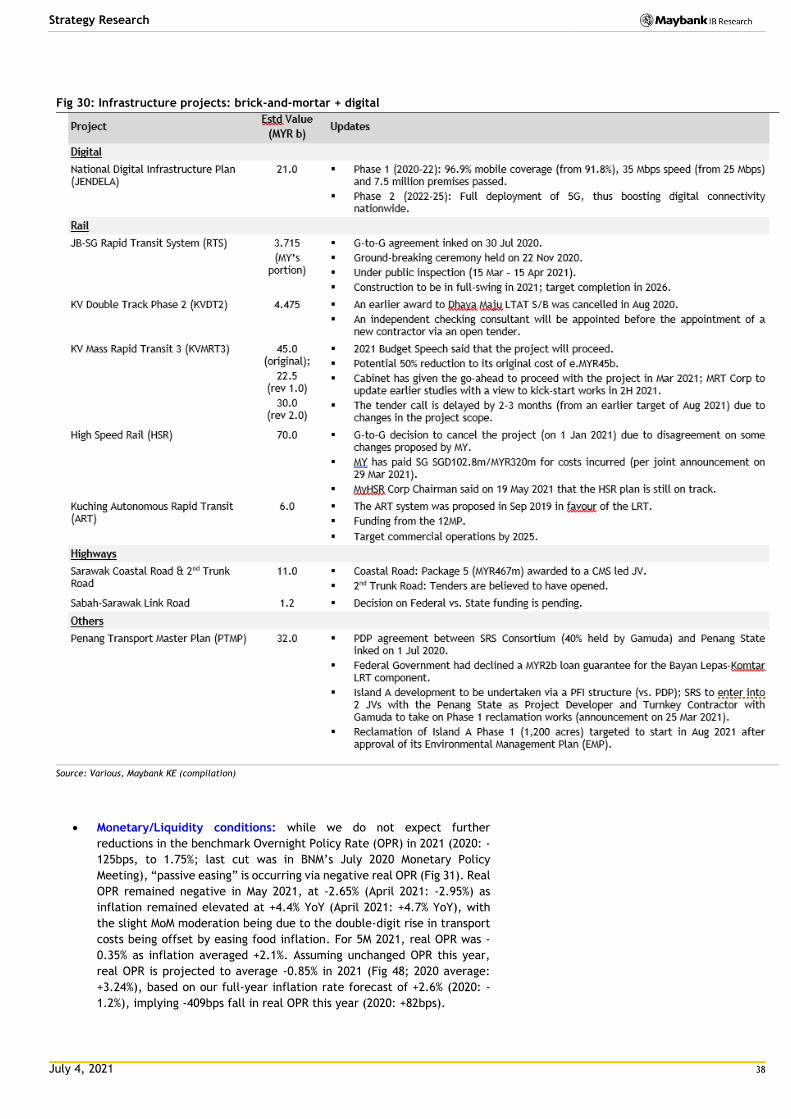
July 4, 2021 38
Strategy Research
Fig 30: Infrastructure projects: brick-and-mortar + digital
Source: Various, Maybank KE (compilation)
Monetary/Liquidity conditions: while we do not expect further
reductions in the benchmark Overnight Policy Rate (OPR) in 2021 (2020: -
125bps, to 1.75%; last cut was in BNM’s July 2020 Monetary Policy
Meeting), “passive easing” is occurring via negative real OPR (Fig 31). Real
OPR remained negative in May 2021, at -2.65% (April 2021: -2.95%) as
inflation remained elevated at +4.4% YoY (April 2021: +4.7% YoY), with
the slight MoM moderation being due to the double-digit rise in transport
costs being offset by easing food inflation. For 5M 2021, real OPR was -
0.35% as inflation averaged +2.1%. Assuming unchanged OPR this year,
real OPR is projected to average -0.85% in 2021 (Fig 48; 2020 average:
+3.24%), based on our full-year inflation rate forecast of +2.6% (2020: -
1.2%), implying -409bps fall in real OPR this year (2020: +82bps).
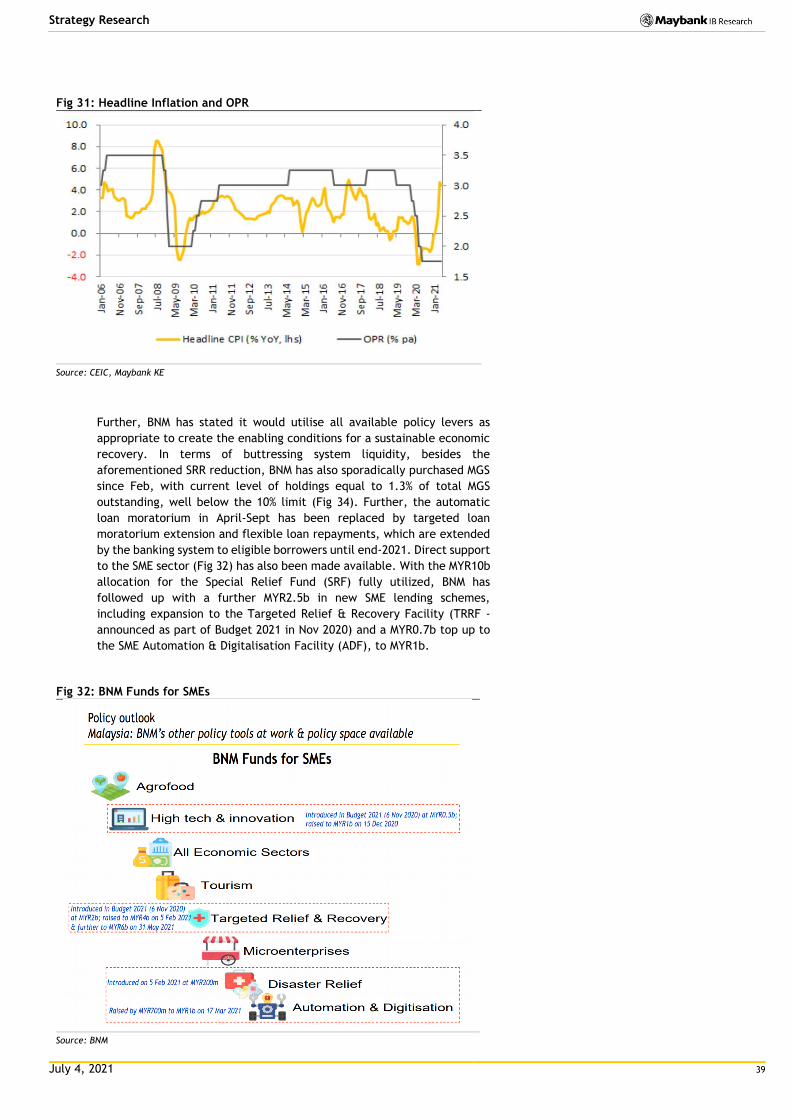
July 4, 2021 39
Strategy Research
Fig 31: Headline Inflation and OPR
Source: CEIC, Maybank KE
Further, BNM has stated it would utilise all available policy levers as
appropriate to create the enabling conditions for a sustainable economic
recovery. In terms of buttressing system liquidity, besides the
aforementioned SRR reduction, BNM has also sporadically purchased MGS
since Feb, with current level of holdings equal to 1.3% of total MGS
outstanding, well below the 10% limit (Fig 34). Further, the automatic
loan moratorium in April-Sept has been replaced by targeted loan
moratorium extension and flexible loan repayments, which are extended
by the banking system to eligible borrowers until end-2021. Direct support
to the SME sector (Fig 32) has also been made available. With the MYR10b
allocation for the Special Relief Fund (SRF) fully utilized, BNM has
followed up with a further MYR2.5b in new SME lending schemes,
including expansion to the Targeted Relief & Recovery Facility (TRRF -
announced as part of Budget 2021 in Nov 2020) and a MYR0.7b top up to
the SME Automation & Digitalisation Facility (ADF), to MYR1b.
Fig 32: BNM Funds for SMEs
Source: BNM
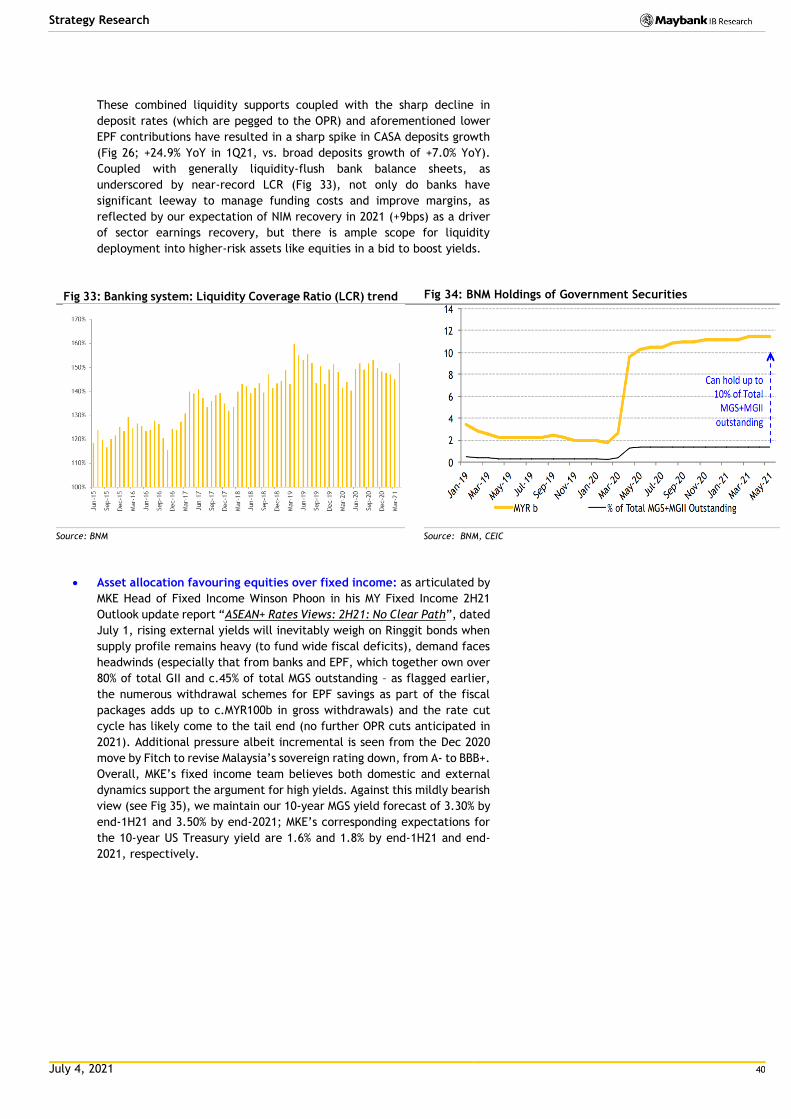
July 4, 2021 40
Strategy Research
These combined liquidity supports coupled with the sharp decline in
deposit rates (which are pegged to the OPR) and aforementioned lower
EPF contributions have resulted in a sharp spike in CASA deposits growth
(Fig 26; +24.9% YoY in 1Q21, vs. broad deposits growth of +7.0% YoY).
Coupled with generally liquidity-flush bank balance sheets, as
underscored by near-record LCR (Fig 33), not only do banks have
significant leeway to manage funding costs and improve margins, as
reflected by our expectation of NIM recovery in 2021 (+9bps) as a driver
of sector earnings recovery, but there is ample scope for liquidity
deployment into higher-risk assets like equities in a bid to boost yields.
Fig 33: Banking system: Liquidity Coverage Ratio (LCR) trend Fig 34: BNM Holdings of Government Securities
Source: BNM Source: BNM, CEIC
Asset allocation favouring equities over fixed income: as articulated by
MKE Head of Fixed Income Winson Phoon in his MY Fixed Income 2H21
Outlook update report “ASEAN+ Rates Views: 2H21: No Clear Path”, dated
July 1, rising external yields will inevitably weigh on Ringgit bonds when
supply profile remains heavy (to fund wide fiscal deficits), demand faces
headwinds (especially that from banks and EPF, which together own over
80% of total GII and c.45% of total MGS outstanding – as flagged earlier,
the numerous withdrawal schemes for EPF savings as part of the fiscal
packages adds up to c.MYR100b in gross withdrawals) and the rate cut
cycle has likely come to the tail end (no further OPR cuts anticipated in
2021). Additional pressure albeit incremental is seen from the Dec 2020
move by Fitch to revise Malaysia’s sovereign rating down, from A- to BBB+.
Overall, MKE’s fixed income team believes both domestic and external
dynamics support the argument for high yields. Against this mildly bearish
view (see Fig 35), we maintain our 10-year MGS yield forecast of 3.30% by
end-1H21 and 3.50% by end-2021; MKE’s corresponding expectations for
the 10-year US Treasury yield are 1.6% and 1.8% by end-1H21 and end-
2021, respectively.
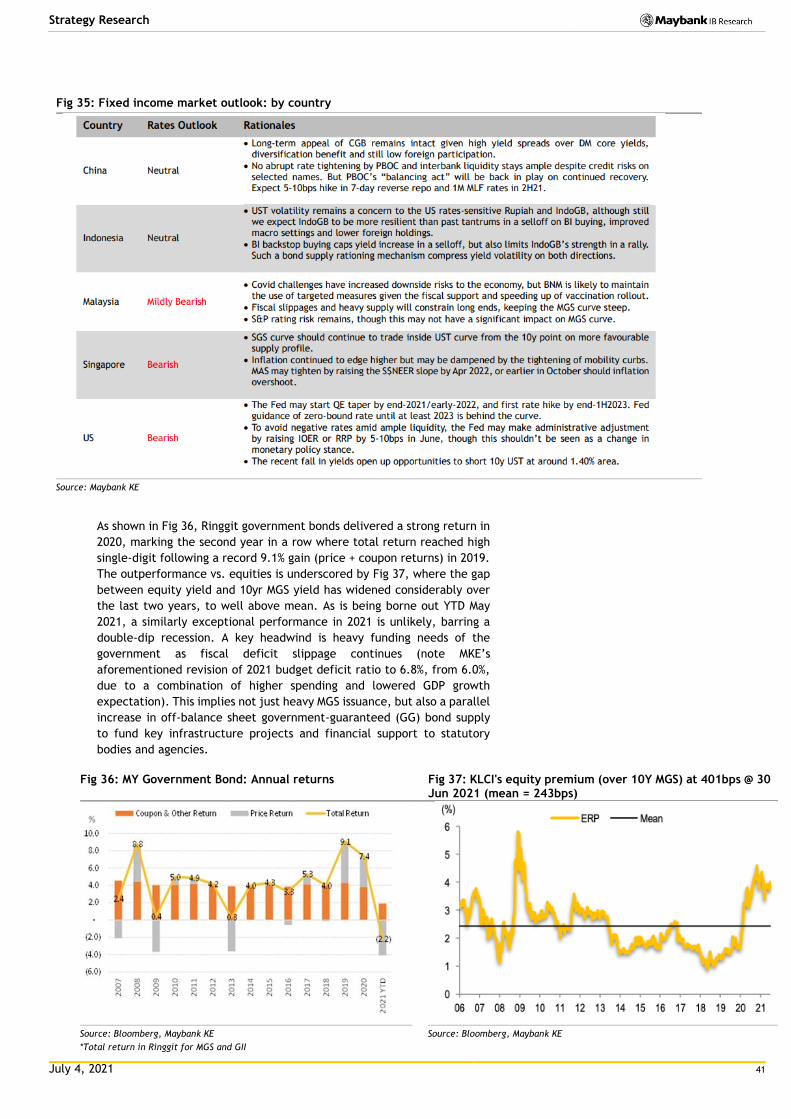
July 4, 2021 41
Strategy Research
Fig 35: Fixed income market outlook: by country
Source: Maybank KE
As shown in Fig 36, Ringgit government bonds delivered a strong return in
2020, marking the second year in a row where total return reached high
single-digit following a record 9.1% gain (price + coupon returns) in 2019.
The outperformance vs. equities is underscored by Fig 37, where the gap
between equity yield and 10yr MGS yield has widened considerably over
the last two years, to well above mean. As is being borne out YTD May
2021, a similarly exceptional performance in 2021 is unlikely, barring a
double-dip recession. A key headwind is heavy funding needs of the
government as fiscal deficit slippage continues (note MKE’s
aforementioned revision of 2021 budget deficit ratio to 6.8%, from 6.0%,
due to a combination of higher spending and lowered GDP growth
expectation). This implies not just heavy MGS issuance, but also a parallel
increase in off-balance sheet government-guaranteed (GG) bond supply
to fund key infrastructure projects and financial support to statutory
bodies and agencies.
Fig 36: MY Government Bond: Annual returns Fig 37: KLCI's equity premium (over 10Y MGS) at 401bps @ 30
Jun 2021 (mean = 243bps)
Source: Bloomberg, Maybank KE
*Total return in Ringgit for MGS and GII
Source: Bloomberg, Maybank KE
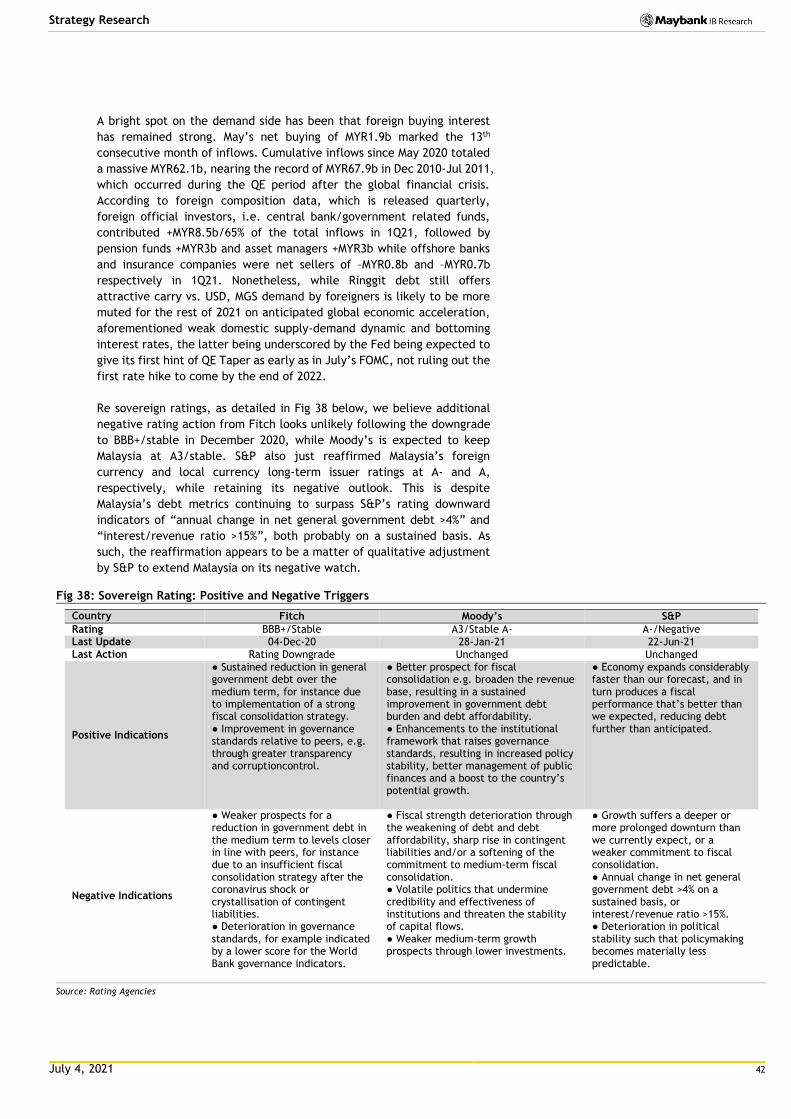
July 4, 2021 42
Strategy Research
A bright spot on the demand side has been that foreign buying interest
has remained strong. May’s net buying of MYR1.9b marked the 13th
consecutive month of inflows. Cumulative inflows since May 2020 totaled
a massive MYR62.1b, nearing the record of MYR67.9b in Dec 2010-Jul 2011,
which occurred during the QE period after the global financial crisis.
According to foreign composition data, which is released quarterly,
foreign official investors, i.e. central bank/government related funds,
contributed +MYR8.5b/65% of the total inflows in 1Q21, followed by
pension funds +MYR3b and asset managers +MYR3b while offshore banks
and insurance companies were net sellers of –MYR0.8b and –MYR0.7b
respectively in 1Q21. Nonetheless, while Ringgit debt still offers
attractive carry vs. USD, MGS demand by foreigners is likely to be more
muted for the rest of 2021 on anticipated global economic acceleration,
aforementioned weak domestic supply-demand dynamic and bottoming
interest rates, the latter being underscored by the Fed being expected to
give its first hint of QE Taper as early as in July’s FOMC, not ruling out the
first rate hike to come by the end of 2022.
Re sovereign ratings, as detailed in Fig 38 below, we believe additional
negative rating action from Fitch looks unlikely following the downgrade
to BBB+/stable in December 2020, while Moody’s is expected to keep
Malaysia at A3/stable. S&P also just reaffirmed Malaysia’s foreign
currency and local currency long-term issuer ratings at A- and A,
respectively, while retaining its negative outlook. This is despite
Malaysia’s debt metrics continuing to surpass S&P’s rating downward
indicators of “annual change in net general government debt >4%” and
“interest/revenue ratio >15%”, both probably on a sustained basis. As
such, the reaffirmation appears to be a matter of qualitative adjustment
by S&P to extend Malaysia on its negative watch.
Fig 38: Sovereign Rating: Positive and Negative Triggers
Country Fitch Moody’s S&P
Rating BBB+/Stable A3/Stable A- A-/Negative Last Update 04-Dec-20 28-Jan-21 22-Jun-21 Last Action Rating Downgrade Unchanged Unchanged
Positive Indications
● Sustained reduction in general government debt over the medium term, for instance due to implementation of a strong fiscal consolidation strategy. ● Improvement in governance standards relative to peers, e.g. through greater transparency and corruption control.
● Better prospect for fiscal consolidation e.g. broaden the revenue base, resulting in a sustained improvement in government debt burden and debt affordability. ● Enhancements to the institutional framework that raises governance standards, resulting in increased policy stability, better management of public finances and a boost to the country’s potential growth.
● Economy expands considerably faster than our forecast, and in turn produces a fiscal performance that’s better than we expected, reducing debt further than anticipated.
Negative Indications
● Weaker prospects for a reduction in government debt in the medium term to levels closer in line with peers, for instance due to an insufficient fiscal consolidation strategy after the coronavirus shock or crystallisation of contingent liabilities. ● Deterioration in governance standards, for example indicated by a lower score for the World Bank governance indicators.
● Fiscal strength deterioration through the weakening of debt and debt affordability, sharp rise in contingent liabilities and/or a softening of the commitment to medium-term fiscal consolidation. ● Volatile politics that undermine credibility and effectiveness of institutions and threaten the stability of capital flows. ● Weaker medium-term growth prospects through lower investments.
● Growth suffers a deeper or more prolonged downturn than we currently expect, or a weaker commitment to fiscal consolidation. ● Annual change in net general government debt >4% on a sustained basis, or interest/revenue ratio >15%. ● Deterioration in political stability such that policymaking becomes materially less predictable.
Source: Rating Agencies
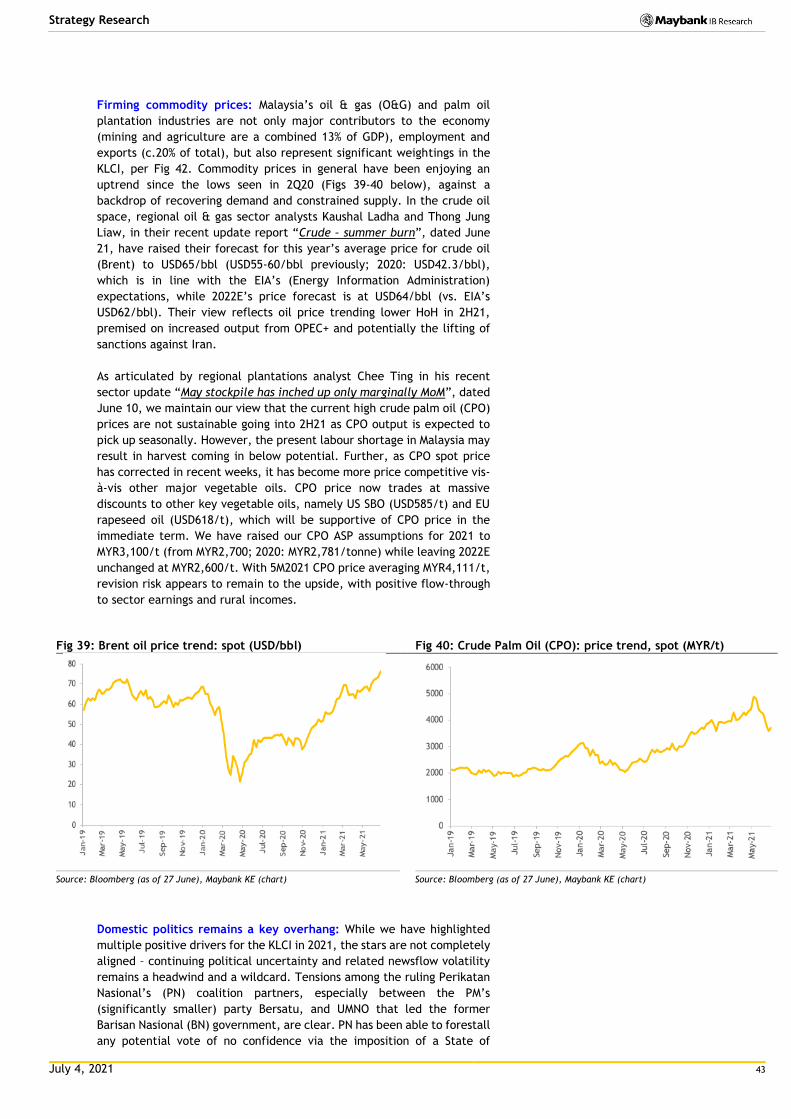
July 4, 2021 43
Strategy Research
Firming commodity prices: Malaysia’s oil & gas (O&G) and palm oil
plantation industries are not only major contributors to the economy
(mining and agriculture are a combined 13% of GDP), employment and
exports (c.20% of total), but also represent significant weightings in the
KLCI, per Fig 42. Commodity prices in general have been enjoying an
uptrend since the lows seen in 2Q20 (Figs 39-40 below), against a
backdrop of recovering demand and constrained supply. In the crude oil
space, regional oil & gas sector analysts Kaushal Ladha and Thong Jung
Liaw, in their recent update report “Crude – summer burn”, dated June
21, have raised their forecast for this year’s average price for crude oil
(Brent) to USD65/bbl (USD55-60/bbl previously; 2020: USD42.3/bbl),
which is in line with the EIA’s (Energy Information Administration)
expectations, while 2022E’s price forecast is at USD64/bbl (vs. EIA’s
USD62/bbl). Their view reflects oil price trending lower HoH in 2H21,
premised on increased output from OPEC+ and potentially the lifting of
sanctions against Iran.
As articulated by regional plantations analyst Chee Ting in his recent
sector update “May stockpile has inched up only marginally MoM”, dated
June 10, we maintain our view that the current high crude palm oil (CPO)
prices are not sustainable going into 2H21 as CPO output is expected to
pick up seasonally. However, the present labour shortage in Malaysia may
result in harvest coming in below potential. Further, as CPO spot price
has corrected in recent weeks, it has become more price competitive vis-
à-vis other major vegetable oils. CPO price now trades at massive
discounts to other key vegetable oils, namely US SBO (USD585/t) and EU
rapeseed oil (USD618/t), which will be supportive of CPO price in the
immediate term. We have raised our CPO ASP assumptions for 2021 to
MYR3,100/t (from MYR2,700; 2020: MYR2,781/tonne) while leaving 2022E
unchanged at MYR2,600/t. With 5M2021 CPO price averaging MYR4,111/t,
revision risk appears to remain to the upside, with positive flow-through
to sector earnings and rural incomes.
Fig 39: Brent oil price trend: spot (USD/bbl) Fig 40: Crude Palm Oil (CPO): price trend, spot (MYR/t)
Source: Bloomberg (as of 27 June), Maybank KE (chart) Source: Bloomberg (as of 27 June), Maybank KE (chart)
Domestic politics remains a key overhang: While we have highlighted
multiple positive drivers for the KLCI in 2021, the stars are not completely
aligned – continuing political uncertainty and related newsflow volatility
remains a headwind and a wildcard. Tensions among the ruling Perikatan
Nasional’s (PN) coalition partners, especially between the PM’s
(significantly smaller) party Bersatu, and UMNO that led the former
Barisan Nasional (BN) government, are clear. PN has been able to forestall
any potential vote of no confidence via the imposition of a State of
July 4, 2021 44
Strategy Research
Emergency on Jan 13, which effectively suspends Parliament (hence
securing the current government in place) until at least August, which is
when the Emergency is meant to expire. Piling pressure on the PM is the
recent Conference of Rulers meeting called by the King in June and
attended by the Malay Rulers (Sultans) of Malaysia’s various states, the
post-meeting declaration being that there was no need to place the
country under the Emergency beyond Aug 1, and that Parliament should
be reconvened as soon as possible. As such, a disruptive snap general
election (GE) in 2021 is a distinct possibility – well ahead of mid-2023 as
would be expected under the full 5-year GE cycle – especially if the
current third wave of COVID-19 is brought under control with the help of
accelerated vaccine deployment.
Political instability means continued distraction and delay to urgently-
needed policy resolutions and reforms, which spills into extended
sluggishness re private sector investment, which has struggled in the low
single-digits for much of the past decade. The latter is underscored by
extended weak domestic direct investment (DDI) i.e. the Malaysian
Investment Development Authority’s (MIDA) approved DDI had declined
6.0% pa from MYR175.1b in 2014 to MYR128.5b in 2019, while approved
foreign direct investment (FDI) increased 5.1% pa from MYR64.6b in 2014
to MYR82.9b in 2019. In pandemic-wracked 2020, DDI fell further to
MYR99.8bn (-22% YoY), while FDI came in at MYR64.2b (-22% YoY).
Exacerbating the investment deficit is uncertainty surrounding the
longevity of GLC/GLIC leadership. As was the case after the Pakatan
Harapan (PH) came to power in 2018, the new PN government has been
busy appointing and replacing key management at the country’s sprawling
GLCs (government-linked companies) and GLICs (government-linked
investment companies), all of which are under the purview of various
government ministries. Quite apart from the question of whether MPs or
other politically-affiliated personalities should be appointed to important
corporate sector positions, the threat of further potential changes to
GLC/GLICs leadership teams as the political winds change will hobble
management strategy and policy execution, to the detriment of the broad
economy.
At the equity market level, a clear lack of policy clarity is a major
investment deterrent. A slew of large economic sectors, as detailed in Fig
41 below, are awaiting government and regulatory policy
guidance/finality – this is over and above the ongoing uncertainties
created by reviews of tax structures and investment incentives, especially
given the country’s heavy fiscal burdens in the wake of Covid-19. Until
this is delivered, related private sector investment in these sectors will
remain tepid. Such policy clarity would, hence, be a significant economic
stimulus and re-rating catalyst for broad swathes of the equity market,
especially as many of these pending investments (e.g. airport expansions,
fiber broadband coverage/quality improvement) are high-multiplier in
nature, utilizing domestic labour and capital inputs, i.e. minimal leakage
(unlike, for example, the ECRL which requires large foreign labour and
capital inputs).
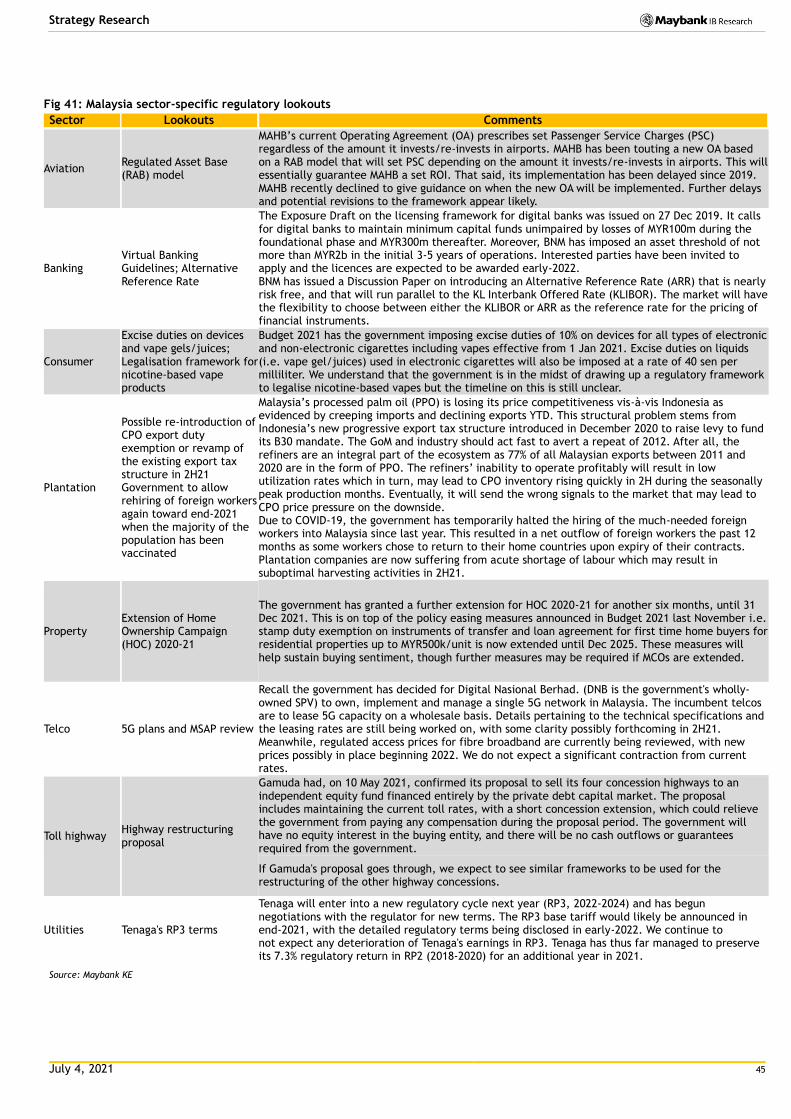
July 4, 2021 45
Strategy Research
Fig 41: Malaysia sector-specific regulatory lookouts
Sector Lookouts Comments
Aviation Regulated Asset Base (RAB) model
MAHB’s current Operating Agreement (OA) prescribes set Passenger Service Charges (PSC) regardless of the amount it invests/re-invests in airports. MAHB has been touting a new OA based on a RAB model that will set PSC depending on the amount it invests/re-invests in airports. This will essentially guarantee MAHB a set ROI. That said, its implementation has been delayed since 2019. MAHB recently declined to give guidance on when the new OA will be implemented. Further delays and potential revisions to the framework appear likely.
Banking Virtual Banking Guidelines; Alternative Reference Rate
The Exposure Draft on the licensing framework for digital banks was issued on 27 Dec 2019. It calls for digital banks to maintain minimum capital funds unimpaired by losses of MYR100m during the foundational phase and MYR300m thereafter. Moreover, BNM has imposed an asset threshold of not more than MYR2b in the initial 3-5 years of operations. Interested parties have been invited to apply and the licences are expected to be awarded early-2022. BNM has issued a Discussion Paper on introducing an Alternative Reference Rate (ARR) that is nearly risk free, and that will run parallel to the KL Interbank Offered Rate (KLIBOR). The market will have the flexibility to choose between either the KLIBOR or ARR as the reference rate for the pricing of financial instruments.
Consumer
Excise duties on devices and vape gels/juices; Legalisation framework for nicotine-based vape products
Budget 2021 has the government imposing excise duties of 10% on devices for all types of electronic and non-electronic cigarettes including vapes effective from 1 Jan 2021. Excise duties on liquids (i.e. vape gel/juices) used in electronic cigarettes will also be imposed at a rate of 40 sen per milliliter. We understand that the government is in the midst of drawing up a regulatory framework to legalise nicotine-based vapes but the timeline on this is still unclear.
Plantation
Possible re-introduction of CPO export duty exemption or revamp of the existing export tax structure in 2H21 Government to allow rehiring of foreign workers again toward end-2021 when the majority of the population has been vaccinated
Malaysia’s processed palm oil (PPO) is losing its price competitiveness vis-à-vis Indonesia as evidenced by creeping imports and declining exports YTD. This structural problem stems from Indonesia’s new progressive export tax structure introduced in December 2020 to raise levy to fund its B30 mandate. The GoM and industry should act fast to avert a repeat of 2012. After all, the refiners are an integral part of the ecosystem as 77% of all Malaysian exports between 2011 and 2020 are in the form of PPO. The refiners’ inability to operate profitably will result in low utilization rates which in turn, may lead to CPO inventory rising quickly in 2H during the seasonally peak production months. Eventually, it will send the wrong signals to the market that may lead to CPO price pressure on the downside. Due to COVID-19, the government has temporarily halted the hiring of the much-needed foreign workers into Malaysia since last year. This resulted in a net outflow of foreign workers the past 12 months as some workers chose to return to their home countries upon expiry of their contracts. Plantation companies are now suffering from acute shortage of labour which may result in suboptimal harvesting activities in 2H21.
Property Extension of Home Ownership Campaign (HOC) 2020-21
The government has granted a further extension for HOC 2020-21 for another six months, until 31 Dec 2021. This is on top of the policy easing measures announced in Budget 2021 last November i.e. stamp duty exemption on instruments of transfer and loan agreement for first time home buyers for residential properties up to MYR500k/unit is now extended until Dec 2025. These measures will help sustain buying sentiment, though further measures may be required if MCOs are extended.
Telco 5G plans and MSAP review
Recall the government has decided for Digital Nasional Berhad. (DNB is the government's wholly-owned SPV) to own, implement and manage a single 5G network in Malaysia. The incumbent telcos are to lease 5G capacity on a wholesale basis. Details pertaining to the technical specifications and the leasing rates are still being worked on, with some clarity possibly forthcoming in 2H21. Meanwhile, regulated access prices for fibre broadband are currently being reviewed, with new prices possibly in place beginning 2022. We do not expect a significant contraction from current rates.
Toll highway Highway restructuring proposal
Gamuda had, on 10 May 2021, confirmed its proposal to sell its four concession highways to an independent equity fund financed entirely by the private debt capital market. The proposal includes maintaining the current toll rates, with a short concession extension, which could relieve the government from paying any compensation during the proposal period. The government will have no equity interest in the buying entity, and there will be no cash outflows or guarantees required from the government.
If Gamuda's proposal goes through, we expect to see similar frameworks to be used for the restructuring of the other highway concessions.
Utilities Tenaga's RP3 terms
Tenaga will enter into a new regulatory cycle next year (RP3, 2022-2024) and has begun negotiations with the regulator for new terms. The RP3 base tariff would likely be announced in end-2021, with the detailed regulatory terms being disclosed in early-2022. We continue to not expect any deterioration of Tenaga's earnings in RP3. Tenaga has thus far managed to preserve its 7.3% regulatory return in RP2 (2018-2020) for an additional year in 2021.
Source: Maybank KE
July 4, 2021 46
Strategy Research
Following on from the above, we flag 4 market thematic ideas that bear watching,
and the leveraging of which could potentially deliver significant relative
outperformance for appropriately-positioned investors:
Thematic 1: GLC Restructuring
Government-linked companies (GLCs) dominate the KLCI, contributing around 40%
of KLCI market capitalisation (Fig 42) – this is ex-IHH, which we no longer consider
a GLC following Khazanah’s sale of a 16% stake in Nov 2018 to Mitsui, (which is now
the largest shareholder). Note the most recent semi-annual review of the 30-stock
KLCI in June 2021 did not involve GLCs, with rubber glove maker Supermax being
removed and replaced by recently-IPO’d consumer goods and home improvement
retailer Mr. DIY. Government-linked investment companies (GLICs) such as EPF,
PNB, Khazanah and KWAP dominate the shareholder lists of these GLCs, while state
oil & gas corporation Petronas, which is wholly-owned by the government, holds
majority stakes in its listed downstream operations. The GLCs are dominant in key
economic sectors such as banking, telcos, power, property and plantations, but
have broadly underperformed their non-GLC sector peers based on efficiency and
profitability metrics for decades.
While Malaysia, under the oversight of Khazanah, launched a GLC Transformation
(GLCT) Programme in 2004, introducing initiatives such as key performance
indicators and board-composition reform in a bid to improve accountability and
performance, the more tangible result over the programme’s 10-year course was
greater scale, not improved efficiency or shareholder returns. Such GLC dominance
effectively crowds out private capital, which is ceteris paribus, accepted as being
more efficient, competitive and value-generative for the broad economy. In
parallel, GLICs are a reliable share price support, displacing more hardnosed
private sector investors and distorting capital-market signaling that is essential to
optimizing capital allocation and value-creation discipline.
Bearing in mind the lessons learned from GLCT1, we would advocate a second and
more aggressive transformation programme (i.e. GLCT 2.0), that focuses on the
matching of capable, performance-linked and empowered management teams
with these asset-rich but efficiency lacking entities. Given their outsized
weightage in not only the equity market but also the broader economy, such GLC
reforms, if properly executed, represent the most tangible and internally-driven
opportunity to reinvigorate Malaysia’s broad economic dynamism.
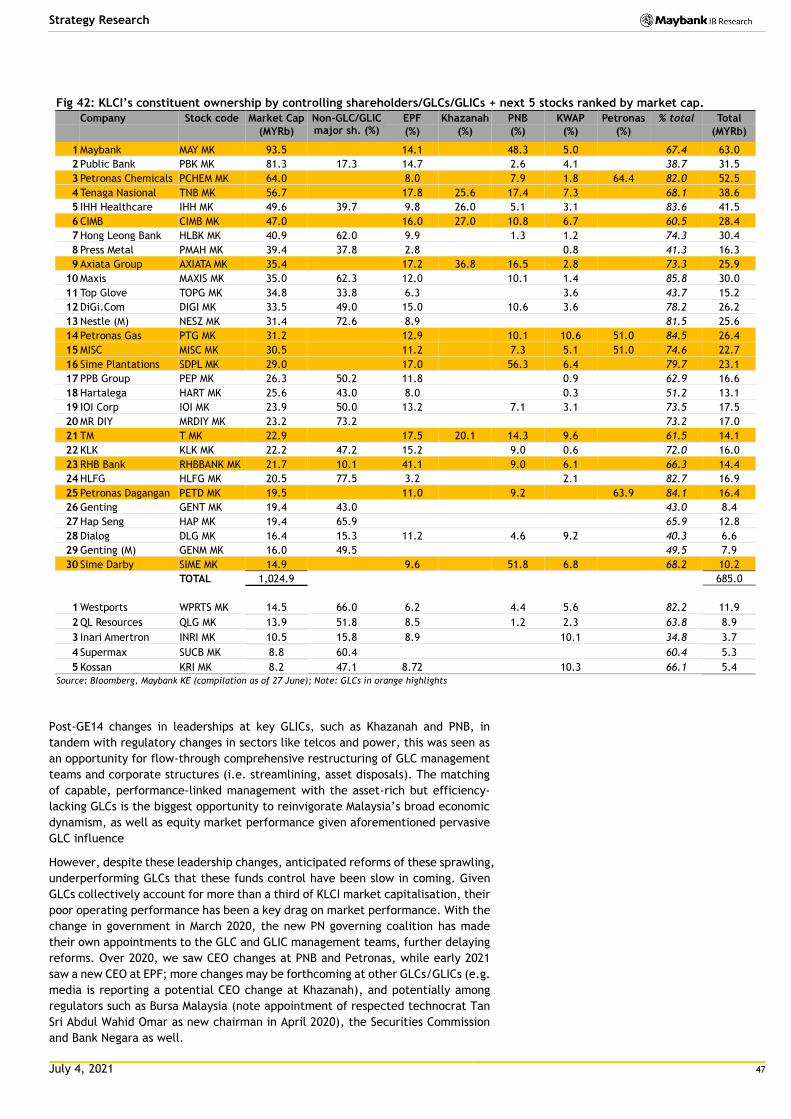
July 4, 2021 47
Strategy Research
Fig 42: KLCI’s constituent ownership by controlling shareholders/GLCs/GLICs + next 5 stocks ranked by market cap.
Company Stock code Market Cap Non-GLC/GLIC major sh. (%)
EPF Khazanah PNB KWAP Petronas % total Total (MYRb) (%) (%) (%) (%) (%)
(MYRb)
1 Maybank MAY MK 93.5 14.1 48.3 5.0 67.4 63.0
2 Public Bank PBK MK 81.3 17.3 14.7 2.6 4.1 38.7 31.5
3 Petronas Chemicals PCHEM MK 64.0 8.0 7.9 1.8 64.4 82.0 52.5
4 Tenaga Nasional TNB MK 56.7 17.8 25.6 17.4 7.3 68.1 38.6
5 IHH Healthcare IHH MK 49.6 39.7 9.8 26.0 5.1 3.1 83.6 41.5
6 CIMB CIMB MK 47.0 16.0 27.0 10.8 6.7 60.5 28.4
7 Hong Leong Bank HLBK MK 40.9 62.0 9.9 1.3 1.2 74.3 30.4
8 Press Metal PMAH MK 39.4 37.8 2.8 0.8 41.3 16.3
9 Axiata Group AXIATA MK 35.4 17.2 36.8 16.5 2.8 73.3 25.9
10 Maxis MAXIS MK 35.0 62.3 12.0 10.1 1.4 85.8 30.0
11 Top Glove TOPG MK 34.8 33.8 6.3 3.6 43.7 15.2
12 DiGi.Com DIGI MK 33.5 49.0 15.0 10.6 3.6 78.2 26.2
13 Nestle (M) NESZ MK 31.4 72.6 8.9 81.5 25.6
14 Petronas Gas PTG MK 31.2 12.9 10.1 10.6 51.0 84.5 26.4
15 MISC MISC MK 30.5 11.2 7.3 5.1 51.0 74.6 22.7
16 Sime Plantations SDPL MK 29.0 17.0 56.3 6.4 79.7 23.1
17 PPB Group PEP MK 26.3 50.2 11.8 0.9 62.9 16.6
18 Hartalega HART MK 25.6 43.0 8.0 0.3 51.2 13.1
19 IOI Corp IOI MK 23.9 50.0 13.2 7.1 3.1 73.5 17.5
20 MR DIY MRDIY MK 23.2 73.2 73.2 17.0
21 TM T MK 22.9 17.5 20.1 14.3 9.6 61.5 14.1
22 KLK KLK MK 22.2 47.2 15.2 9.0 0.6 72.0 16.0
23 RHB Bank RHBBANK MK 21.7 10.1 41.1 9.0 6.1 66.3 14.4
24 HLFG HLFG MK 20.5 77.5 3.2 2.1 82.7 16.9
25 Petronas Dagangan PETD MK 19.5 11.0 9.2 63.9 84.1 16.4
26 Genting GENT MK 19.4 43.0 43.0 8.4
27 Hap Seng HAP MK 19.4 65.9 65.9 12.8
28 Dialog DLG MK 16.4 15.3 11.2 4.6 9.2 40.3 6.6
29 Genting (M) GENM MK 16.0 49.5 49.5 7.9
30 Sime Darby SIME MK 14.9 9.6 51.8 6.8 68.2 10.2
TOTAL 1,024.9 685.0
1 Westports WPRTS MK 14.5 66.0 6.2 4.4 5.6 82.2 11.9
2 QL Resources QLG MK 13.9 51.8 8.5 1.2 2.3 63.8 8.9
3 Inari Amertron INRI MK 10.5 15.8 8.9 10.1 34.8 3.7
4 Supermax SUCB MK 8.8 60.4 60.4 5.3
5 Kossan KRI MK 8.2 47.1 8.72 10.3 66.1 5.4
Source: Bloomberg, Maybank KE (compilation as of 27 June); Note: GLCs in orange highlights
Post-GE14 changes in leaderships at key GLICs, such as Khazanah and PNB, in
tandem with regulatory changes in sectors like telcos and power, this was seen as
an opportunity for flow-through comprehensive restructuring of GLC management
teams and corporate structures (i.e. streamlining, asset disposals). The matching
of capable, performance-linked management with the asset-rich but efficiency-
lacking GLCs is the biggest opportunity to reinvigorate Malaysia’s broad economic
dynamism, as well as equity market performance given aforementioned pervasive
GLC influence
However, despite these leadership changes, anticipated reforms of these sprawling,
underperforming GLCs that these funds control have been slow in coming. Given
GLCs collectively account for more than a third of KLCI market capitalisation, their
poor operating performance has been a key drag on market performance. With the
change in government in March 2020, the new PN governing coalition has made
their own appointments to the GLC and GLIC management teams, further delaying
reforms. Over 2020, we saw CEO changes at PNB and Petronas, while early 2021
saw a new CEO at EPF; more changes may be forthcoming at other GLCs/GLICs (e.g.
media is reporting a potential CEO change at Khazanah), and potentially among
regulators such as Bursa Malaysia (note appointment of respected technocrat Tan
Sri Abdul Wahid Omar as new chairman in April 2020), the Securities Commission
and Bank Negara as well.
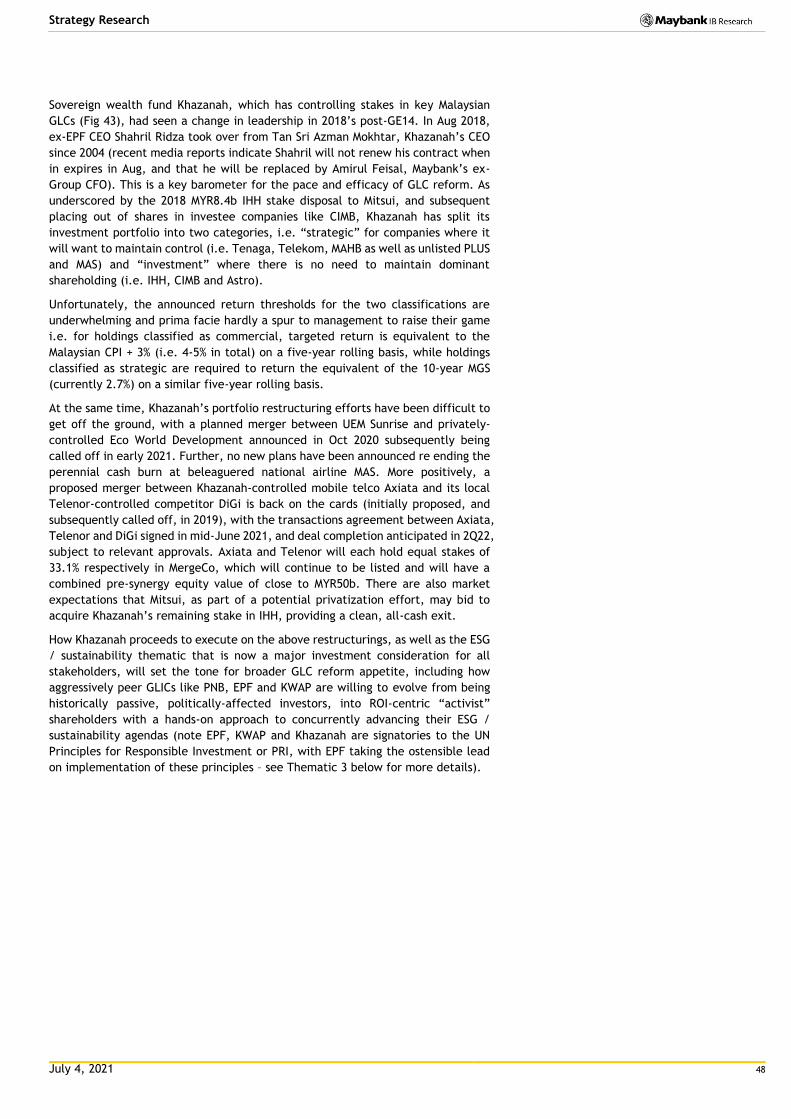
July 4, 2021 48
Strategy Research
Sovereign wealth fund Khazanah, which has controlling stakes in key Malaysian
GLCs (Fig 43), had seen a change in leadership in 2018’s post-GE14. In Aug 2018,
ex-EPF CEO Shahril Ridza took over from Tan Sri Azman Mokhtar, Khazanah’s CEO
since 2004 (recent media reports indicate Shahril will not renew his contract when
in expires in Aug, and that he will be replaced by Amirul Feisal, Maybank’s ex-
Group CFO). This is a key barometer for the pace and efficacy of GLC reform. As
underscored by the 2018 MYR8.4b IHH stake disposal to Mitsui, and subsequent
placing out of shares in investee companies like CIMB, Khazanah has split its
investment portfolio into two categories, i.e. “strategic” for companies where it
will want to maintain control (i.e. Tenaga, Telekom, MAHB as well as unlisted PLUS
and MAS) and “investment” where there is no need to maintain dominant
shareholding (i.e. IHH, CIMB and Astro).
Unfortunately, the announced return thresholds for the two classifications are
underwhelming and prima facie hardly a spur to management to raise their game
i.e. for holdings classified as commercial, targeted return is equivalent to the
Malaysian CPI + 3% (i.e. 4-5% in total) on a five-year rolling basis, while holdings
classified as strategic are required to return the equivalent of the 10-year MGS
(currently 2.7%) on a similar five-year rolling basis.
At the same time, Khazanah’s portfolio restructuring efforts have been difficult to
get off the ground, with a planned merger between UEM Sunrise and privately-
controlled Eco World Development announced in Oct 2020 subsequently being
called off in early 2021. Further, no new plans have been announced re ending the
perennial cash burn at beleaguered national airline MAS. More positively, a
proposed merger between Khazanah-controlled mobile telco Axiata and its local
Telenor-controlled competitor DiGi is back on the cards (initially proposed, and
subsequently called off, in 2019), with the transactions agreement between Axiata,
Telenor and DiGi signed in mid-June 2021, and deal completion anticipated in 2Q22,
subject to relevant approvals. Axiata and Telenor will each hold equal stakes of
33.1% respectively in MergeCo, which will continue to be listed and will have a
combined pre-synergy equity value of close to MYR50b. There are also market
expectations that Mitsui, as part of a potential privatization effort, may bid to
acquire Khazanah’s remaining stake in IHH, providing a clean, all-cash exit.
How Khazanah proceeds to execute on the above restructurings, as well as the ESG
/ sustainability thematic that is now a major investment consideration for all
stakeholders, will set the tone for broader GLC reform appetite, including how
aggressively peer GLICs like PNB, EPF and KWAP are willing to evolve from being
historically passive, politically-affected investors, into ROI-centric “activist”
shareholders with a hands-on approach to concurrently advancing their ESG /
sustainability agendas (note EPF, KWAP and Khazanah are signatories to the UN
Principles for Responsible Investment or PRI, with EPF taking the ostensible lead
on implementation of these principles – see Thematic 3 below for more details).
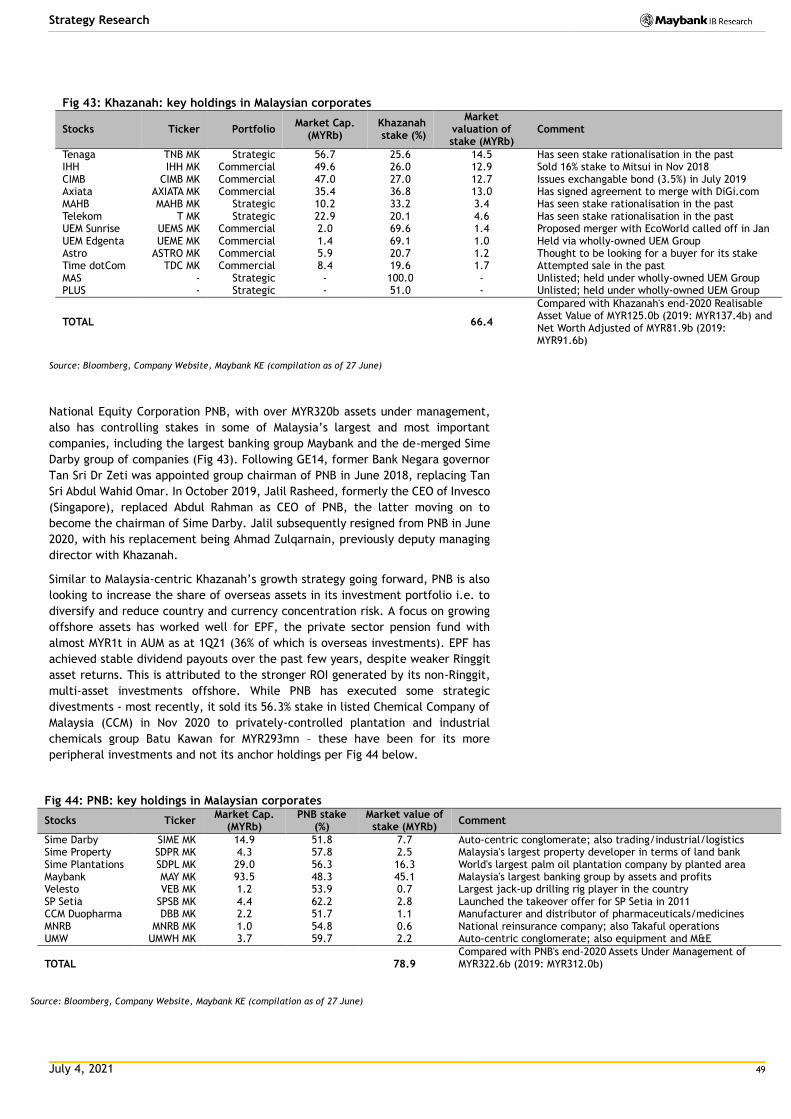
July 4, 2021 49
Strategy Research
Fig 43: Khazanah: key holdings in Malaysian corporates
Stocks Ticker Portfolio Market Cap.
(MYRb) Khazanah stake (%)
Market valuation of stake (MYRb)
Comment
Tenaga TNB MK Strategic 56.7 25.6 14.5 Has seen stake rationalisation in the past IHH IHH MK Commercial 49.6 26.0 12.9 Sold 16% stake to Mitsui in Nov 2018 CIMB CIMB MK Commercial 47.0 27.0 12.7 Issues exchangable bond (3.5%) in July 2019 Axiata AXIATA MK Commercial 35.4 36.8 13.0 Has signed agreement to merge with DiGi.com MAHB MAHB MK Strategic 10.2 33.2 3.4 Has seen stake rationalisation in the past Telekom T MK Strategic 22.9 20.1 4.6 Has seen stake rationalisation in the past UEM Sunrise UEMS MK Commercial 2.0 69.6 1.4 Proposed merger with EcoWorld called off in Jan UEM Edgenta UEME MK Commercial 1.4 69.1 1.0 Held via wholly-owned UEM Group Astro ASTRO MK Commercial 5.9 20.7 1.2 Thought to be looking for a buyer for its stake Time dotCom TDC MK Commercial 8.4 19.6 1.7 Attempted sale in the past MAS - Strategic - 100.0 - Unlisted; held under wholly-owned UEM Group PLUS - Strategic - 51.0 - Unlisted; held under wholly-owned UEM Group
TOTAL 66.4
Compared with Khazanah's end-2020 Realisable Asset Value of MYR125.0b (2019: MYR137.4b) and Net Worth Adjusted of MYR81.9b (2019: MYR91.6b)
Source: Bloomberg, Company Website, Maybank KE (compilation as of 27 June)
National Equity Corporation PNB, with over MYR320b assets under management,
also has controlling stakes in some of Malaysia’s largest and most important
companies, including the largest banking group Maybank and the de-merged Sime
Darby group of companies (Fig 43). Following GE14, former Bank Negara governor
Tan Sri Dr Zeti was appointed group chairman of PNB in June 2018, replacing Tan
Sri Abdul Wahid Omar. In October 2019, Jalil Rasheed, formerly the CEO of Invesco
(Singapore), replaced Abdul Rahman as CEO of PNB, the latter moving on to
become the chairman of Sime Darby. Jalil subsequently resigned from PNB in June
2020, with his replacement being Ahmad Zulqarnain, previously deputy managing
director with Khazanah.
Similar to Malaysia-centric Khazanah’s growth strategy going forward, PNB is also
looking to increase the share of overseas assets in its investment portfolio i.e. to
diversify and reduce country and currency concentration risk. A focus on growing
offshore assets has worked well for EPF, the private sector pension fund with
almost MYR1t in AUM as at 1Q21 (36% of which is overseas investments). EPF has
achieved stable dividend payouts over the past few years, despite weaker Ringgit
asset returns. This is attributed to the stronger ROI generated by its non-Ringgit,
multi-asset investments offshore. While PNB has executed some strategic
divestments - most recently, it sold its 56.3% stake in listed Chemical Company of
Malaysia (CCM) in Nov 2020 to privately-controlled plantation and industrial
chemicals group Batu Kawan for MYR293mn – these have been for its more
peripheral investments and not its anchor holdings per Fig 44 below.
Fig 44: PNB: key holdings in Malaysian corporates
Stocks Ticker Market Cap.
(MYRb) PNB stake
(%) Market value of
stake (MYRb) Comment
Sime Darby SIME MK 14.9 51.8 7.7 Auto-centric conglomerate; also trading/industrial/logistics Sime Property SDPR MK 4.3 57.8 2.5 Malaysia's largest property developer in terms of land bank Sime Plantations SDPL MK 29.0 56.3 16.3 World's largest palm oil plantation company by planted area Maybank MAY MK 93.5 48.3 45.1 Malaysia's largest banking group by assets and profits Velesto VEB MK 1.2 53.9 0.7 Largest jack-up drilling rig player in the country SP Setia SPSB MK 4.4 62.2 2.8 Launched the takeover offer for SP Setia in 2011 CCM Duopharma DBB MK 2.2 51.7 1.1 Manufacturer and distributor of pharmaceuticals/medicines MNRB MNRB MK 1.0 54.8 0.6 National reinsurance company; also Takaful operations UMW UMWH MK 3.7 59.7 2.2 Auto-centric conglomerate; also equipment and M&E
TOTAL
78.9 Compared with PNB's end-2020 Assets Under Management of MYR322.6b (2019: MYR312.0b)
Source: Bloomberg, Company Website, Maybank KE (compilation as of 27 June)
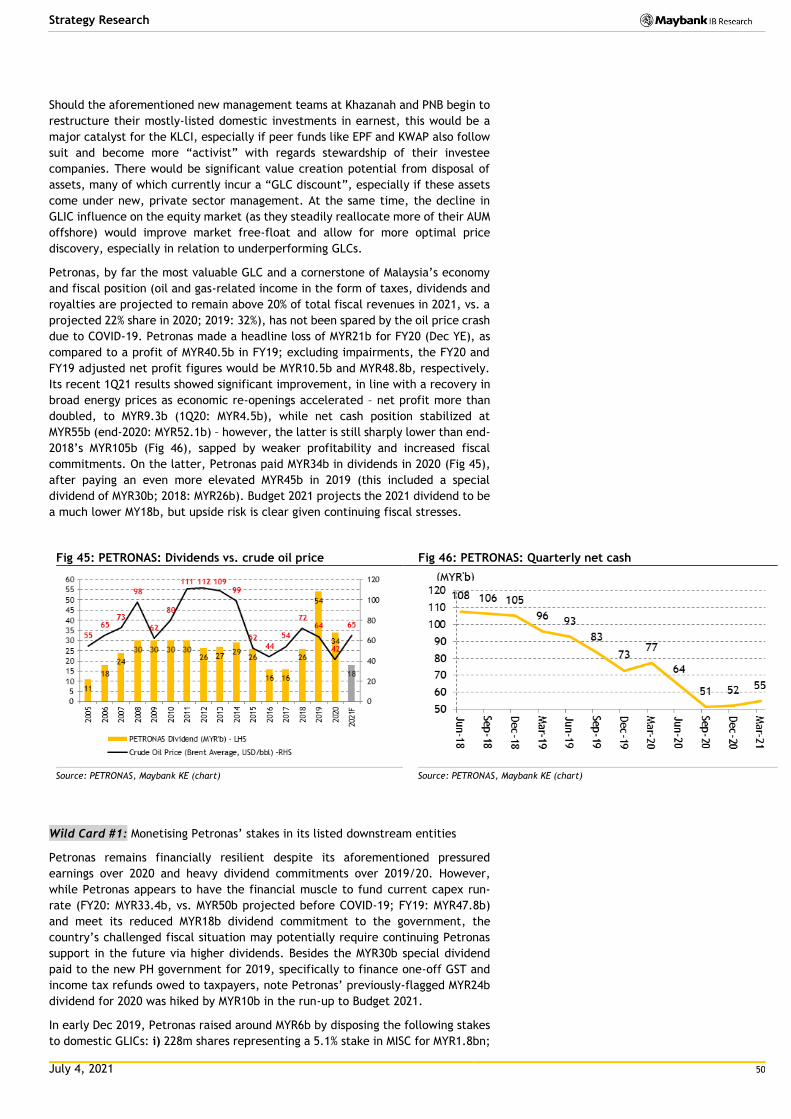
July 4, 2021 50
Strategy Research
Should the aforementioned new management teams at Khazanah and PNB begin to
restructure their mostly-listed domestic investments in earnest, this would be a
major catalyst for the KLCI, especially if peer funds like EPF and KWAP also follow
suit and become more “activist” with regards stewardship of their investee
companies. There would be significant value creation potential from disposal of
assets, many of which currently incur a “GLC discount”, especially if these assets
come under new, private sector management. At the same time, the decline in
GLIC influence on the equity market (as they steadily reallocate more of their AUM
offshore) would improve market free-float and allow for more optimal price
discovery, especially in relation to underperforming GLCs.
Petronas, by far the most valuable GLC and a cornerstone of Malaysia’s economy
and fiscal position (oil and gas-related income in the form of taxes, dividends and
royalties are projected to remain above 20% of total fiscal revenues in 2021, vs. a
projected 22% share in 2020; 2019: 32%), has not been spared by the oil price crash
due to COVID-19. Petronas made a headline loss of MYR21b for FY20 (Dec YE), as
compared to a profit of MYR40.5b in FY19; excluding impairments, the FY20 and
FY19 adjusted net profit figures would be MYR10.5b and MYR48.8b, respectively.
Its recent 1Q21 results showed significant improvement, in line with a recovery in
broad energy prices as economic re-openings accelerated – net profit more than
doubled, to MYR9.3b (1Q20: MYR4.5b), while net cash position stabilized at
MYR55b (end-2020: MYR52.1b) – however, the latter is still sharply lower than end-
2018’s MYR105b (Fig 46), sapped by weaker profitability and increased fiscal
commitments. On the latter, Petronas paid MYR34b in dividends in 2020 (Fig 45),
after paying an even more elevated MYR45b in 2019 (this included a special
dividend of MYR30b; 2018: MYR26b). Budget 2021 projects the 2021 dividend to be
a much lower MY18b, but upside risk is clear given continuing fiscal stresses.
Fig 45: PETRONAS: Dividends vs. crude oil price Fig 46: PETRONAS: Quarterly net cash
Source: PETRONAS, Maybank KE (chart) Source: PETRONAS, Maybank KE (chart)
Wild Card #1: Monetising Petronas’ stakes in its listed downstream entities
Petronas remains financially resilient despite its aforementioned pressured
earnings over 2020 and heavy dividend commitments over 2019/20. However,
while Petronas appears to have the financial muscle to fund current capex run-
rate (FY20: MYR33.4b, vs. MYR50b projected before COVID-19; FY19: MYR47.8b)
and meet its reduced MYR18b dividend commitment to the government, the
country’s challenged fiscal situation may potentially require continuing Petronas
support in the future via higher dividends. Besides the MYR30b special dividend
paid to the new PH government for 2019, specifically to finance one-off GST and
income tax refunds owed to taxpayers, note Petronas’ previously-flagged MYR24b
dividend for 2020 was hiked by MYR10b in the run-up to Budget 2021.
In early Dec 2019, Petronas raised around MYR6b by disposing the following stakes
to domestic GLICs: i) 228m shares representing a 5.1% stake in MISC for MYR1.8bn;
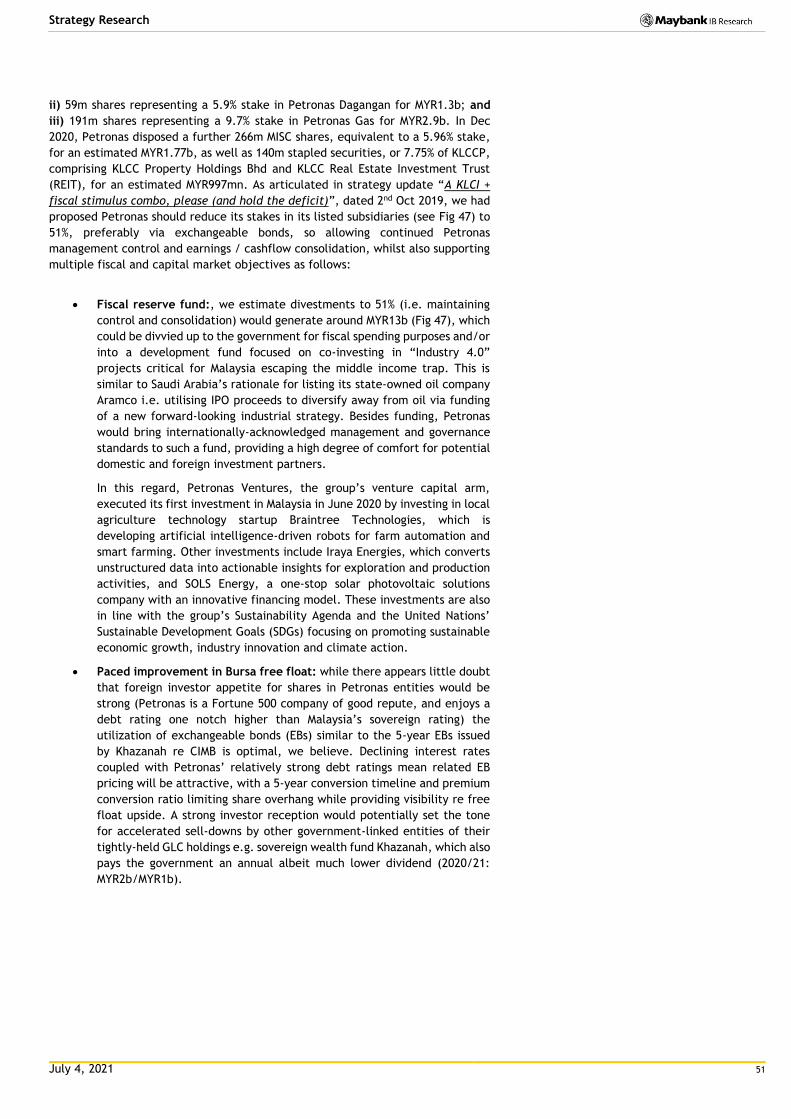
July 4, 2021 51
Strategy Research
ii) 59m shares representing a 5.9% stake in Petronas Dagangan for MYR1.3b; and
iii) 191m shares representing a 9.7% stake in Petronas Gas for MYR2.9b. In Dec
2020, Petronas disposed a further 266m MISC shares, equivalent to a 5.96% stake,
for an estimated MYR1.77b, as well as 140m stapled securities, or 7.75% of KLCCP,
comprising KLCC Property Holdings Bhd and KLCC Real Estate Investment Trust
(REIT), for an estimated MYR997mn. As articulated in strategy update “A KLCI +
fiscal stimulus combo, please (and hold the deficit)”, dated 2nd Oct 2019, we had
proposed Petronas should reduce its stakes in its listed subsidiaries (see Fig 47) to
51%, preferably via exchangeable bonds, so allowing continued Petronas
management control and earnings / cashflow consolidation, whilst also supporting
multiple fiscal and capital market objectives as follows:
Fiscal reserve fund:, we estimate divestments to 51% (i.e. maintaining
control and consolidation) would generate around MYR13b (Fig 47), which
could be divvied up to the government for fiscal spending purposes and/or
into a development fund focused on co-investing in “Industry 4.0”
projects critical for Malaysia escaping the middle income trap. This is
similar to Saudi Arabia’s rationale for listing its state-owned oil company
Aramco i.e. utilising IPO proceeds to diversify away from oil via funding
of a new forward-looking industrial strategy. Besides funding, Petronas
would bring internationally-acknowledged management and governance
standards to such a fund, providing a high degree of comfort for potential
domestic and foreign investment partners.
In this regard, Petronas Ventures, the group’s venture capital arm,
executed its first investment in Malaysia in June 2020 by investing in local
agriculture technology startup Braintree Technologies, which is
developing artificial intelligence-driven robots for farm automation and
smart farming. Other investments include Iraya Energies, which converts
unstructured data into actionable insights for exploration and production
activities, and SOLS Energy, a one-stop solar photovoltaic solutions
company with an innovative financing model. These investments are also
in line with the group’s Sustainability Agenda and the United Nations’
Sustainable Development Goals (SDGs) focusing on promoting sustainable
economic growth, industry innovation and climate action.
Paced improvement in Bursa free float: while there appears little doubt
that foreign investor appetite for shares in Petronas entities would be
strong (Petronas is a Fortune 500 company of good repute, and enjoys a
debt rating one notch higher than Malaysia’s sovereign rating) the
utilization of exchangeable bonds (EBs) similar to the 5-year EBs issued
by Khazanah re CIMB is optimal, we believe. Declining interest rates
coupled with Petronas’ relatively strong debt ratings mean related EB
pricing will be attractive, with a 5-year conversion timeline and premium
conversion ratio limiting share overhang while providing visibility re free
float upside. A strong investor reception would potentially set the tone
for accelerated sell-downs by other government-linked entities of their
tightly-held GLC holdings e.g. sovereign wealth fund Khazanah, which also
pays the government an annual albeit much lower dividend (2020/21:
MYR2b/MYR1b).
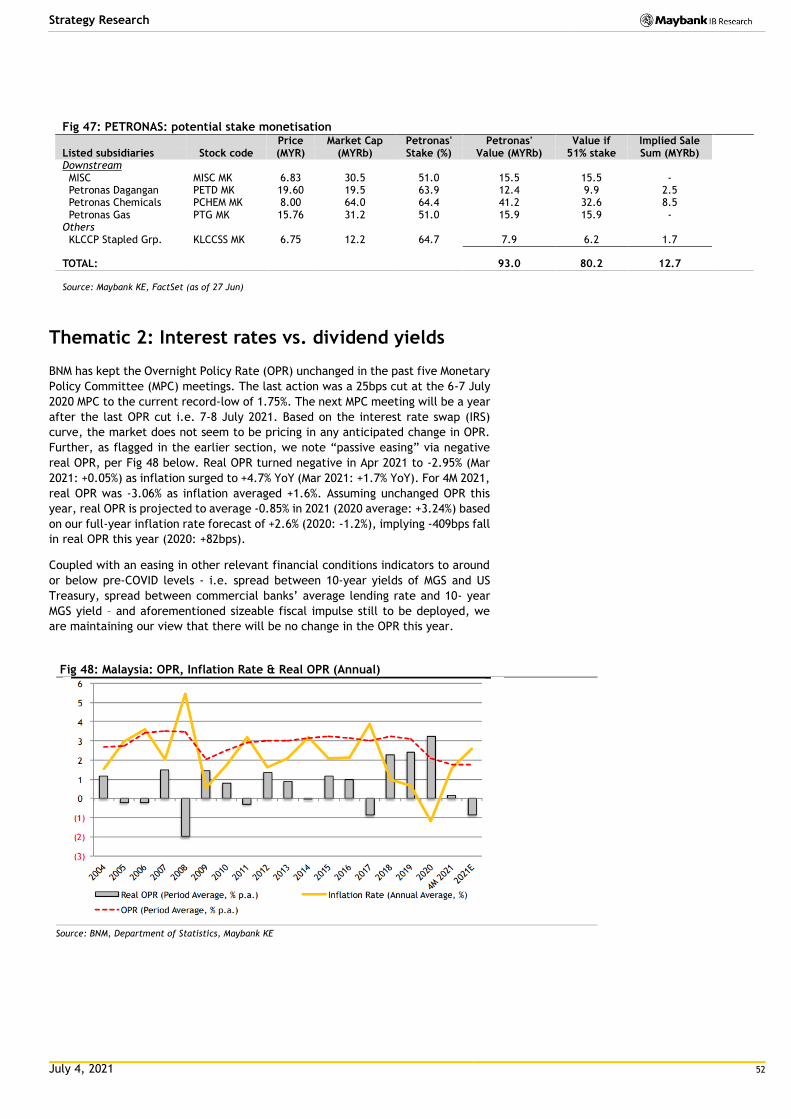
July 4, 2021 52
Strategy Research
Fig 47: PETRONAS: potential stake monetisation
Price Market Cap Petronas' Petronas' Value if Implied Sale Listed subsidiaries Stock code (MYR) (MYRb) Stake (%) Value (MYRb) 51% stake Sum (MYRb) Downstream MISC MISC MK 6.83 30.5 51.0 15.5 15.5 - Petronas Dagangan PETD MK 19.60 19.5 63.9 12.4 9.9 2.5 Petronas Chemicals PCHEM MK 8.00 64.0 64.4 41.2 32.6 8.5 Petronas Gas PTG MK 15.76 31.2 51.0 15.9 15.9 - Others KLCCP Stapled Grp. KLCCSS MK 6.75 12.2 64.7 7.9 6.2 1.7
TOTAL: 93.0 80.2 12.7 Source: Maybank KE, FactSet (as of 27 Jun)
Thematic 2: Interest rates vs. dividend yields
BNM has kept the Overnight Policy Rate (OPR) unchanged in the past five Monetary
Policy Committee (MPC) meetings. The last action was a 25bps cut at the 6-7 July
2020 MPC to the current record-low of 1.75%. The next MPC meeting will be a year
after the last OPR cut i.e. 7-8 July 2021. Based on the interest rate swap (IRS)
curve, the market does not seem to be pricing in any anticipated change in OPR.
Further, as flagged in the earlier section, we note “passive easing” via negative
real OPR, per Fig 48 below. Real OPR turned negative in Apr 2021 to -2.95% (Mar
2021: +0.05%) as inflation surged to +4.7% YoY (Mar 2021: +1.7% YoY). For 4M 2021,
real OPR was -3.06% as inflation averaged +1.6%. Assuming unchanged OPR this
year, real OPR is projected to average -0.85% in 2021 (2020 average: +3.24%) based
on our full-year inflation rate forecast of +2.6% (2020: -1.2%), implying -409bps fall
in real OPR this year (2020: +82bps).
Coupled with an easing in other relevant financial conditions indicators to around
or below pre-COVID levels - i.e. spread between 10-year yields of MGS and US
Treasury, spread between commercial banks’ average lending rate and 10- year
MGS yield – and aforementioned sizeable fiscal impulse still to be deployed, we
are maintaining our view that there will be no change in the OPR this year.
Fig 48: Malaysia: OPR, Inflation Rate & Real OPR (Annual)
Source: BNM, Department of Statistics, Maybank KE
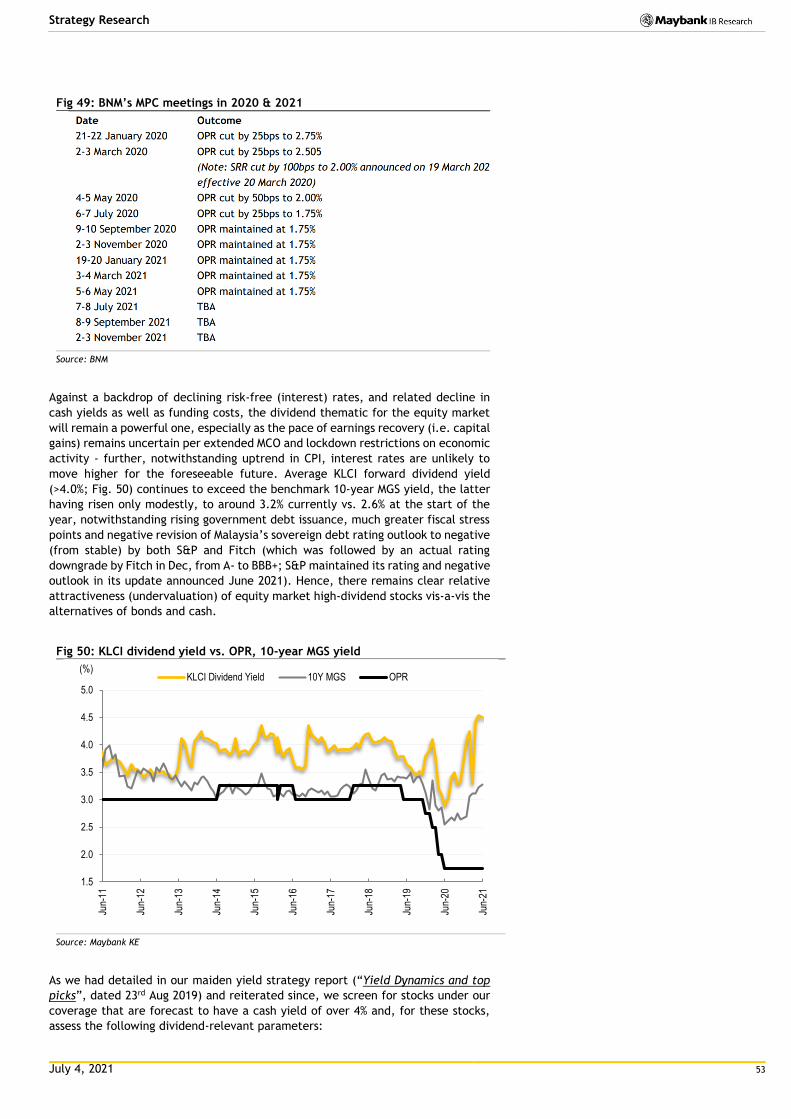
July 4, 2021 53
Strategy Research
Fig 49: BNM’s MPC meetings in 2020 & 2021
Source: BNM
Against a backdrop of declining risk-free (interest) rates, and related decline in
cash yields as well as funding costs, the dividend thematic for the equity market
will remain a powerful one, especially as the pace of earnings recovery (i.e. capital
gains) remains uncertain per extended MCO and lockdown restrictions on economic
activity - further, notwithstanding uptrend in CPI, interest rates are unlikely to
move higher for the foreseeable future. Average KLCI forward dividend yield
(>4.0%; Fig. 50) continues to exceed the benchmark 10-year MGS yield, the latter
having risen only modestly, to around 3.2% currently vs. 2.6% at the start of the
year, notwithstanding rising government debt issuance, much greater fiscal stress
points and negative revision of Malaysia’s sovereign debt rating outlook to negative
(from stable) by both S&P and Fitch (which was followed by an actual rating
downgrade by Fitch in Dec, from A- to BBB+; S&P maintained its rating and negative
outlook in its update announced June 2021). Hence, there remains clear relative
attractiveness (undervaluation) of equity market high-dividend stocks vis-a-vis the
alternatives of bonds and cash.
Fig 50: KLCI dividend yield vs. OPR, 10-year MGS yield
Source: Maybank KE
As we had detailed in our maiden yield strategy report (“Yield Dynamics and top
picks”, dated 23rd Aug 2019) and reiterated since, we screen for stocks under our
coverage that are forecast to have a cash yield of over 4% and, for these stocks,
assess the following dividend-relevant parameters:
1.5
2.0
2.5
3.0
3.5
4.0
4.5
5.0
Jun-
11
Jun-
12
Jun-
13
Jun-
14
Jun-
15
Jun-
16
Jun-
17
Jun-
18
Jun-
19
Jun-
20
Jun-
21
(%)KLCI Dividend Yield 10Y MGS OPR
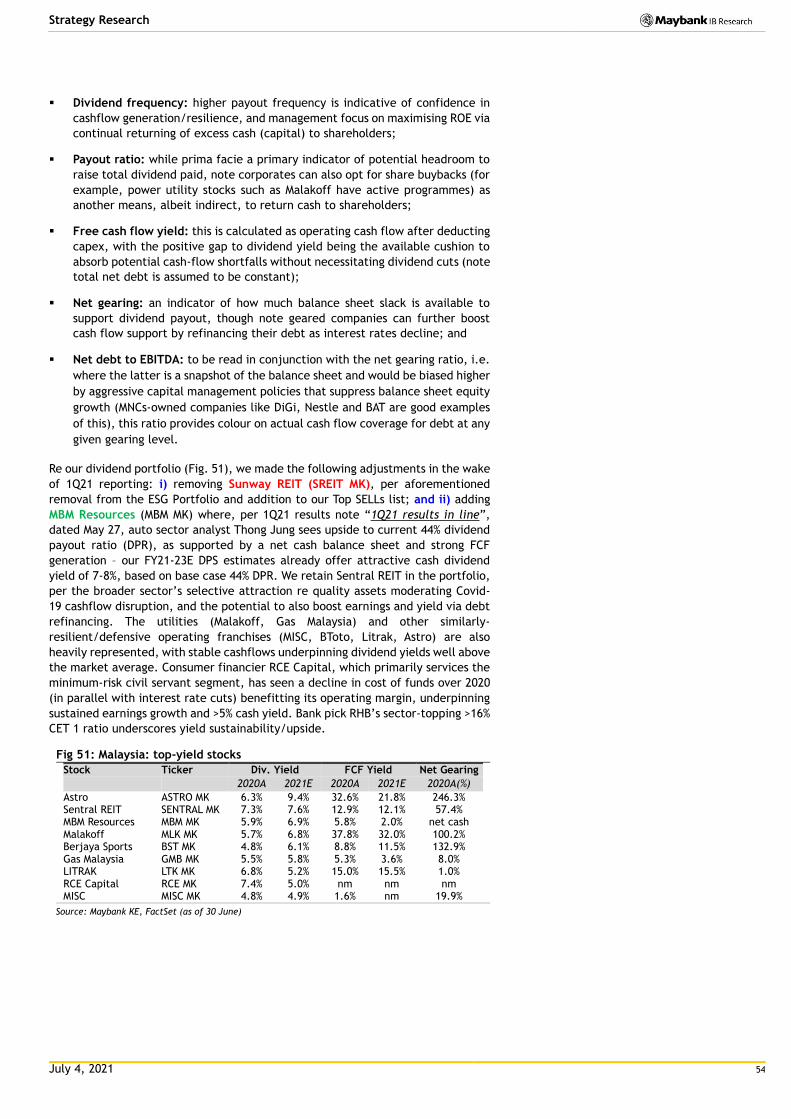
July 4, 2021 54
Strategy Research
Dividend frequency: higher payout frequency is indicative of confidence in
cashflow generation/resilience, and management focus on maximising ROE via
continual returning of excess cash (capital) to shareholders;
Payout ratio: while prima facie a primary indicator of potential headroom to
raise total dividend paid, note corporates can also opt for share buybacks (for
example, power utility stocks such as Malakoff have active programmes) as
another means, albeit indirect, to return cash to shareholders;
Free cash flow yield: this is calculated as operating cash flow after deducting
capex, with the positive gap to dividend yield being the available cushion to
absorb potential cash-flow shortfalls without necessitating dividend cuts (note
total net debt is assumed to be constant);
Net gearing: an indicator of how much balance sheet slack is available to
support dividend payout, though note geared companies can further boost
cash flow support by refinancing their debt as interest rates decline; and
Net debt to EBITDA: to be read in conjunction with the net gearing ratio, i.e.
where the latter is a snapshot of the balance sheet and would be biased higher
by aggressive capital management policies that suppress balance sheet equity
growth (MNCs-owned companies like DiGi, Nestle and BAT are good examples
of this), this ratio provides colour on actual cash flow coverage for debt at any
given gearing level.
Re our dividend portfolio (Fig. 51), we made the following adjustments in the wake
of 1Q21 reporting: i) removing Sunway REIT (SREIT MK), per aforementioned
removal from the ESG Portfolio and addition to our Top SELLs list; and ii) adding
MBM Resources (MBM MK) where, per 1Q21 results note “1Q21 results in line”,
dated May 27, auto sector analyst Thong Jung sees upside to current 44% dividend
payout ratio (DPR), as supported by a net cash balance sheet and strong FCF
generation – our FY21-23E DPS estimates already offer attractive cash dividend
yield of 7-8%, based on base case 44% DPR. We retain Sentral REIT in the portfolio,
per the broader sector’s selective attraction re quality assets moderating Covid-
19 cashflow disruption, and the potential to also boost earnings and yield via debt
refinancing. The utilities (Malakoff, Gas Malaysia) and other similarly-
resilient/defensive operating franchises (MISC, BToto, Litrak, Astro) are also
heavily represented, with stable cashflows underpinning dividend yields well above
the market average. Consumer financier RCE Capital, which primarily services the
minimum-risk civil servant segment, has seen a decline in cost of funds over 2020
(in parallel with interest rate cuts) benefitting its operating margin, underpinning
sustained earnings growth and >5% cash yield. Bank pick RHB’s sector-topping >16%
CET 1 ratio underscores yield sustainability/upside.
Fig 51: Malaysia: top-yield stocks
Stock Ticker Div. Yield FCF Yield Net Gearing
2020A 2021E 2020A 2021E 2020A(%)
Astro ASTRO MK 6.3% 9.4% 32.6% 21.8% 246.3% Sentral REIT SENTRAL MK 7.3% 7.6% 12.9% 12.1% 57.4% MBM Resources MBM MK 5.9% 6.9% 5.8% 2.0% net cash Malakoff MLK MK 5.7% 6.8% 37.8% 32.0% 100.2% Berjaya Sports BST MK 4.8% 6.1% 8.8% 11.5% 132.9% Gas Malaysia GMB MK 5.5% 5.8% 5.3% 3.6% 8.0% LITRAK LTK MK 6.8% 5.2% 15.0% 15.5% 1.0% RCE Capital RCE MK 7.4% 5.0% nm nm nm MISC MISC MK 4.8% 4.9% 1.6% nm 19.9%
Source: Maybank KE, FactSet (as of 30 June)
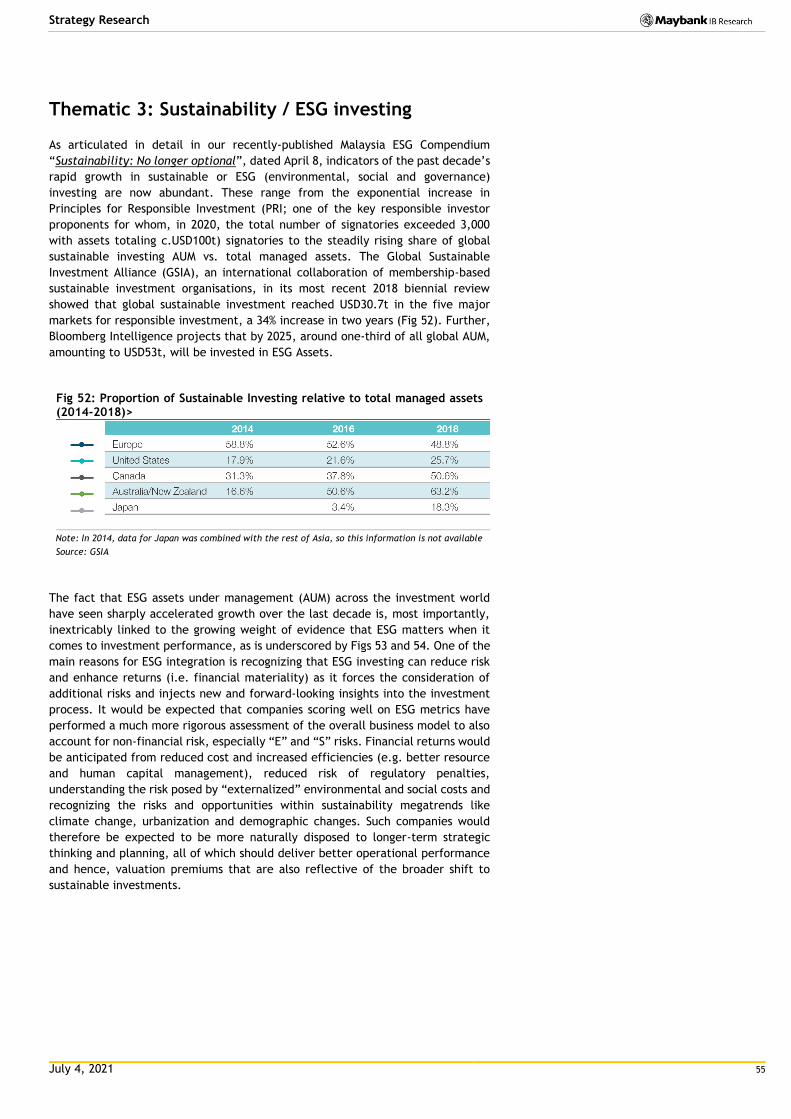
July 4, 2021 55
Strategy Research
Thematic 3: Sustainability / ESG investing
As articulated in detail in our recently-published Malaysia ESG Compendium
“Sustainability: No longer optional”, dated April 8, indicators of the past decade’s
rapid growth in sustainable or ESG (environmental, social and governance)
investing are now abundant. These range from the exponential increase in
Principles for Responsible Investment (PRI; one of the key responsible investor
proponents for whom, in 2020, the total number of signatories exceeded 3,000
with assets totaling c.USD100t) signatories to the steadily rising share of global
sustainable investing AUM vs. total managed assets. The Global Sustainable
Investment Alliance (GSIA), an international collaboration of membership-based
sustainable investment organisations, in its most recent 2018 biennial review
showed that global sustainable investment reached USD30.7t in the five major
markets for responsible investment, a 34% increase in two years (Fig 52). Further,
Bloomberg Intelligence projects that by 2025, around one-third of all global AUM,
amounting to USD53t, will be invested in ESG Assets.
Fig 52: Proportion of Sustainable Investing relative to total managed assets (2014-2018)>
Note: In 2014, data for Japan was combined with the rest of Asia, so this information is not available
Source: GSIA
The fact that ESG assets under management (AUM) across the investment world
have seen sharply accelerated growth over the last decade is, most importantly,
inextricably linked to the growing weight of evidence that ESG matters when it
comes to investment performance, as is underscored by Figs 53 and 54. One of the
main reasons for ESG integration is recognizing that ESG investing can reduce risk
and enhance returns (i.e. financial materiality) as it forces the consideration of
additional risks and injects new and forward-looking insights into the investment
process. It would be expected that companies scoring well on ESG metrics have
performed a much more rigorous assessment of the overall business model to also
account for non-financial risk, especially “E” and “S” risks. Financial returns would
be anticipated from reduced cost and increased efficiencies (e.g. better resource
and human capital management), reduced risk of regulatory penalties,
understanding the risk posed by “externalized” environmental and social costs and
recognizing the risks and opportunities within sustainability megatrends like
climate change, urbanization and demographic changes. Such companies would
therefore be expected to be more naturally disposed to longer-term strategic
thinking and planning, all of which should deliver better operational performance
and hence, valuation premiums that are also reflective of the broader shift to
sustainable investments.
Fig 1: Proportion of Sustainable Investing relative to total managed assets (2014-2018)
Source: GSIA
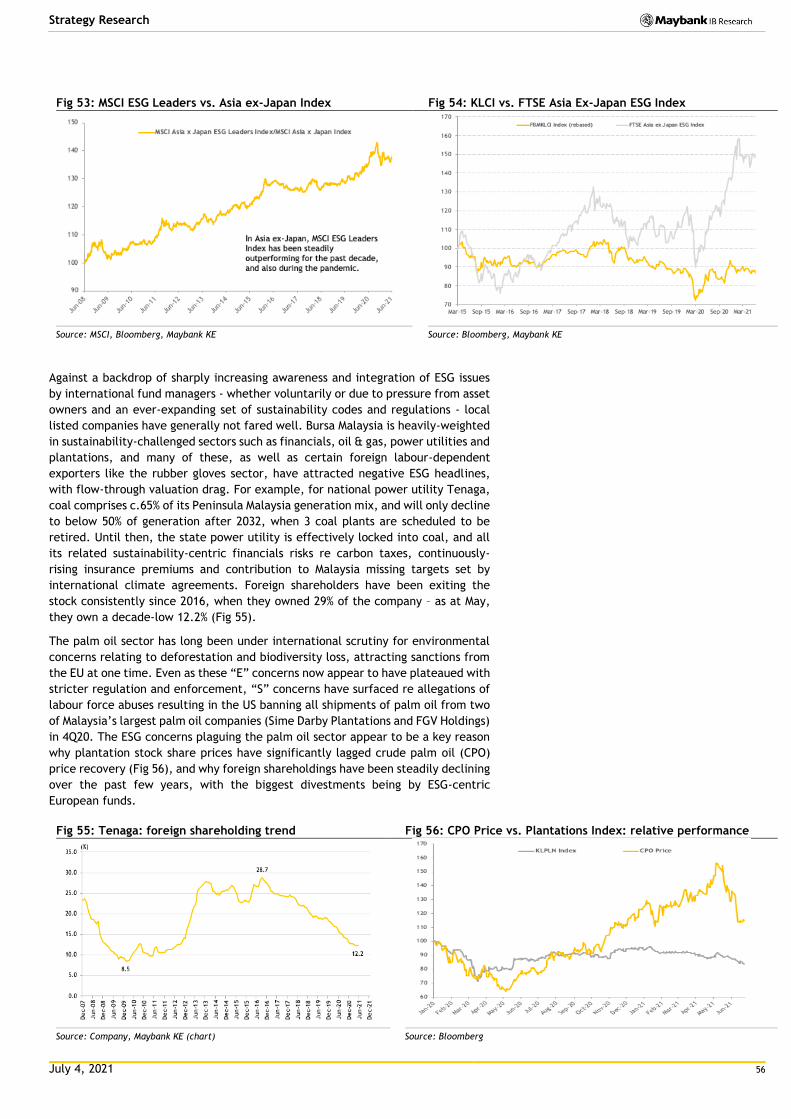
July 4, 2021 56
Strategy Research
Fig 53: MSCI ESG Leaders vs. Asia ex-Japan Index Fig 54: KLCI vs. FTSE Asia Ex-Japan ESG Index
Source: MSCI, Bloomberg, Maybank KE Source: Bloomberg, Maybank KE
Against a backdrop of sharply increasing awareness and integration of ESG issues
by international fund managers - whether voluntarily or due to pressure from asset
owners and an ever-expanding set of sustainability codes and regulations - local
listed companies have generally not fared well. Bursa Malaysia is heavily-weighted
in sustainability-challenged sectors such as financials, oil & gas, power utilities and
plantations, and many of these, as well as certain foreign labour-dependent
exporters like the rubber gloves sector, have attracted negative ESG headlines,
with flow-through valuation drag. For example, for national power utility Tenaga,
coal comprises c.65% of its Peninsula Malaysia generation mix, and will only decline
to below 50% of generation after 2032, when 3 coal plants are scheduled to be
retired. Until then, the state power utility is effectively locked into coal, and all
its related sustainability-centric financials risks re carbon taxes, continuously-
rising insurance premiums and contribution to Malaysia missing targets set by
international climate agreements. Foreign shareholders have been exiting the
stock consistently since 2016, when they owned 29% of the company – as at May,
they own a decade-low 12.2% (Fig 55).
The palm oil sector has long been under international scrutiny for environmental
concerns relating to deforestation and biodiversity loss, attracting sanctions from
the EU at one time. Even as these “E” concerns now appear to have plateaued with
stricter regulation and enforcement, “S” concerns have surfaced re allegations of
labour force abuses resulting in the US banning all shipments of palm oil from two
of Malaysia’s largest palm oil companies (Sime Darby Plantations and FGV Holdings)
in 4Q20. The ESG concerns plaguing the palm oil sector appear to be a key reason
why plantation stock share prices have significantly lagged crude palm oil (CPO)
price recovery (Fig 56), and why foreign shareholdings have been steadily declining
over the past few years, with the biggest divestments being by ESG-centric
European funds.
Fig 55: Tenaga: foreign shareholding trend Fig 56: CPO Price vs. Plantations Index: relative performance
Source: Company, Maybank KE (chart) Source: Bloomberg
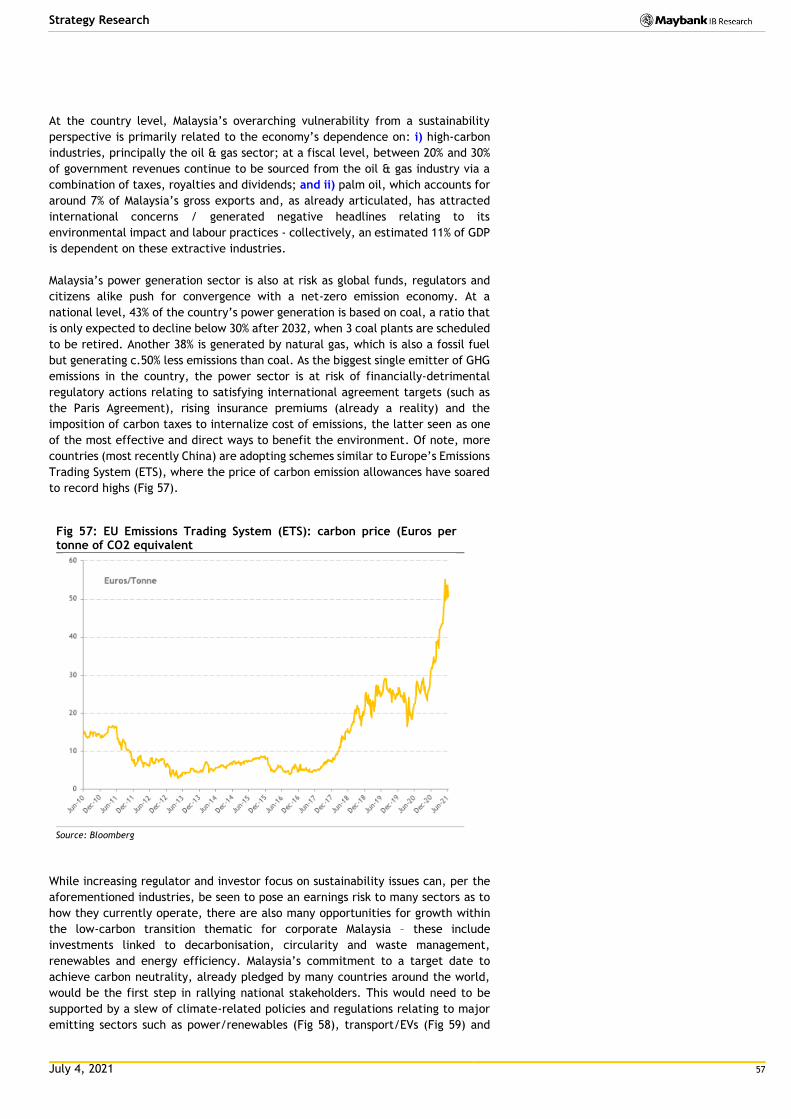
July 4, 2021 57
Strategy Research
At the country level, Malaysia’s overarching vulnerability from a sustainability
perspective is primarily related to the economy’s dependence on: i) high-carbon
industries, principally the oil & gas sector; at a fiscal level, between 20% and 30%
of government revenues continue to be sourced from the oil & gas industry via a
combination of taxes, royalties and dividends; and ii) palm oil, which accounts for
around 7% of Malaysia’s gross exports and, as already articulated, has attracted
international concerns / generated negative headlines relating to its
environmental impact and labour practices - collectively, an estimated 11% of GDP
is dependent on these extractive industries.
Malaysia’s power generation sector is also at risk as global funds, regulators and
citizens alike push for convergence with a net-zero emission economy. At a
national level, 43% of the country’s power generation is based on coal, a ratio that
is only expected to decline below 30% after 2032, when 3 coal plants are scheduled
to be retired. Another 38% is generated by natural gas, which is also a fossil fuel
but generating c.50% less emissions than coal. As the biggest single emitter of GHG
emissions in the country, the power sector is at risk of financially-detrimental
regulatory actions relating to satisfying international agreement targets (such as
the Paris Agreement), rising insurance premiums (already a reality) and the
imposition of carbon taxes to internalize cost of emissions, the latter seen as one
of the most effective and direct ways to benefit the environment. Of note, more
countries (most recently China) are adopting schemes similar to Europe’s Emissions
Trading System (ETS), where the price of carbon emission allowances have soared
to record highs (Fig 57).
Fig 57: EU Emissions Trading System (ETS): carbon price (Euros per tonne of CO2 equivalent
Source: Bloomberg
While increasing regulator and investor focus on sustainability issues can, per the
aforementioned industries, be seen to pose an earnings risk to many sectors as to
how they currently operate, there are also many opportunities for growth within
the low-carbon transition thematic for corporate Malaysia – these include
investments linked to decarbonisation, circularity and waste management,
renewables and energy efficiency. Malaysia’s commitment to a target date to
achieve carbon neutrality, already pledged by many countries around the world,
would be the first step in rallying national stakeholders. This would need to be
supported by a slew of climate-related policies and regulations relating to major
emitting sectors such as power/renewables (Fig 58), transport/EVs (Fig 59) and
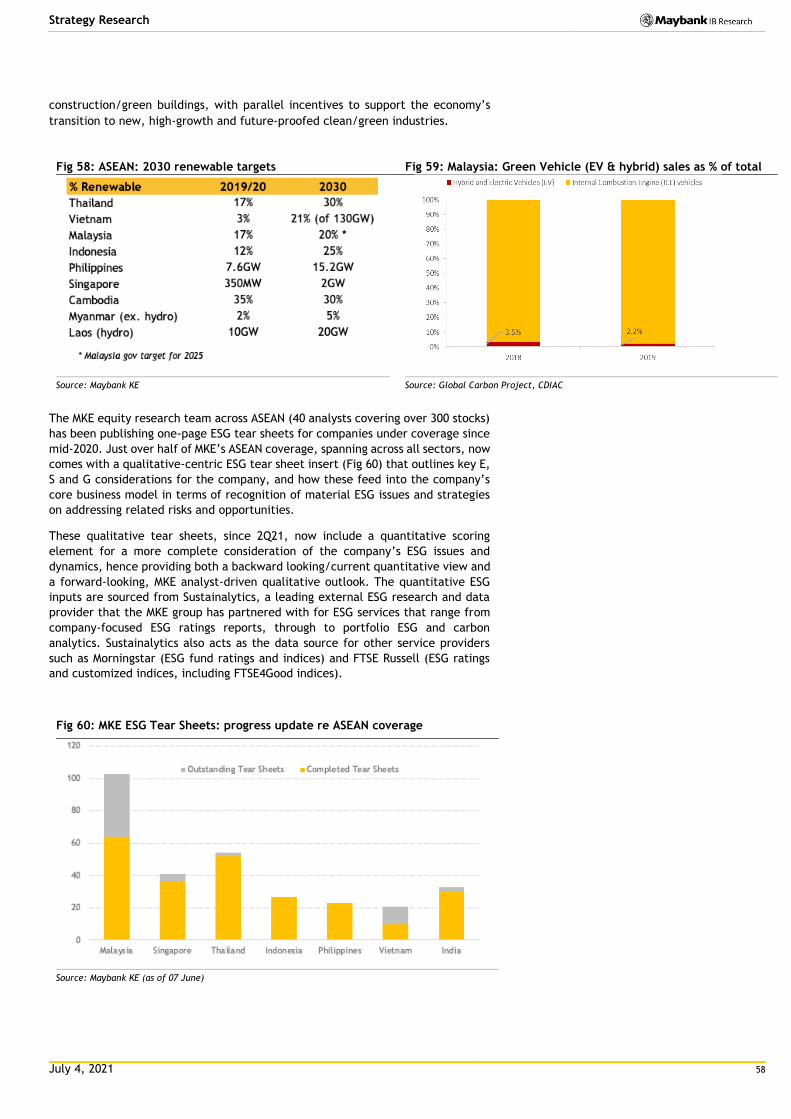
July 4, 2021 58
Strategy Research
construction/green buildings, with parallel incentives to support the economy’s
transition to new, high-growth and future-proofed clean/green industries.
Fig 58: ASEAN: 2030 renewable targets Fig 59: Malaysia: Green Vehicle (EV & hybrid) sales as % of total
Source: Maybank KE Source: Global Carbon Project, CDIAC
The MKE equity research team across ASEAN (40 analysts covering over 300 stocks)
has been publishing one-page ESG tear sheets for companies under coverage since
mid-2020. Just over half of MKE’s ASEAN coverage, spanning across all sectors, now
comes with a qualitative-centric ESG tear sheet insert (Fig 60) that outlines key E,
S and G considerations for the company, and how these feed into the company’s
core business model in terms of recognition of material ESG issues and strategies
on addressing related risks and opportunities.
These qualitative tear sheets, since 2Q21, now include a quantitative scoring
element for a more complete consideration of the company’s ESG issues and
dynamics, hence providing both a backward looking/current quantitative view and
a forward-looking, MKE analyst-driven qualitative outlook. The quantitative ESG
inputs are sourced from Sustainalytics, a leading external ESG research and data
provider that the MKE group has partnered with for ESG services that range from
company-focused ESG ratings reports, through to portfolio ESG and carbon
analytics. Sustainalytics also acts as the data source for other service providers
such as Morningstar (ESG fund ratings and indices) and FTSE Russell (ESG ratings
and customized indices, including FTSE4Good indices).
Fig 60: MKE ESG Tear Sheets: progress update re ASEAN coverage
Source: Maybank KE (as of 07 June)
Fig 1: ASEAN: 2030 renewable targets
Source: Maybank KE
Fig 1: Malaysia: Green vehicle (EV & hybrid) sales as % of total
Source: Global Carbon Project, CDIAC
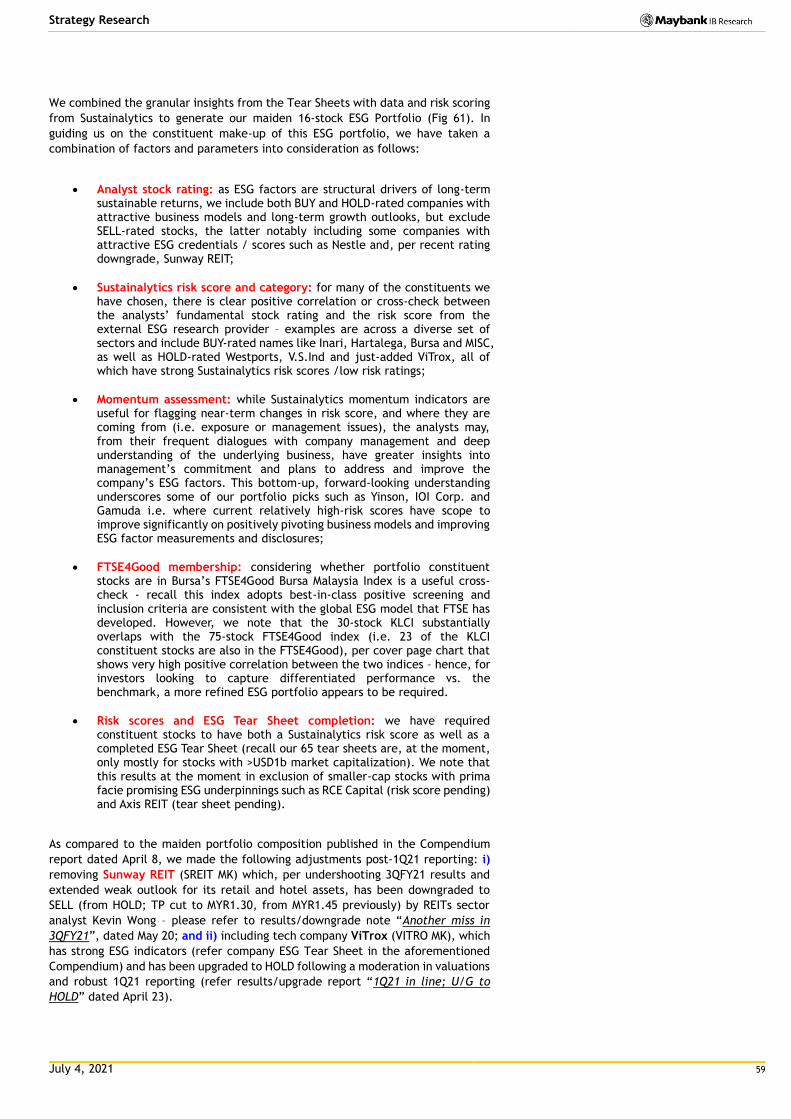
July 4, 2021 59
Strategy Research
We combined the granular insights from the Tear Sheets with data and risk scoring
from Sustainalytics to generate our maiden 16-stock ESG Portfolio (Fig 61). In
guiding us on the constituent make-up of this ESG portfolio, we have taken a
combination of factors and parameters into consideration as follows:
Analyst stock rating: as ESG factors are structural drivers of long-term sustainable returns, we include both BUY and HOLD-rated companies with attractive business models and long-term growth outlooks, but exclude SELL-rated stocks, the latter notably including some companies with attractive ESG credentials / scores such as Nestle and, per recent rating downgrade, Sunway REIT;
Sustainalytics risk score and category: for many of the constituents we have chosen, there is clear positive correlation or cross-check between the analysts’ fundamental stock rating and the risk score from the external ESG research provider – examples are across a diverse set of sectors and include BUY-rated names like Inari, Hartalega, Bursa and MISC, as well as HOLD-rated Westports, V.S.Ind and just-added ViTrox, all of which have strong Sustainalytics risk scores /low risk ratings;
Momentum assessment: while Sustainalytics momentum indicators are useful for flagging near-term changes in risk score, and where they are coming from (i.e. exposure or management issues), the analysts may, from their frequent dialogues with company management and deep understanding of the underlying business, have greater insights into management’s commitment and plans to address and improve the company’s ESG factors. This bottom-up, forward-looking understanding underscores some of our portfolio picks such as Yinson, IOI Corp. and Gamuda i.e. where current relatively high-risk scores have scope to improve significantly on positively pivoting business models and improving ESG factor measurements and disclosures;
FTSE4Good membership: considering whether portfolio constituent stocks are in Bursa’s FTSE4Good Bursa Malaysia Index is a useful cross-check - recall this index adopts best-in-class positive screening and inclusion criteria are consistent with the global ESG model that FTSE has developed. However, we note that the 30-stock KLCI substantially overlaps with the 75-stock FTSE4Good index (i.e. 23 of the KLCI constituent stocks are also in the FTSE4Good), per cover page chart that shows very high positive correlation between the two indices – hence, for investors looking to capture differentiated performance vs. the benchmark, a more refined ESG portfolio appears to be required.
Risk scores and ESG Tear Sheet completion: we have required constituent stocks to have both a Sustainalytics risk score as well as a completed ESG Tear Sheet (recall our 65 tear sheets are, at the moment, only mostly for stocks with >USD1b market capitalization). We note that this results at the moment in exclusion of smaller-cap stocks with prima facie promising ESG underpinnings such as RCE Capital (risk score pending) and Axis REIT (tear sheet pending).
As compared to the maiden portfolio composition published in the Compendium
report dated April 8, we made the following adjustments post-1Q21 reporting: i)
removing Sunway REIT (SREIT MK) which, per undershooting 3QFY21 results and
extended weak outlook for its retail and hotel assets, has been downgraded to
SELL (from HOLD; TP cut to MYR1.30, from MYR1.45 previously) by REITs sector
analyst Kevin Wong – please refer to results/downgrade note “Another miss in
3QFY21”, dated May 20; and ii) including tech company ViTrox (VITRO MK), which
has strong ESG indicators (refer company ESG Tear Sheet in the aforementioned
Compendium) and has been upgraded to HOLD following a moderation in valuations
and robust 1Q21 reporting (refer results/upgrade report “1Q21 in line; U/G to
HOLD” dated April 23).
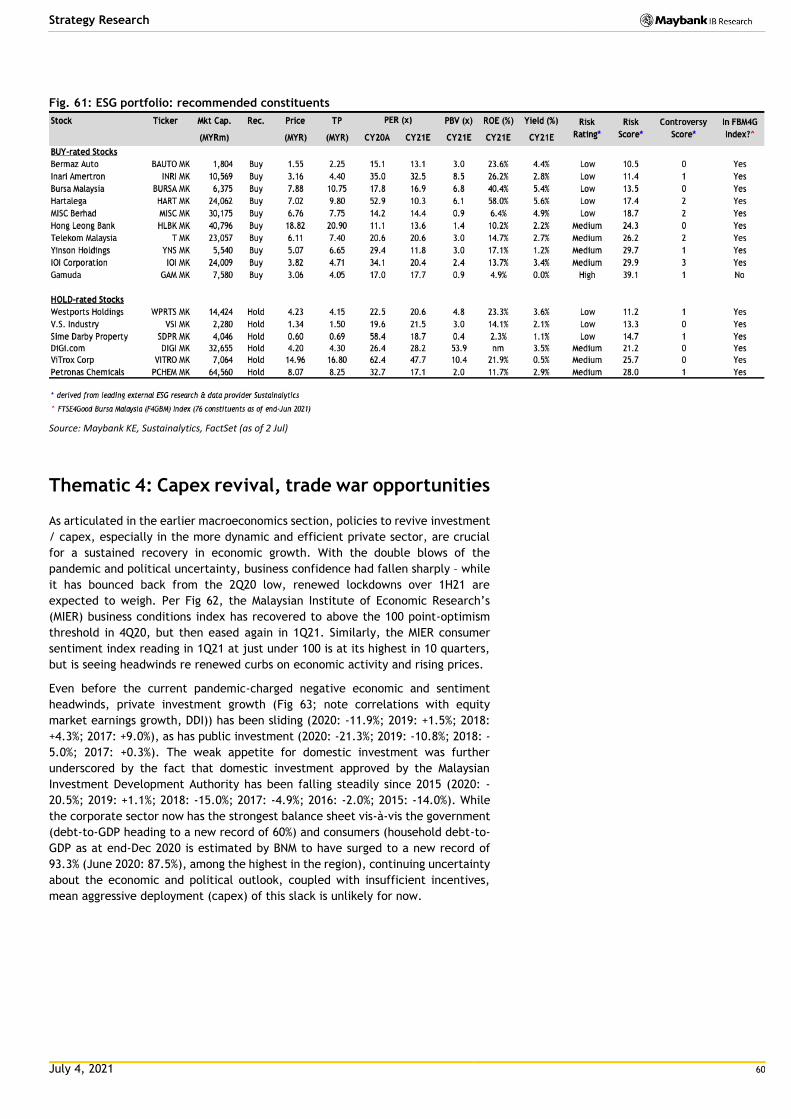
July 4, 2021 60
Strategy Research
Fig. 61: ESG portfolio: recommended constituents
Source: Maybank KE, Sustainalytics, FactSet (as of 2 Jul)
Thematic 4: Capex revival, trade war opportunities
As articulated in the earlier macroeconomics section, policies to revive investment
/ capex, especially in the more dynamic and efficient private sector, are crucial
for a sustained recovery in economic growth. With the double blows of the
pandemic and political uncertainty, business confidence had fallen sharply – while
it has bounced back from the 2Q20 low, renewed lockdowns over 1H21 are
expected to weigh. Per Fig 62, the Malaysian Institute of Economic Research’s
(MIER) business conditions index has recovered to above the 100 point-optimism
threshold in 4Q20, but then eased again in 1Q21. Similarly, the MIER consumer
sentiment index reading in 1Q21 at just under 100 is at its highest in 10 quarters,
but is seeing headwinds re renewed curbs on economic activity and rising prices.
Even before the current pandemic-charged negative economic and sentiment
headwinds, private investment growth (Fig 63; note correlations with equity
market earnings growth, DDI)) has been sliding (2020: -11.9%; 2019: +1.5%; 2018:
+4.3%; 2017: +9.0%), as has public investment (2020: -21.3%; 2019: -10.8%; 2018: -
5.0%; 2017: +0.3%). The weak appetite for domestic investment was further
underscored by the fact that domestic investment approved by the Malaysian
Investment Development Authority has been falling steadily since 2015 (2020: -
20.5%; 2019: +1.1%; 2018: -15.0%; 2017: -4.9%; 2016: -2.0%; 2015: -14.0%). While
the corporate sector now has the strongest balance sheet vis-à-vis the government
(debt-to-GDP heading to a new record of 60%) and consumers (household debt-to-
GDP as at end-Dec 2020 is estimated by BNM to have surged to a new record of
93.3% (June 2020: 87.5%), among the highest in the region), continuing uncertainty
about the economic and political outlook, coupled with insufficient incentives,
mean aggressive deployment (capex) of this slack is unlikely for now.
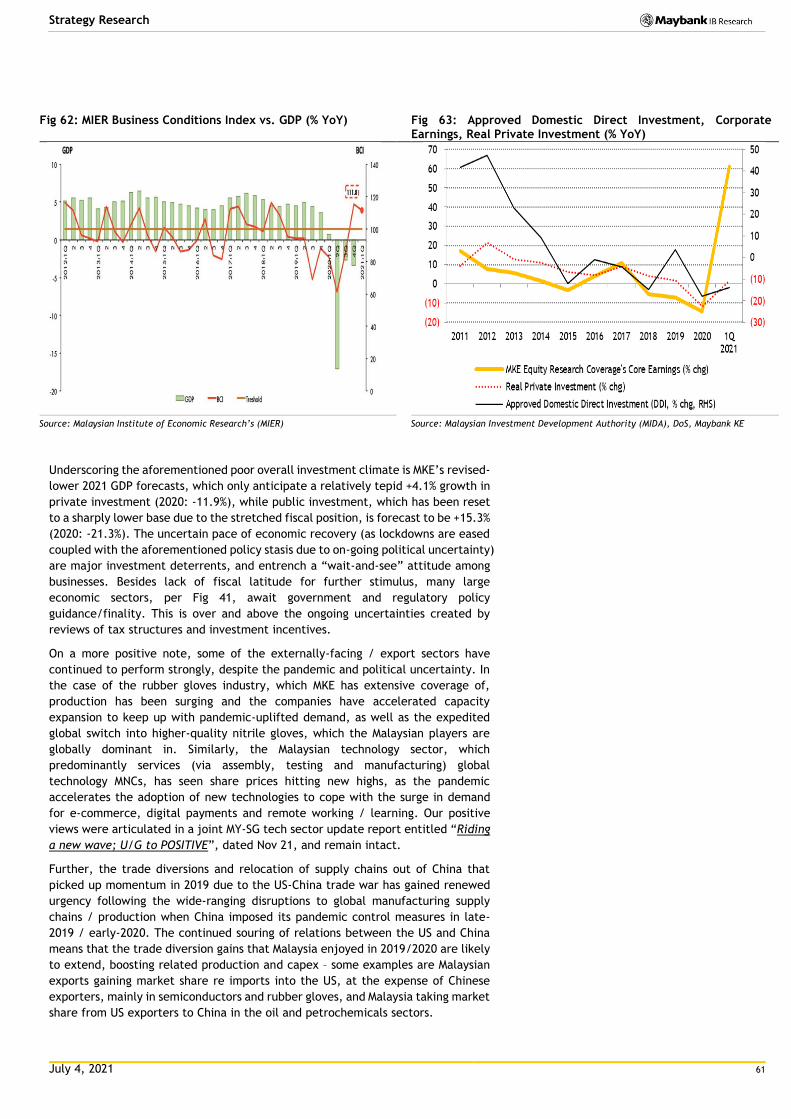
July 4, 2021 61
Strategy Research
Fig 62: MIER Business Conditions Index vs. GDP (% YoY) Fig 63: Approved Domestic Direct Investment, Corporate
Earnings, Real Private Investment (% YoY)
Source: Malaysian Institute of Economic Research’s (MIER) Source: Malaysian Investment Development Authority (MIDA), DoS, Maybank KE
Underscoring the aforementioned poor overall investment climate is MKE’s revised-
lower 2021 GDP forecasts, which only anticipate a relatively tepid +4.1% growth in
private investment (2020: -11.9%), while public investment, which has been reset
to a sharply lower base due to the stretched fiscal position, is forecast to be +15.3%
(2020: -21.3%). The uncertain pace of economic recovery (as lockdowns are eased
coupled with the aforementioned policy stasis due to on-going political uncertainty)
are major investment deterrents, and entrench a “wait-and-see” attitude among
businesses. Besides lack of fiscal latitude for further stimulus, many large
economic sectors, per Fig 41, await government and regulatory policy
guidance/finality. This is over and above the ongoing uncertainties created by
reviews of tax structures and investment incentives.
On a more positive note, some of the externally-facing / export sectors have
continued to perform strongly, despite the pandemic and political uncertainty. In
the case of the rubber gloves industry, which MKE has extensive coverage of,
production has been surging and the companies have accelerated capacity
expansion to keep up with pandemic-uplifted demand, as well as the expedited
global switch into higher-quality nitrile gloves, which the Malaysian players are
globally dominant in. Similarly, the Malaysian technology sector, which
predominantly services (via assembly, testing and manufacturing) global
technology MNCs, has seen share prices hitting new highs, as the pandemic
accelerates the adoption of new technologies to cope with the surge in demand
for e-commerce, digital payments and remote working / learning. Our positive
views were articulated in a joint MY-SG tech sector update report entitled “Riding
a new wave; U/G to POSITIVE”, dated Nov 21, and remain intact.
Further, the trade diversions and relocation of supply chains out of China that
picked up momentum in 2019 due to the US-China trade war has gained renewed
urgency following the wide-ranging disruptions to global manufacturing supply
chains / production when China imposed its pandemic control measures in late-
2019 / early-2020. The continued souring of relations between the US and China
means that the trade diversion gains that Malaysia enjoyed in 2019/2020 are likely
to extend, boosting related production and capex – some examples are Malaysian
exports gaining market share re imports into the US, at the expense of Chinese
exporters, mainly in semiconductors and rubber gloves, and Malaysia taking market
share from US exporters to China in the oil and petrochemicals sectors.
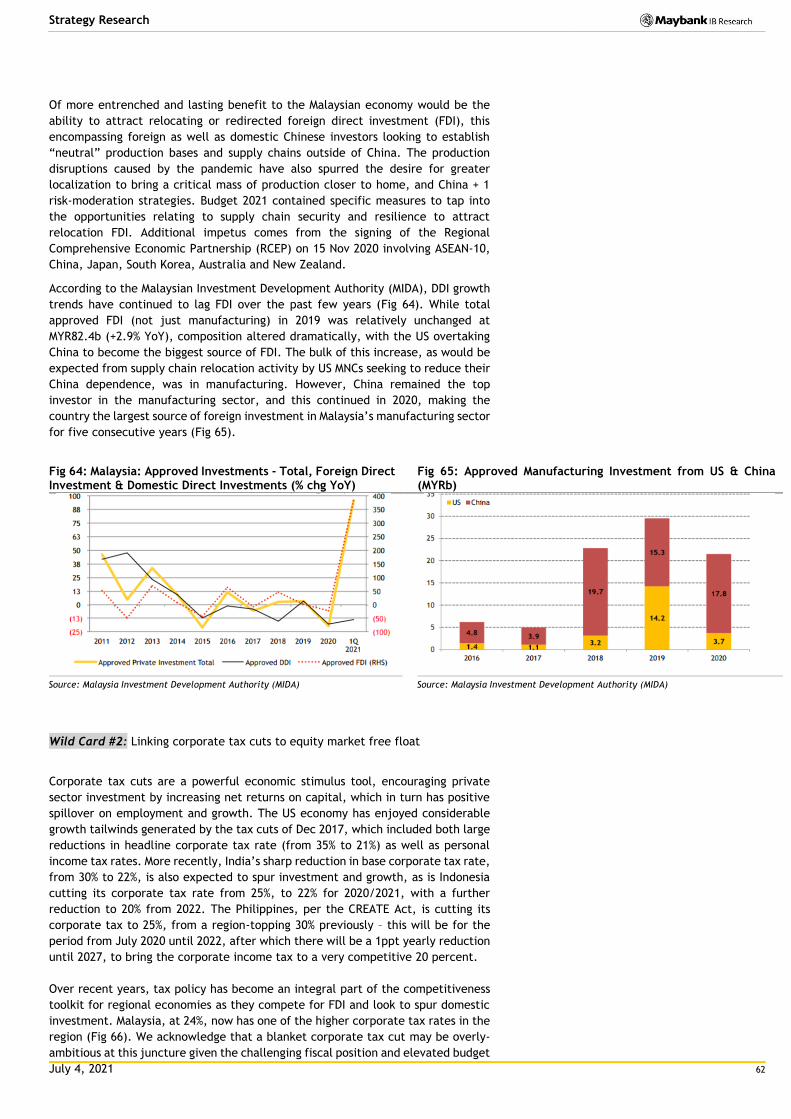
July 4, 2021 62
Strategy Research
Of more entrenched and lasting benefit to the Malaysian economy would be the
ability to attract relocating or redirected foreign direct investment (FDI), this
encompassing foreign as well as domestic Chinese investors looking to establish
“neutral” production bases and supply chains outside of China. The production
disruptions caused by the pandemic have also spurred the desire for greater
localization to bring a critical mass of production closer to home, and China + 1
risk-moderation strategies. Budget 2021 contained specific measures to tap into
the opportunities relating to supply chain security and resilience to attract
relocation FDI. Additional impetus comes from the signing of the Regional
Comprehensive Economic Partnership (RCEP) on 15 Nov 2020 involving ASEAN-10,
China, Japan, South Korea, Australia and New Zealand.
According to the Malaysian Investment Development Authority (MIDA), DDI growth
trends have continued to lag FDI over the past few years (Fig 64). While total
approved FDI (not just manufacturing) in 2019 was relatively unchanged at
MYR82.4b (+2.9% YoY), composition altered dramatically, with the US overtaking
China to become the biggest source of FDI. The bulk of this increase, as would be
expected from supply chain relocation activity by US MNCs seeking to reduce their
China dependence, was in manufacturing. However, China remained the top
investor in the manufacturing sector, and this continued in 2020, making the
country the largest source of foreign investment in Malaysia’s manufacturing sector
for five consecutive years (Fig 65).
Fig 64: Malaysia: Approved Investments - Total, Foreign Direct Investment & Domestic Direct Investments (% chg YoY)
Fig 65: Approved Manufacturing Investment from US & China (MYRb)
Source: Malaysia Investment Development Authority (MIDA) Source: Malaysia Investment Development Authority (MIDA)
Wild Card #2: Linking corporate tax cuts to equity market free float
Corporate tax cuts are a powerful economic stimulus tool, encouraging private
sector investment by increasing net returns on capital, which in turn has positive
spillover on employment and growth. The US economy has enjoyed considerable
growth tailwinds generated by the tax cuts of Dec 2017, which included both large
reductions in headline corporate tax rate (from 35% to 21%) as well as personal
income tax rates. More recently, India’s sharp reduction in base corporate tax rate,
from 30% to 22%, is also expected to spur investment and growth, as is Indonesia
cutting its corporate tax rate from 25%, to 22% for 2020/2021, with a further
reduction to 20% from 2022. The Philippines, per the CREATE Act, is cutting its
corporate tax to 25%, from a region-topping 30% previously – this will be for the
period from July 2020 until 2022, after which there will be a 1ppt yearly reduction
until 2027, to bring the corporate income tax to a very competitive 20 percent.
Over recent years, tax policy has become an integral part of the competitiveness
toolkit for regional economies as they compete for FDI and look to spur domestic
investment. Malaysia, at 24%, now has one of the higher corporate tax rates in the
region (Fig 66). We acknowledge that a blanket corporate tax cut may be overly-
ambitious at this juncture given the challenging fiscal position and elevated budget
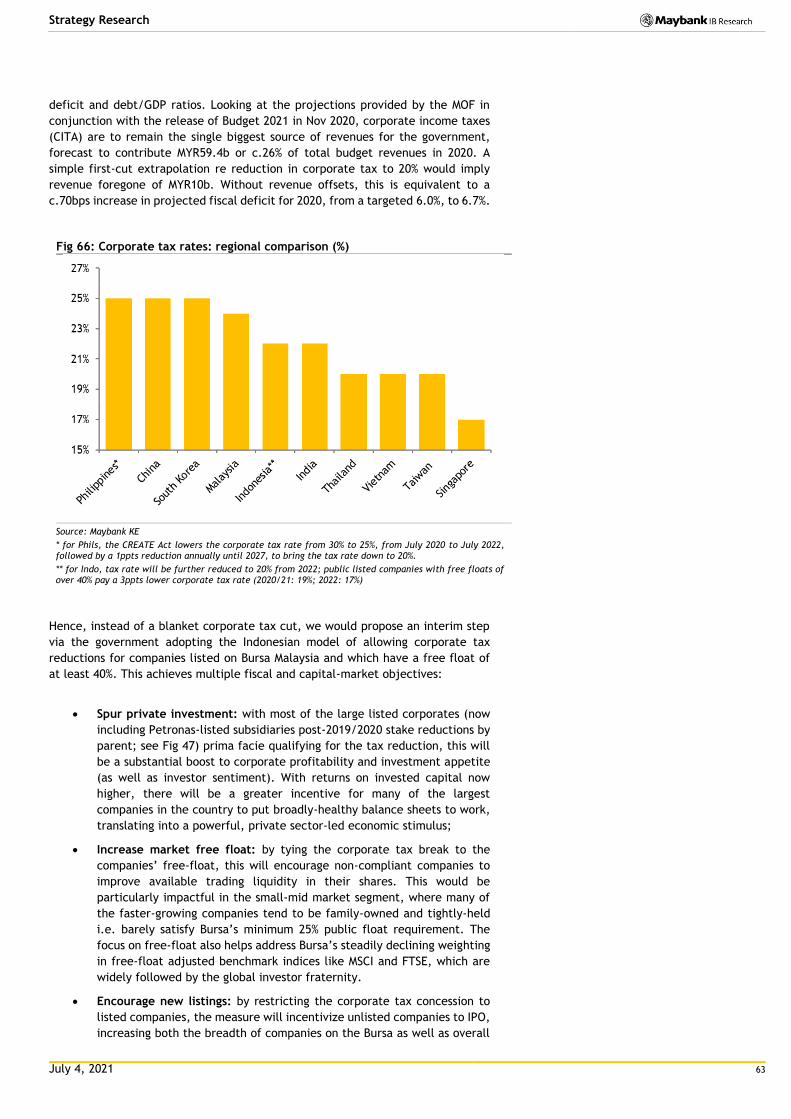
July 4, 2021 63
Strategy Research
deficit and debt/GDP ratios. Looking at the projections provided by the MOF in
conjunction with the release of Budget 2021 in Nov 2020, corporate income taxes
(CITA) are to remain the single biggest source of revenues for the government,
forecast to contribute MYR59.4b or c.26% of total budget revenues in 2020. A
simple first-cut extrapolation re reduction in corporate tax to 20% would imply
revenue foregone of MYR10b. Without revenue offsets, this is equivalent to a
c.70bps increase in projected fiscal deficit for 2020, from a targeted 6.0%, to 6.7%.
Fig 66: Corporate tax rates: regional comparison (%)
Source: Maybank KE
* for Phils, the CREATE Act lowers the corporate tax rate from 30% to 25%, from July 2020 to July 2022, followed by a 1ppts reduction annually until 2027, to bring the tax rate down to 20%.
** for Indo, tax rate will be further reduced to 20% from 2022; public listed companies with free floats of over 40% pay a 3ppts lower corporate tax rate (2020/21: 19%; 2022: 17%)
Hence, instead of a blanket corporate tax cut, we would propose an interim step
via the government adopting the Indonesian model of allowing corporate tax
reductions for companies listed on Bursa Malaysia and which have a free float of
at least 40%. This achieves multiple fiscal and capital-market objectives:
Spur private investment: with most of the large listed corporates (now
including Petronas-listed subsidiaries post-2019/2020 stake reductions by
parent; see Fig 47) prima facie qualifying for the tax reduction, this will
be a substantial boost to corporate profitability and investment appetite
(as well as investor sentiment). With returns on invested capital now
higher, there will be a greater incentive for many of the largest
companies in the country to put broadly-healthy balance sheets to work,
translating into a powerful, private sector-led economic stimulus;
Increase market free float: by tying the corporate tax break to the
companies’ free-float, this will encourage non-compliant companies to
improve available trading liquidity in their shares. This would be
particularly impactful in the small-mid market segment, where many of
the faster-growing companies tend to be family-owned and tightly-held
i.e. barely satisfy Bursa’s minimum 25% public float requirement. The
focus on free-float also helps address Bursa’s steadily declining weighting
in free-float adjusted benchmark indices like MSCI and FTSE, which are
widely followed by the global investor fraternity.
Encourage new listings: by restricting the corporate tax concession to
listed companies, the measure will incentivize unlisted companies to IPO,
increasing both the breadth of companies on the Bursa as well as overall
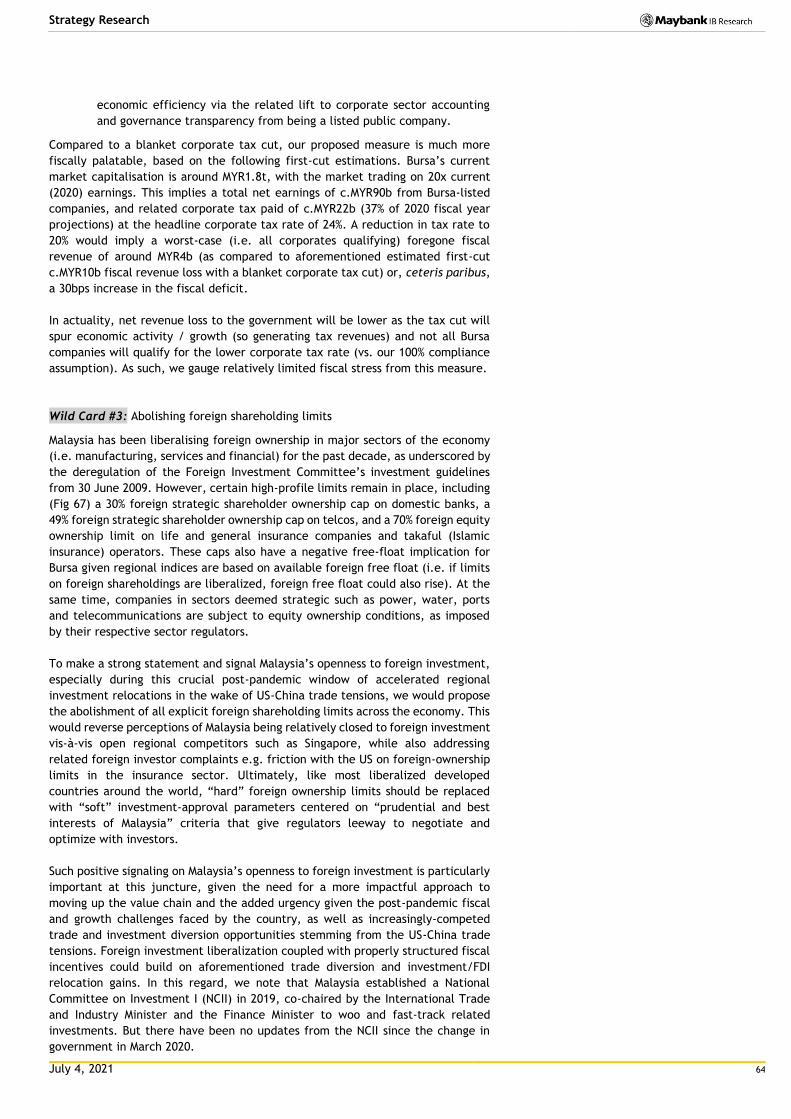
July 4, 2021 64
Strategy Research
economic efficiency via the related lift to corporate sector accounting
and governance transparency from being a listed public company.
Compared to a blanket corporate tax cut, our proposed measure is much more
fiscally palatable, based on the following first-cut estimations. Bursa’s current
market capitalisation is around MYR1.8t, with the market trading on 20x current
(2020) earnings. This implies a total net earnings of c.MYR90b from Bursa-listed
companies, and related corporate tax paid of c.MYR22b (37% of 2020 fiscal year
projections) at the headline corporate tax rate of 24%. A reduction in tax rate to
20% would imply a worst-case (i.e. all corporates qualifying) foregone fiscal
revenue of around MYR4b (as compared to aforementioned estimated first-cut
c.MYR10b fiscal revenue loss with a blanket corporate tax cut) or, ceteris paribus,
a 30bps increase in the fiscal deficit.
In actuality, net revenue loss to the government will be lower as the tax cut will
spur economic activity / growth (so generating tax revenues) and not all Bursa
companies will qualify for the lower corporate tax rate (vs. our 100% compliance
assumption). As such, we gauge relatively limited fiscal stress from this measure.
Wild Card #3: Abolishing foreign shareholding limits
Malaysia has been liberalising foreign ownership in major sectors of the economy
(i.e. manufacturing, services and financial) for the past decade, as underscored by
the deregulation of the Foreign Investment Committee’s investment guidelines
from 30 June 2009. However, certain high-profile limits remain in place, including
(Fig 67) a 30% foreign strategic shareholder ownership cap on domestic banks, a
49% foreign strategic shareholder ownership cap on telcos, and a 70% foreign equity
ownership limit on life and general insurance companies and takaful (Islamic
insurance) operators. These caps also have a negative free-float implication for
Bursa given regional indices are based on available foreign free float (i.e. if limits
on foreign shareholdings are liberalized, foreign free float could also rise). At the
same time, companies in sectors deemed strategic such as power, water, ports
and telecommunications are subject to equity ownership conditions, as imposed
by their respective sector regulators.
To make a strong statement and signal Malaysia’s openness to foreign investment,
especially during this crucial post-pandemic window of accelerated regional
investment relocations in the wake of US-China trade tensions, we would propose
the abolishment of all explicit foreign shareholding limits across the economy. This
would reverse perceptions of Malaysia being relatively closed to foreign investment
vis-à-vis open regional competitors such as Singapore, while also addressing
related foreign investor complaints e.g. friction with the US on foreign-ownership
limits in the insurance sector. Ultimately, like most liberalized developed
countries around the world, “hard” foreign ownership limits should be replaced
with “soft” investment-approval parameters centered on “prudential and best
interests of Malaysia” criteria that give regulators leeway to negotiate and
optimize with investors.
Such positive signaling on Malaysia’s openness to foreign investment is particularly
important at this juncture, given the need for a more impactful approach to
moving up the value chain and the added urgency given the post-pandemic fiscal
and growth challenges faced by the country, as well as increasingly-competed
trade and investment diversion opportunities stemming from the US-China trade
tensions. Foreign investment liberalization coupled with properly structured fiscal
incentives could build on aforementioned trade diversion and investment/FDI
relocation gains. In this regard, we note that Malaysia established a National
Committee on Investment I (NCII) in 2019, co-chaired by the International Trade
and Industry Minister and the Finance Minister to woo and fast-track related
investments. But there have been no updates from the NCII since the change in
government in March 2020.
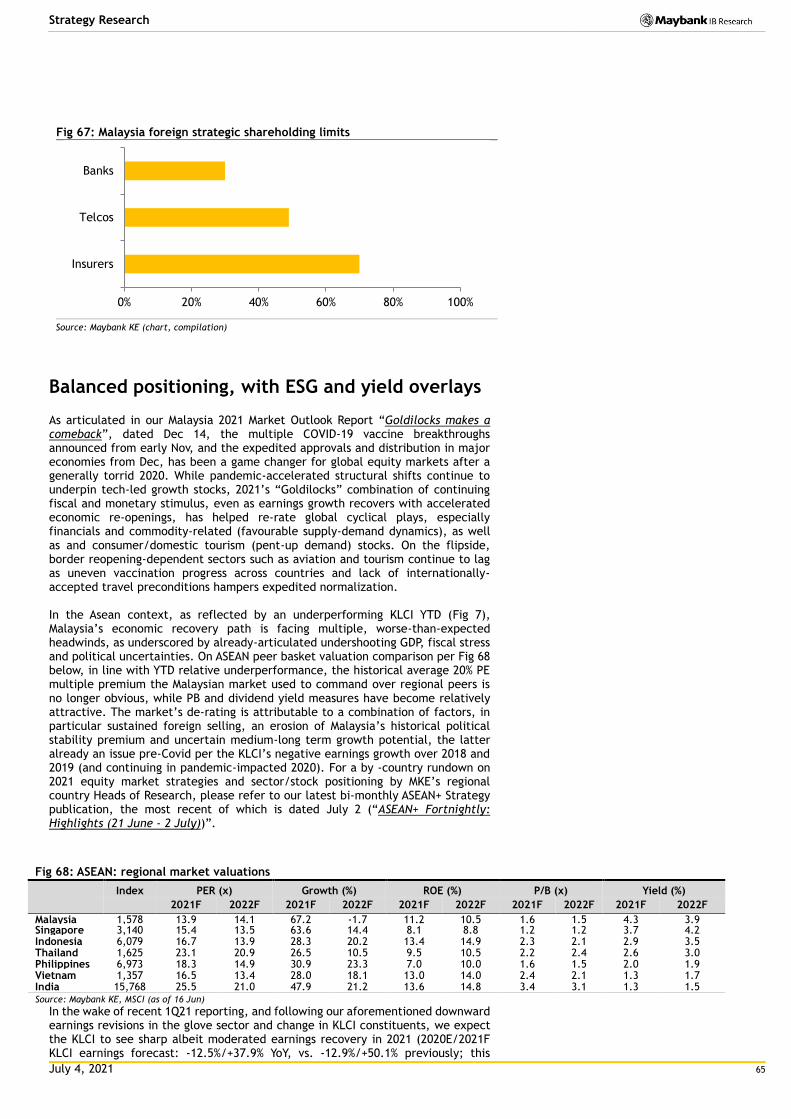
July 4, 2021 65
Strategy Research
Fig 67: Malaysia foreign strategic shareholding limits
Source: Maybank KE (chart, compilation)
Balanced positioning, with ESG and yield overlays
As articulated in our Malaysia 2021 Market Outlook Report “Goldilocks makes a comeback”, dated Dec 14, the multiple COVID-19 vaccine breakthroughs announced from early Nov, and the expedited approvals and distribution in major economies from Dec, has been a game changer for global equity markets after a generally torrid 2020. While pandemic-accelerated structural shifts continue to underpin tech-led growth stocks, 2021’s “Goldilocks” combination of continuing fiscal and monetary stimulus, even as earnings growth recovers with accelerated economic re-openings, has helped re-rate global cyclical plays, especially financials and commodity-related (favourable supply-demand dynamics), as well as and consumer/domestic tourism (pent-up demand) stocks. On the flipside, border reopening-dependent sectors such as aviation and tourism continue to lag as uneven vaccination progress across countries and lack of internationally-accepted travel preconditions hampers expedited normalization. In the Asean context, as reflected by an underperforming KLCI YTD (Fig 7), Malaysia’s economic recovery path is facing multiple, worse-than-expected headwinds, as underscored by already-articulated undershooting GDP, fiscal stress and political uncertainties. On ASEAN peer basket valuation comparison per Fig 68 below, in line with YTD relative underperformance, the historical average 20% PE multiple premium the Malaysian market used to command over regional peers is no longer obvious, while PB and dividend yield measures have become relatively attractive. The market’s de-rating is attributable to a combination of factors, in particular sustained foreign selling, an erosion of Malaysia’s historical political stability premium and uncertain medium-long term growth potential, the latter already an issue pre-Covid per the KLCI’s negative earnings growth over 2018 and 2019 (and continuing in pandemic-impacted 2020). For a by -country rundown on 2021 equity market strategies and sector/stock positioning by MKE’s regional country Heads of Research, please refer to our latest bi-monthly ASEAN+ Strategy publication, the most recent of which is dated July 2 (“ASEAN+ Fortnightly: Highlights (21 June - 2 July))”.
Fig 68: ASEAN: regional market valuations
Index PER (x) Growth (%) ROE (%) P/B (x) Yield (%)
2021F 2022F 2021F 2022F 2021F 2022F 2021F 2022F 2021F 2022F
Malaysia 1,578 13.9 14.1 67.2 -1.7 11.2 10.5 1.6 1.5 4.3 3.9 Singapore 3,140 15.4 13.5 63.6 14.4 8.1 8.8 1.2 1.2 3.7 4.2 Indonesia 6,079 16.7 13.9 28.3 20.2 13.4 14.9 2.3 2.1 2.9 3.5 Thailand 1,625 23.1 20.9 26.5 10.5 9.5 10.5 2.2 2.4 2.6 3.0 Philippines 6,973 18.3 14.9 30.9 23.3 7.0 10.0 1.6 1.5 2.0 1.9 Vietnam 1,357 16.5 13.4 28.0 18.1 13.0 14.0 2.4 2.1 1.3 1.7 India 15,768 25.5 21.0 47.9 21.2 13.6 14.8 3.4 3.1 1.3 1.5 Source: Maybank KE, MSCI (as of 16 Jun)
In the wake of recent 1Q21 reporting, and following our aforementioned downward earnings revisions in the glove sector and change in KLCI constituents, we expect the KLCI to see sharp albeit moderated earnings recovery in 2021 (2020E/2021F KLCI earnings forecast: -12.5%/+37.9% YoY, vs. -12.9%/+50.1% previously; this
0% 20% 40% 60% 80% 100%
Insurers
Telcos
Banks
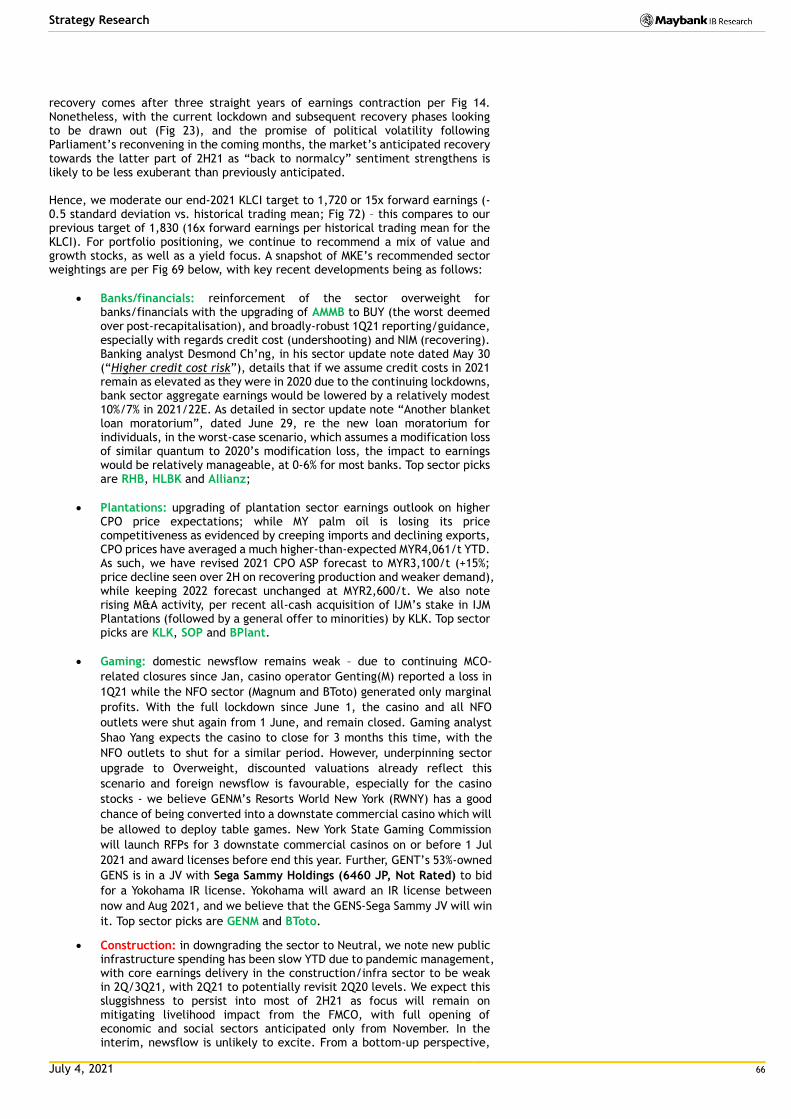
July 4, 2021 66
Strategy Research
recovery comes after three straight years of earnings contraction per Fig 14. Nonetheless, with the current lockdown and subsequent recovery phases looking to be drawn out (Fig 23), and the promise of political volatility following Parliament’s reconvening in the coming months, the market’s anticipated recovery towards the latter part of 2H21 as “back to normalcy” sentiment strengthens is likely to be less exuberant than previously anticipated. Hence, we moderate our end-2021 KLCI target to 1,720 or 15x forward earnings (-0.5 standard deviation vs. historical trading mean; Fig 72) – this compares to our previous target of 1,830 (16x forward earnings per historical trading mean for the KLCI). For portfolio positioning, we continue to recommend a mix of value and growth stocks, as well as a yield focus. A snapshot of MKE’s recommended sector weightings are per Fig 69 below, with key recent developments being as follows:
Banks/financials: reinforcement of the sector overweight for banks/financials with the upgrading of AMMB to BUY (the worst deemed over post-recapitalisation), and broadly-robust 1Q21 reporting/guidance, especially with regards credit cost (undershooting) and NIM (recovering). Banking analyst Desmond Ch’ng, in his sector update note dated May 30 (“Higher credit cost risk”), details that if we assume credit costs in 2021 remain as elevated as they were in 2020 due to the continuing lockdowns, bank sector aggregate earnings would be lowered by a relatively modest 10%/7% in 2021/22E. As detailed in sector update note “Another blanket loan moratorium”, dated June 29, re the new loan moratorium for individuals, in the worst-case scenario, which assumes a modification loss of similar quantum to 2020’s modification loss, the impact to earnings would be relatively manageable, at 0-6% for most banks. Top sector picks are RHB, HLBK and Allianz;
Plantations: upgrading of plantation sector earnings outlook on higher CPO price expectations; while MY palm oil is losing its price competitiveness as evidenced by creeping imports and declining exports, CPO prices have averaged a much higher-than-expected MYR4,061/t YTD. As such, we have revised 2021 CPO ASP forecast to MYR3,100/t (+15%; price decline seen over 2H on recovering production and weaker demand), while keeping 2022 forecast unchanged at MYR2,600/t. We also note rising M&A activity, per recent all-cash acquisition of IJM’s stake in IJM Plantations (followed by a general offer to minorities) by KLK. Top sector picks are KLK, SOP and BPlant.
Gaming: domestic newsflow remains weak – due to continuing MCO-
related closures since Jan, casino operator Genting(M) reported a loss in
1Q21 while the NFO sector (Magnum and BToto) generated only marginal
profits. With the full lockdown since June 1, the casino and all NFO
outlets were shut again from 1 June, and remain closed. Gaming analyst
Shao Yang expects the casino to close for 3 months this time, with the
NFO outlets to shut for a similar period. However, underpinning sector
upgrade to Overweight, discounted valuations already reflect this
scenario and foreign newsflow is favourable, especially for the casino
stocks - we believe GENM’s Resorts World New York (RWNY) has a good
chance of being converted into a downstate commercial casino which will
be allowed to deploy table games. New York State Gaming Commission
will launch RFPs for 3 downstate commercial casinos on or before 1 Jul
2021 and award licenses before end this year. Further, GENT’s 53%-owned
GENS is in a JV with Sega Sammy Holdings (6460 JP, Not Rated) to bid
for a Yokohama IR license. Yokohama will award an IR license between
now and Aug 2021, and we believe that the GENS-Sega Sammy JV will win
it. Top sector picks are GENM and BToto.
Construction: in downgrading the sector to Neutral, we note new public infrastructure spending has been slow YTD due to pandemic management, with core earnings delivery in the construction/infra sector to be weak in 2Q/3Q21, with 2Q21 to potentially revisit 2Q20 levels. We expect this sluggishness to persist into most of 2H21 as focus will remain on mitigating livelihood impact from the FMCO, with full opening of economic and social sectors anticipated only from November. In the interim, newsflow is unlikely to excite. From a bottom-up perspective,
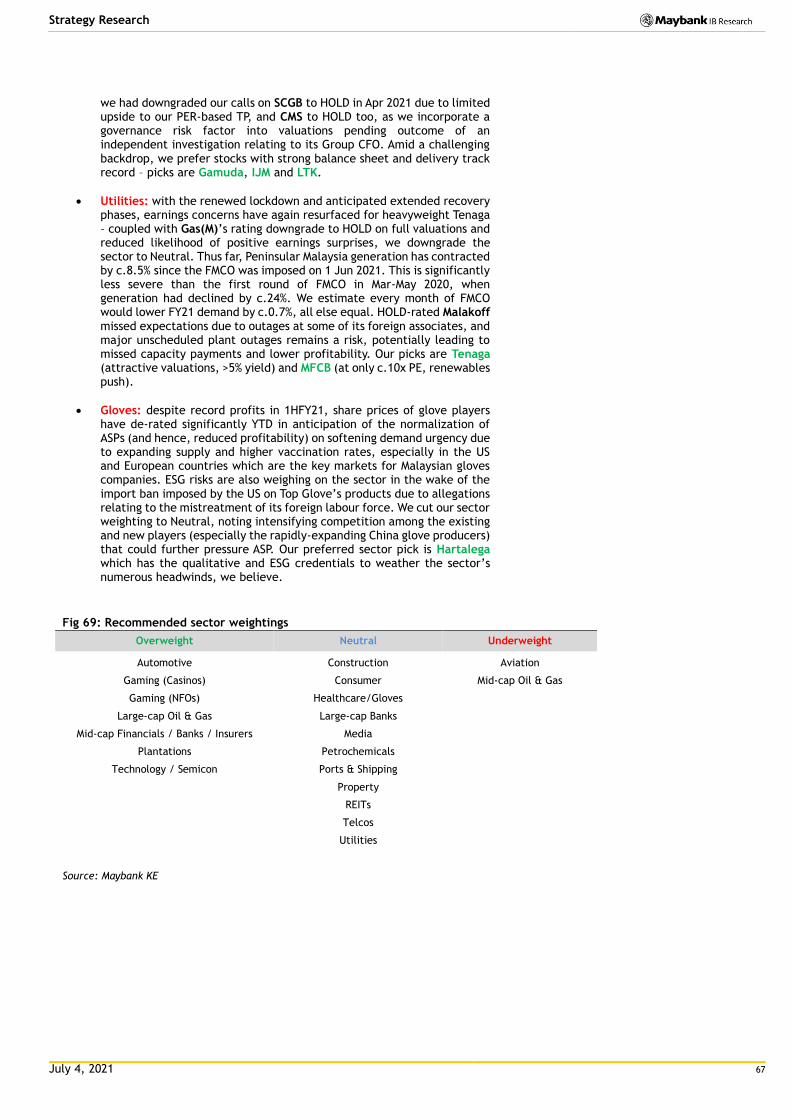
July 4, 2021 67
Strategy Research
we had downgraded our calls on SCGB to HOLD in Apr 2021 due to limited upside to our PER-based TP, and CMS to HOLD too, as we incorporate a governance risk factor into valuations pending outcome of an independent investigation relating to its Group CFO. Amid a challenging backdrop, we prefer stocks with strong balance sheet and delivery track record – picks are Gamuda, IJM and LTK.
Utilities: with the renewed lockdown and anticipated extended recovery phases, earnings concerns have again resurfaced for heavyweight Tenaga – coupled with Gas(M)’s rating downgrade to HOLD on full valuations and reduced likelihood of positive earnings surprises, we downgrade the sector to Neutral. Thus far, Peninsular Malaysia generation has contracted by c.8.5% since the FMCO was imposed on 1 Jun 2021. This is significantly less severe than the first round of FMCO in Mar-May 2020, when generation had declined by c.24%. We estimate every month of FMCO would lower FY21 demand by c.0.7%, all else equal. HOLD-rated Malakoff missed expectations due to outages at some of its foreign associates, and major unscheduled plant outages remains a risk, potentially leading to missed capacity payments and lower profitability. Our picks are Tenaga (attractive valuations, >5% yield) and MFCB (at only c.10x PE, renewables push).
Gloves: despite record profits in 1HFY21, share prices of glove players have de-rated significantly YTD in anticipation of the normalization of ASPs (and hence, reduced profitability) on softening demand urgency due to expanding supply and higher vaccination rates, especially in the US and European countries which are the key markets for Malaysian gloves companies. ESG risks are also weighing on the sector in the wake of the import ban imposed by the US on Top Glove’s products due to allegations relating to the mistreatment of its foreign labour force. We cut our sector weighting to Neutral, noting intensifying competition among the existing and new players (especially the rapidly-expanding China glove producers) that could further pressure ASP. Our preferred sector pick is Hartalega which has the qualitative and ESG credentials to weather the sector’s numerous headwinds, we believe.
Fig 69: Recommended sector weightings
Overweight Neutral Underweight
Automotive Construction Aviation
Gaming (Casinos) Consumer Mid-cap Oil & Gas
Gaming (NFOs) Healthcare/Gloves
Large-cap Oil & Gas Large-cap Banks
Mid-cap Financials / Banks / Insurers Media
Plantations Petrochemicals
Technology / Semicon Ports & Shipping
Property
REITs
Telcos
Utilities
Source: Maybank KE
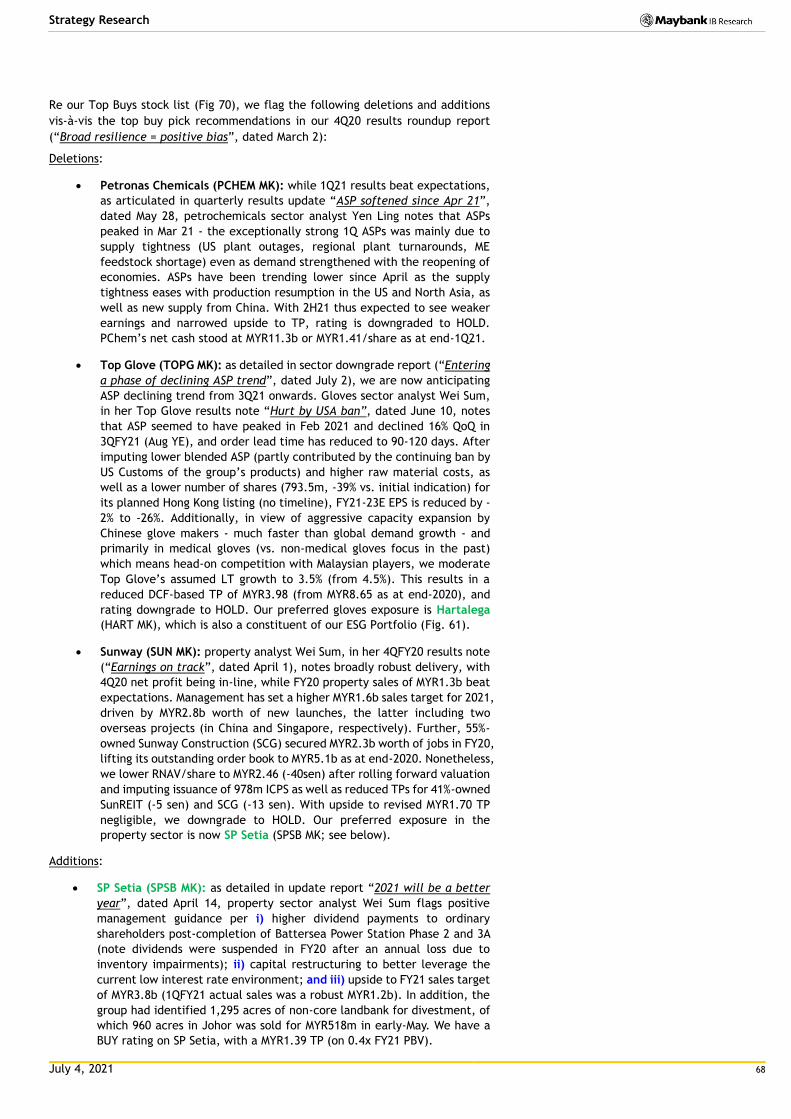
July 4, 2021 68
Strategy Research
Re our Top Buys stock list (Fig 70), we flag the following deletions and additions
vis-à-vis the top buy pick recommendations in our 4Q20 results roundup report
(“Broad resilience = positive bias”, dated March 2):
Deletions:
Petronas Chemicals (PCHEM MK): while 1Q21 results beat expectations,
as articulated in quarterly results update “ASP softened since Apr 21”,
dated May 28, petrochemicals sector analyst Yen Ling notes that ASPs
peaked in Mar 21 - the exceptionally strong 1Q ASPs was mainly due to
supply tightness (US plant outages, regional plant turnarounds, ME
feedstock shortage) even as demand strengthened with the reopening of
economies. ASPs have been trending lower since April as the supply
tightness eases with production resumption in the US and North Asia, as
well as new supply from China. With 2H21 thus expected to see weaker
earnings and narrowed upside to TP, rating is downgraded to HOLD.
PChem’s net cash stood at MYR11.3b or MYR1.41/share as at end-1Q21.
Top Glove (TOPG MK): as detailed in sector downgrade report (“Entering
a phase of declining ASP trend”, dated July 2), we are now anticipating
ASP declining trend from 3Q21 onwards. Gloves sector analyst Wei Sum,
in her Top Glove results note “Hurt by USA ban”, dated June 10, notes
that ASP seemed to have peaked in Feb 2021 and declined 16% QoQ in
3QFY21 (Aug YE), and order lead time has reduced to 90-120 days. After
imputing lower blended ASP (partly contributed by the continuing ban by
US Customs of the group’s products) and higher raw material costs, as
well as a lower number of shares (793.5m, -39% vs. initial indication) for
its planned Hong Kong listing (no timeline), FY21-23E EPS is reduced by -
2% to -26%. Additionally, in view of aggressive capacity expansion by
Chinese glove makers - much faster than global demand growth - and
primarily in medical gloves (vs. non-medical gloves focus in the past)
which means head-on competition with Malaysian players, we moderate
Top Glove’s assumed LT growth to 3.5% (from 4.5%). This results in a
reduced DCF-based TP of MYR3.98 (from MYR8.65 as at end-2020), and
rating downgrade to HOLD. Our preferred gloves exposure is Hartalega
(HART MK), which is also a constituent of our ESG Portfolio (Fig. 61).
Sunway (SUN MK): property analyst Wei Sum, in her 4QFY20 results note
(“Earnings on track”, dated April 1), notes broadly robust delivery, with
4Q20 net profit being in-line, while FY20 property sales of MYR1.3b beat
expectations. Management has set a higher MYR1.6b sales target for 2021,
driven by MYR2.8b worth of new launches, the latter including two
overseas projects (in China and Singapore, respectively). Further, 55%-
owned Sunway Construction (SCG) secured MYR2.3b worth of jobs in FY20,
lifting its outstanding order book to MYR5.1b as at end-2020. Nonetheless,
we lower RNAV/share to MYR2.46 (-40sen) after rolling forward valuation
and imputing issuance of 978m ICPS as well as reduced TPs for 41%-owned
SunREIT (-5 sen) and SCG (-13 sen). With upside to revised MYR1.70 TP
negligible, we downgrade to HOLD. Our preferred exposure in the
property sector is now SP Setia (SPSB MK; see below).
Additions:
SP Setia (SPSB MK): as detailed in update report “2021 will be a better
year”, dated April 14, property sector analyst Wei Sum flags positive
management guidance per i) higher dividend payments to ordinary
shareholders post-completion of Battersea Power Station Phase 2 and 3A
(note dividends were suspended in FY20 after an annual loss due to
inventory impairments); ii) capital restructuring to better leverage the
current low interest rate environment; and iii) upside to FY21 sales target
of MYR3.8b (1QFY21 actual sales was a robust MYR1.2b). In addition, the
group had identified 1,295 acres of non-core landbank for divestment, of
which 960 acres in Johor was sold for MYR518m in early-May. We have a
BUY rating on SP Setia, with a MYR1.39 TP (on 0.4x FY21 PBV).
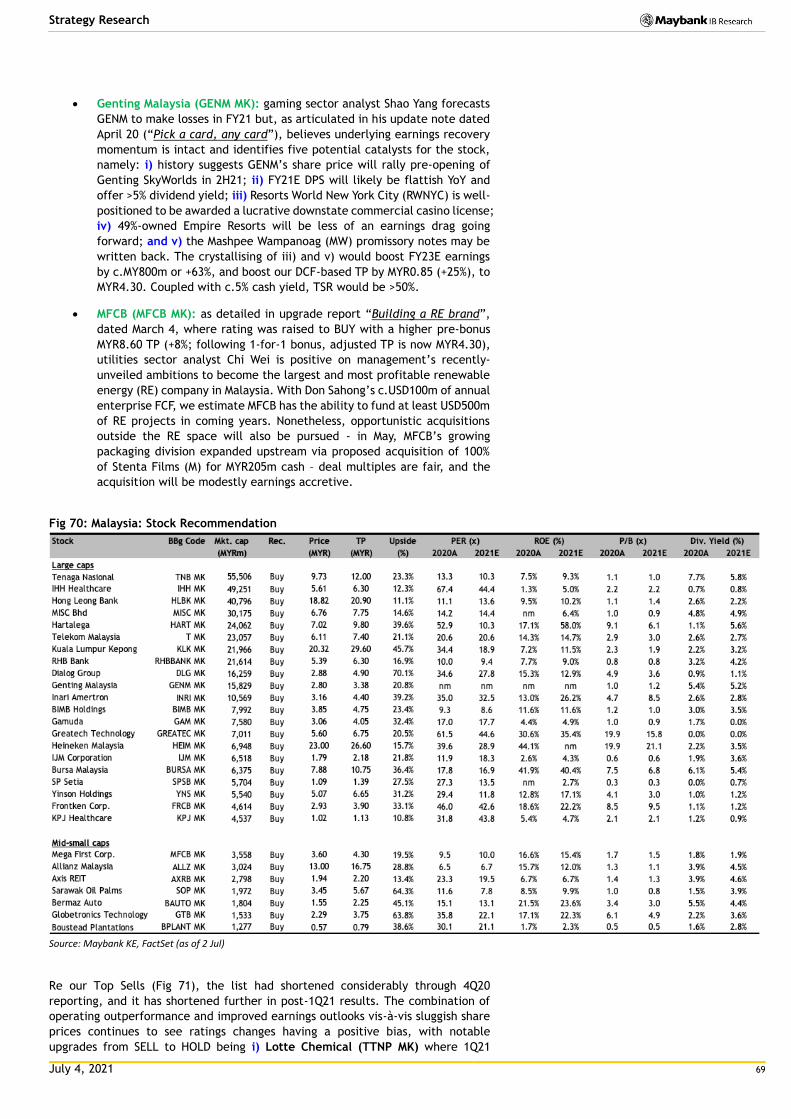
July 4, 2021 69
Strategy Research
Genting Malaysia (GENM MK): gaming sector analyst Shao Yang forecasts
GENM to make losses in FY21 but, as articulated in his update note dated
April 20 (“Pick a card, any card”), believes underlying earnings recovery
momentum is intact and identifies five potential catalysts for the stock,
namely: i) history suggests GENM’s share price will rally pre-opening of
Genting SkyWorlds in 2H21; ii) FY21E DPS will likely be flattish YoY and
offer >5% dividend yield; iii) Resorts World New York City (RWNYC) is well-
positioned to be awarded a lucrative downstate commercial casino license;
iv) 49%-owned Empire Resorts will be less of an earnings drag going
forward; and v) the Mashpee Wampanoag (MW) promissory notes may be
written back. The crystallising of iii) and v) would boost FY23E earnings
by c.MY800m or +63%, and boost our DCF-based TP by MYR0.85 (+25%), to
MYR4.30. Coupled with c.5% cash yield, TSR would be >50%.
MFCB (MFCB MK): as detailed in upgrade report “Building a RE brand”,
dated March 4, where rating was raised to BUY with a higher pre-bonus
MYR8.60 TP (+8%; following 1-for-1 bonus, adjusted TP is now MYR4.30),
utilities sector analyst Chi Wei is positive on management’s recently-
unveiled ambitions to become the largest and most profitable renewable
energy (RE) company in Malaysia. With Don Sahong’s c.USD100m of annual
enterprise FCF, we estimate MFCB has the ability to fund at least USD500m
of RE projects in coming years. Nonetheless, opportunistic acquisitions
outside the RE space will also be pursued - in May, MFCB’s growing
packaging division expanded upstream via proposed acquisition of 100%
of Stenta Films (M) for MYR205m cash – deal multiples are fair, and the
acquisition will be modestly earnings accretive.
Fig 70: Malaysia: Stock Recommendation
Source: Maybank KE, FactSet (as of 2 Jul)
Re our Top Sells (Fig 71), the list had shortened considerably through 4Q20
reporting, and it has shortened further in post-1Q21 results. The combination of
operating outperformance and improved earnings outlooks vis-à-vis sluggish share
prices continues to see ratings changes having a positive bias, with notable
upgrades from SELL to HOLD being i) Lotte Chemical (TTNP MK) where 1Q21
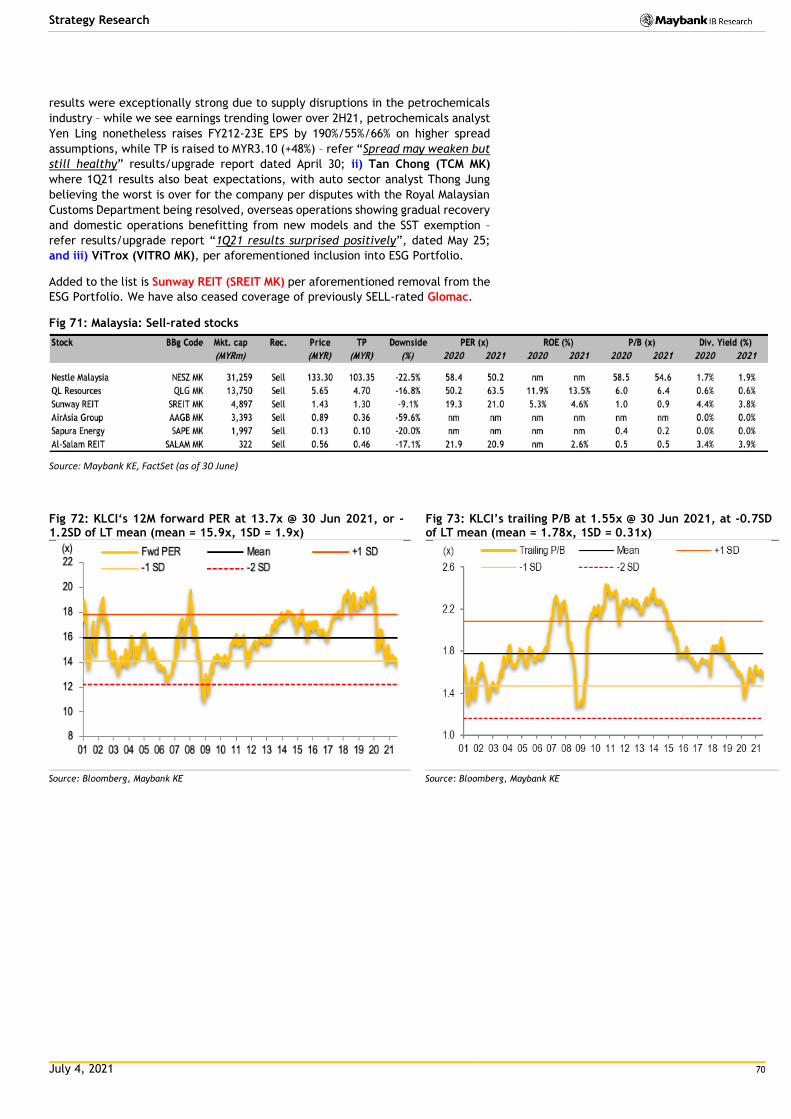
July 4, 2021 70
Strategy Research
results were exceptionally strong due to supply disruptions in the petrochemicals
industry – while we see earnings trending lower over 2H21, petrochemicals analyst
Yen Ling nonetheless raises FY212-23E EPS by 190%/55%/66% on higher spread
assumptions, while TP is raised to MYR3.10 (+48%) – refer “Spread may weaken but
still healthy” results/upgrade report dated April 30; ii) Tan Chong (TCM MK)
where 1Q21 results also beat expectations, with auto sector analyst Thong Jung
believing the worst is over for the company per disputes with the Royal Malaysian
Customs Department being resolved, overseas operations showing gradual recovery
and domestic operations benefitting from new models and the SST exemption –
refer results/upgrade report “1Q21 results surprised positively”, dated May 25;
and iii) ViTrox (VITRO MK), per aforementioned inclusion into ESG Portfolio.
Added to the list is Sunway REIT (SREIT MK) per aforementioned removal from the
ESG Portfolio. We have also ceased coverage of previously SELL-rated Glomac.
Fig 71: Malaysia: Sell-rated stocks
Source: Maybank KE, FactSet (as of 30 June)
Fig 72: KLCI‘s 12M forward PER at 13.7x @ 30 Jun 2021, or -1.2SD of LT mean (mean = 15.9x, 1SD = 1.9x)
Fig 73: KLCI’s trailing P/B at 1.55x @ 30 Jun 2021, at -0.7SD of LT mean (mean = 1.78x, 1SD = 0.31x)
Source: Bloomberg, Maybank KE Source: Bloomberg, Maybank KE
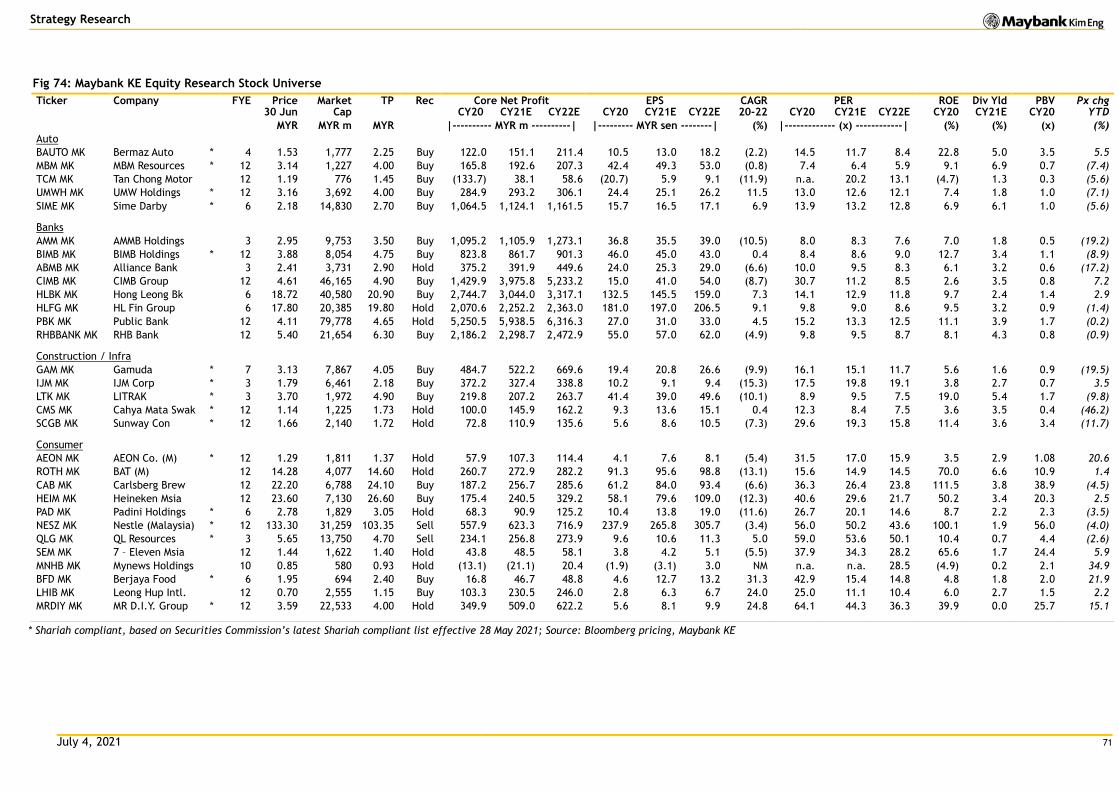
July 4, 2021 71
Strategy Research
Fig 74: Maybank KE Equity Research Stock Universe
Ticker
Company FYE Price Market TP Rec Core Net Profit EPS CAGR PER ROE Div Yld PBV Px chg 30 Jun Cap CY20 CY21E CY22E CY20 CY21E CY22E 20-22 CY20 CY21E CY22E CY20 CY21E CY20 YTD
MYR MYR m MYR |---------- MYR m ----------| |--------- MYR sen --------| (%) |------------- (x) ------------| (%) (%) (x) (%)
Auto
BAUTO MK Bermaz Auto * 4 1.53 1,777 2.25 Buy 122.0 151.1 211.4 10.5 13.0 18.2 (2.2) 14.5 11.7 8.4 22.8 5.0 3.5 5.5
MBM MK MBM Resources * 12 3.14 1,227 4.00 Buy 165.8 192.6 207.3 42.4 49.3 53.0 (0.8) 7.4 6.4 5.9 9.1 6.9 0.7 (7.4)
TCM MK Tan Chong Motor
12 1.19 776 1.45 Buy (133.7) 38.1 58.6 (20.7) 5.9 9.1 (11.9) n.a. 20.2 13.1 (4.7) 1.3 0.3 (5.6)
UMWH MK UMW Holdings * 12 3.16 3,692 4.00 Buy 284.9 293.2 306.1 24.4 25.1 26.2 11.5 13.0 12.6 12.1 7.4 1.8 1.0 (7.1)
SIME MK Sime Darby * 6 2.18 14,830 2.70 Buy 1,064.5 1,124.1 1,161.5 15.7 16.5 17.1 6.9 13.9 13.2 12.8 6.9 6.1 1.0 (5.6)
Banks
AMM MK AMMB Holdings 3 2.95 9,753 3.50 Buy 1,095.2 1,105.9 1,273.1 36.8 35.5 39.0 (10.5) 8.0 8.3 7.6 7.0 1.8 0.5 (19.2)
BIMB MK BIMB Holdings * 12 3.88 8,054 4.75 Buy 823.8 861.7 901.3 46.0 45.0 43.0 0.4 8.4 8.6 9.0 12.7 3.4 1.1 (8.9)
ABMB MK Alliance Bank 3 2.41 3,731 2.90 Hold 375.2 391.9 449.6 24.0 25.3 29.0 (6.6) 10.0 9.5 8.3 6.1 3.2 0.6 (17.2)
CIMB MK CIMB Group 12 4.61 46,165 4.90 Buy 1,429.9 3,975.8 5,233.2 15.0 41.0 54.0 (8.7) 30.7 11.2 8.5 2.6 3.5 0.8 7.2
HLBK MK Hong Leong Bk 6 18.72 40,580 20.90 Buy 2,744.7 3,044.0 3,317.1 132.5 145.5 159.0 7.3 14.1 12.9 11.8 9.7 2.4 1.4 2.9
HLFG MK HL Fin Group 6 17.80 20,385 19.80 Hold 2,070.6 2,252.2 2,363.0 181.0 197.0 206.5 9.1 9.8 9.0 8.6 9.5 3.2 0.9 (1.4)
PBK MK Public Bank 12 4.11 79,778 4.65 Hold 5,250.5 5,938.5 6,316.3 27.0 31.0 33.0 4.5 15.2 13.3 12.5 11.1 3.9 1.7 (0.2)
RHBBANK MK RHB Bank 12 5.40 21,654 6.30 Buy 2,186.2 2,298.7 2,472.9 55.0 57.0 62.0 (4.9) 9.8 9.5 8.7 8.1 4.3 0.8 (0.9)
Construction / Infra
GAM MK Gamuda * 7 3.13 7,867 4.05 Buy 484.7 522.2 669.6 19.4 20.8 26.6 (9.9) 16.1 15.1 11.7 5.6 1.6 0.9 (19.5)
IJM MK IJM Corp * 3 1.79 6,461 2.18 Buy 372.2 327.4 338.8 10.2 9.1 9.4 (15.3) 17.5 19.8 19.1 3.8 2.7 0.7 3.5
LTK MK LITRAK * 3 3.70 1,972 4.90 Buy 219.8 207.2 263.7 41.4 39.0 49.6 (10.1) 8.9 9.5 7.5 19.0 5.4 1.7 (9.8)
CMS MK Cahya Mata Swak * 12 1.14 1,225 1.73 Hold 100.0 145.9 162.2 9.3 13.6 15.1 0.4 12.3 8.4 7.5 3.6 3.5 0.4 (46.2)
SCGB MK Sunway Con * 12 1.66 2,140 1.72 Hold 72.8 110.9 135.6 5.6 8.6 10.5 (7.3) 29.6 19.3 15.8 11.4 3.6 3.4 (11.7)
Consumer
AEON MK AEON Co. (M) * 12 1.29 1,811 1.37 Hold 57.9 107.3 114.4 4.1 7.6 8.1 (5.4) 31.5 17.0 15.9 3.5 2.9 1.08 20.6
ROTH MK BAT (M) 12 14.28 4,077 14.60 Hold 260.7 272.9 282.2 91.3 95.6 98.8 (13.1) 15.6 14.9 14.5 70.0 6.6 10.9 1.4
CAB MK Carlsberg Brew 12 22.20 6,788 24.10 Buy 187.2 256.7 285.6 61.2 84.0 93.4 (6.6) 36.3 26.4 23.8 111.5 3.8 38.9 (4.5)
HEIM MK Heineken Msia 12 23.60 7,130 26.60 Buy 175.4 240.5 329.2 58.1 79.6 109.0 (12.3) 40.6 29.6 21.7 50.2 3.4 20.3 2.5
PAD MK Padini Holdings * 6 2.78 1,829 3.05 Hold 68.3 90.9 125.2 10.4 13.8 19.0 (11.6) 26.7 20.1 14.6 8.7 2.2 2.3 (3.5)
NESZ MK Nestle (Malaysia) * 12 133.30 31,259 103.35 Sell 557.9 623.3 716.9 237.9 265.8 305.7 (3.4) 56.0 50.2 43.6 100.1 1.9 56.0 (4.0)
QLG MK QL Resources * 3 5.65 13,750 4.70 Sell 234.1 256.8 273.9 9.6 10.6 11.3 5.0 59.0 53.6 50.1 10.4 0.7 4.4 (2.6)
SEM MK 7 – Eleven Msia 12 1.44 1,622 1.40 Hold 43.8 48.5 58.1 3.8 4.2 5.1 (5.5) 37.9 34.3 28.2 65.6 1.7 24.4 5.9
MNHB MK Mynews Holdings 10 0.85 580 0.93 Hold (13.1) (21.1) 20.4 (1.9) (3.1) 3.0 NM n.a. n.a. 28.5 (4.9) 0.2 2.1 34.9
BFD MK Berjaya Food * 6 1.95 694 2.40 Buy 16.8 46.7 48.8 4.6 12.7 13.2 31.3 42.9 15.4 14.8 4.8 1.8 2.0 21.9
LHIB MK Leong Hup Intl. 12 0.70 2,555 1.15 Buy 103.3 230.5 246.0 2.8 6.3 6.7 24.0 25.0 11.1 10.4 6.0 2.7 1.5 2.2
MRDIY MK MR D.I.Y. Group * 12 3.59 22,533 4.00 Hold 349.9 509.0 622.2 5.6 8.1 9.9 24.8 64.1 44.3 36.3 39.9 0.0 25.7 15.1
* Shariah compliant, based on Securities Commission’s latest Shariah compliant list effective 28 May 2021; Source: Bloomberg pricing, Maybank KE
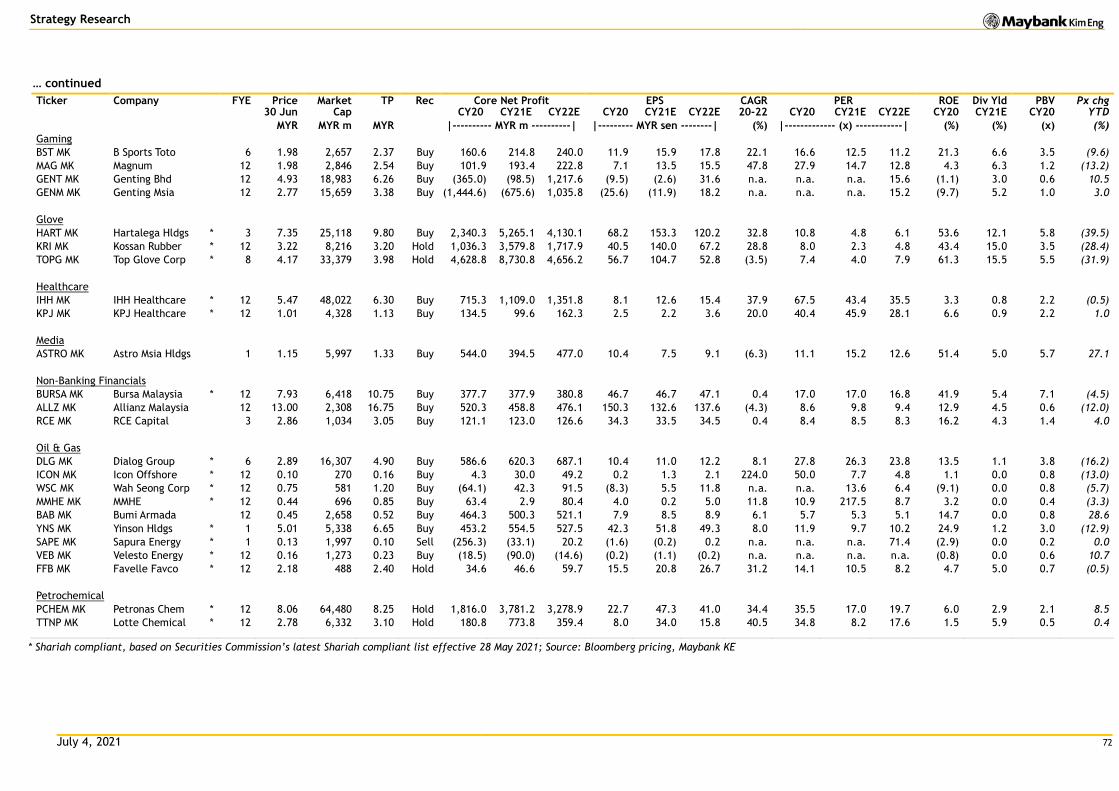
July 4, 2021 72
Strategy Research
… continued
Ticker
Company FYE Price Market TP Rec Core Net Profit EPS CAGR PER ROE Div Yld PBV Px chg 30 Jun Cap CY20 CY21E CY22E CY20 CY21E CY22E 20-22 CY20 CY21E CY22E CY20 CY21E CY20 YTD
MYR MYR m MYR |---------- MYR m ----------| |--------- MYR sen --------| (%) |------------- (x) ------------| (%) (%) (x) (%)
Gaming
BST MK B Sports Toto 6 1.98 2,657 2.37 Buy 160.6 214.8 240.0 11.9 15.9 17.8 22.1 16.6 12.5 11.2 21.3 6.6 3.5 (9.6)
MAG MK Magnum 12 1.98 2,846 2.54 Buy 101.9 193.4 222.8 7.1 13.5 15.5 47.8 27.9 14.7 12.8 4.3 6.3 1.2 (13.2)
GENT MK Genting Bhd 12 4.93 18,983 6.26 Buy (365.0) (98.5) 1,217.6 (9.5) (2.6) 31.6 n.a. n.a. n.a. 15.6 (1.1) 3.0 0.6 10.5
GENM MK Genting Msia 12 2.77 15,659 3.38 Buy (1,444.6) (675.6) 1,035.8 (25.6) (11.9) 18.2 n.a. n.a. n.a. 15.2 (9.7) 5.2 1.0 3.0
Glove
HART MK Hartalega Hldgs * 3 7.35 25,118 9.80 Buy 2,340.3 5,265.1 4,130.1 68.2 153.3 120.2 32.8 10.8 4.8 6.1 53.6 12.1 5.8 (39.5)
KRI MK Kossan Rubber * 12 3.22 8,216 3.20 Hold 1,036.3 3,579.8 1,717.9 40.5 140.0 67.2 28.8 8.0 2.3 4.8 43.4 15.0 3.5 (28.4)
TOPG MK Top Glove Corp * 8 4.17 33,379 3.98 Hold 4,628.8 8,730.8 4,656.2 56.7 104.7 52.8 (3.5) 7.4 4.0 7.9 61.3 15.5 5.5 (31.9)
Healthcare
IHH MK IHH Healthcare * 12 5.47 48,022 6.30 Buy 715.3 1,109.0 1,351.8 8.1 12.6 15.4 37.9 67.5 43.4 35.5 3.3 0.8 2.2 (0.5)
KPJ MK KPJ Healthcare * 12 1.01 4,328 1.13 Buy 134.5 99.6 162.3 2.5 2.2 3.6 20.0 40.4 45.9 28.1 6.6 0.9 2.2 1.0
Media
ASTRO MK Astro Msia Hldgs 1 1.15 5,997 1.33 Buy 544.0 394.5 477.0 10.4 7.5 9.1 (6.3) 11.1 15.2 12.6 51.4 5.0 5.7 27.1
Non-Banking Financials Fi
BURSA MK Bursa Malaysia * 12 7.93 6,418 10.75 Buy 377.7 377.9 380.8 46.7 46.7 47.1 0.4 17.0 17.0 16.8 41.9 5.4 7.1 (4.5)
ALLZ MK Allianz Malaysia 12 13.00 2,308 16.75 Buy 520.3 458.8 476.1 150.3 132.6 137.6 (4.3) 8.6 9.8 9.4 12.9 4.5 0.6 (12.0)
RCE MK RCE Capital 3 2.86 1,034 3.05 Buy 121.1 123.0 126.6 34.3 33.5 34.5 0.4 8.4 8.5 8.3 16.2 4.3 1.4 4.0
Oil & Gas
DLG MK Dialog Group * 6 2.89 16,307 4.90 Buy 586.6 620.3 687.1 10.4 11.0 12.2 8.1 27.8 26.3 23.8 13.5 1.1 3.8 (16.2)
ICON MK Icon Offshore * 12 0.10 270 0.16 Buy 4.3 30.0 49.2 0.2 1.3 2.1 224.0 50.0 7.7 4.8 1.1 0.0 0.8 (13.0)
WSC MK Wah Seong Corp * 12 0.75 581 1.20 Buy (64.1) 42.3 91.5 (8.3) 5.5 11.8 n.a. n.a. 13.6 6.4 (9.1) 0.0 0.8 (5.7)
MMHE MK MMHE * 12 0.44 696 0.85 Buy 63.4 2.9 80.4 4.0 0.2 5.0 11.8 10.9 217.5 8.7 3.2 0.0 0.4 (3.3)
BAB MK Bumi Armada 12 0.45 2,658 0.52 Buy 464.3 500.3 521.1 7.9 8.5 8.9 6.1 5.7 5.3 5.1 14.7 0.0 0.8 28.6
YNS MK Yinson Hldgs * 1 5.01 5,338 6.65 Buy 453.2 554.5 527.5 42.3 51.8 49.3 8.0 11.9 9.7 10.2 24.9 1.2 3.0 (12.9)
SAPE MK Sapura Energy * 1 0.13 1,997 0.10 Sell (256.3) (33.1) 20.2 (1.6) (0.2) 0.2 n.a. n.a. n.a. 71.4 (2.9) 0.0 0.2 0.0
VEB MK Velesto Energy * 12 0.16 1,273 0.23 Buy (18.5) (90.0) (14.6) (0.2) (1.1) (0.2) n.a. n.a. n.a. n.a. (0.8) 0.0 0.6 10.7
FFB MK Favelle Favco * 12 2.18 488 2.40 Hold 34.6 46.6 59.7 15.5 20.8 26.7 31.2 14.1 10.5 8.2 4.7 5.0 0.7 (0.5)
Petrochemical
PCHEM MK Petronas Chem * 12 8.06 64,480 8.25 Hold 1,816.0 3,781.2 3,278.9 22.7 47.3 41.0 34.4 35.5 17.0 19.7 6.0 2.9 2.1 8.5
TTNP MK Lotte Chemical * 12 2.78 6,332 3.10 Hold 180.8 773.8 359.4 8.0 34.0 15.8 40.5 34.8 8.2 17.6 1.5 5.9 0.5 0.4
* Shariah compliant, based on Securities Commission’s latest Shariah compliant list effective 28 May 2021; Source: Bloomberg pricing, Maybank KE
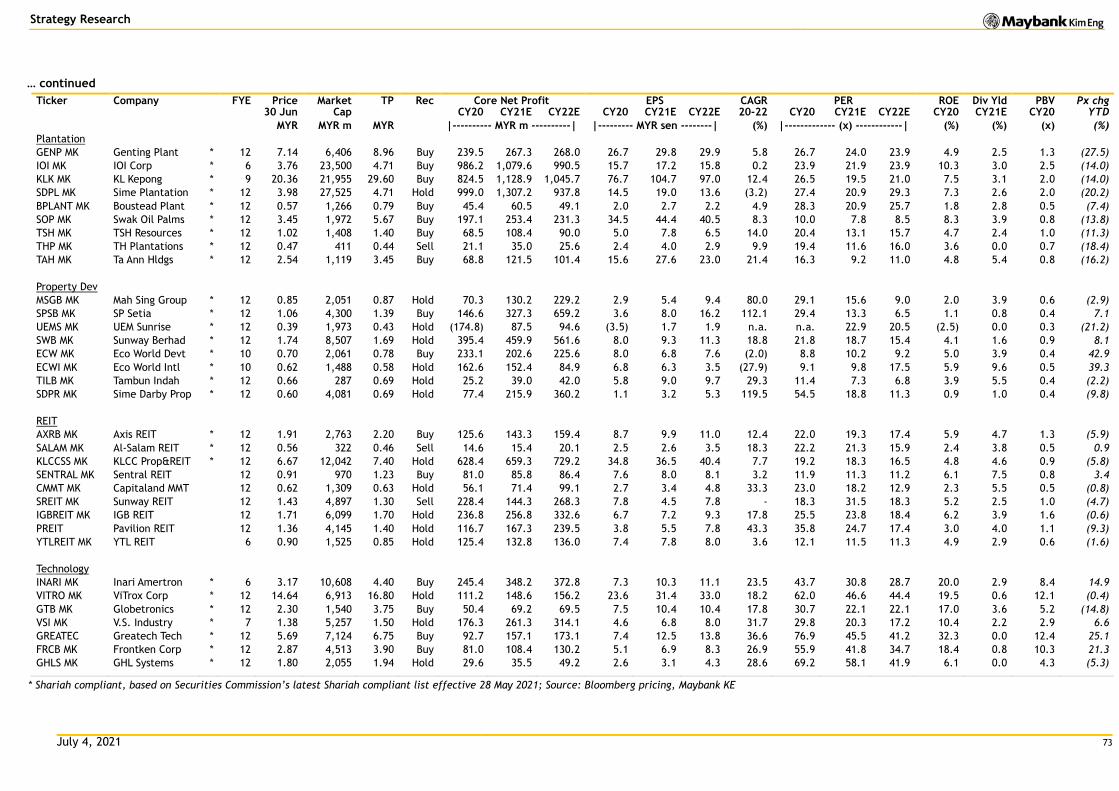
July 4, 2021 73
Strategy Research
… continued
Ticker
Company FYE Price Market TP Rec Core Net Profit EPS CAGR PER ROE Div Yld PBV Px chg 30 Jun Cap CY20 CY21E CY22E CY20 CY21E CY22E 20-22 CY20 CY21E CY22E CY20 CY21E CY20 YTD
MYR MYR m MYR |---------- MYR m ----------| |--------- MYR sen --------| (%) |------------- (x) ------------| (%) (%) (x) (%)
Plantation
GENP MK Genting Plant * 12 7.14 6,406 8.96 Buy 239.5 267.3 268.0 26.7 29.8 29.9 5.8 26.7 24.0 23.9 4.9 2.5 1.3 (27.5)
IOI MK IOI Corp * 6 3.76 23,500 4.71 Buy 986.2 1,079.6 990.5 15.7 17.2 15.8 0.2 23.9 21.9 23.9 10.3 3.0 2.5 (14.0)
KLK MK KL Kepong * 9 20.36 21,955 29.60 Buy 824.5 1,128.9 1,045.7 76.7 104.7 97.0 12.4 26.5 19.5 21.0 7.5 3.1 2.0 (14.0)
SDPL MK Sime Plantation * 12 3.98 27,525 4.71 Hold 999.0 1,307.2 937.8 14.5 19.0 13.6 (3.2) 27.4 20.9 29.3 7.3 2.6 2.0 (20.2)
BPLANT MK Boustead Plant * 12 0.57 1,266 0.79 Buy 45.4 60.5 49.1 2.0 2.7 2.2 4.9 28.3 20.9 25.7 1.8 2.8 0.5 (7.4)
SOP MK Swak Oil Palms * 12 3.45 1,972 5.67 Buy 197.1 253.4 231.3 34.5 44.4 40.5 8.3 10.0 7.8 8.5 8.3 3.9 0.8 (13.8)
TSH MK TSH Resources * 12 1.02 1,408 1.40 Buy 68.5 108.4 90.0 5.0 7.8 6.5 14.0 20.4 13.1 15.7 4.7 2.4 1.0 (11.3)
THP MK TH Plantations * 12 0.47 411 0.44 Sell 21.1 35.0 25.6 2.4 4.0 2.9 9.9 19.4 11.6 16.0 3.6 0.0 0.7 (18.4)
TAH MK Ta Ann Hldgs * 12 2.54 1,119 3.45 Buy 68.8 121.5 101.4 15.6 27.6 23.0 21.4 16.3 9.2 11.0 4.8 5.4 0.8 (16.2)
Property Dev
MSGB MK Mah Sing Group * 12 0.85 2,051 0.87 Hold 70.3 130.2 229.2 2.9 5.4 9.4 80.0 29.1 15.6 9.0 2.0 3.9 0.6 (2.9)
SPSB MK SP Setia * 12 1.06 4,300 1.39 Buy 146.6 327.3 659.2 3.6 8.0 16.2 112.1 29.4 13.3 6.5 1.1 0.8 0.4 7.1
UEMS MK UEM Sunrise * 12 0.39 1,973 0.43 Hold (174.8) 87.5 94.6 (3.5) 1.7 1.9 n.a. n.a. 22.9 20.5 (2.5) 0.0 0.3 (21.2)
SWB MK Sunway Berhad * 12 1.74 8,507 1.69 Hold 395.4 459.9 561.6 8.0 9.3 11.3 18.8 21.8 18.7 15.4 4.1 1.6 0.9 8.1
ECW MK Eco World Devt * 10 0.70 2,061 0.78 Buy 233.1 202.6 225.6 8.0 6.8 7.6 (2.0) 8.8 10.2 9.2 5.0 3.9 0.4 42.9
ECWI MK Eco World Intl * 10 0.62 1,488 0.58 Hold 162.6 152.4 84.9 6.8 6.3 3.5 (27.9) 9.1 9.8 17.5 5.9 9.6 0.5 39.3
TILB MK Tambun Indah * 12 0.66 287 0.69 Hold 25.2 39.0 42.0 5.8 9.0 9.7 29.3 11.4 7.3 6.8 3.9 5.5 0.4 (2.2)
SDPR MK Sime Darby Prop * 12 0.60 4,081 0.69 Hold 77.4 215.9 360.2 1.1 3.2 5.3 119.5 54.5 18.8 11.3 0.9 1.0 0.4 (9.8)
REIT
AXRB MK Axis REIT * 12 1.91 2,763 2.20 Buy 125.6 143.3 159.4 8.7 9.9 11.0 12.4 22.0 19.3 17.4 5.9 4.7 1.3 (5.9)
SALAM MK Al-Salam REIT * 12 0.56 322 0.46 Sell 14.6 15.4 20.1 2.5 2.6 3.5 18.3 22.2 21.3 15.9 2.4 3.8 0.5 0.9
KLCCSS MK KLCC Prop&REIT * 12 6.67 12,042 7.40 Hold 628.4 659.3 729.2 34.8 36.5 40.4 7.7 19.2 18.3 16.5 4.8 4.6 0.9 (5.8)
SENTRAL MK Sentral REIT 12 0.91 970 1.23 Buy 81.0 85.8 86.4 7.6 8.0 8.1 3.2 11.9 11.3 11.2 6.1 7.5 0.8 3.4
CMMT MK Capitaland MMT 12 0.62 1,309 0.63 Hold 56.1 71.4 99.1 2.7 3.4 4.8 33.3 23.0 18.2 12.9 2.3 5.5 0.5 (0.8)
SREIT MK Sunway REIT 12 1.43 4,897 1.30 Sell 228.4 144.3 268.3 7.8 4.5 7.8 - 18.3 31.5 18.3 5.2 2.5 1.0 (4.7)
IGBREIT MK IGB REIT 12 1.71 6,099 1.70 Hold 236.8 256.8 332.6 6.7 7.2 9.3 17.8 25.5 23.8 18.4 6.2 3.9 1.6 (0.6)
PREIT Pavilion REIT 12 1.36 4,145 1.40 Hold 116.7 167.3 239.5 3.8 5.5 7.8 43.3 35.8 24.7 17.4 3.0 4.0 1.1 (9.3)
YTLREIT MK YTL REIT 6 0.90 1,525 0.85 Hold 125.4 132.8 136.0 7.4 7.8 8.0 3.6 12.1 11.5 11.3 4.9 2.9 0.6 (1.6)
Technology
INARI MK Inari Amertron * 6 3.17 10,608 4.40 Buy 245.4 348.2 372.8 7.3 10.3 11.1 23.5 43.7 30.8 28.7 20.0 2.9 8.4 14.9
VITRO MK ViTrox Corp * 12 14.64 6,913 16.80 Hold 111.2 148.6 156.2 23.6 31.4 33.0 18.2 62.0 46.6 44.4 19.5 0.6 12.1 (0.4)
GTB MK Globetronics * 12 2.30 1,540 3.75 Buy 50.4 69.2 69.5 7.5 10.4 10.4 17.8 30.7 22.1 22.1 17.0 3.6 5.2 (14.8)
VSI MK V.S. Industry * 7 1.38 5,257 1.50 Hold 176.3 261.3 314.1 4.6 6.8 8.0 31.7 29.8 20.3 17.2 10.4 2.2 2.9 6.6
GREATEC Greatech Tech * 12 5.69 7,124 6.75 Buy 92.7 157.1 173.1 7.4 12.5 13.8 36.6 76.9 45.5 41.2 32.3 0.0 12.4 25.1
FRCB MK Frontken Corp * 12 2.87 4,513 3.90 Buy 81.0 108.4 130.2 5.1 6.9 8.3 26.9 55.9 41.8 34.7 18.4 0.8 10.3 21.3
GHLS MK GHL Systems * 12 1.80 2,055 1.94 Hold 29.6 35.5 49.2 2.6 3.1 4.3 28.6 69.2 58.1 41.9 6.1 0.0 4.3 (5.3)
* Shariah compliant, based on Securities Commission’s latest Shariah compliant list effective 28 May 2021; Source: Bloomberg pricing, Maybank KE
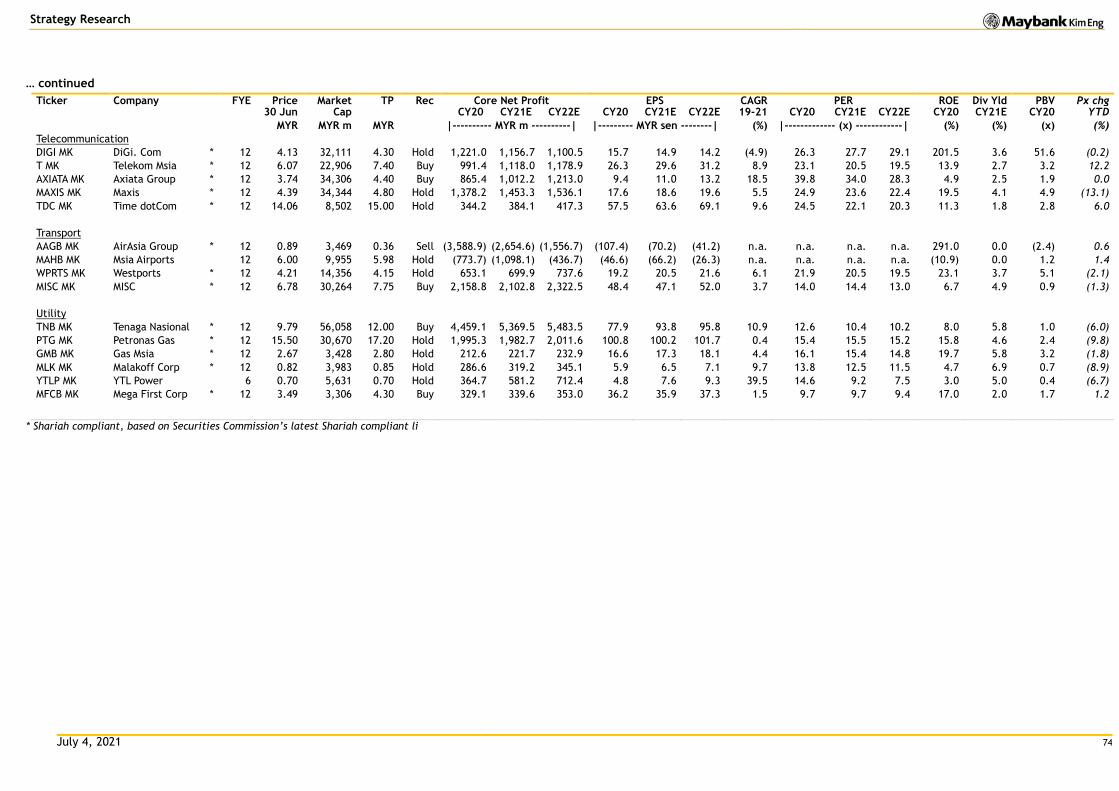
July 4, 2021 74
Strategy Research
… continued
Ticker
Company FYE Price Market TP Rec Core Net Profit EPS CAGR PER ROE Div Yld PBV Px chg 30 Jun Cap CY20 CY21E CY22E CY20 CY21E CY22E 19-21 CY20 CY21E CY22E CY20 CY21E CY20 YTD
MYR MYR m MYR |---------- MYR m ----------| |--------- MYR sen --------| (%) |------------- (x) ------------| (%) (%) (x) (%)
Telecommunication
DIGI MK DiGi. Com * 12 4.13 32,111 4.30 Hold 1,221.0 1,156.7 1,100.5 15.7 14.9 14.2 (4.9) 26.3 27.7 29.1 201.5 3.6 51.6 (0.2)
T MK Telekom Msia * 12 6.07 22,906 7.40 Buy 991.4 1,118.0 1,178.9 26.3 29.6 31.2 8.9 23.1 20.5 19.5 13.9 2.7 3.2 12.2
AXIATA MK Axiata Group * 12 3.74 34,306 4.40 Buy 865.4 1,012.2 1,213.0 9.4 11.0 13.2 18.5 39.8 34.0 28.3 4.9 2.5 1.9 0.0
MAXIS MK Maxis * 12 4.39 34,344 4.80 Hold 1,378.2 1,453.3 1,536.1 17.6 18.6 19.6 5.5 24.9 23.6 22.4 19.5 4.1 4.9 (13.1)
TDC MK Time dotCom * 12 14.06 8,502 15.00 Hold 344.2 384.1 417.3 57.5 63.6 69.1 9.6 24.5 22.1 20.3 11.3 1.8 2.8 6.0
Transport
AAGB MK AirAsia Group * 12 0.89 3,469 0.36 Sell (3,588.9) (2,654.6) (1,556.7) (107.4) (70.2) (41.2) n.a. n.a. n.a. n.a. 291.0 0.0 (2.4) 0.6
MAHB MK Msia Airports 12 6.00 9,955 5.98 Hold (773.7) (1,098.1) (436.7) (46.6) (66.2) (26.3) n.a. n.a. n.a. n.a. (10.9) 0.0 1.2 1.4
WPRTS MK Westports * 12 4.21 14,356 4.15 Hold 653.1 699.9 737.6 19.2 20.5 21.6 6.1 21.9 20.5 19.5 23.1 3.7 5.1 (2.1)
MISC MK MISC * 12 6.78 30,264 7.75 Buy 2,158.8 2,102.8 2,322.5 48.4 47.1 52.0 3.7 14.0 14.4 13.0 6.7 4.9 0.9 (1.3)
Utility
TNB MK Tenaga Nasional * 12 9.79 56,058 12.00 Buy 4,459.1 5,369.5 5,483.5 77.9 93.8 95.8 10.9 12.6 10.4 10.2 8.0 5.8 1.0 (6.0)
PTG MK Petronas Gas * 12 15.50 30,670 17.20 Hold 1,995.3 1,982.7 2,011.6 100.8 100.2 101.7 0.4 15.4 15.5 15.2 15.8 4.6 2.4 (9.8)
GMB MK Gas Msia * 12 2.67 3,428 2.80 Hold 212.6 221.7 232.9 16.6 17.3 18.1 4.4 16.1 15.4 14.8 19.7 5.8 3.2 (1.8)
MLK MK Malakoff Corp * 12 0.82 3,983 0.85 Hold 286.6 319.2 345.1 5.9 6.5 7.1 9.7 13.8 12.5 11.5 4.7 6.9 0.7 (8.9)
YTLP MK YTL Power 6 0.70 5,631 0.70 Hold 364.7 581.2 712.4 4.8 7.6 9.3 39.5 14.6 9.2 7.5 3.0 5.0 0.4 (6.7)
MFCB MK Mega First Corp * 12 3.49 3,306 4.30 Buy 329.1 339.6 353.0 36.2 35.9 37.3 1.5 9.7 9.7 9.4 17.0 2.0 1.7 1.2
* Shariah compliant, based on Securities Commission’s latest Shariah compliant li
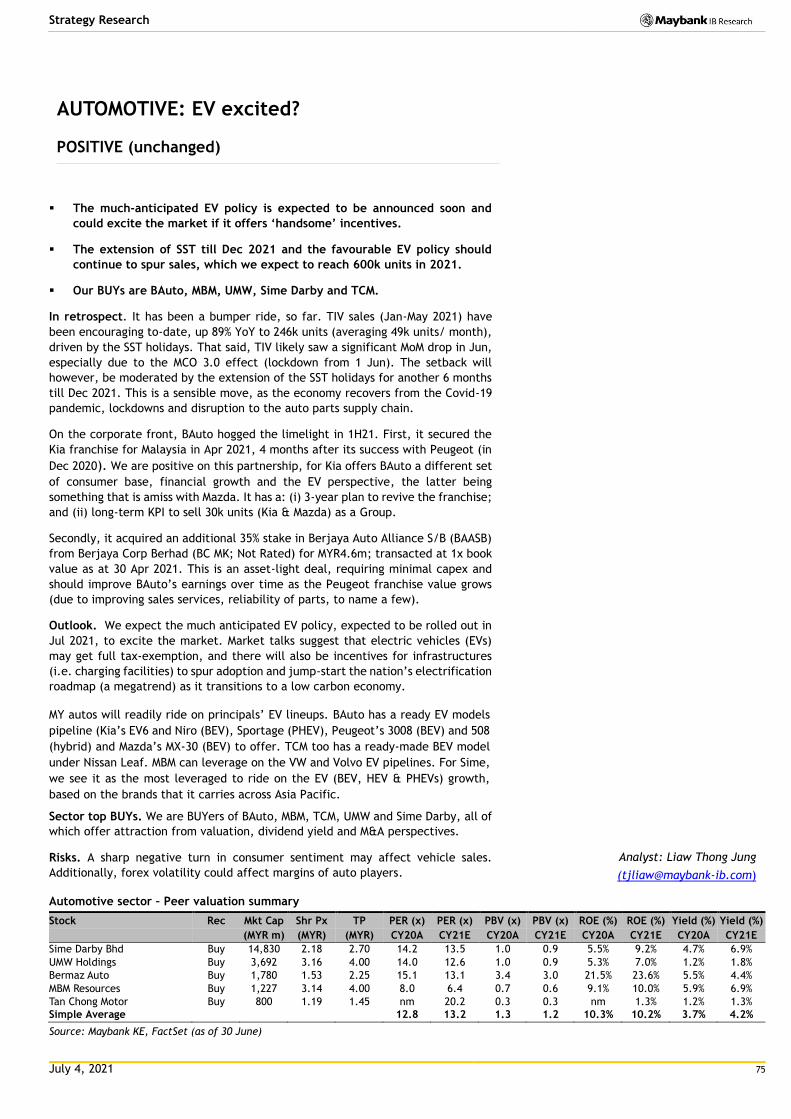
July 4, 2021 75
Strategy Research
AUTOMOTIVE: EV excited?
POSITIVE (unchanged)
The much-anticipated EV policy is expected to be announced soon and
could excite the market if it offers ‘handsome’ incentives.
The extension of SST till Dec 2021 and the favourable EV policy should
continue to spur sales, which we expect to reach 600k units in 2021.
Our BUYs are BAuto, MBM, UMW, Sime Darby and TCM.
In retrospect. It has been a bumper ride, so far. TIV sales (Jan-May 2021) have
been encouraging to-date, up 89% YoY to 246k units (averaging 49k units/ month),
driven by the SST holidays. That said, TIV likely saw a significant MoM drop in Jun,
especially due to the MCO 3.0 effect (lockdown from 1 Jun). The setback will
however, be moderated by the extension of the SST holidays for another 6 months
till Dec 2021. This is a sensible move, as the economy recovers from the Covid-19
pandemic, lockdowns and disruption to the auto parts supply chain.
On the corporate front, BAuto hogged the limelight in 1H21. First, it secured the
Kia franchise for Malaysia in Apr 2021, 4 months after its success with Peugeot (in
Dec 2020). We are positive on this partnership, for Kia offers BAuto a different set
of consumer base, financial growth and the EV perspective, the latter being
something that is amiss with Mazda. It has a: (i) 3-year plan to revive the franchise;
and (ii) long-term KPI to sell 30k units (Kia & Mazda) as a Group.
Secondly, it acquired an additional 35% stake in Berjaya Auto Alliance S/B (BAASB)
from Berjaya Corp Berhad (BC MK; Not Rated) for MYR4.6m; transacted at 1x book
value as at 30 Apr 2021. This is an asset-light deal, requiring minimal capex and
should improve BAuto’s earnings over time as the Peugeot franchise value grows
(due to improving sales services, reliability of parts, to name a few).
Outlook. We expect the much anticipated EV policy, expected to be rolled out in
Jul 2021, to excite the market. Market talks suggest that electric vehicles (EVs)
may get full tax-exemption, and there will also be incentives for infrastructures
(i.e. charging facilities) to spur adoption and jump-start the nation’s electrification
roadmap (a megatrend) as it transitions to a low carbon economy.
MY autos will readily ride on principals’ EV lineups. BAuto has a ready EV models
pipeline (Kia’s EV6 and Niro (BEV), Sportage (PHEV), Peugeot’s 3008 (BEV) and 508
(hybrid) and Mazda’s MX-30 (BEV) to offer. TCM too has a ready-made BEV model
under Nissan Leaf. MBM can leverage on the VW and Volvo EV pipelines. For Sime,
we see it as the most leveraged to ride on the EV (BEV, HEV & PHEVs) growth,
based on the brands that it carries across Asia Pacific.
Sector top BUYs. We are BUYers of BAuto, MBM, TCM, UMW and Sime Darby, all of
which offer attraction from valuation, dividend yield and M&A perspectives.
Risks. A sharp negative turn in consumer sentiment may affect vehicle sales.
Additionally, forex volatility could affect margins of auto players.
Automotive sector – Peer valuation summary
Stock Rec Mkt Cap Shr Px TP PER (x) PER (x) PBV (x) PBV (x) ROE (%) ROE (%) Yield (%) Yield (%)
(MYR m) (MYR) (MYR) CY20A CY21E CY20A CY21E CY20A CY21E CY20A CY21E
Sime Darby Bhd Buy 14,830 2.18 2.70 14.2 13.5 1.0 0.9 5.5% 9.2% 4.7% 6.9%
UMW Holdings Buy 3,692 3.16 4.00 14.0 12.6 1.0 0.9 5.3% 7.0% 1.2% 1.8%
Bermaz Auto Buy 1,780 1.53 2.25 15.1 13.1 3.4 3.0 21.5% 23.6% 5.5% 4.4%
MBM Resources Buy 1,227 3.14 4.00 8.0 6.4 0.7 0.6 9.1% 10.0% 5.9% 6.9%
Tan Chong Motor Buy 800 1.19 1.45 nm 20.2 0.3 0.3 nm 1.3% 1.2% 1.3%
Simple Average 12.8 13.2 1.3 1.2 10.3% 10.2% 3.7% 4.2%
Source: Maybank KE, FactSet (as of 30 June)
Analyst: Liaw Thong Jung
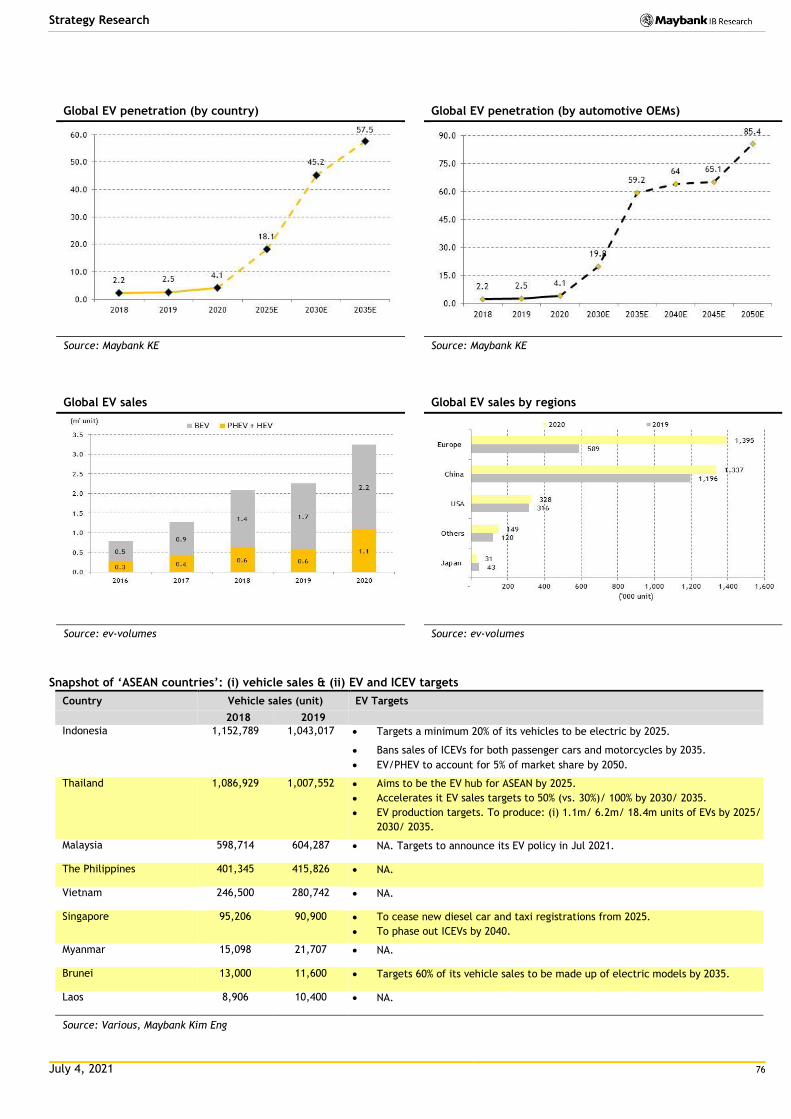
July 4, 2021 76
Strategy Research
Global EV penetration (by country) Global EV penetration (by automotive OEMs)
Source: Maybank KE Source: Maybank KE
Global EV sales Global EV sales by regions
Source: ev-volumes Source: ev-volumes
Snapshot of ‘ASEAN countries’: (i) vehicle sales & (ii) EV and ICEV targets
Country Vehicle sales (unit) EV Targets
2018 2019
Indonesia 1,152,789 1,043,017 Targets a minimum 20% of its vehicles to be electric by 2025.
Bans sales of ICEVs for both passenger cars and motorcycles by 2035.
EV/PHEV to account for 5% of market share by 2050.
Thailand 1,086,929 1,007,552 Aims to be the EV hub for ASEAN by 2025.
Accelerates it EV sales targets to 50% (vs. 30%)/ 100% by 2030/ 2035.
EV production targets. To produce: (i) 1.1m/ 6.2m/ 18.4m units of EVs by 2025/
2030/ 2035.
Malaysia 598,714 604,287 NA. Targets to announce its EV policy in Jul 2021.
The Philippines 401,345 415,826 NA.
Vietnam 246,500 280,742 NA.
Singapore 95,206 90,900 To cease new diesel car and taxi registrations from 2025.
To phase out ICEVs by 2040.
Myanmar 15,098 21,707 NA.
Brunei 13,000 11,600 Targets 60% of its vehicle sales to be made up of electric models by 2035.
Laos 8,906 10,400 NA.
Source: Various, Maybank Kim Eng
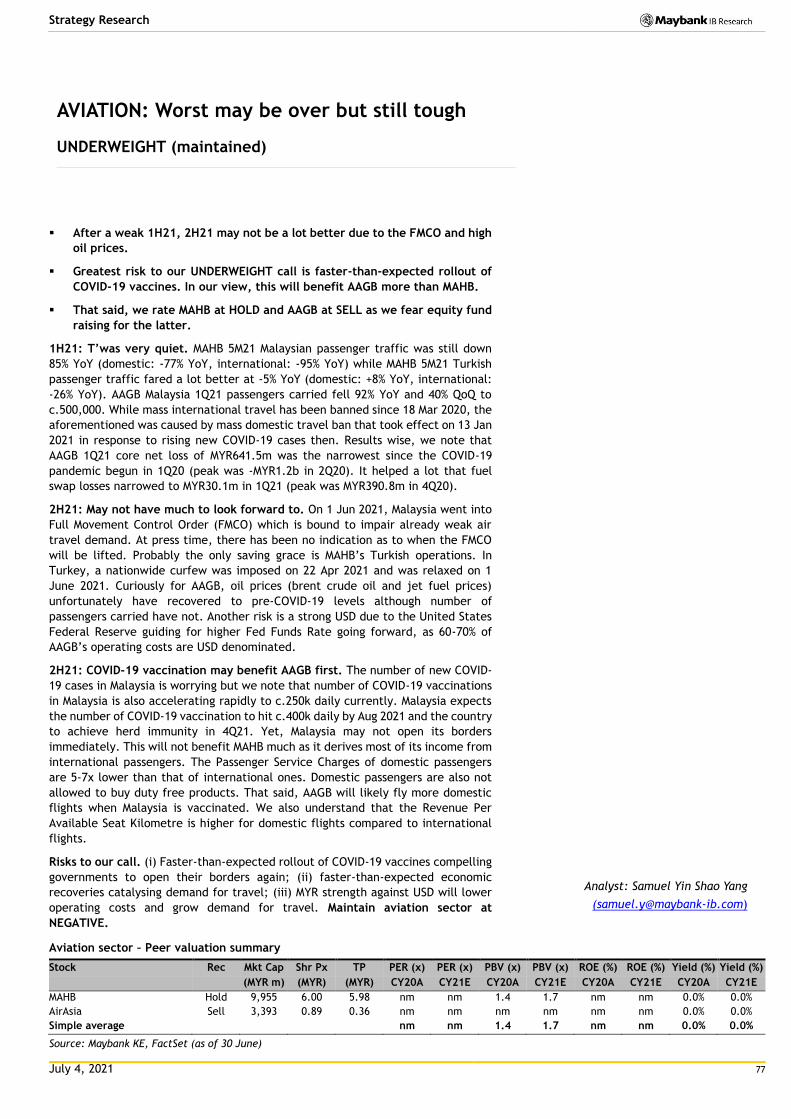
July 4, 2021 77
Strategy Research
AVIATION: Worst may be over but still tough
UNDERWEIGHT (maintained)
After a weak 1H21, 2H21 may not be a lot better due to the FMCO and high
oil prices.
Greatest risk to our UNDERWEIGHT call is faster-than-expected rollout of
COVID-19 vaccines. In our view, this will benefit AAGB more than MAHB.
That said, we rate MAHB at HOLD and AAGB at SELL as we fear equity fund
raising for the latter.
1H21: T’was very quiet. MAHB 5M21 Malaysian passenger traffic was still down
85% YoY (domestic: -77% YoY, international: -95% YoY) while MAHB 5M21 Turkish
passenger traffic fared a lot better at -5% YoY (domestic: +8% YoY, international:
-26% YoY). AAGB Malaysia 1Q21 passengers carried fell 92% YoY and 40% QoQ to
c.500,000. While mass international travel has been banned since 18 Mar 2020, the
aforementioned was caused by mass domestic travel ban that took effect on 13 Jan
2021 in response to rising new COVID-19 cases then. Results wise, we note that
AAGB 1Q21 core net loss of MYR641.5m was the narrowest since the COVID-19
pandemic begun in 1Q20 (peak was -MYR1.2b in 2Q20). It helped a lot that fuel
swap losses narrowed to MYR30.1m in 1Q21 (peak was MYR390.8m in 4Q20).
2H21: May not have much to look forward to. On 1 Jun 2021, Malaysia went into
Full Movement Control Order (FMCO) which is bound to impair already weak air
travel demand. At press time, there has been no indication as to when the FMCO
will be lifted. Probably the only saving grace is MAHB’s Turkish operations. In
Turkey, a nationwide curfew was imposed on 22 Apr 2021 and was relaxed on 1
June 2021. Curiously for AAGB, oil prices (brent crude oil and jet fuel prices)
unfortunately have recovered to pre-COVID-19 levels although number of
passengers carried have not. Another risk is a strong USD due to the United States
Federal Reserve guiding for higher Fed Funds Rate going forward, as 60-70% of
AAGB’s operating costs are USD denominated.
2H21: COVID-19 vaccination may benefit AAGB first. The number of new COVID-
19 cases in Malaysia is worrying but we note that number of COVID-19 vaccinations
in Malaysia is also accelerating rapidly to c.250k daily currently. Malaysia expects
the number of COVID-19 vaccination to hit c.400k daily by Aug 2021 and the country
to achieve herd immunity in 4Q21. Yet, Malaysia may not open its borders
immediately. This will not benefit MAHB much as it derives most of its income from
international passengers. The Passenger Service Charges of domestic passengers
are 5-7x lower than that of international ones. Domestic passengers are also not
allowed to buy duty free products. That said, AAGB will likely fly more domestic
flights when Malaysia is vaccinated. We also understand that the Revenue Per
Available Seat Kilometre is higher for domestic flights compared to international
flights.
Risks to our call. (i) Faster-than-expected rollout of COVID-19 vaccines compelling
governments to open their borders again; (ii) faster-than-expected economic
recoveries catalysing demand for travel; (iii) MYR strength against USD will lower
operating costs and grow demand for travel. Maintain aviation sector at
NEGATIVE.
Aviation sector – Peer valuation summary
Stock Rec Mkt Cap Shr Px TP PER (x) PER (x) PBV (x) PBV (x) ROE (%) ROE (%) Yield (%) Yield (%)
(MYR m) (MYR) (MYR) CY20A CY21E CY20A CY21E CY20A CY21E CY20A CY21E
MAHB Hold 9,955 6.00 5.98 nm nm 1.4 1.7 nm nm 0.0% 0.0%
AirAsia Sell 3,393 0.89 0.36 nm nm nm nm nm nm 0.0% 0.0%
Simple average nm nm 1.4 1.7 nm nm 0.0% 0.0%
Source: Maybank KE, FactSet (as of 30 June)
Analyst: Samuel Yin Shao Yang
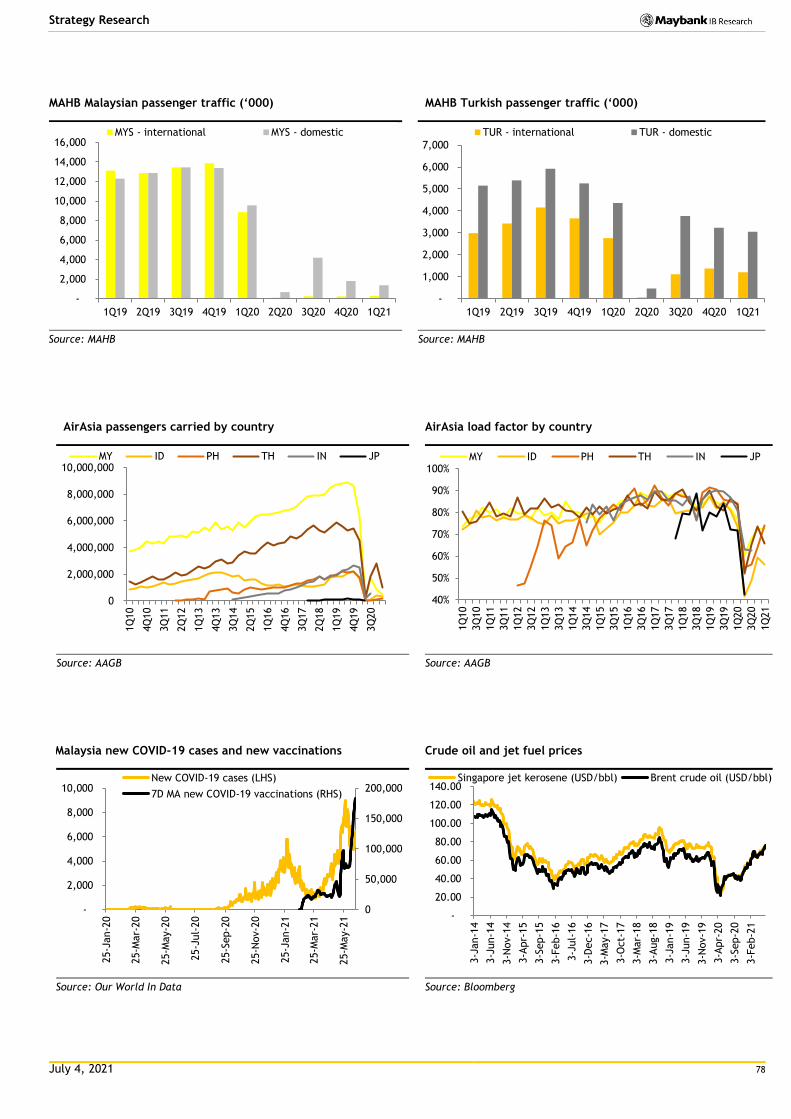
July 4, 2021 78
Strategy Research
MAHB Malaysian passenger traffic (‘000) MAHB Turkish passenger traffic (‘000)
Source: MAHB Source: MAHB
AirAsia passengers carried by country AirAsia load factor by country
Source: AAGB Source: AAGB
Malaysia new COVID-19 cases and new vaccinations Crude oil and jet fuel prices
Source: Our World In Data Source: Bloomberg
-
2,000
4,000
6,000
8,000
10,000
12,000
14,000
16,000
1Q19 2Q19 3Q19 4Q19 1Q20 2Q20 3Q20 4Q20 1Q21
MYS - international MYS - domestic
-
1,000
2,000
3,000
4,000
5,000
6,000
7,000
1Q19 2Q19 3Q19 4Q19 1Q20 2Q20 3Q20 4Q20 1Q21
TUR - international TUR - domestic
0
2,000,000
4,000,000
6,000,000
8,000,000
10,000,000
1Q
10
4Q
10
3Q
11
2Q
12
1Q
13
4Q
13
3Q
14
2Q
15
1Q
16
4Q
16
3Q
17
2Q
18
1Q
19
4Q
19
3Q
20
MY ID PH TH IN JP
40%
50%
60%
70%
80%
90%
100%1Q
10
3Q
10
1Q
11
3Q
11
1Q
12
3Q
12
1Q
13
3Q
13
1Q
14
3Q
14
1Q
15
3Q
15
1Q
16
3Q
16
1Q
17
3Q
17
1Q
18
3Q
18
1Q
19
3Q
19
1Q
20
3Q
20
1Q
21
MY ID PH TH IN JP
0
50,000
100,000
150,000
200,000
-
2,000
4,000
6,000
8,000
10,000
25-J
an-2
0
25-M
ar-
20
25-M
ay-2
0
25-J
ul-
20
25-S
ep-2
0
25-N
ov-2
0
25-J
an-2
1
25-M
ar-
21
25-M
ay-2
1
New COVID-19 cases (LHS)
7D MA new COVID-19 vaccinations (RHS)
-
20.00
40.00
60.00
80.00
100.00
120.00
140.00
3-J
an-1
4
3-J
un-1
4
3-N
ov-1
4
3-A
pr-
15
3-S
ep-1
5
3-F
eb-1
6
3-J
ul-
16
3-D
ec-1
6
3-M
ay-1
7
3-O
ct-
17
3-M
ar-
18
3-A
ug-1
8
3-J
an-1
9
3-J
un-1
9
3-N
ov-1
9
3-A
pr-
20
3-S
ep-2
0
3-F
eb-2
1
Singapore jet kerosene (USD/bbl) Brent crude oil (USD/bbl)
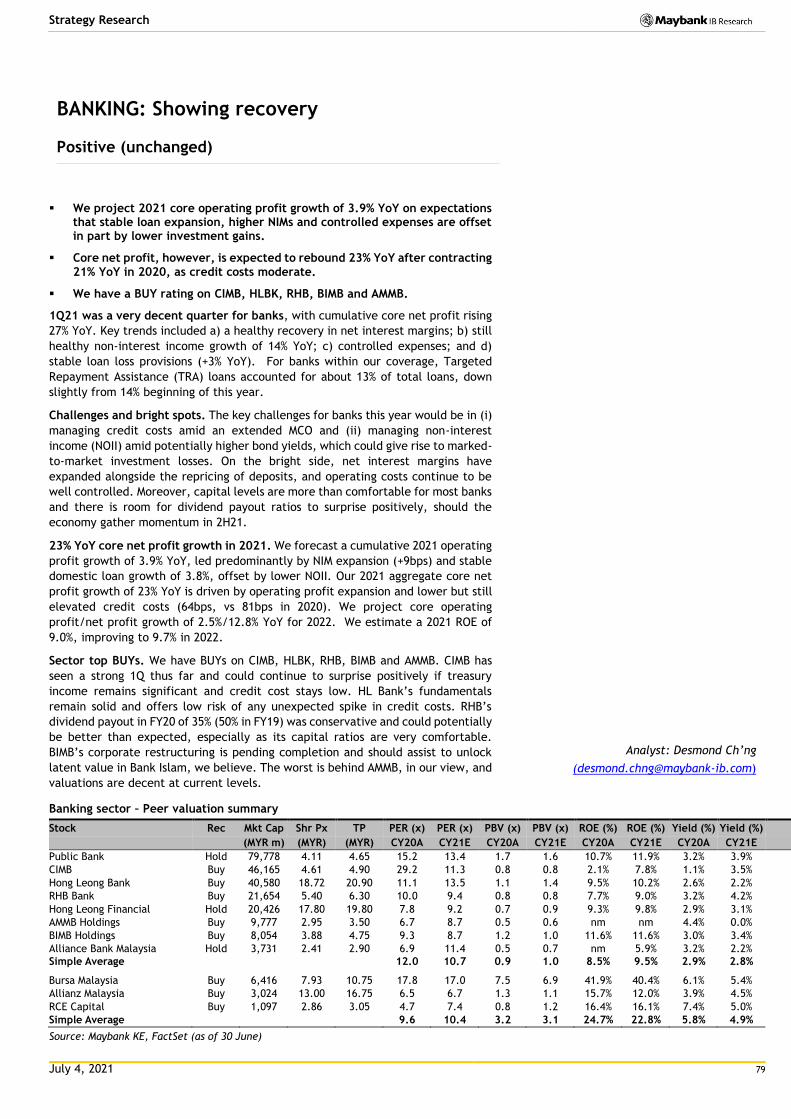
July 4, 2021 79
Strategy Research
BANKING: Showing recovery
Positive (unchanged)
We project 2021 core operating profit growth of 3.9% YoY on expectations
that stable loan expansion, higher NIMs and controlled expenses are offset in part by lower investment gains.
Core net profit, however, is expected to rebound 23% YoY after contracting 21% YoY in 2020, as credit costs moderate.
We have a BUY rating on CIMB, HLBK, RHB, BIMB and AMMB.
1Q21 was a very decent quarter for banks, with cumulative core net profit rising
27% YoY. Key trends included a) a healthy recovery in net interest margins; b) still
healthy non-interest income growth of 14% YoY; c) controlled expenses; and d)
stable loan loss provisions (+3% YoY). For banks within our coverage, Targeted
Repayment Assistance (TRA) loans accounted for about 13% of total loans, down
slightly from 14% beginning of this year.
Challenges and bright spots. The key challenges for banks this year would be in (i)
managing credit costs amid an extended MCO and (ii) managing non-interest
income (NOII) amid potentially higher bond yields, which could give rise to marked-
to-market investment losses. On the bright side, net interest margins have
expanded alongside the repricing of deposits, and operating costs continue to be
well controlled. Moreover, capital levels are more than comfortable for most banks
and there is room for dividend payout ratios to surprise positively, should the
economy gather momentum in 2H21.
23% YoY core net profit growth in 2021. We forecast a cumulative 2021 operating
profit growth of 3.9% YoY, led predominantly by NIM expansion (+9bps) and stable
domestic loan growth of 3.8%, offset by lower NOII. Our 2021 aggregate core net
profit growth of 23% YoY is driven by operating profit expansion and lower but still
elevated credit costs (64bps, vs 81bps in 2020). We project core operating
profit/net profit growth of 2.5%/12.8% YoY for 2022. We estimate a 2021 ROE of
9.0%, improving to 9.7% in 2022.
Sector top BUYs. We have BUYs on CIMB, HLBK, RHB, BIMB and AMMB. CIMB has
seen a strong 1Q thus far and could continue to surprise positively if treasury
income remains significant and credit cost stays low. HL Bank’s fundamentals
remain solid and offers low risk of any unexpected spike in credit costs. RHB’s
dividend payout in FY20 of 35% (50% in FY19) was conservative and could potentially
be better than expected, especially as its capital ratios are very comfortable.
BIMB’s corporate restructuring is pending completion and should assist to unlock
latent value in Bank Islam, we believe. The worst is behind AMMB, in our view, and
valuations are decent at current levels.
Banking sector – Peer valuation summary
Stock Rec Mkt Cap Shr Px TP PER (x) PER (x) PBV (x) PBV (x) ROE (%) ROE (%) Yield (%) Yield (%)
(MYR m) (MYR) (MYR) CY20A CY21E CY20A CY21E CY20A CY21E CY20A CY21E
Public Bank Hold 79,778 4.11 4.65 15.2 13.4 1.7 1.6 10.7% 11.9% 3.2% 3.9%
CIMB Buy 46,165 4.61 4.90 29.2 11.3 0.8 0.8 2.1% 7.8% 1.1% 3.5%
Hong Leong Bank Buy 40,580 18.72 20.90 11.1 13.5 1.1 1.4 9.5% 10.2% 2.6% 2.2%
RHB Bank Buy 21,654 5.40 6.30 10.0 9.4 0.8 0.8 7.7% 9.0% 3.2% 4.2%
Hong Leong Financial Hold 20,426 17.80 19.80 7.8 9.2 0.7 0.9 9.3% 9.8% 2.9% 3.1%
AMMB Holdings Buy 9,777 2.95 3.50 6.7 8.7 0.5 0.6 nm nm 4.4% 0.0%
BIMB Holdings Buy 8,054 3.88 4.75 9.3 8.7 1.2 1.0 11.6% 11.6% 3.0% 3.4%
Alliance Bank Malaysia Hold 3,731 2.41 2.90 6.9 11.4 0.5 0.7 nm 5.9% 3.2% 2.2%
Simple Average 12.0 10.7 0.9 1.0 8.5% 9.5% 2.9% 2.8%
Bursa Malaysia Buy 6,416 7.93 10.75 17.8 17.0 7.5 6.9 41.9% 40.4% 6.1% 5.4%
Allianz Malaysia Buy 3,024 13.00 16.75 6.5 6.7 1.3 1.1 15.7% 12.0% 3.9% 4.5%
RCE Capital Buy 1,097 2.86 3.05 4.7 7.4 0.8 1.2 16.4% 16.1% 7.4% 5.0%
Simple Average 9.6 10.4 3.2 3.1 24.7% 22.8% 5.8% 4.9%
Source: Maybank KE, FactSet (as of 30 June)
Analyst: Desmond Ch’ng
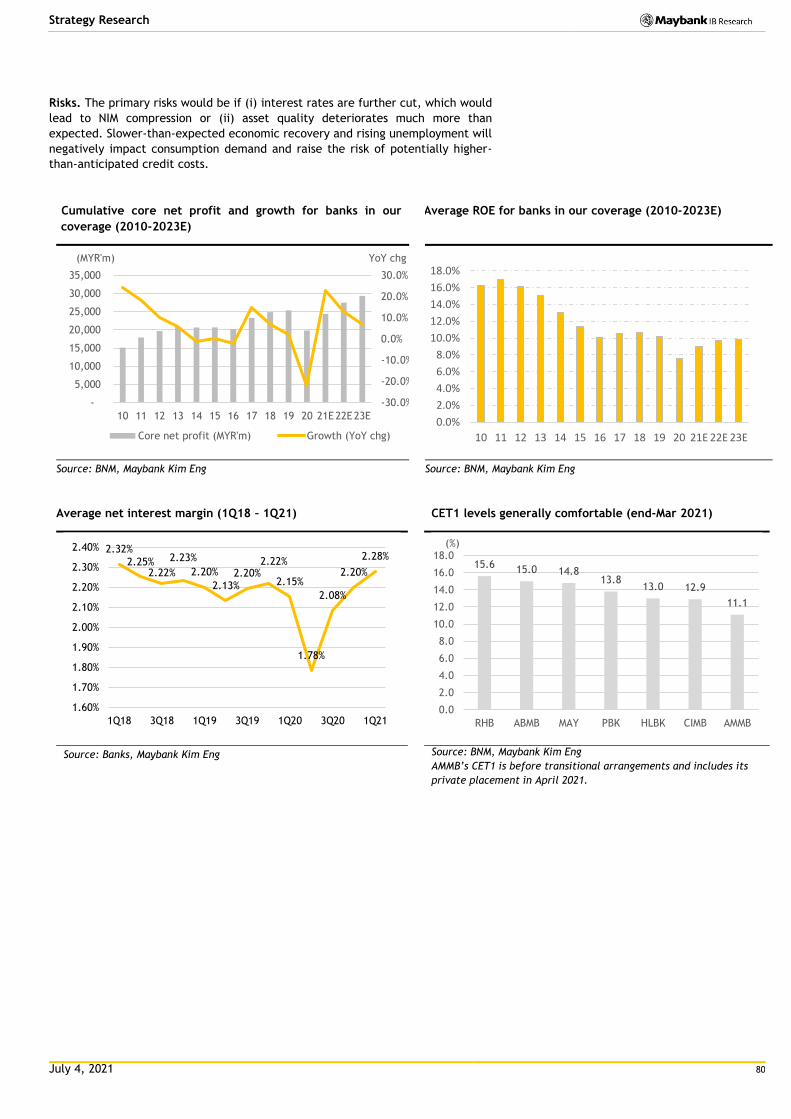
July 4, 2021 80
Strategy Research
Risks. The primary risks would be if (i) interest rates are further cut, which would
lead to NIM compression or (ii) asset quality deteriorates much more than
expected. Slower-than-expected economic recovery and rising unemployment will
negatively impact consumption demand and raise the risk of potentially higher-
than-anticipated credit costs.
Cumulative core net profit and growth for banks in our
coverage (2010-2023E)
Average ROE for banks in our coverage (2010-2023E)
Source: BNM, Maybank Kim Eng Source: BNM, Maybank Kim Eng
Average net interest margin (1Q18 – 1Q21) CET1 levels generally comfortable (end-Mar 2021)
Source: Banks, Maybank Kim Eng Source: BNM, Maybank Kim Eng
AMMB’s CET1 is before transitional arrangements and includes its
private placement in April 2021.
-30.0%
-20.0%
-10.0%
0.0%
10.0%
20.0%
30.0%
-
5,000
10,000
15,000
20,000
25,000
30,000
35,000
10 11 12 13 14 15 16 17 18 19 20 21E22E23E
YoY chg(MYR'm)
Core net profit (MYR'm) Growth (YoY chg)
0.0%
2.0%
4.0%
6.0%
8.0%
10.0%
12.0%
14.0%
16.0%
18.0%
10 11 12 13 14 15 16 17 18 19 20 21E 22E 23E
2.32%
2.25%2.22%
2.23%
2.20%
2.13%2.20%
2.22%
2.15%
1.78%
2.08%
2.20%
2.28%
1.60%
1.70%
1.80%
1.90%
2.00%
2.10%
2.20%
2.30%
2.40%
1Q18 3Q18 1Q19 3Q19 1Q20 3Q20 1Q21
15.615.0 14.8
13.813.0 12.9
11.1
0.0
2.0
4.0
6.0
8.0
10.0
12.0
14.0
16.0
18.0
RHB ABMB MAY PBK HLBK CIMB AMMB
(%)

July 4, 2021 81
Strategy Research
CONSTRUCTION / INFRA: Going gets tough
NEUTRAL (from POSITIVE)
New public infrastructure spending has been slow YTD due to pandemic
management and we expect this to persist into most of 2H21.
We anticipate two major trends: (i) PFI as the financing mode for new major
infrastructure projects; (ii) restructuring of highway concessions – both to
alleviate the government’s fiscal burden.
Amid a challenging landscape, we prefer stocks with strong balance sheet
and delivery track record; keeping our BUY on IJM, GAM and LTK.
1H21: Disrupted again! Construction activities (except for critical works) halted
again from 1 Jun under Malaysia’s FMCO. This came just one week after a 60%
workforce capacity directive was enforced from 25 May under MCO 3.0. In 1Q21,
construction activities of PLCs under our research coverage had normalised closer
to their pre-MCO levels, building on from 3Q/4Q20, after a disruption in 2Q20.
Elsewhere, toll traffic at Gamuda and IJM’s urban highways was impacted again
during MCO 2.0 (from 13 Jan) and MCO 3.0 (from 7 May).
Expect weak 2Q/3Q earnings. With a FMCO being in full-force for a month plus
(from 1 Jun), and an 80% workforce capacity cap under FMCO Phase 2 (anticipated
in Jul/Aug), we expect core earnings delivery to be weak in 2Q/ 3Q21, with 2Q21
to potentially revisit 2Q20 levels. Earnings in 4Q21 will depend on how well the
pandemic is managed and the vaccination pace. Traffic at toll highways may not
recover as fast with the work-from-home directive likely to be enforced throughout
most of 3Q21, and social and education sectors likely to re-open only in 4Q21.
Traffic at Gamuda’s highways are down again to between 20-50% of their pre-MCO
levels during the current FMCO Phase 1 (since 1 Jun).
Slow public infra spend. Government net development spend in 1Q21 was down
24% QoQ to MYR15.3b, at 22% of the MYR68.2b allocated under Budget 2021. View
from the ground is that new public spending for infrastructure has been slow YTD.
We expect this situation to persist into most of 2H21 as focus will remain on
pandemic management, and in mitigating livelihood impact from the FMCO, with
full opening of economic and social sectors anticipated only from November.
Two major trends. Resuming fiscal consolidation will be of priority post the
pandemic. Our Economics Team forecasts 2021 fiscal deficit to widen to -6.8% of
GDP (2020: -6.2%), factoring in the additional direct fiscal injection from stimulus
package announced YTD and downward revision to GDP growth forecast. Against
such backdrop, we see new major infra projects to be taken on via the PFI or
deferred payment financing model. Elsewhere, the postponement of toll rate hike
involving 20 highways (+2 bridges) this year, requiring MYR2.1b in government
compensation, is a yearly recurring opex. Gamuda’s planned MYR5.2b highway
trust, offering no toll hikes and cash outflow (and guarantee) by the government,
merits consideration. An alternative is perhaps an ‘infrastructure REIT’ structure.
Construction/Infra sector – Peer valuation summary
Stock Rec Mkt Cap Shr Px TP PER (x) PER (x) PBV (x) PBV (x) ROE (%) ROE (%) Yield (%) Yield (%)
(MYR m) (MYR) (MYR) CY20A CY21E CY20A CY21E CY20A CY21E CY20A CY21E
Gamuda Buy 7,753 3.13 4.05 17.0 18.1 1.0 0.9 4.4% 4.9% 1.7% 0.0%
IJM Corp Buy 6,518 1.79 2.18 11.9 18.3 0.6 0.6 2.6% 4.3% 1.9% 3.6%
Sunway Const'n Hold 2,146 1.66 1.72 33.3 19.3 3.8 3.2 11.4% 16.5% 2.1% 3.6%
Lingkaran Trans Buy 1,972 3.70 4.90 7.5 10.0 1.8 1.7 24.4% 17.4% 6.8% 5.2%
Cahya Mata S. Hold 1,225 1.14 1.73 22.7 8.4 0.8 0.4 nm 6.0% 0.9% 3.5%
Simple Average 18.5 14.8 1.6 1.4 10.7% 9.8% 2.7% 3.2%
Source: Maybank KE, FactSet (as of 30 June)
Analyst: Wong Chew Hann, CA
Abbreviation
PFI = Private Finance Initiative
FMCO = Full Movement Control Order
12MP = 12th Malaysia Plan (2021-25)
KVMRT3 = Klang Valley Mass Rapid Transit Phs 3
HSR = High Speed Rail
PSI = Penang South Island
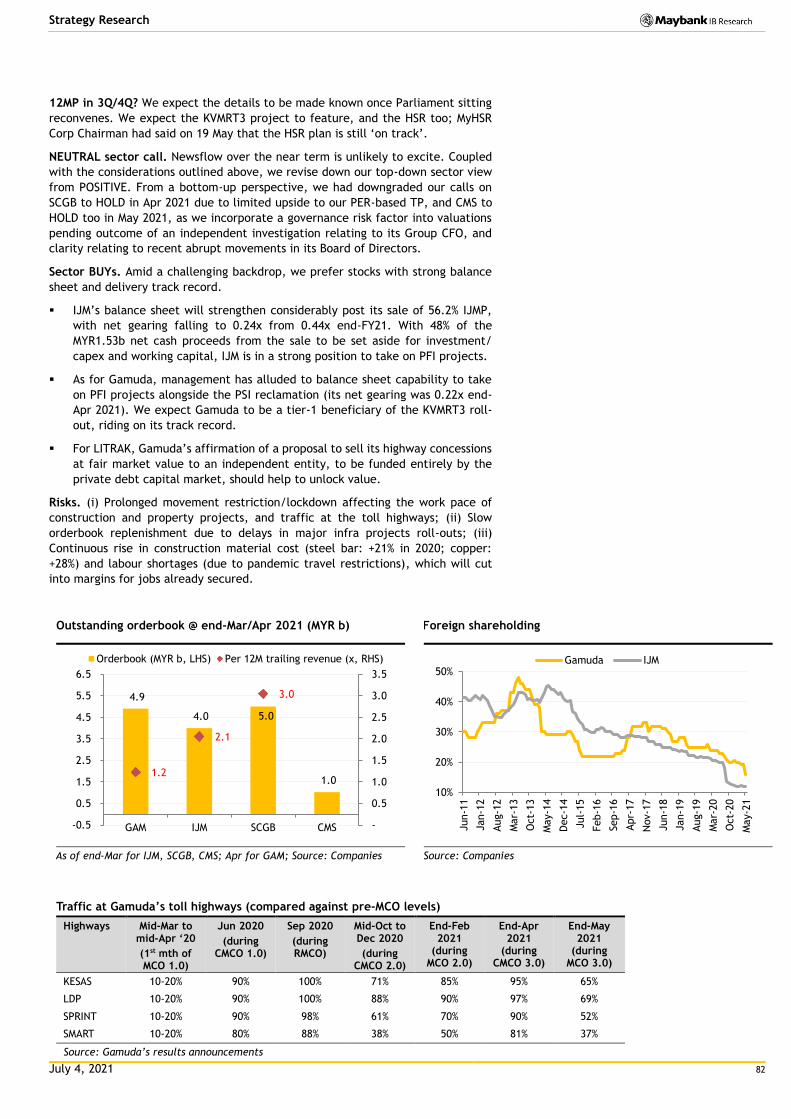
July 4, 2021 82
Strategy Research
12MP in 3Q/4Q? We expect the details to be made known once Parliament sitting
reconvenes. We expect the KVMRT3 project to feature, and the HSR too; MyHSR
Corp Chairman had said on 19 May that the HSR plan is still ‘on track’.
NEUTRAL sector call. Newsflow over the near term is unlikely to excite. Coupled
with the considerations outlined above, we revise down our top-down sector view
from POSITIVE. From a bottom-up perspective, we had downgraded our calls on
SCGB to HOLD in Apr 2021 due to limited upside to our PER-based TP, and CMS to
HOLD too in May 2021, as we incorporate a governance risk factor into valuations
pending outcome of an independent investigation relating to its Group CFO, and
clarity relating to recent abrupt movements in its Board of Directors.
Sector BUYs. Amid a challenging backdrop, we prefer stocks with strong balance
sheet and delivery track record.
IJM’s balance sheet will strengthen considerably post its sale of 56.2% IJMP,
with net gearing falling to 0.24x from 0.44x end-FY21. With 48% of the
MYR1.53b net cash proceeds from the sale to be set aside for investment/
capex and working capital, IJM is in a strong position to take on PFI projects.
As for Gamuda, management has alluded to balance sheet capability to take
on PFI projects alongside the PSI reclamation (its net gearing was 0.22x end-
Apr 2021). We expect Gamuda to be a tier-1 beneficiary of the KVMRT3 roll-
out, riding on its track record.
For LITRAK, Gamuda’s affirmation of a proposal to sell its highway concessions
at fair market value to an independent entity, to be funded entirely by the
private debt capital market, should help to unlock value.
Risks. (i) Prolonged movement restriction/lockdown affecting the work pace of
construction and property projects, and traffic at the toll highways; (ii) Slow
orderbook replenishment due to delays in major infra projects roll-outs; (iii)
Continuous rise in construction material cost (steel bar: +21% in 2020; copper:
+28%) and labour shortages (due to pandemic travel restrictions), which will cut
into margins for jobs already secured.
Outstanding orderbook @ end-Mar/Apr 2021 (MYR b) Foreign shareholding
As of end-Mar for IJM, SCGB, CMS; Apr for GAM; Source: Companies Source: Companies
Traffic at Gamuda’s toll highways (compared against pre-MCO levels)
Highways Mid-Mar to mid-Apr ‘20
(1st mth of MCO 1.0)
Jun 2020
(during CMCO 1.0)
Sep 2020
(during RMCO)
Mid-Oct to Dec 2020
(during CMCO 2.0)
End-Feb 2021
(during MCO 2.0)
End-Apr 2021
(during CMCO 3.0)
End-May 2021
(during MCO 3.0)
KESAS 10-20% 90% 100% 71% 85% 95% 65%
LDP 10-20% 90% 100% 88% 90% 97% 69%
SPRINT 10-20% 90% 98% 61% 70% 90% 52%
SMART 10-20% 80% 88% 38% 50% 81% 37%
Source: Gamuda’s results announcements
4.9
4.0 5.0
1.0 1.2
2.1
3.0
-
0.5
1.0
1.5
2.0
2.5
3.0
3.5
-0.5
0.5
1.5
2.5
3.5
4.5
5.5
6.5
GAM IJM SCGB CMS
Orderbook (MYR b, LHS) Per 12M trailing revenue (x, RHS)
10%
20%
30%
40%
50%
Jun-1
1
Jan-1
2
Aug-1
2
Mar-
13
Oct-
13
May-1
4
Dec-1
4
Jul-
15
Feb-1
6
Sep-1
6
Apr-
17
Nov-1
7
Jun-1
8
Jan-1
9
Aug-1
9
Mar-
20
Oct-
20
May-2
1
Gamuda IJM
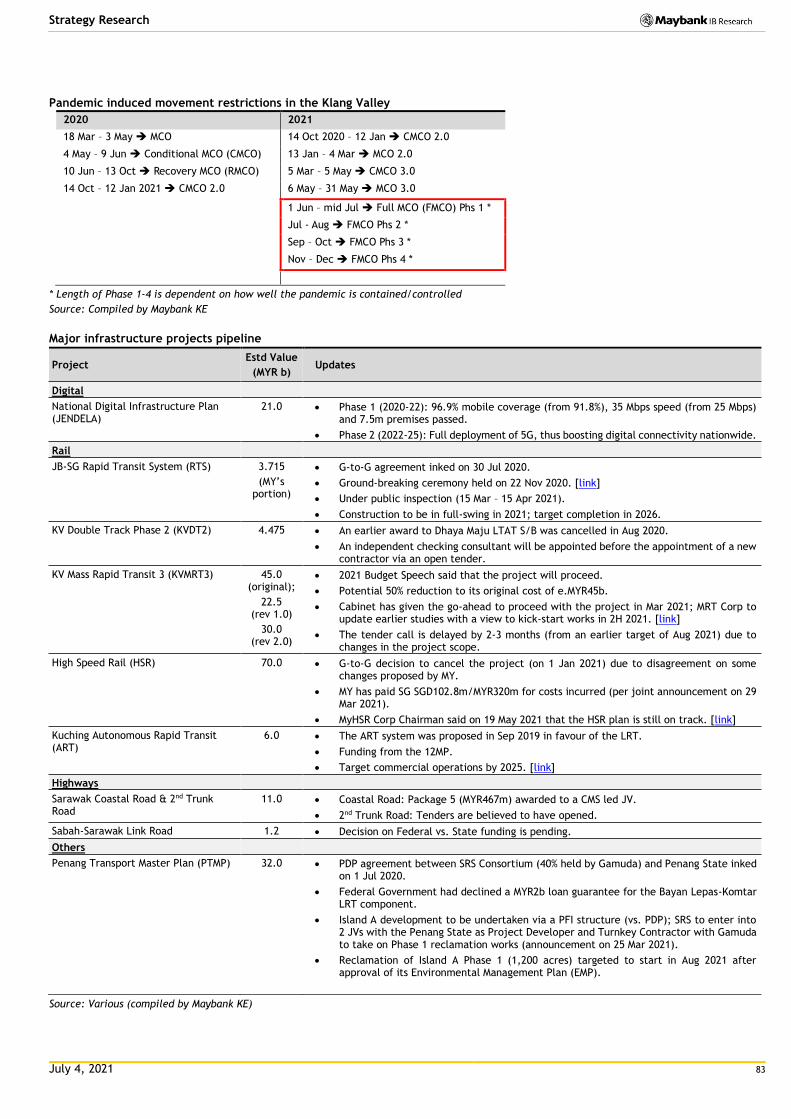
July 4, 2021 83
Strategy Research
Pandemic induced movement restrictions in the Klang Valley
2020 2021
18 Mar – 3 May MCO 14 Oct 2020 – 12 Jan CMCO 2.0
4 May – 9 Jun Conditional MCO (CMCO) 13 Jan – 4 Mar MCO 2.0
10 Jun – 13 Oct Recovery MCO (RMCO) 5 Mar – 5 May CMCO 3.0
14 Oct – 12 Jan 2021 CMCO 2.0 6 May – 31 May MCO 3.0
1 Jun – mid Jul Full MCO (FMCO) Phs 1 *
Jul - Aug FMCO Phs 2 *
Sep – Oct FMCO Phs 3 *
Nov – Dec FMCO Phs 4 *
* Length of Phase 1-4 is dependent on how well the pandemic is contained/controlled
Source: Compiled by Maybank KE
Major infrastructure projects pipeline
Project Estd Value
(MYR b) Updates
Digital
National Digital Infrastructure Plan (JENDELA)
21.0 Phase 1 (2020-22): 96.9% mobile coverage (from 91.8%), 35 Mbps speed (from 25 Mbps) and 7.5m premises passed.
Phase 2 (2022-25): Full deployment of 5G, thus boosting digital connectivity nationwide.
Rail
JB-SG Rapid Transit System (RTS) 3.715
(MY’s portion)
G-to-G agreement inked on 30 Jul 2020.
Ground-breaking ceremony held on 22 Nov 2020. [link]
Under public inspection (15 Mar – 15 Apr 2021).
Construction to be in full-swing in 2021; target completion in 2026.
KV Double Track Phase 2 (KVDT2) 4.475 An earlier award to Dhaya Maju LTAT S/B was cancelled in Aug 2020.
An independent checking consultant will be appointed before the appointment of a new contractor via an open tender.
KV Mass Rapid Transit 3 (KVMRT3) 45.0 (original);
22.5 (rev 1.0)
30.0 (rev 2.0)
2021 Budget Speech said that the project will proceed.
Potential 50% reduction to its original cost of e.MYR45b.
Cabinet has given the go-ahead to proceed with the project in Mar 2021; MRT Corp to update earlier studies with a view to kick-start works in 2H 2021. [link]
The tender call is delayed by 2-3 months (from an earlier target of Aug 2021) due to changes in the project scope.
High Speed Rail (HSR) 70.0 G-to-G decision to cancel the project (on 1 Jan 2021) due to disagreement on some changes proposed by MY.
MY has paid SG SGD102.8m/MYR320m for costs incurred (per joint announcement on 29 Mar 2021).
MyHSR Corp Chairman said on 19 May 2021 that the HSR plan is still on track. [link]
Kuching Autonomous Rapid Transit (ART)
6.0 The ART system was proposed in Sep 2019 in favour of the LRT.
Funding from the 12MP.
Target commercial operations by 2025. [link]
Highways
Sarawak Coastal Road & 2nd Trunk Road
11.0 Coastal Road: Package 5 (MYR467m) awarded to a CMS led JV.
2nd Trunk Road: Tenders are believed to have opened.
Sabah-Sarawak Link Road 1.2 Decision on Federal vs. State funding is pending.
Others
Penang Transport Master Plan (PTMP)
32.0 PDP agreement between SRS Consortium (40% held by Gamuda) and Penang State inked on 1 Jul 2020.
Federal Government had declined a MYR2b loan guarantee for the Bayan Lepas-Komtar LRT component.
Island A development to be undertaken via a PFI structure (vs. PDP); SRS to enter into 2 JVs with the Penang State as Project Developer and Turnkey Contractor with Gamuda to take on Phase 1 reclamation works (announcement on 25 Mar 2021).
Reclamation of Island A Phase 1 (1,200 acres) targeted to start in Aug 2021 after approval of its Environmental Management Plan (EMP).
Source: Various (compiled by Maybank KE)
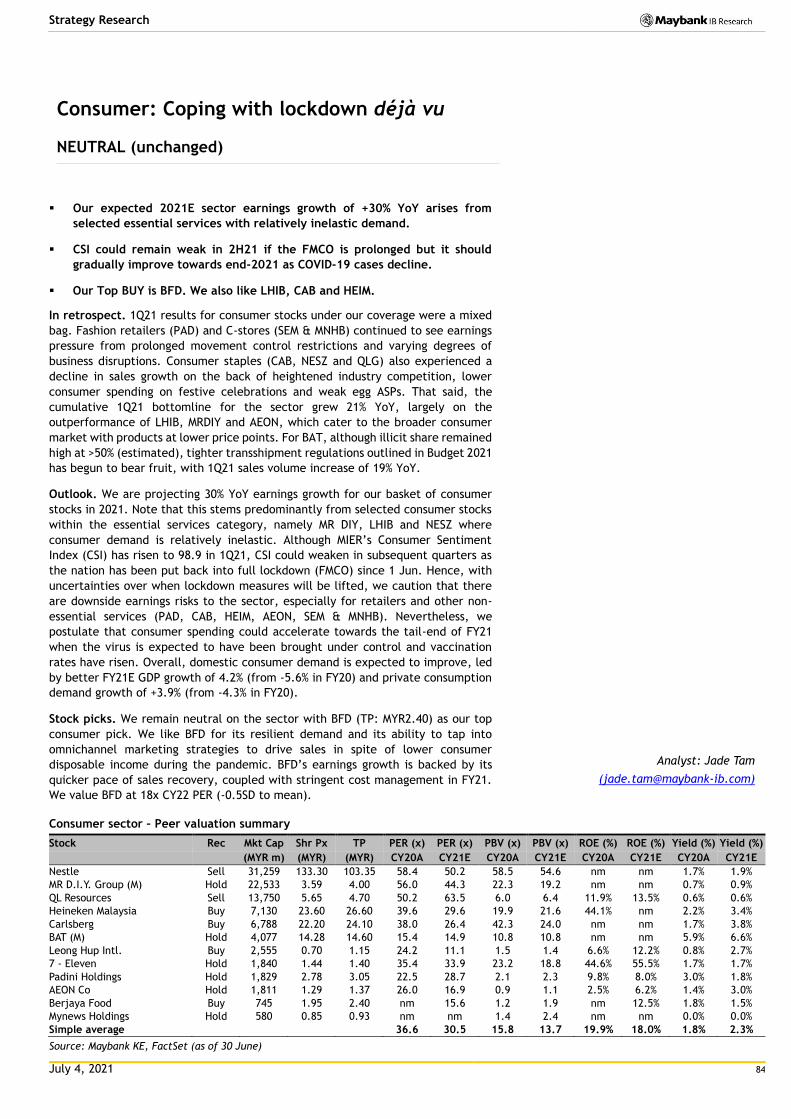
July 4, 2021 84
Strategy Research
Consumer: Coping with lockdown déjà vu
NEUTRAL (unchanged)
Our expected 2021E sector earnings growth of +30% YoY arises from
selected essential services with relatively inelastic demand.
CSI could remain weak in 2H21 if the FMCO is prolonged but it should
gradually improve towards end-2021 as COVID-19 cases decline.
Our Top BUY is BFD. We also like LHIB, CAB and HEIM.
In retrospect. 1Q21 results for consumer stocks under our coverage were a mixed
bag. Fashion retailers (PAD) and C-stores (SEM & MNHB) continued to see earnings
pressure from prolonged movement control restrictions and varying degrees of
business disruptions. Consumer staples (CAB, NESZ and QLG) also experienced a
decline in sales growth on the back of heightened industry competition, lower
consumer spending on festive celebrations and weak egg ASPs. That said, the
cumulative 1Q21 bottomline for the sector grew 21% YoY, largely on the
outperformance of LHIB, MRDIY and AEON, which cater to the broader consumer
market with products at lower price points. For BAT, although illicit share remained
high at >50% (estimated), tighter transshipment regulations outlined in Budget 2021
has begun to bear fruit, with 1Q21 sales volume increase of 19% YoY.
Outlook. We are projecting 30% YoY earnings growth for our basket of consumer
stocks in 2021. Note that this stems predominantly from selected consumer stocks
within the essential services category, namely MR DIY, LHIB and NESZ where
consumer demand is relatively inelastic. Although MIER’s Consumer Sentiment
Index (CSI) has risen to 98.9 in 1Q21, CSI could weaken in subsequent quarters as
the nation has been put back into full lockdown (FMCO) since 1 Jun. Hence, with
uncertainties over when lockdown measures will be lifted, we caution that there
are downside earnings risks to the sector, especially for retailers and other non-
essential services (PAD, CAB, HEIM, AEON, SEM & MNHB). Nevertheless, we
postulate that consumer spending could accelerate towards the tail-end of FY21
when the virus is expected to have been brought under control and vaccination
rates have risen. Overall, domestic consumer demand is expected to improve, led
by better FY21E GDP growth of 4.2% (from -5.6% in FY20) and private consumption
demand growth of +3.9% (from -4.3% in FY20).
Stock picks. We remain neutral on the sector with BFD (TP: MYR2.40) as our top
consumer pick. We like BFD for its resilient demand and its ability to tap into
omnichannel marketing strategies to drive sales in spite of lower consumer
disposable income during the pandemic. BFD’s earnings growth is backed by its
quicker pace of sales recovery, coupled with stringent cost management in FY21.
We value BFD at 18x CY22 PER (-0.5SD to mean).
Consumer sector – Peer valuation summary
Stock Rec Mkt Cap Shr Px TP PER (x) PER (x) PBV (x) PBV (x) ROE (%) ROE (%) Yield (%) Yield (%)
(MYR m) (MYR) (MYR) CY20A CY21E CY20A CY21E CY20A CY21E CY20A CY21E
Nestle Sell 31,259 133.30 103.35 58.4 50.2 58.5 54.6 nm nm 1.7% 1.9%
MR D.I.Y. Group (M) Hold 22,533 3.59 4.00 56.0 44.3 22.3 19.2 nm nm 0.7% 0.9%
QL Resources Sell 13,750 5.65 4.70 50.2 63.5 6.0 6.4 11.9% 13.5% 0.6% 0.6%
Heineken Malaysia Buy 7,130 23.60 26.60 39.6 29.6 19.9 21.6 44.1% nm 2.2% 3.4%
Carlsberg Buy 6,788 22.20 24.10 38.0 26.4 42.3 24.0 nm nm 1.7% 3.8%
BAT (M) Hold 4,077 14.28 14.60 15.4 14.9 10.8 10.8 nm nm 5.9% 6.6%
Leong Hup Intl. Buy 2,555 0.70 1.15 24.2 11.1 1.5 1.4 6.6% 12.2% 0.8% 2.7%
7 - Eleven Hold 1,840 1.44 1.40 35.4 33.9 23.2 18.8 44.6% 55.5% 1.7% 1.7%
Padini Holdings Hold 1,829 2.78 3.05 22.5 28.7 2.1 2.3 9.8% 8.0% 3.0% 1.8%
AEON Co Hold 1,811 1.29 1.37 26.0 16.9 0.9 1.1 2.5% 6.2% 1.4% 3.0%
Berjaya Food Buy 745 1.95 2.40 nm 15.6 1.2 1.9 nm 12.5% 1.8% 1.5%
Mynews Holdings Hold 580 0.85 0.93 nm nm 1.4 2.4 nm nm 0.0% 0.0%
Simple average 36.6 30.5 15.8 13.7 19.9% 18.0% 1.8% 2.3%
Source: Maybank KE, FactSet (as of 30 June)
Analyst: Jade Tam
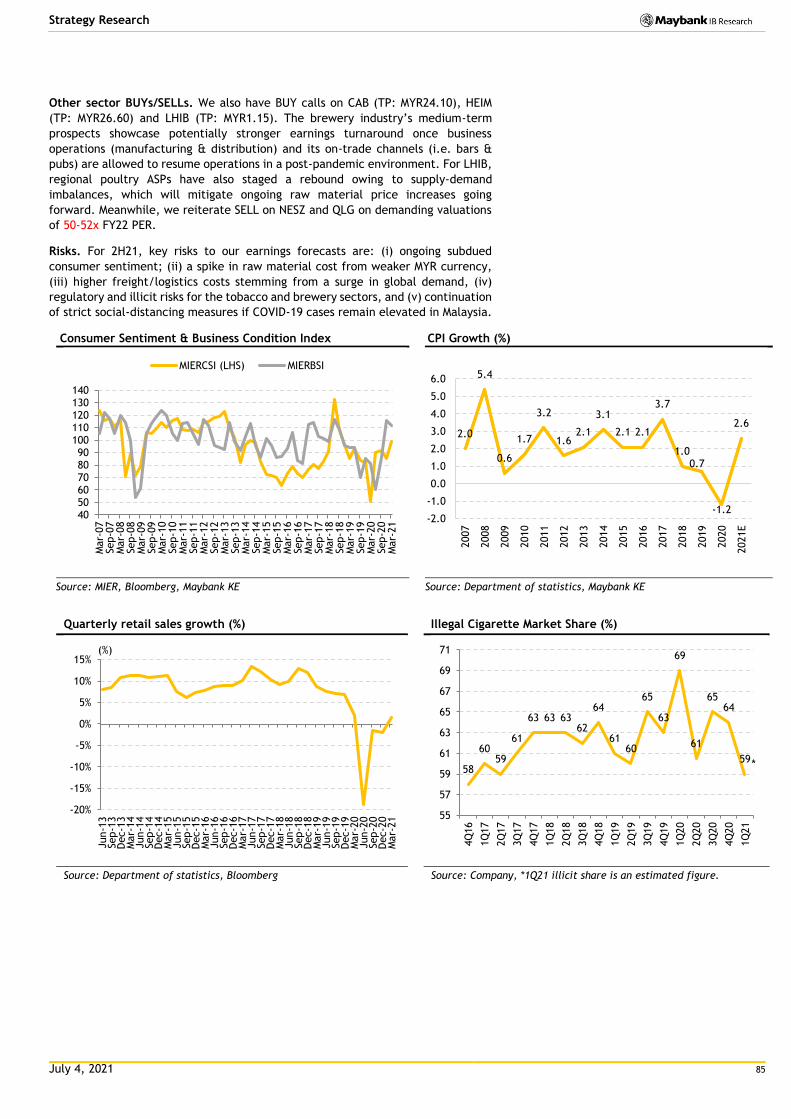
July 4, 2021 85
Strategy Research
Other sector BUYs/SELLs. We also have BUY calls on CAB (TP: MYR24.10), HEIM
(TP: MYR26.60) and LHIB (TP: MYR1.15). The brewery industry’s medium-term
prospects showcase potentially stronger earnings turnaround once business
operations (manufacturing & distribution) and its on-trade channels (i.e. bars &
pubs) are allowed to resume operations in a post-pandemic environment. For LHIB,
regional poultry ASPs have also staged a rebound owing to supply-demand
imbalances, which will mitigate ongoing raw material price increases going
forward. Meanwhile, we reiterate SELL on NESZ and QLG on demanding valuations
of 50-52x FY22 PER.
Risks. For 2H21, key risks to our earnings forecasts are: (i) ongoing subdued
consumer sentiment; (ii) a spike in raw material cost from weaker MYR currency,
(iii) higher freight/logistics costs stemming from a surge in global demand, (iv)
regulatory and illicit risks for the tobacco and brewery sectors, and (v) continuation
of strict social-distancing measures if COVID-19 cases remain elevated in Malaysia.
Consumer Sentiment & Business Condition Index CPI Growth (%)
Source: MIER, Bloomberg, Maybank KE Source: Department of statistics, Maybank KE
Quarterly retail sales growth (%) Illegal Cigarette Market Share (%)
Source: Department of statistics, Bloomberg Source: Company, *1Q21 illicit share is an estimated figure.
405060708090
100110120130140
Mar-
07
Sep-0
7M
ar-
08
Sep-0
8M
ar-
09
Sep-0
9M
ar-
10
Sep-1
0M
ar-
11
Sep-1
1M
ar-
12
Sep-1
2M
ar-
13
Sep-1
3M
ar-
14
Sep-1
4M
ar-
15
Sep-1
5M
ar-
16
Sep-1
6M
ar-
17
Sep-1
7M
ar-
18
Sep-1
8M
ar-
19
Sep-1
9M
ar-
20
Sep-2
0M
ar-
21
MIERCSI (LHS) MIERBSI
2.0
5.4
0.6
1.7
3.2
1.62.1
3.1
2.1 2.1
3.7
1.00.7
-1.2
2.6
-2.0
-1.0
0.0
1.0
2.0
3.0
4.0
5.0
6.0
2007
2008
2009
2010
2011
2012
2013
2014
2015
2016
2017
2018
2019
2020
2021E
-20%
-15%
-10%
-5%
0%
5%
10%
15%
Jun-1
3Sep-1
3D
ec-1
3M
ar-
14
Jun-1
4Sep-1
4D
ec-1
4M
ar-
15
Jun-1
5Sep-1
5D
ec-1
5M
ar-
16
Jun-1
6Sep-1
6D
ec-1
6M
ar-
17
Jun-1
7Sep-1
7D
ec-1
7M
ar-
18
Jun-1
8Sep-1
8D
ec-1
8M
ar-
19
Jun-1
9Sep-1
9D
ec-1
9M
ar-
20
Jun-2
0Sep-2
0D
ec-2
0M
ar-
21
(%)
58
6059
61
63 63 6362
64
6160
65
63
69
61
6564
59
55
57
59
61
63
65
67
69
71
4Q
16
1Q
17
2Q
17
3Q
17
4Q
17
1Q
18
2Q
18
3Q
18
4Q
18
1Q
19
2Q
19
3Q
19
4Q
19
1Q
20
2Q
20
3Q
20
4Q
20
1Q
21
*
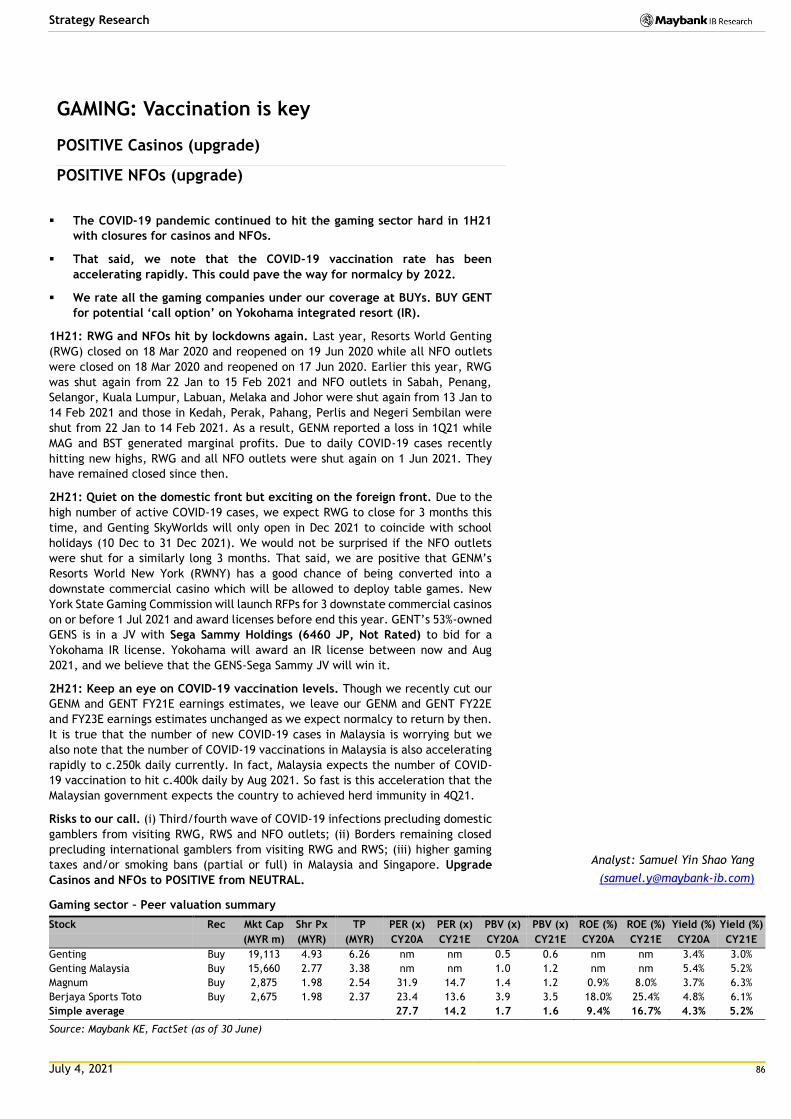
July 4, 2021 86
Strategy Research
GAMING: Vaccination is key
POSITIVE Casinos (upgrade)
POSITIVE NFOs (upgrade)
The COVID-19 pandemic continued to hit the gaming sector hard in 1H21
with closures for casinos and NFOs.
That said, we note that the COVID-19 vaccination rate has been
accelerating rapidly. This could pave the way for normalcy by 2022.
We rate all the gaming companies under our coverage at BUYs. BUY GENT
for potential ‘call option’ on Yokohama integrated resort (IR).
1H21: RWG and NFOs hit by lockdowns again. Last year, Resorts World Genting
(RWG) closed on 18 Mar 2020 and reopened on 19 Jun 2020 while all NFO outlets
were closed on 18 Mar 2020 and reopened on 17 Jun 2020. Earlier this year, RWG
was shut again from 22 Jan to 15 Feb 2021 and NFO outlets in Sabah, Penang,
Selangor, Kuala Lumpur, Labuan, Melaka and Johor were shut again from 13 Jan to
14 Feb 2021 and those in Kedah, Perak, Pahang, Perlis and Negeri Sembilan were
shut from 22 Jan to 14 Feb 2021. As a result, GENM reported a loss in 1Q21 while
MAG and BST generated marginal profits. Due to daily COVID-19 cases recently
hitting new highs, RWG and all NFO outlets were shut again on 1 Jun 2021. They
have remained closed since then.
2H21: Quiet on the domestic front but exciting on the foreign front. Due to the
high number of active COVID-19 cases, we expect RWG to close for 3 months this
time, and Genting SkyWorlds will only open in Dec 2021 to coincide with school
holidays (10 Dec to 31 Dec 2021). We would not be surprised if the NFO outlets
were shut for a similarly long 3 months. That said, we are positive that GENM’s
Resorts World New York (RWNY) has a good chance of being converted into a
downstate commercial casino which will be allowed to deploy table games. New
York State Gaming Commission will launch RFPs for 3 downstate commercial casinos
on or before 1 Jul 2021 and award licenses before end this year. GENT’s 53%-owned
GENS is in a JV with Sega Sammy Holdings (6460 JP, Not Rated) to bid for a
Yokohama IR license. Yokohama will award an IR license between now and Aug
2021, and we believe that the GENS-Sega Sammy JV will win it.
2H21: Keep an eye on COVID-19 vaccination levels. Though we recently cut our
GENM and GENT FY21E earnings estimates, we leave our GENM and GENT FY22E
and FY23E earnings estimates unchanged as we expect normalcy to return by then.
It is true that the number of new COVID-19 cases in Malaysia is worrying but we
also note that the number of COVID-19 vaccinations in Malaysia is also accelerating
rapidly to c.250k daily currently. In fact, Malaysia expects the number of COVID-
19 vaccination to hit c.400k daily by Aug 2021. So fast is this acceleration that the
Malaysian government expects the country to achieved herd immunity in 4Q21.
Risks to our call. (i) Third/fourth wave of COVID-19 infections precluding domestic
gamblers from visiting RWG, RWS and NFO outlets; (ii) Borders remaining closed
precluding international gamblers from visiting RWG and RWS; (iii) higher gaming
taxes and/or smoking bans (partial or full) in Malaysia and Singapore. Upgrade
Casinos and NFOs to POSITIVE from NEUTRAL.
Gaming sector – Peer valuation summary
Stock Rec Mkt Cap Shr Px TP PER (x) PER (x) PBV (x) PBV (x) ROE (%) ROE (%) Yield (%) Yield (%)
(MYR m) (MYR) (MYR) CY20A CY21E CY20A CY21E CY20A CY21E CY20A CY21E
Genting Buy 19,113 4.93 6.26 nm nm 0.5 0.6 nm nm 3.4% 3.0%
Genting Malaysia Buy 15,660 2.77 3.38 nm nm 1.0 1.2 nm nm 5.4% 5.2%
Magnum Buy 2,875 1.98 2.54 31.9 14.7 1.4 1.2 0.9% 8.0% 3.7% 6.3%
Berjaya Sports Toto Buy 2,675 1.98 2.37 23.4 13.6 3.9 3.5 18.0% 25.4% 4.8% 6.1%
Simple average 27.7 14.2 1.7 1.6 9.4% 16.7% 4.3% 5.2%
Source: Maybank KE, FactSet (as of 30 June)
Analyst: Samuel Yin Shao Yang
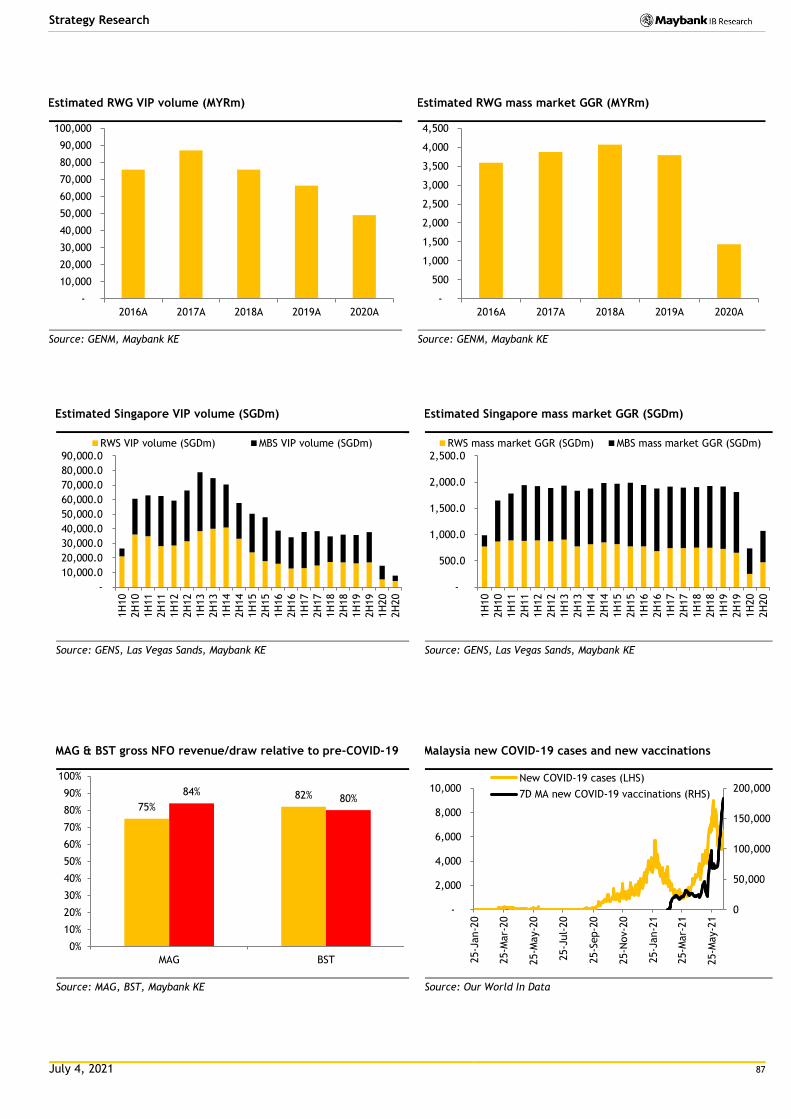
July 4, 2021 87
Strategy Research
Estimated RWG VIP volume (MYRm) Estimated RWG mass market GGR (MYRm)
Source: GENM, Maybank KE Source: GENM, Maybank KE
Estimated Singapore VIP volume (SGDm) Estimated Singapore mass market GGR (SGDm)
Source: GENS, Las Vegas Sands, Maybank KE Source: GENS, Las Vegas Sands, Maybank KE
MAG & BST gross NFO revenue/draw relative to pre-COVID-19 Malaysia new COVID-19 cases and new vaccinations
Source: MAG, BST, Maybank KE Source: Our World In Data
-
10,000
20,000
30,000
40,000
50,000
60,000
70,000
80,000
90,000
100,000
2016A 2017A 2018A 2019A 2020A
-
500
1,000
1,500
2,000
2,500
3,000
3,500
4,000
4,500
2016A 2017A 2018A 2019A 2020A
-
10,000.0
20,000.0
30,000.0
40,000.0
50,000.0
60,000.0
70,000.0
80,000.0
90,000.0
1H
10
2H
10
1H
11
2H
11
1H
12
2H
12
1H
13
2H
13
1H
14
2H
14
1H
15
2H
15
1H
16
2H
16
1H
17
2H
17
1H
18
2H
18
1H
19
2H
19
1H
20
2H
20
RWS VIP volume (SGDm) MBS VIP volume (SGDm)
-
500.0
1,000.0
1,500.0
2,000.0
2,500.0
1H
10
2H
10
1H
11
2H
11
1H
12
2H
12
1H
13
2H
13
1H
14
2H
14
1H
15
2H
15
1H
16
2H
16
1H
17
2H
17
1H
18
2H
18
1H
19
2H
19
1H
20
2H
20
RWS mass market GGR (SGDm) MBS mass market GGR (SGDm)
75%82%84%
80%
0%
10%
20%
30%
40%
50%
60%
70%
80%
90%
100%
MAG BST
0
50,000
100,000
150,000
200,000
-
2,000
4,000
6,000
8,000
10,000
25-J
an-2
0
25-M
ar-
20
25-M
ay-2
0
25-J
ul-
20
25-S
ep-2
0
25-N
ov-2
0
25-J
an-2
1
25-M
ar-
21
25-M
ay-2
1
New COVID-19 cases (LHS)
7D MA new COVID-19 vaccinations (RHS)
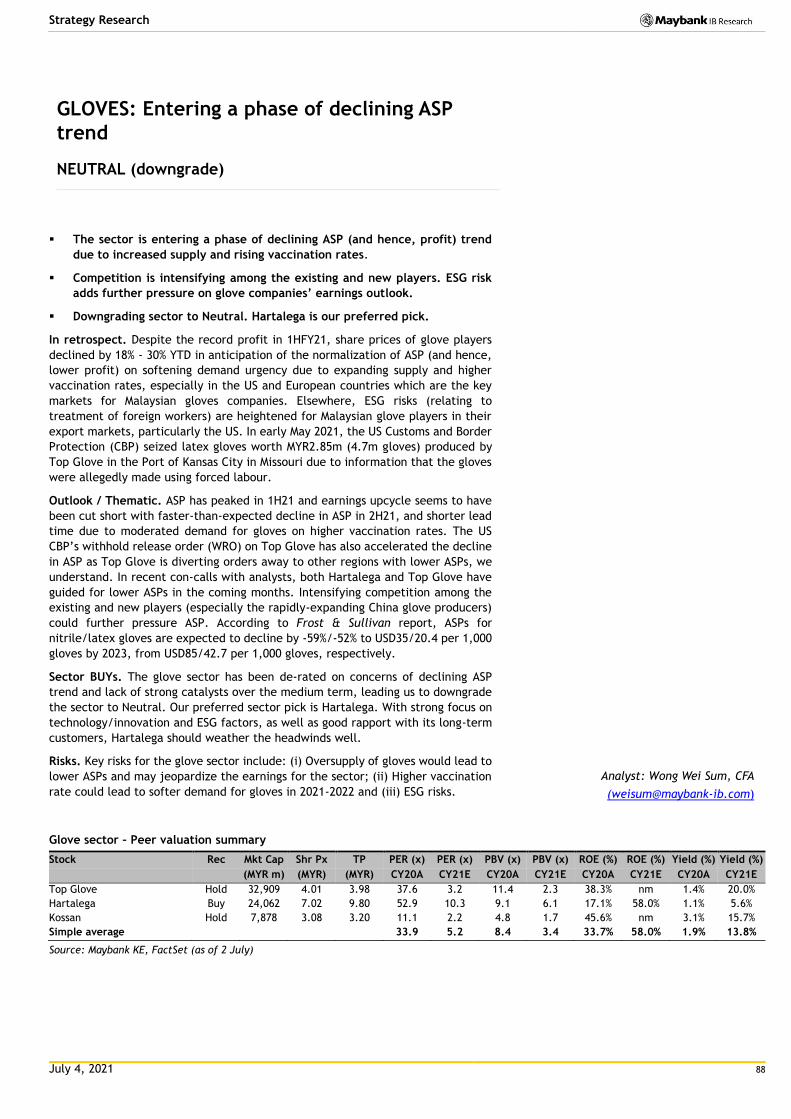
July 4, 2021 88
Strategy Research
GLOVES: Entering a phase of declining ASP
trend
NEUTRAL (downgrade)
The sector is entering a phase of declining ASP (and hence, profit) trend
due to increased supply and rising vaccination rates.
Competition is intensifying among the existing and new players. ESG risk
adds further pressure on glove companies’ earnings outlook.
Downgrading sector to Neutral. Hartalega is our preferred pick.
In retrospect. Despite the record profit in 1HFY21, share prices of glove players
declined by 18% - 30% YTD in anticipation of the normalization of ASP (and hence,
lower profit) on softening demand urgency due to expanding supply and higher
vaccination rates, especially in the US and European countries which are the key
markets for Malaysian gloves companies. Elsewhere, ESG risks (relating to
treatment of foreign workers) are heightened for Malaysian glove players in their
export markets, particularly the US. In early May 2021, the US Customs and Border
Protection (CBP) seized latex gloves worth MYR2.85m (4.7m gloves) produced by
Top Glove in the Port of Kansas City in Missouri due to information that the gloves
were allegedly made using forced labour.
Outlook / Thematic. ASP has peaked in 1H21 and earnings upcycle seems to have
been cut short with faster-than-expected decline in ASP in 2H21, and shorter lead
time due to moderated demand for gloves on higher vaccination rates. The US
CBP’s withhold release order (WRO) on Top Glove has also accelerated the decline
in ASP as Top Glove is diverting orders away to other regions with lower ASPs, we
understand. In recent con-calls with analysts, both Hartalega and Top Glove have
guided for lower ASPs in the coming months. Intensifying competition among the
existing and new players (especially the rapidly-expanding China glove producers)
could further pressure ASP. According to Frost & Sullivan report, ASPs for
nitrile/latex gloves are expected to decline by -59%/-52% to USD35/20.4 per 1,000
gloves by 2023, from USD85/42.7 per 1,000 gloves, respectively.
Sector BUYs. The glove sector has been de-rated on concerns of declining ASP
trend and lack of strong catalysts over the medium term, leading us to downgrade
the sector to Neutral. Our preferred sector pick is Hartalega. With strong focus on
technology/innovation and ESG factors, as well as good rapport with its long-term
customers, Hartalega should weather the headwinds well.
Risks. Key risks for the glove sector include: (i) Oversupply of gloves would lead to
lower ASPs and may jeopardize the earnings for the sector; (ii) Higher vaccination
rate could lead to softer demand for gloves in 2021-2022 and (iii) ESG risks.
Glove sector – Peer valuation summary
Stock Rec Mkt Cap Shr Px TP PER (x) PER (x) PBV (x) PBV (x) ROE (%) ROE (%) Yield (%) Yield (%)
(MYR m) (MYR) (MYR) CY20A CY21E CY20A CY21E CY20A CY21E CY20A CY21E
Top Glove Hold 32,909 4.01 3.98 37.6 3.2 11.4 2.3 38.3% nm 1.4% 20.0%
Hartalega Buy 24,062 7.02 9.80 52.9 10.3 9.1 6.1 17.1% 58.0% 1.1% 5.6%
Kossan Hold 7,878 3.08 3.20 11.1 2.2 4.8 1.7 45.6% nm 3.1% 15.7%
Simple average 33.9 5.2 8.4 3.4 33.7% 58.0% 1.9% 13.8%
Source: Maybank KE, FactSet (as of 2 July)
Analyst: Wong Wei Sum, CFA
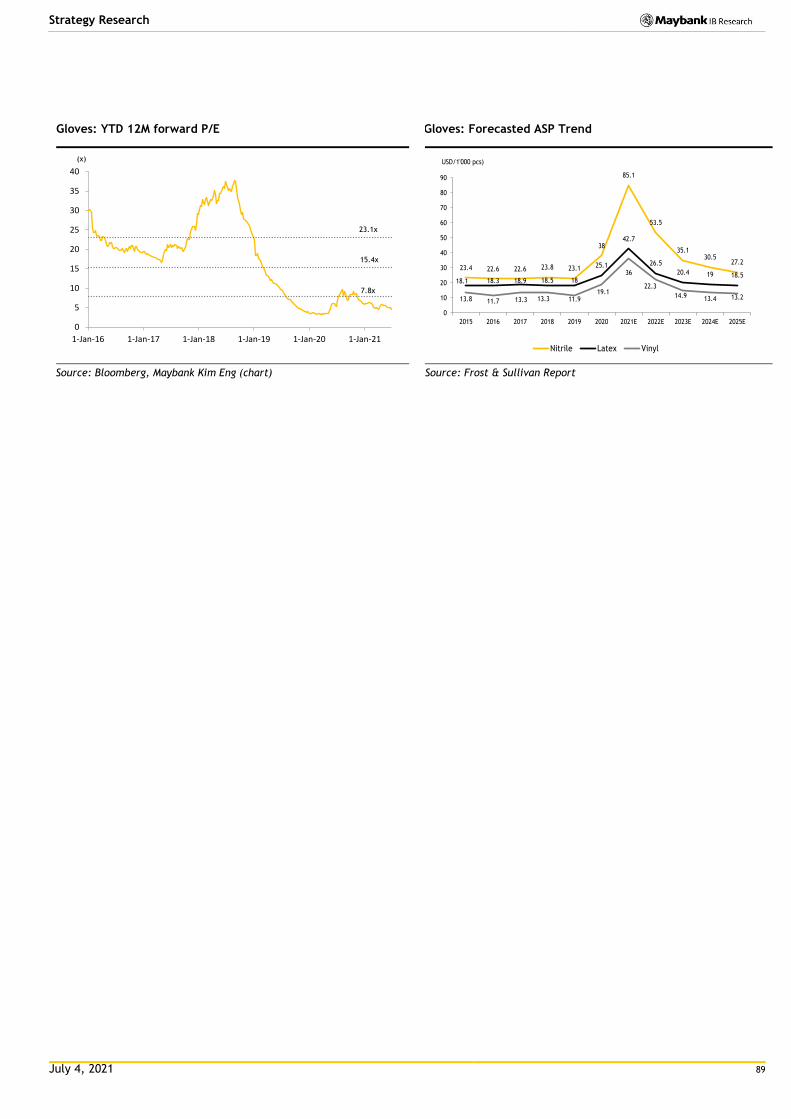
July 4, 2021 89
Strategy Research
Gloves: YTD 12M forward P/E Gloves: Forecasted ASP Trend
Source: Bloomberg, Maybank Kim Eng (chart) Source: Frost & Sullivan Report
0
5
10
15
20
25
30
35
40
1-Jan-16 1-Jan-17 1-Jan-18 1-Jan-19 1-Jan-20 1-Jan-21
(x)
23.1x
15.4x
7.8x
23.4 22.6 22.6 23.8 23.1
38
85.1
53.5
35.130.5
27.2
18.1 18.3 18.9 18.5 18
25.1
42.7
26.5
20.4 19 18.5
13.8 11.7 13.3 13.3 11.919.1
36
22.3
14.9 13.4 13.2
0
10
20
30
40
50
60
70
80
90
2015 2016 2017 2018 2019 2020 2021E 2022E 2023E 2024E 2025E
Nitrile Latex Vinyl
USD/1'000 pcs)
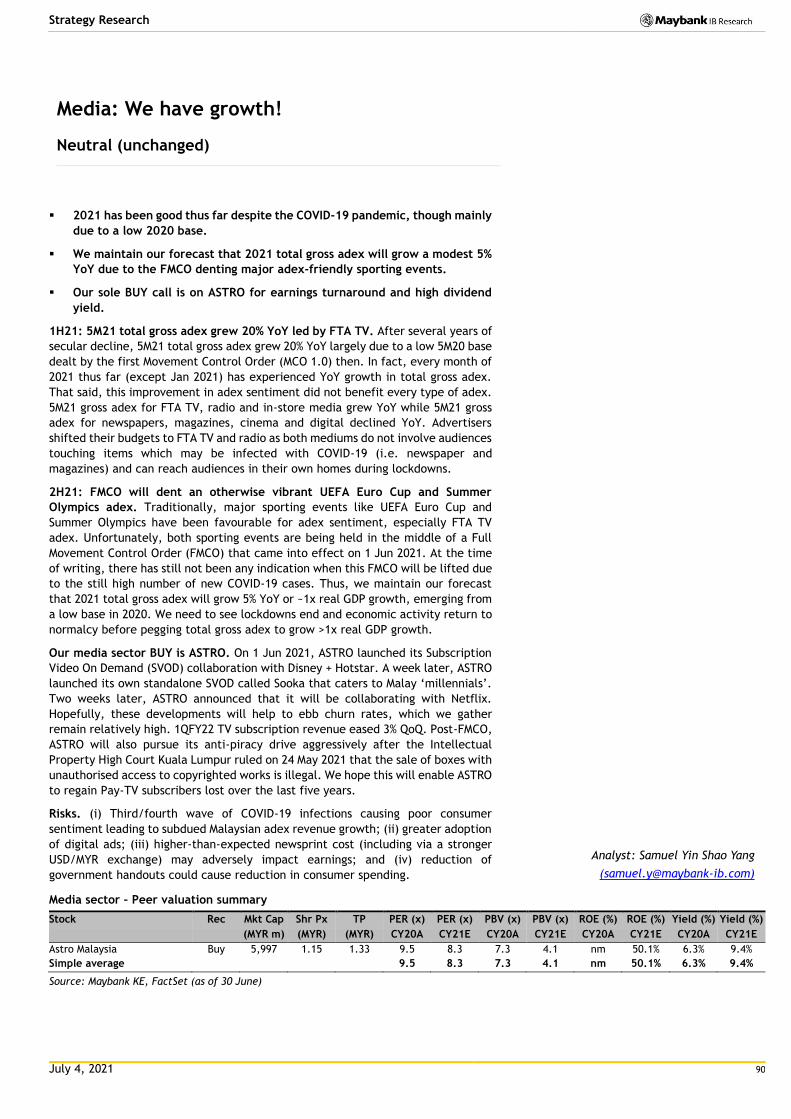
July 4, 2021 90
Strategy Research
Media: We have growth!
Neutral (unchanged)
2021 has been good thus far despite the COVID-19 pandemic, though mainly
due to a low 2020 base.
We maintain our forecast that 2021 total gross adex will grow a modest 5%
YoY due to the FMCO denting major adex-friendly sporting events.
Our sole BUY call is on ASTRO for earnings turnaround and high dividend
yield.
1H21: 5M21 total gross adex grew 20% YoY led by FTA TV. After several years of
secular decline, 5M21 total gross adex grew 20% YoY largely due to a low 5M20 base
dealt by the first Movement Control Order (MCO 1.0) then. In fact, every month of
2021 thus far (except Jan 2021) has experienced YoY growth in total gross adex.
That said, this improvement in adex sentiment did not benefit every type of adex.
5M21 gross adex for FTA TV, radio and in-store media grew YoY while 5M21 gross
adex for newspapers, magazines, cinema and digital declined YoY. Advertisers
shifted their budgets to FTA TV and radio as both mediums do not involve audiences
touching items which may be infected with COVID-19 (i.e. newspaper and
magazines) and can reach audiences in their own homes during lockdowns.
2H21: FMCO will dent an otherwise vibrant UEFA Euro Cup and Summer
Olympics adex. Traditionally, major sporting events like UEFA Euro Cup and
Summer Olympics have been favourable for adex sentiment, especially FTA TV
adex. Unfortunately, both sporting events are being held in the middle of a Full
Movement Control Order (FMCO) that came into effect on 1 Jun 2021. At the time
of writing, there has still not been any indication when this FMCO will be lifted due
to the still high number of new COVID-19 cases. Thus, we maintain our forecast
that 2021 total gross adex will grow 5% YoY or ~1x real GDP growth, emerging from
a low base in 2020. We need to see lockdowns end and economic activity return to
normalcy before pegging total gross adex to grow >1x real GDP growth.
Our media sector BUY is ASTRO. On 1 Jun 2021, ASTRO launched its Subscription
Video On Demand (SVOD) collaboration with Disney + Hotstar. A week later, ASTRO
launched its own standalone SVOD called Sooka that caters to Malay ‘millennials’.
Two weeks later, ASTRO announced that it will be collaborating with Netflix.
Hopefully, these developments will help to ebb churn rates, which we gather
remain relatively high. 1QFY22 TV subscription revenue eased 3% QoQ. Post-FMCO,
ASTRO will also pursue its anti-piracy drive aggressively after the Intellectual
Property High Court Kuala Lumpur ruled on 24 May 2021 that the sale of boxes with
unauthorised access to copyrighted works is illegal. We hope this will enable ASTRO
to regain Pay-TV subscribers lost over the last five years.
Risks. (i) Third/fourth wave of COVID-19 infections causing poor consumer
sentiment leading to subdued Malaysian adex revenue growth; (ii) greater adoption
of digital ads; (iii) higher-than-expected newsprint cost (including via a stronger
USD/MYR exchange) may adversely impact earnings; and (iv) reduction of
government handouts could cause reduction in consumer spending.
Media sector – Peer valuation summary
Stock Rec Mkt Cap Shr Px TP PER (x) PER (x) PBV (x) PBV (x) ROE (%) ROE (%) Yield (%) Yield (%)
(MYR m) (MYR) (MYR) CY20A CY21E CY20A CY21E CY20A CY21E CY20A CY21E
Astro Malaysia Buy 5,997 1.15 1.33 9.5 8.3 7.3 4.1 nm 50.1% 6.3% 9.4%
Simple average 9.5 8.3 7.3 4.1 nm 50.1% 6.3% 9.4%
Source: Maybank KE, FactSet (as of 30 June)
Analyst: Samuel Yin Shao Yang
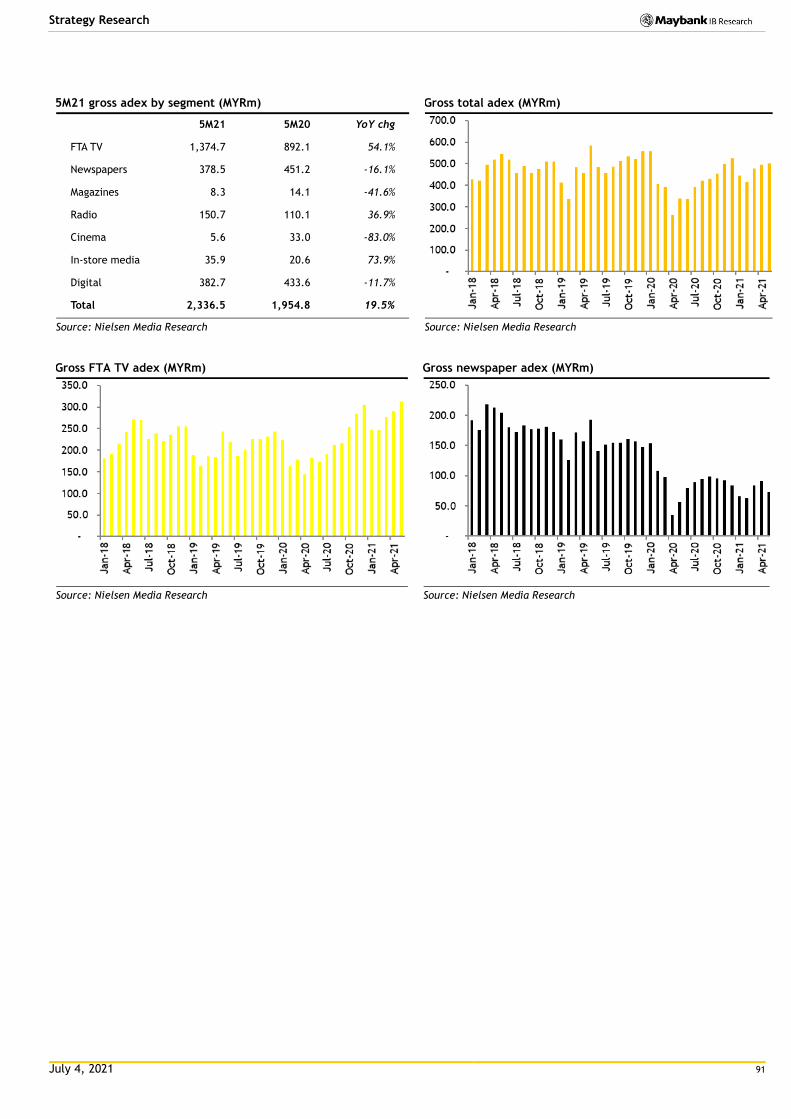
July 4, 2021 91
Strategy Research
5M21 gross adex by segment (MYRm) Gross total adex (MYRm)
5M21 5M20 YoY chg
FTA TV 1,374.7 892.1 54.1%
Newspapers 378.5 451.2 -16.1%
Magazines 8.3 14.1 -41.6%
Radio 150.7 110.1 36.9%
Cinema 5.6 33.0 -83.0%
In-store media 35.9 20.6 73.9%
Digital 382.7 433.6 -11.7%
Total 2,336.5 1,954.8 19.5%
Source: Nielsen Media Research Source: Nielsen Media Research
Gross FTA TV adex (MYRm) Gross newspaper adex (MYRm)
Source: Nielsen Media Research Source: Nielsen Media Research
July 4, 2021 92
Strategy Research
OIL & GAS: Commodity super-cycle?
POSITIVE (unchanged)
Oil price continues to positively surprise this year, rising to a recent high
of USD75/bbl, due to tighter supply and improving demand outlook.
Energy transition is set to speed up, as corporates more aggressively
execute on carbon neutrality and net zero carbon emissions agendas.
Our key BUYs are Dialog, Yinson and Wah Seong.
In retrospect. The oil market has been in a buoyant state this year, a stark contrast
to what it experienced in 2020. Oil price (dated Brent) has risen from USD51/bbl
in Jan to USD75/bbl currently, averaging USD64/bbl to-date. The recovery was
driven by improving demand (economic recovery, higher vaccination rollouts) and
tighter supply (OPEC+ policy, under-investment).
This has led us to raise our in-house crude oil price estimate (dated Brent) to
USD65/bbl for 2021 (vs. USD55-60/bbl previously; in line with EIA) and USD64/bbl
(vs. EIA’s USD62/bbl) for 2022. Our view reflects oil price as being expected to
trend lower HoH in 2H21, premised on increased output from OPEC+ and the
potential lifting of sanction against Iran.
On the corporate front, Dialog kicked off its Phase 3A ops in Apr, on schedule and
on budget. BP Singapore is the first customer (430,000m3 capacity of storage
tanks). In May, Velesto lost its Naga 7 rig in an unfortunate accident. That said,
Naga 7 is fully insured, sufficient to cover for the NBV. In June, Yinson stepped up
its e-mobility and energy transition agenda; by: (i) investing in two start-ups;
Moovita (autonomous vehicle tech) and Oyika (2-wheeler electric vehicles); and (ii)
collaborating with Verano Capital, which offers Yinson immediate access into Latin
America’s RE space, with a strong development pipeline of greenfield RE projects
(800MW) in hand. Hibiscus Petroleum announced the acquisition of Repsol’s assets
in Malaysia & Vietnam for USD212.5m. Serba Dinamik was embroiled in a tussle
with its (now) ex-auditor KPMG.
Outlook. The OPEC+ meet will continue to be a key highlight, in shaping the oil
market’s outlook in 2H21. The consensus view is for OPEC+ to further ease oil
outputs in Aug, following an addition of 2.1m bpd of supply to the market in May-
Jul. Should this happen, OPEC and Russia are likely to find common ground again
on oil production policy. The latter has always insisted on raising output further to
avoid further price spikes/ volatility. Apart from that, developments relating to
Iran (lifting of sanctions) and US crude production (shale comeback) will also be
monitored.
The energy transition momentum is accelerating. With most of the oil majors
committing to meet the Net Zero Carbon Emission (NZCE) aspiration by 2050, the
push for renewable energy projects will gain greater traction. Among all the
companies under coverage, Yinson is at the forefront and most visible on this. It
has set targets to reach carbon neutrality by 2030 and NZCE by 2050, respectively,
a key positive.
Sector top BUYs. We continue to advocate companies with growth prospects,
strong financials and focused management, in riding on the cyclical recovery play.
Dialog and Yinson are our key BUYs. We like their resilient financials and business
models. Their acute management acumen/ focus is a major plus point.
We also like WSC. The push ahead will come mainly from its pipe-coating projects
(Qatar & MY). Winning the Qatar pipe-coating jobs will be a key catalyst, for it will
offer similar earnings impact to the completed NordStream2 (NS2) project. We
estimate that the Qatar jobs alone could potentially offer WSC a cumulative
MYR180m net profit over 4 years (2021-24).
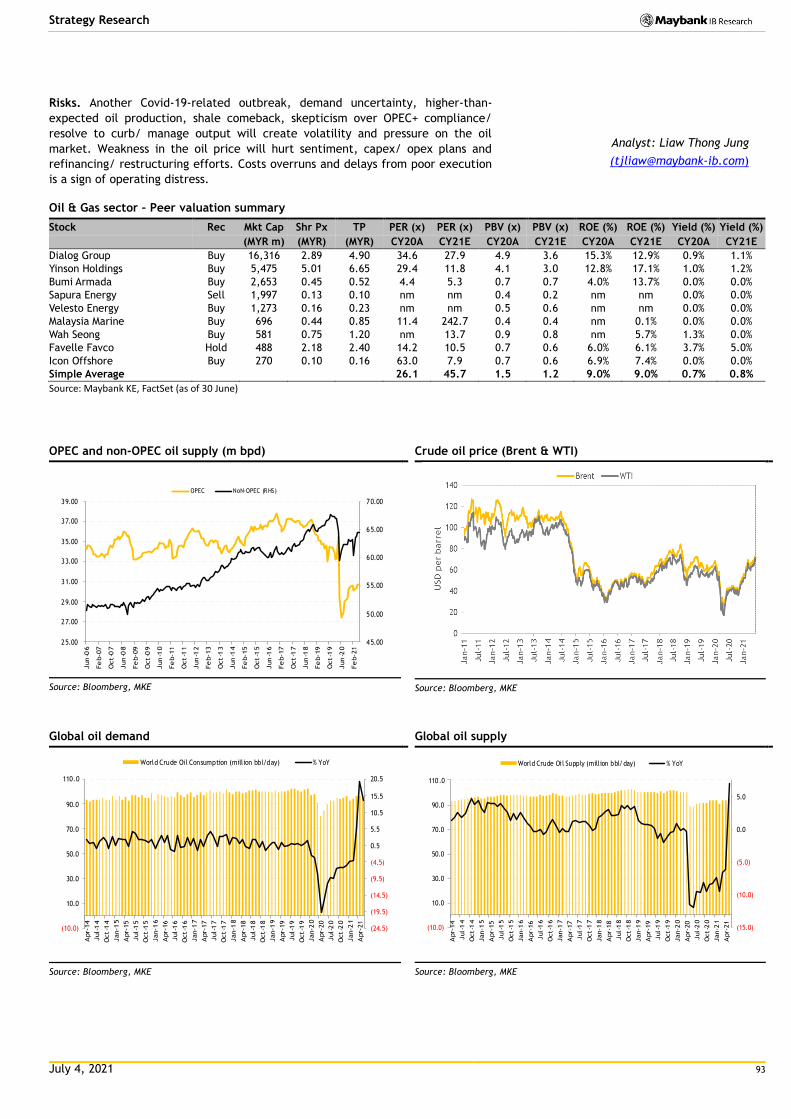
July 4, 2021 93
Strategy Research
Risks. Another Covid-19-related outbreak, demand uncertainty, higher-than-
expected oil production, shale comeback, skepticism over OPEC+ compliance/
resolve to curb/ manage output will create volatility and pressure on the oil
market. Weakness in the oil price will hurt sentiment, capex/ opex plans and
refinancing/ restructuring efforts. Costs overruns and delays from poor execution
is a sign of operating distress.
Oil & Gas sector – Peer valuation summary
Stock Rec Mkt Cap Shr Px TP PER (x) PER (x) PBV (x) PBV (x) ROE (%) ROE (%) Yield (%) Yield (%)
(MYR m) (MYR) (MYR) CY20A CY21E CY20A CY21E CY20A CY21E CY20A CY21E
Dialog Group Buy 16,316 2.89 4.90 34.6 27.9 4.9 3.6 15.3% 12.9% 0.9% 1.1%
Yinson Holdings Buy 5,475 5.01 6.65 29.4 11.8 4.1 3.0 12.8% 17.1% 1.0% 1.2%
Bumi Armada Buy 2,653 0.45 0.52 4.4 5.3 0.7 0.7 4.0% 13.7% 0.0% 0.0%
Sapura Energy Sell 1,997 0.13 0.10 nm nm 0.4 0.2 nm nm 0.0% 0.0%
Velesto Energy Buy 1,273 0.16 0.23 nm nm 0.5 0.6 nm nm 0.0% 0.0%
Malaysia Marine Buy 696 0.44 0.85 11.4 242.7 0.4 0.4 nm 0.1% 0.0% 0.0%
Wah Seong Buy 581 0.75 1.20 nm 13.7 0.9 0.8 nm 5.7% 1.3% 0.0%
Favelle Favco Hold 488 2.18 2.40 14.2 10.5 0.7 0.6 6.0% 6.1% 3.7% 5.0%
Icon Offshore Buy 270 0.10 0.16 63.0 7.9 0.7 0.6 6.9% 7.4% 0.0% 0.0%
Simple Average 26.1 45.7 1.5 1.2 9.0% 9.0% 0.7% 0.8%
Source: Maybank KE, FactSet (as of 30 June)
OPEC and non-OPEC oil supply (m bpd)
Source: Bloomberg, MKE
Crude oil price (Brent & WTI)
Source: Bloomberg, MKE
Global oil demand
S o
Source: Bloomberg, MKE
Global oil supply
Source: Bloomberg, MKE
(24.5)
(19.5)
(14.5)
(9.5)
(4.5)
0.5
5.5
10.5
15.5
20.5
(10.0)
10.0
30.0
50.0
70.0
90.0
110.0
Apr-
14
Jul-
14
Oct-1
4
Jan-1
5
Apr-
15
Jul-
15
Oct-1
5
Jan-1
6
Apr-
16
Jul-
16
Oct-1
6
Jan-1
7
Apr-
17
Jul-
17
Oct-1
7
Jan-1
8
Apr-
18
Jul-
18
Oct-1
8
Jan-1
9
Apr-
19
Jul-
19
Oct-1
9
Jan-2
0
Apr-
20
Jul-
20
Oct-2
0
Jan-2
1
Apr-
21
World Crude Oil Consumption (million bbl/day) % YoY
(15.0)
(10.0)
(5.0)
0.0
5.0
(10.0)
10.0
30.0
50.0
70.0
90.0
110.0
Apr-
14
Jul-
14
Oct-1
4
Jan-1
5
Apr-
15
Jul-
15
Oct-1
5
Jan-1
6
Apr-
16
Jul-
16
Oct-1
6
Jan-1
7
Apr-
17
Jul-
17
Oct-1
7
Jan-1
8
Apr-
18
Jul-
18
Oct-1
8
Jan-1
9
Apr-
19
Jul-
19
Oct-1
9
Jan-2
0
Apr-
20
Jul-
20
Oct-2
0
Jan-2
1
Apr-
21
World Crude Oil Supply (million bbl/day) % YoY
45.00
50.00
55.00
60.00
65.00
70.00
25.00
27.00
29.00
31.00
33.00
35.00
37.00
39.00
Jun
-06
Fe
b-0
7
Oct-0
7
Jun
-08
Fe
b-0
9
Oct-0
9
Jun
-10
Fe
b-1
1
Oct-1
1
Jun
-12
Fe
b-1
3
Oct-1
3
Jun
-14
Fe
b-1
5
Oct-1
5
Jun
-16
Fe
b-1
7
Oct-1
7
Jun
-18
Fe
b-1
9
Oct-1
9
Jun
-20
Fe
b-2
1
OPEC NoN-OPEC (RHS)
Analyst: Liaw Thong Jung
July 4, 2021 94
Strategy Research
PETROCHEMICAL: A Regression to the Mean
NEUTRAL (maintained)
Following a stellar 1Q21 for both PCHEM & TTNP, ASPs are expected to
taper off in 2H21 as global supply woes ease.
For PCHEM, declining O&D ASPs could be partially offset by surging F&M
ASPs in the near term, with prices expected to normalise in 2H21. For
TTNP, rising feedstock cost is already compressing margins, and although
we foresee spreads to remain healthy in 2Q21, a regression to the mean is
likely, with new supply set to come onstream in 2H21.
We have HOLDs on PCHEM and TTNP.
Recapping an exceptional 1Q21. PCHEM posted a strong set of earnings in 1Q21
(c.+4x YoY/+2x QoQ) as ASPs surged across all its product classes, most notably
ethylene, which reached record highs in March. Higher ASPs was the result of supply
tightness driven by a slew of disruptive events in the quarter including regional
plant turnarounds, ME feedstock shortages and US plant outages due to Winter
Storm Uri in Feb. Consequently, EBITDA margins expanded 36% YoY despite
marginally lower production volumes (-6% YoY) as 3 F&M plants underwent
corrective maintenance works. Winter Storm Uri was also the primary driver behind
TTNP posting its strongest set of results in 1Q21 - the highest since its 2017 IPO, as
core net profit surged to MYR424m (c.+3x QoQ; MYR222m loss in 1Q20) on the back
of higher product spreads. Production/sales volumes was also up c.30% YoY as plant
utilisation improved in tandem to 88% in the quarter (1Q20: 66% due to statutory
maintenance works).
Supply constraints to ease in 2H21. ASPs of ethylene/propylene and its respective
derivative chemicals peaked in late March/early April but remain elevated in 2Q21
as a residual effect of the supply disruptions in 1Q21. As such, we expect both
PCHEM & TTNP to post strong earnings this quarter despite the declining ASPs,
before normalising again in 2H21. A particular bright spot for PCHEM has been the
F&M division, with urea and ammonia prices having surged since late-May due to
unscheduled plant shutdowns in the ME and the onset of regional planting seasons
in India and North Asia. With ASPs in June averaging USD442/t (1Q21: USD335/t)
and USD595/t (1Q21: USD312/t), respectively, F&M contributions for PCHEM could
potentially mitigate falling O&D ASPs in 2Q21. Going forward, we do not foresee
these supply disruptions being sustained as new capacity is set to come onstream
in China in the second half of the year. Following numerous delays, PCHEM’s 3m
MT Pengerang facility (50% JV with Aramco) is also expected to commence ops from
3Q/4Q21 - although a bulk of its new capacity is to be exported, the new supply
may lead to mild price erosion in the domestic market for downstream chemicals
(HDPE, LLPE & PP), where TTNP is a player.
Maintain NEUTRAL. We have a HOLD on both PCHEM & TTNP, and our post-1Q21
earnings forecasts is unchanged. PCHEM is trading at CY21 9x EV/EBITDA (5-year
mean: 9x) with a net cash position of MYR11.3b (MYR1.41 per share), while LCT is
trading at 1.7x CY21 EV/EBITDA (5Y mean: 5.0x; -1SD to mean: 0.9x).
Petrochemical sector – Peer valuation summary
Stock Rec Mkt Cap Shr Px TP PER (x) PER (x) PBV (x) PBV (x) ROE (%) ROE (%) Yield (%) Yield (%)
(MYR m) (MYR) (MYR) CY20A CY21E CY20A CY21E CY20A CY21E CY20A CY21E
Petronas Chemicals Hold 64,480 8.06 8.25 32.7 17.1 2.0 2.0 5.4% 11.7% 1.6% 2.9%
Lotte Chemical Titan Hold 6,319 2.78 3.10 34.8 8.2 0.5 0.5 1.3% 6.2% 1.1% 5.9%
Simple average 33.8 12.6 1.2 1.3 3.3% 9.0% 1.4% 4.4%
Source: Maybank KE, FactSet (as of 30 June)
Risks. (1) Weaker-than-expected global economic growth, potentially due to
resurgence of COVID-19 and failures of vaccines; (2) Sharp movement in naphtha
Analyst: Anand Pathmakanthan
Analyst: Arvind Jayaratnam
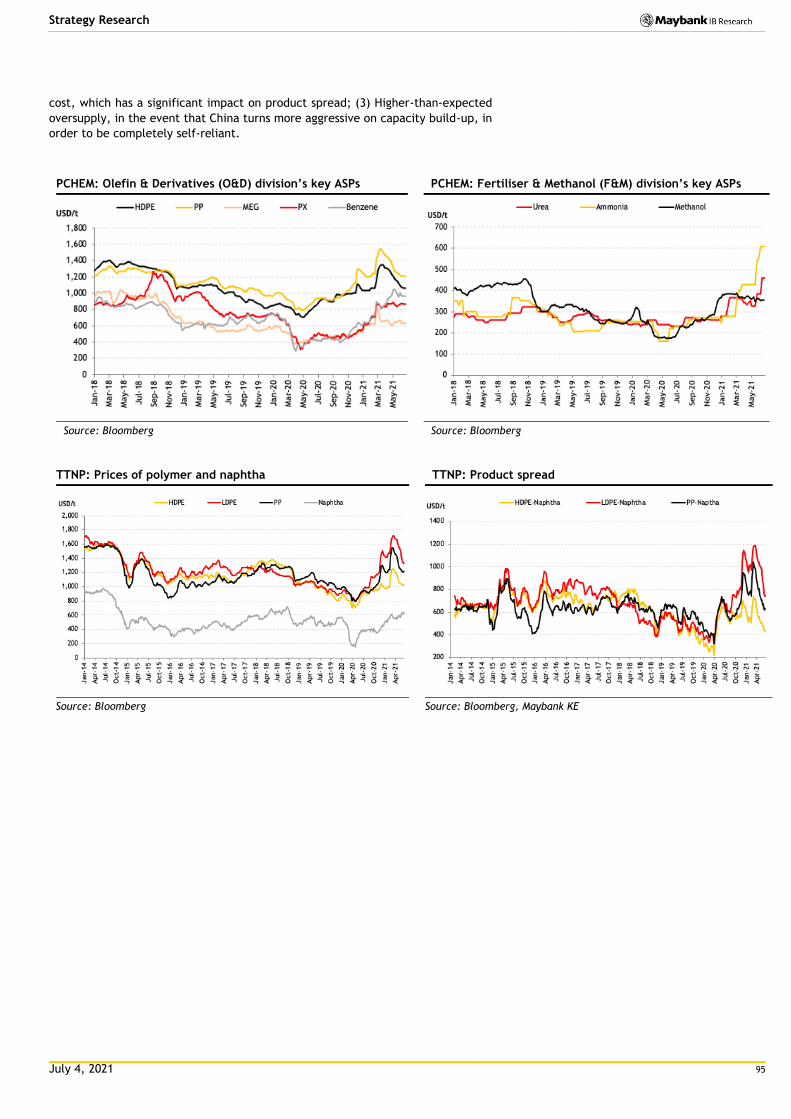
July 4, 2021 95
Strategy Research
cost, which has a significant impact on product spread; (3) Higher-than-expected
oversupply, in the event that China turns more aggressive on capacity build-up, in
order to be completely self-reliant.
PCHEM: Olefin & Derivatives (O&D) division’s key ASPs PCHEM: Fertiliser & Methanol (F&M) division’s key ASPs
Source: Bloomberg Source: Bloomberg
TTNP: Prices of polymer and naphtha TTNP: Product spread
Source: Bloomberg Source: Bloomberg, Maybank KE
July 4, 2021 96
Strategy Research
PLANTATION: Higher HoH output in 2H21 to
buffer anticipated weaker CPO ASP POSITIVE (unchanged)
Oil World continues to project the stock-to-usage ratios of global palm oil,
and 17 oils & fats to remain relatively tight over the next 12 months.
While 1H21’s high CPO ASP is unsustainable, the seasonally higher HoH
output in 2H21 will buffer the anticipated lower HoH CPO ASP.
Equity values have lagged CPO price. We prefer SMID caps given their
attractive valuations. Our preferred MY BUYs are KLK, SOP, and BPLANT.
In retrospect. The supply shock towards the end of 2020 led to tightness in 17
global oils and fats supplies (palm oil included) in 1H21. This caused CPO price to
rally in order to ration demand. 1H21 CPO spot price averaged around MYR4,000/t
(1H20: MYR2,485/t). The lofty CPO price was also lifted by the strength in the
prices of competing oils (principally soybean oil), and in part due to heavy fund
participation, encouraged by low interest rates and a weak US Dollar.
2H21 Outlook. Palm oil supply remained tight in 1H21 due to seasonally low
yielding months and a general lack of new supplies of competing oils as well. But
that may change in 2H21 as oil palm enters into seasonally high production months,
aided by good rainfall over the past few months, and a normalization of fertiliser
application invigorated by better CPO prices. At the same time, the high prices of
competing oilseeds and oils are also likely to entice farmers in the Northern
Hemisphere to optimize plantings this season. Barring any weather surprises, these
anticipated new crops are set to hit the market between Aug and Nov 2021, which
coincides with the peak palm oil production period. They will somewhat ease the
overall tightness but a normalisation of the overall supplies will probably take
another 12 months.
In its June 2021 issue, Oil World introduced its Oct/Sept 2021/22F marketing year
forecast, projecting yet another relatively tight stock-to-usage ratio of 16.7% for
palm oil (2020/21F: 16.5%, 2019/20: 16.4%), and 12.9% (2020/21F: 12.7%, 2019/20:
13.0%) for global 17 oils and fats. Likewise, the global 10 oilseeds’ SUR is projected
to improve YoY to 18.6% (2020/21F: 17.9%, 2019/20: 19.5%) for Oct/Sept 2021/22F
marketing year, but to remain relatively tight.
CPO spot price has corrected sharply from its recent peak of around MYR4,800/t,
perhaps in response to expectation of better supplies in 2H. 1M FCPO price now
trades at >USD400/t discount to US soybean oil, vs historical average of USD132/t.
As for POGO (palm oil-gas oil) spread, it was unfavourable throughout 1H21 but
with the recent surge in crude oil prices to >USD70/bbl, the POGO spread has
narrowed to USD414/t (as at 25 June; see chart overleaf). While discretionary
demand continues to be non-existent at current spread, government mandated
blend will continue to be the key demand driver. About 17.5mt or ~23% of global
palm oil supply was used as biodiesel feedstock in 2020.
Price outlook. As output recovers in 2H, we expect 2H21 CPO price to be weaker
HoH. Our CPO ASP assumptions for 2021 and 2022 are MYR3,100/t and MYR2,600/t
respectively. Having said that, the risk to our 2021 CPO ASP forecast is on the
upside if (1) MY’s output in 2H is severely curtailed by the acute shortage of
workers, and/or (2) MY takes immediate steps to address the price competitiveness
of its processed palm oil vis-à-vis ID (see “Issue” overleaf).
Sector picks. Despite lofty CPO prices in the past several months, equity values
did not follow due to: i) the high CPO prices of 1H21 being deemed unsustainable;
ii) renewed concerns on the sector’s ESG factors; and iii) an overall weak market
sentiment. Overall, we remain POSITIVE on the sector’s near-term outlook; SMID
cap stock prices trade at especially attractive valuations. Our preferred MY BUYs
are KLK, SOP, and BPLANT. Our other SMID cap BUY calls are TSH and Ta Ann.
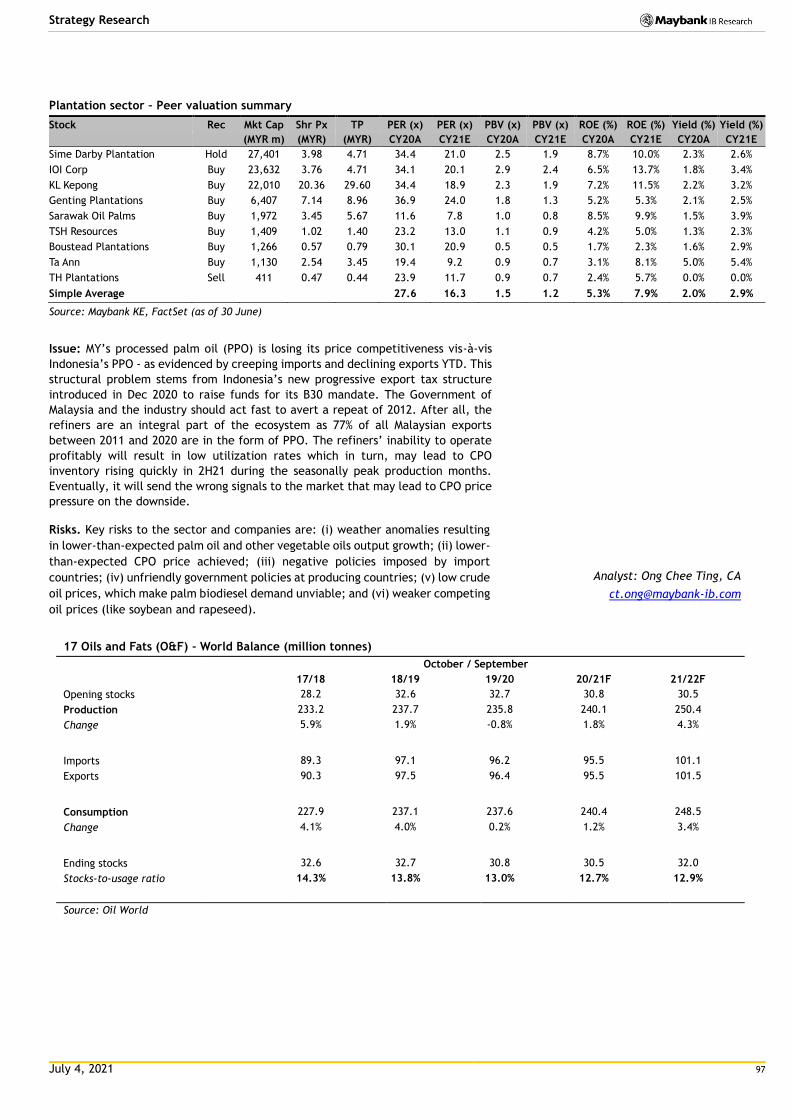
July 4, 2021 97
Strategy Research
Plantation sector – Peer valuation summary
Stock Rec Mkt Cap Shr Px TP PER (x) PER (x) PBV (x) PBV (x) ROE (%) ROE (%) Yield (%) Yield (%)
(MYR m) (MYR) (MYR) CY20A CY21E CY20A CY21E CY20A CY21E CY20A CY21E
Sime Darby Plantation Hold 27,401 3.98 4.71 34.4 21.0 2.5 1.9 8.7% 10.0% 2.3% 2.6%
IOI Corp Buy 23,632 3.76 4.71 34.1 20.1 2.9 2.4 6.5% 13.7% 1.8% 3.4%
KL Kepong Buy 22,010 20.36 29.60 34.4 18.9 2.3 1.9 7.2% 11.5% 2.2% 3.2%
Genting Plantations Buy 6,407 7.14 8.96 36.9 24.0 1.8 1.3 5.2% 5.3% 2.1% 2.5%
Sarawak Oil Palms Buy 1,972 3.45 5.67 11.6 7.8 1.0 0.8 8.5% 9.9% 1.5% 3.9%
TSH Resources Buy 1,409 1.02 1.40 23.2 13.0 1.1 0.9 4.2% 5.0% 1.3% 2.3%
Boustead Plantations Buy 1,266 0.57 0.79 30.1 20.9 0.5 0.5 1.7% 2.3% 1.6% 2.9%
Ta Ann Buy 1,130 2.54 3.45 19.4 9.2 0.9 0.7 3.1% 8.1% 5.0% 5.4%
TH Plantations Sell 411 0.47 0.44 23.9 11.7 0.9 0.7 2.4% 5.7% 0.0% 0.0%
Simple Average 27.6 16.3 1.5 1.2 5.3% 7.9% 2.0% 2.9%
Source: Maybank KE, FactSet (as of 30 June)
Issue: MY’s processed palm oil (PPO) is losing its price competitiveness vis-à-vis
Indonesia’s PPO - as evidenced by creeping imports and declining exports YTD. This
structural problem stems from Indonesia’s new progressive export tax structure
introduced in Dec 2020 to raise funds for its B30 mandate. The Government of
Malaysia and the industry should act fast to avert a repeat of 2012. After all, the
refiners are an integral part of the ecosystem as 77% of all Malaysian exports
between 2011 and 2020 are in the form of PPO. The refiners’ inability to operate
profitably will result in low utilization rates which in turn, may lead to CPO
inventory rising quickly in 2H21 during the seasonally peak production months.
Eventually, it will send the wrong signals to the market that may lead to CPO price
pressure on the downside.
Risks. Key risks to the sector and companies are: (i) weather anomalies resulting
in lower-than-expected palm oil and other vegetable oils output growth; (ii) lower-
than-expected CPO price achieved; (iii) negative policies imposed by import
countries; (iv) unfriendly government policies at producing countries; (v) low crude
oil prices, which make palm biodiesel demand unviable; and (vi) weaker competing
oil prices (like soybean and rapeseed).
17 Oils and Fats (O&F) - World Balance (million tonnes)
October / September
17/18 18/19 19/20 20/21F 21/22F
Opening stocks 28.2 32.6 32.7 30.8 30.5
Production 233.2 237.7 235.8 240.1 250.4
Change 5.9% 1.9% -0.8% 1.8% 4.3%
Imports 89.3 97.1 96.2 95.5 101.1
Exports 90.3 97.5 96.4 95.5 101.5
Consumption 227.9 237.1 237.6 240.4 248.5
Change 4.1% 4.0% 0.2% 1.2% 3.4%
Ending stocks 32.6 32.7 30.8 30.5 32.0
Stocks-to-usage ratio 14.3% 13.8% 13.0% 12.7% 12.9%
Source: Oil World
Analyst: Ong Chee Ting, CA
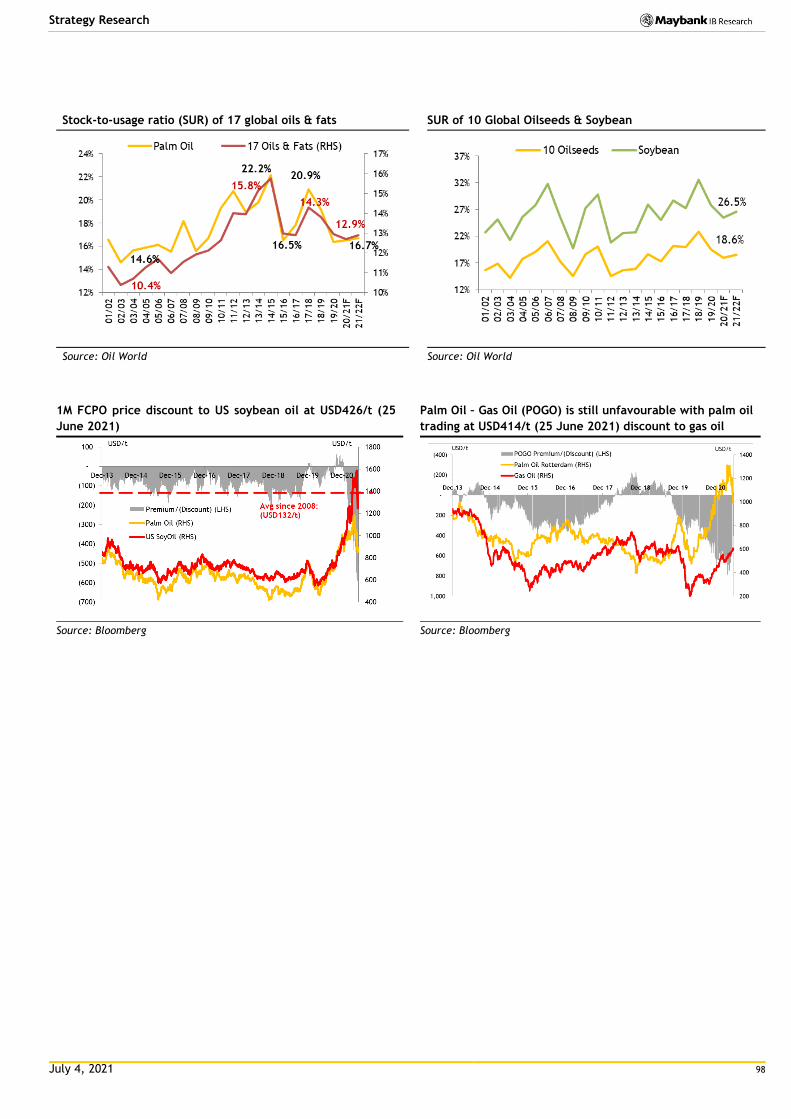
July 4, 2021 98
Strategy Research
Stock-to-usage ratio (SUR) of 17 global oils & fats SUR of 10 Global Oilseeds & Soybean
Source: Oil World Source: Oil World
1M FCPO price discount to US soybean oil at USD426/t (25
June 2021)
Palm Oil – Gas Oil (POGO) is still unfavourable with palm oil
trading at USD414/t (25 June 2021) discount to gas oil
Source: Bloomberg Source: Bloomberg
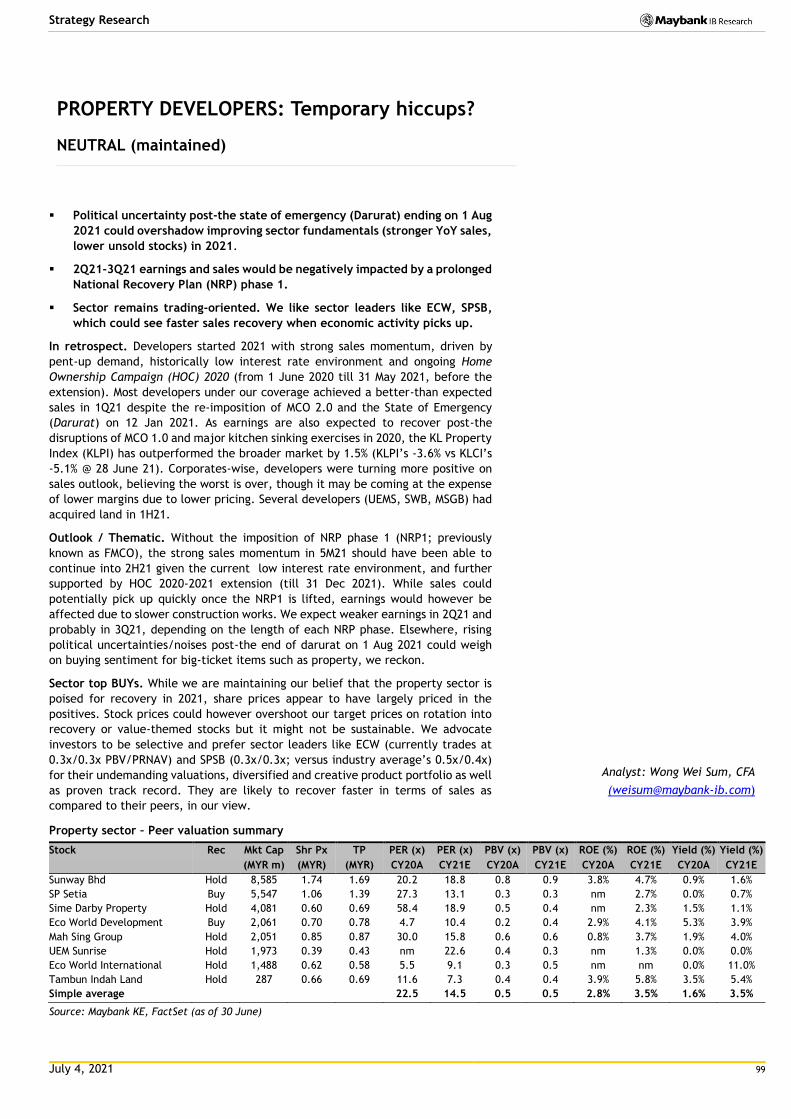
July 4, 2021 99
Strategy Research
PROPERTY DEVELOPERS: Temporary hiccups?
NEUTRAL (maintained)
Political uncertainty post-the state of emergency (Darurat) ending on 1 Aug
2021 could overshadow improving sector fundamentals (stronger YoY sales,
lower unsold stocks) in 2021.
2Q21-3Q21 earnings and sales would be negatively impacted by a prolonged
National Recovery Plan (NRP) phase 1.
Sector remains trading-oriented. We like sector leaders like ECW, SPSB,
which could see faster sales recovery when economic activity picks up.
In retrospect. Developers started 2021 with strong sales momentum, driven by
pent-up demand, historically low interest rate environment and ongoing Home
Ownership Campaign (HOC) 2020 (from 1 June 2020 till 31 May 2021, before the
extension). Most developers under our coverage achieved a better-than expected
sales in 1Q21 despite the re-imposition of MCO 2.0 and the State of Emergency
(Darurat) on 12 Jan 2021. As earnings are also expected to recover post-the
disruptions of MCO 1.0 and major kitchen sinking exercises in 2020, the KL Property
Index (KLPI) has outperformed the broader market by 1.5% (KLPI’s -3.6% vs KLCI’s
-5.1% @ 28 June 21). Corporates-wise, developers were turning more positive on
sales outlook, believing the worst is over, though it may be coming at the expense
of lower margins due to lower pricing. Several developers (UEMS, SWB, MSGB) had
acquired land in 1H21.
Outlook / Thematic. Without the imposition of NRP phase 1 (NRP1; previously
known as FMCO), the strong sales momentum in 5M21 should have been able to
continue into 2H21 given the current low interest rate environment, and further
supported by HOC 2020-2021 extension (till 31 Dec 2021). While sales could
potentially pick up quickly once the NRP1 is lifted, earnings would however be
affected due to slower construction works. We expect weaker earnings in 2Q21 and
probably in 3Q21, depending on the length of each NRP phase. Elsewhere, rising
political uncertainties/noises post-the end of darurat on 1 Aug 2021 could weigh
on buying sentiment for big-ticket items such as property, we reckon.
Sector top BUYs. While we are maintaining our belief that the property sector is
poised for recovery in 2021, share prices appear to have largely priced in the
positives. Stock prices could however overshoot our target prices on rotation into
recovery or value-themed stocks but it might not be sustainable. We advocate
investors to be selective and prefer sector leaders like ECW (currently trades at
0.3x/0.3x PBV/PRNAV) and SPSB (0.3x/0.3x; versus industry average’s 0.5x/0.4x)
for their undemanding valuations, diversified and creative product portfolio as well
as proven track record. They are likely to recover faster in terms of sales as
compared to their peers, in our view.
Property sector – Peer valuation summary
Stock Rec Mkt Cap Shr Px TP PER (x) PER (x) PBV (x) PBV (x) ROE (%) ROE (%) Yield (%) Yield (%)
(MYR m) (MYR) (MYR) CY20A CY21E CY20A CY21E CY20A CY21E CY20A CY21E
Sunway Bhd Hold 8,585 1.74 1.69 20.2 18.8 0.8 0.9 3.8% 4.7% 0.9% 1.6%
SP Setia Buy 5,547 1.06 1.39 27.3 13.1 0.3 0.3 nm 2.7% 0.0% 0.7%
Sime Darby Property Hold 4,081 0.60 0.69 58.4 18.9 0.5 0.4 nm 2.3% 1.5% 1.1%
Eco World Development Buy 2,061 0.70 0.78 4.7 10.4 0.2 0.4 2.9% 4.1% 5.3% 3.9%
Mah Sing Group Hold 2,051 0.85 0.87 30.0 15.8 0.6 0.6 0.8% 3.7% 1.9% 4.0%
UEM Sunrise Hold 1,973 0.39 0.43 nm 22.6 0.4 0.3 nm 1.3% 0.0% 0.0%
Eco World International Hold 1,488 0.62 0.58 5.5 9.1 0.3 0.5 nm nm 0.0% 11.0%
Tambun Indah Land Hold 287 0.66 0.69 11.6 7.3 0.4 0.4 3.9% 5.8% 3.5% 5.4%
Simple average 22.5 14.5 0.5 0.5 2.8% 3.5% 1.6% 3.5%
Source: Maybank KE, FactSet (as of 30 June)
Analyst: Wong Wei Sum, CFA
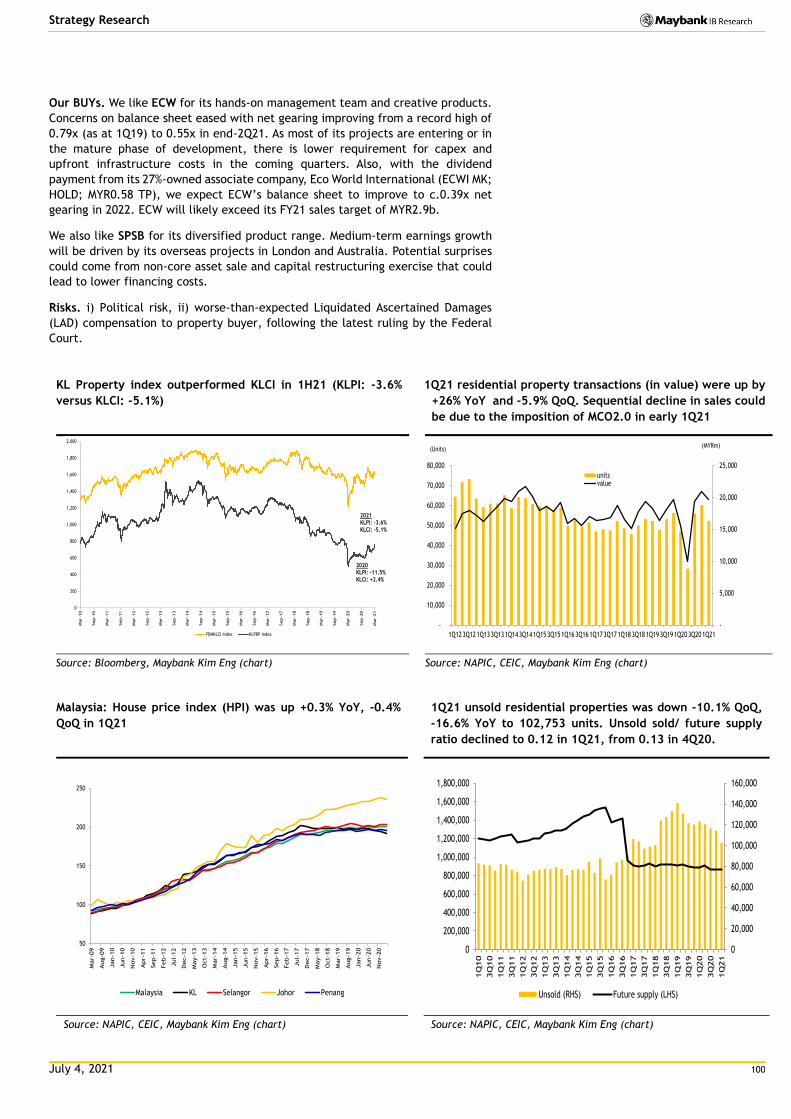
July 4, 2021 100
Strategy Research
Our BUYs. We like ECW for its hands-on management team and creative products.
Concerns on balance sheet eased with net gearing improving from a record high of
0.79x (as at 1Q19) to 0.55x in end-2Q21. As most of its projects are entering or in
the mature phase of development, there is lower requirement for capex and
upfront infrastructure costs in the coming quarters. Also, with the dividend
payment from its 27%-owned associate company, Eco World International (ECWI MK;
HOLD; MYR0.58 TP), we expect ECW’s balance sheet to improve to c.0.39x net
gearing in 2022. ECW will likely exceed its FY21 sales target of MYR2.9b.
We also like SPSB for its diversified product range. Medium-term earnings growth
will be driven by its overseas projects in London and Australia. Potential surprises
could come from non-core asset sale and capital restructuring exercise that could
lead to lower financing costs.
Risks. i) Political risk, ii) worse-than-expected Liquidated Ascertained Damages
(LAD) compensation to property buyer, following the latest ruling by the Federal
Court.
KL Property index outperformed KLCI in 1H21 (KLPI: -3.6%
versus KLCI: -5.1%)
1Q21 residential property transactions (in value) were up by
+26% YoY and -5.9% QoQ. Sequential decline in sales could
be due to the imposition of MCO2.0 in early 1Q21
Source: Bloomberg, Maybank Kim Eng (chart) Source: NAPIC, CEIC, Maybank Kim Eng (chart)
Malaysia: House price index (HPI) was up +0.3% YoY, -0.4%
QoQ in 1Q21
1Q21 unsold residential properties was down -10.1% QoQ,
-16.6% YoY to 102,753 units. Unsold sold/ future supply
ratio declined to 0.12 in 1Q21, from 0.13 in 4Q20.
Source: NAPIC, CEIC, Maybank Kim Eng (chart) Source: NAPIC, CEIC, Maybank Kim Eng (chart)
0
200
400
600
800
1,000
1,200
1,400
1,600
1,800
2,000
Mar-
10
Sep-1
0
Mar-
11
Sep-1
1
Mar-
12
Sep-1
2
Mar-
13
Sep-1
3
Mar-
14
Sep-1
4
Mar-
15
Sep-1
5
Mar-
16
Sep-1
6
Mar-
17
Sep-1
7
Mar-
18
Sep-1
8
Mar-
19
Sep-1
9
Mar-2
0
Sep-2
0
Mar-
21
FBMKLCI Index KLPRP Index
2021KLPI: -3.6% KLCI: -5.1%
2020KLPI: -11.5% KLCI: +2.4%
-
5,000
10,000
15,000
20,000
25,000
-
10,000
20,000
30,000
40,000
50,000
60,000
70,000
80,000
1Q123Q121Q133Q131Q143Q141Q153Q151Q163Q161Q173Q171Q183Q181Q193Q191Q203Q201Q21
unitsvalue
(Units)(MYRm)
50
100
150
200
250
Mar-
09
Aug-0
9
Jan-1
0
Jun-1
0
Nov-1
0
Apr-
11
Sep-1
1
Feb-1
2
Jul-
12
Dec-1
2
May-1
3
Oct-
13
Mar-
14
Aug-1
4
Jan-1
5
Jun-1
5
Nov-1
5
Apr-
16
Sep-1
6
Feb-1
7
Jul-
17
Dec-1
7
May-1
8
Oct-
18
Mar-
19
Aug-1
9
Jan-2
0
Jun-2
0
Nov-2
0
Malaysia KL Selangor Johor Penang
0
20,000
40,000
60,000
80,000
100,000
120,000
140,000
160,000
0
200,000
400,000
600,000
800,000
1,000,000
1,200,000
1,400,000
1,600,000
1,800,000
1Q
10
3Q
10
1Q
11
3Q
11
1Q
12
3Q
12
1Q
13
3Q
13
1Q
14
3Q
14
1Q
15
3Q
15
1Q
16
3Q
16
1Q
17
3Q
17
1Q
18
3Q
18
1Q
19
3Q
19
1Q
20
3Q
20
1Q
21
Unsold (RHS) Future supply (LHS)
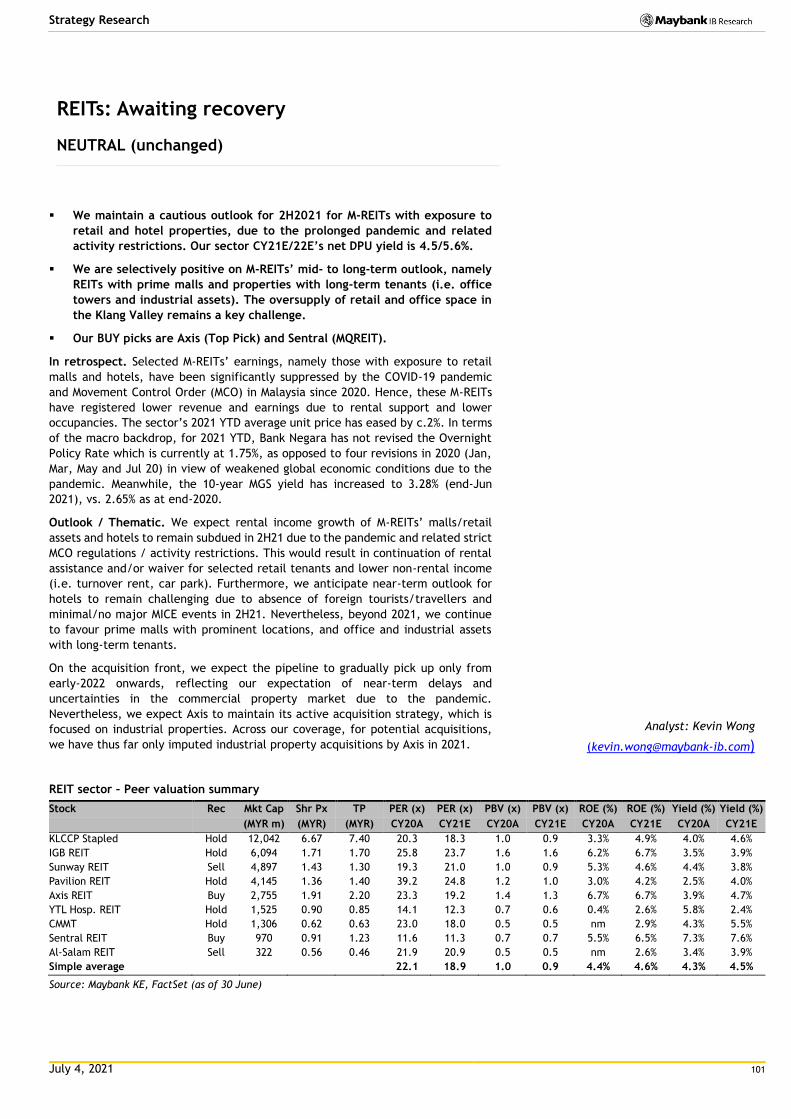
July 4, 2021 101
Strategy Research
REITs: Awaiting recovery
NEUTRAL (unchanged)
We maintain a cautious outlook for 2H2021 for M-REITs with exposure to
retail and hotel properties, due to the prolonged pandemic and related
activity restrictions. Our sector CY21E/22E’s net DPU yield is 4.5/5.6%.
We are selectively positive on M-REITs’ mid- to long-term outlook, namely
REITs with prime malls and properties with long-term tenants (i.e. office
towers and industrial assets). The oversupply of retail and office space in
the Klang Valley remains a key challenge.
Our BUY picks are Axis (Top Pick) and Sentral (MQREIT).
In retrospect. Selected M-REITs’ earnings, namely those with exposure to retail
malls and hotels, have been significantly suppressed by the COVID-19 pandemic
and Movement Control Order (MCO) in Malaysia since 2020. Hence, these M-REITs
have registered lower revenue and earnings due to rental support and lower
occupancies. The sector’s 2021 YTD average unit price has eased by c.2%. In terms
of the macro backdrop, for 2021 YTD, Bank Negara has not revised the Overnight
Policy Rate which is currently at 1.75%, as opposed to four revisions in 2020 (Jan,
Mar, May and Jul 20) in view of weakened global economic conditions due to the
pandemic. Meanwhile, the 10-year MGS yield has increased to 3.28% (end-Jun
2021), vs. 2.65% as at end-2020.
Outlook / Thematic. We expect rental income growth of M-REITs’ malls/retail
assets and hotels to remain subdued in 2H21 due to the pandemic and related strict
MCO regulations / activity restrictions. This would result in continuation of rental
assistance and/or waiver for selected retail tenants and lower non-rental income
(i.e. turnover rent, car park). Furthermore, we anticipate near-term outlook for
hotels to remain challenging due to absence of foreign tourists/travellers and
minimal/no major MICE events in 2H21. Nevertheless, beyond 2021, we continue
to favour prime malls with prominent locations, and office and industrial assets
with long-term tenants.
On the acquisition front, we expect the pipeline to gradually pick up only from
early-2022 onwards, reflecting our expectation of near-term delays and
uncertainties in the commercial property market due to the pandemic.
Nevertheless, we expect Axis to maintain its active acquisition strategy, which is
focused on industrial properties. Across our coverage, for potential acquisitions,
we have thus far only imputed industrial property acquisitions by Axis in 2021.
REIT sector – Peer valuation summary
Stock Rec Mkt Cap Shr Px TP PER (x) PER (x) PBV (x) PBV (x) ROE (%) ROE (%) Yield (%) Yield (%)
(MYR m) (MYR) (MYR) CY20A CY21E CY20A CY21E CY20A CY21E CY20A CY21E
KLCCP Stapled Hold 12,042 6.67 7.40 20.3 18.3 1.0 0.9 3.3% 4.9% 4.0% 4.6%
IGB REIT Hold 6,094 1.71 1.70 25.8 23.7 1.6 1.6 6.2% 6.7% 3.5% 3.9%
Sunway REIT Sell 4,897 1.43 1.30 19.3 21.0 1.0 0.9 5.3% 4.6% 4.4% 3.8%
Pavilion REIT Hold 4,145 1.36 1.40 39.2 24.8 1.2 1.0 3.0% 4.2% 2.5% 4.0%
Axis REIT Buy 2,755 1.91 2.20 23.3 19.2 1.4 1.3 6.7% 6.7% 3.9% 4.7%
YTL Hosp. REIT Hold 1,525 0.90 0.85 14.1 12.3 0.7 0.6 0.4% 2.6% 5.8% 2.4%
CMMT Hold 1,306 0.62 0.63 23.0 18.0 0.5 0.5 nm 2.9% 4.3% 5.5%
Sentral REIT Buy 970 0.91 1.23 11.6 11.3 0.7 0.7 5.5% 6.5% 7.3% 7.6%
Al-Salam REIT Sell 322 0.56 0.46 21.9 20.9 0.5 0.5 nm 2.6% 3.4% 3.9%
Simple average 22.1 18.9 1.0 0.9 4.4% 4.6% 4.3% 4.5%
Source: Maybank KE, FactSet (as of 30 June)
Analyst: Kevin Wong
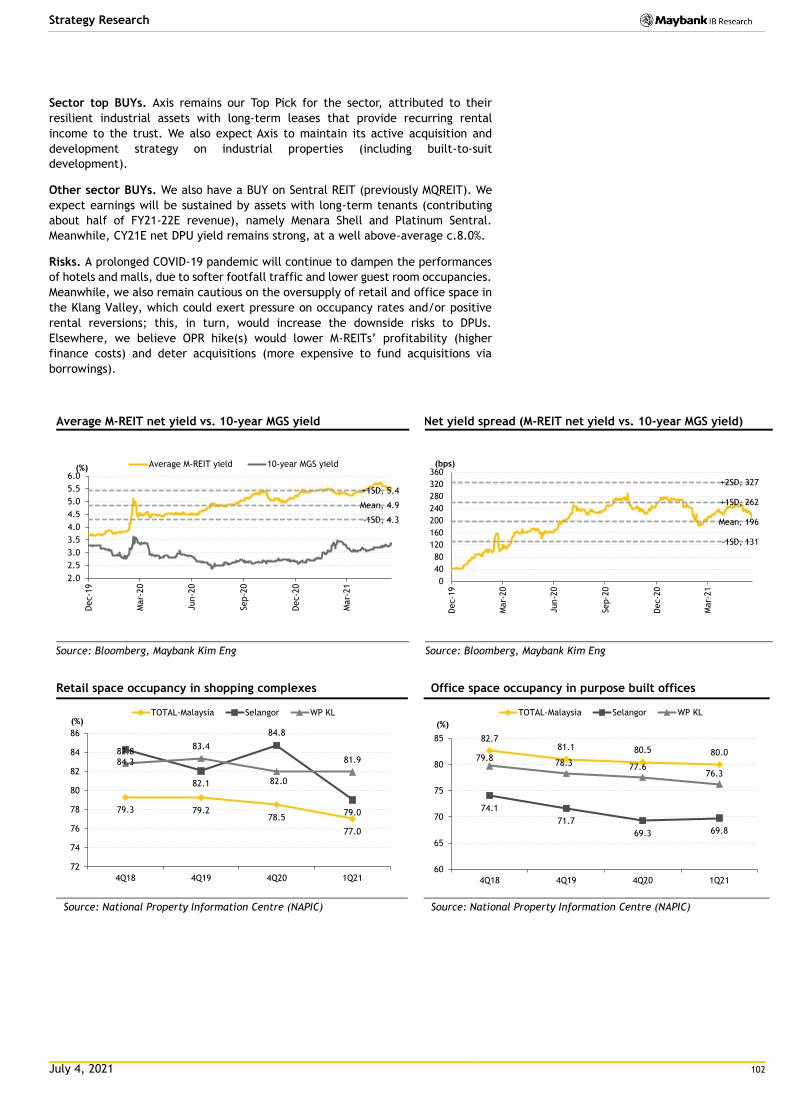
July 4, 2021 102
Strategy Research
Sector top BUYs. Axis remains our Top Pick for the sector, attributed to their
resilient industrial assets with long-term leases that provide recurring rental
income to the trust. We also expect Axis to maintain its active acquisition and
development strategy on industrial properties (including built-to-suit
development).
Other sector BUYs. We also have a BUY on Sentral REIT (previously MQREIT). We
expect earnings will be sustained by assets with long-term tenants (contributing
about half of FY21-22E revenue), namely Menara Shell and Platinum Sentral.
Meanwhile, CY21E net DPU yield remains strong, at a well above-average c.8.0%.
Risks. A prolonged COVID-19 pandemic will continue to dampen the performances
of hotels and malls, due to softer footfall traffic and lower guest room occupancies.
Meanwhile, we also remain cautious on the oversupply of retail and office space in
the Klang Valley, which could exert pressure on occupancy rates and/or positive
rental reversions; this, in turn, would increase the downside risks to DPUs.
Elsewhere, we believe OPR hike(s) would lower M-REITs’ profitability (higher
finance costs) and deter acquisitions (more expensive to fund acquisitions via
borrowings).
Average M-REIT net yield vs. 10-year MGS yield Net yield spread (M-REIT net yield vs. 10-year MGS yield)
Source: Bloomberg, Maybank Kim Eng Source: Bloomberg, Maybank Kim Eng
Retail space occupancy in shopping complexes Office space occupancy in purpose built offices
Source: National Property Information Centre (NAPIC) Source: National Property Information Centre (NAPIC)
Mean, 4.9
+1SD, 5.4
-1SD, 4.3
2.0
2.5
3.0
3.5
4.0
4.5
5.0
5.5
6.0
Dec-1
9
Mar-
20
Jun-2
0
Sep-2
0
Dec-2
0
Mar-
21
(%) Average M-REIT yield 10-year MGS yield
Mean, 196
+1SD, 262
-1SD, 131
+2SD, 327
0
40
80
120
160
200
240
280
320
360
Dec-1
9
Mar-
20
Jun-2
0
Sep-2
0
Dec-2
0
Mar-
21
(bps)
79.3 79.278.5
77.0
84.3
82.1
84.8
79.0
82.883.4
82.0
81.9
72
74
76
78
80
82
84
86
4Q18 4Q19 4Q20 1Q21
(%)TOTAL-Malaysia Selangor WP KL
82.781.1 80.5 80.0
74.1
71.7
69.3 69.8
79.878.3 77.6
76.3
60
65
70
75
80
85
4Q18 4Q19 4Q20 1Q21
(%)
TOTAL-Malaysia Selangor WP KL
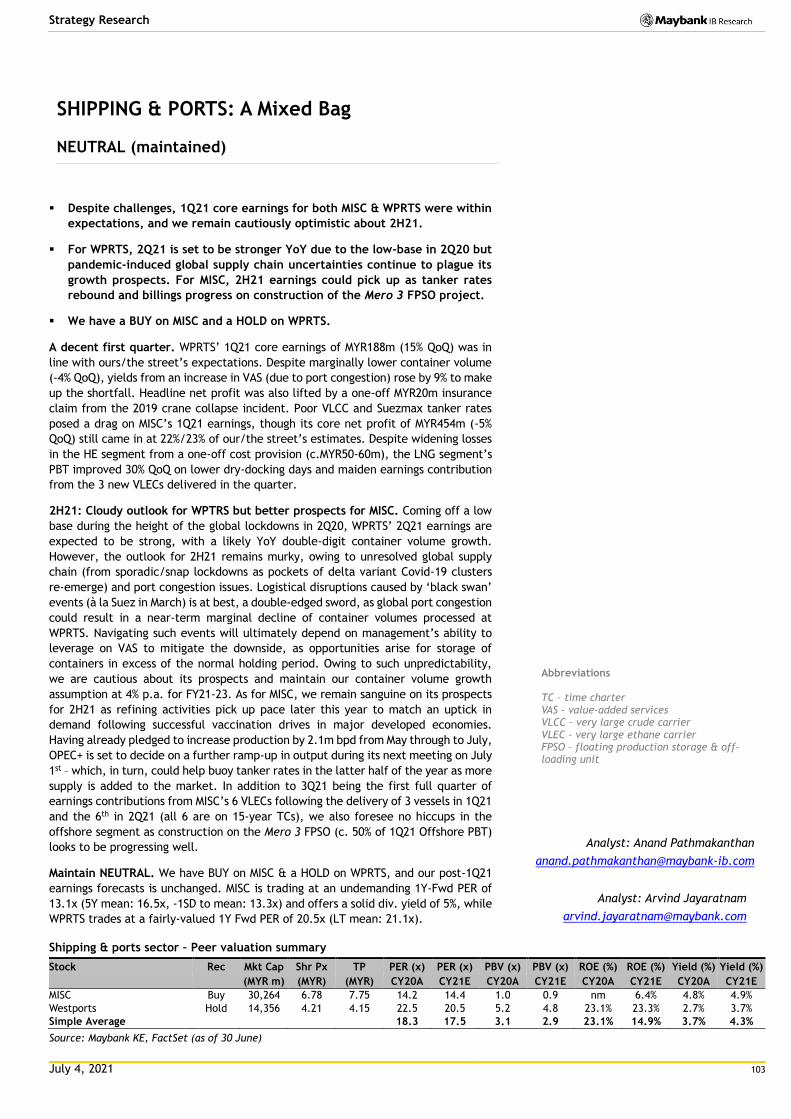
July 4, 2021 103
Strategy Research
SHIPPING & PORTS: A Mixed Bag
NEUTRAL (maintained)
Despite challenges, 1Q21 core earnings for both MISC & WPRTS were within
expectations, and we remain cautiously optimistic about 2H21.
For WPRTS, 2Q21 is set to be stronger YoY due to the low-base in 2Q20 but
pandemic-induced global supply chain uncertainties continue to plague its
growth prospects. For MISC, 2H21 earnings could pick up as tanker rates
rebound and billings progress on construction of the Mero 3 FPSO project.
We have a BUY on MISC and a HOLD on WPRTS.
A decent first quarter. WPRTS’ 1Q21 core earnings of MYR188m (15% QoQ) was in
line with ours/the street’s expectations. Despite marginally lower container volume
(-4% QoQ), yields from an increase in VAS (due to port congestion) rose by 9% to make
up the shortfall. Headline net profit was also lifted by a one-off MYR20m insurance
claim from the 2019 crane collapse incident. Poor VLCC and Suezmax tanker rates
posed a drag on MISC’s 1Q21 earnings, though its core net profit of MYR454m (-5%
QoQ) still came in at 22%/23% of our/the street’s estimates. Despite widening losses
in the HE segment from a one-off cost provision (c.MYR50-60m), the LNG segment’s
PBT improved 30% QoQ on lower dry-docking days and maiden earnings contribution
from the 3 new VLECs delivered in the quarter.
2H21: Cloudy outlook for WPTRS but better prospects for MISC. Coming off a low
base during the height of the global lockdowns in 2Q20, WPRTS’ 2Q21 earnings are
expected to be strong, with a likely YoY double-digit container volume growth.
However, the outlook for 2H21 remains murky, owing to unresolved global supply
chain (from sporadic/snap lockdowns as pockets of delta variant Covid-19 clusters
re-emerge) and port congestion issues. Logistical disruptions caused by ‘black swan’
events (à la Suez in March) is at best, a double-edged sword, as global port congestion
could result in a near-term marginal decline of container volumes processed at
WPRTS. Navigating such events will ultimately depend on management’s ability to
leverage on VAS to mitigate the downside, as opportunities arise for storage of
containers in excess of the normal holding period. Owing to such unpredictability,
we are cautious about its prospects and maintain our container volume growth
assumption at 4% p.a. for FY21-23. As for MISC, we remain sanguine on its prospects
for 2H21 as refining activities pick up pace later this year to match an uptick in
demand following successful vaccination drives in major developed economies.
Having already pledged to increase production by 2.1m bpd from May through to July,
OPEC+ is set to decide on a further ramp-up in output during its next meeting on July
1st – which, in turn, could help buoy tanker rates in the latter half of the year as more
supply is added to the market. In addition to 3Q21 being the first full quarter of
earnings contributions from MISC’s 6 VLECs following the delivery of 3 vessels in 1Q21
and the 6th in 2Q21 (all 6 are on 15-year TCs), we also foresee no hiccups in the
offshore segment as construction on the Mero 3 FPSO (c. 50% of 1Q21 Offshore PBT)
looks to be progressing well.
Maintain NEUTRAL. We have BUY on MISC & a HOLD on WPRTS, and our post-1Q21
earnings forecasts is unchanged. MISC is trading at an undemanding 1Y-Fwd PER of
13.1x (5Y mean: 16.5x, -1SD to mean: 13.3x) and offers a solid div. yield of 5%, while
WPRTS trades at a fairly-valued 1Y Fwd PER of 20.5x (LT mean: 21.1x).
Shipping & ports sector – Peer valuation summary
Stock Rec Mkt Cap Shr Px TP PER (x) PER (x) PBV (x) PBV (x) ROE (%) ROE (%) Yield (%) Yield (%)
(MYR m) (MYR) (MYR) CY20A CY21E CY20A CY21E CY20A CY21E CY20A CY21E
MISC Buy 30,264 6.78 7.75 14.2 14.4 1.0 0.9 nm 6.4% 4.8% 4.9%
Westports Hold 14,356 4.21 4.15 22.5 20.5 5.2 4.8 23.1% 23.3% 2.7% 3.7%
Simple Average 18.3 17.5 3.1 2.9 23.1% 14.9% 3.7% 4.3%
Source: Maybank KE, FactSet (as of 30 June)
Abbreviations TC – time charter VAS – value-added services VLCC – very large crude carrier VLEC – very large ethane carrier FPSO – floating production storage & off-loading unit
Analyst: Anand Pathmakanthan
Analyst: Arvind Jayaratnam
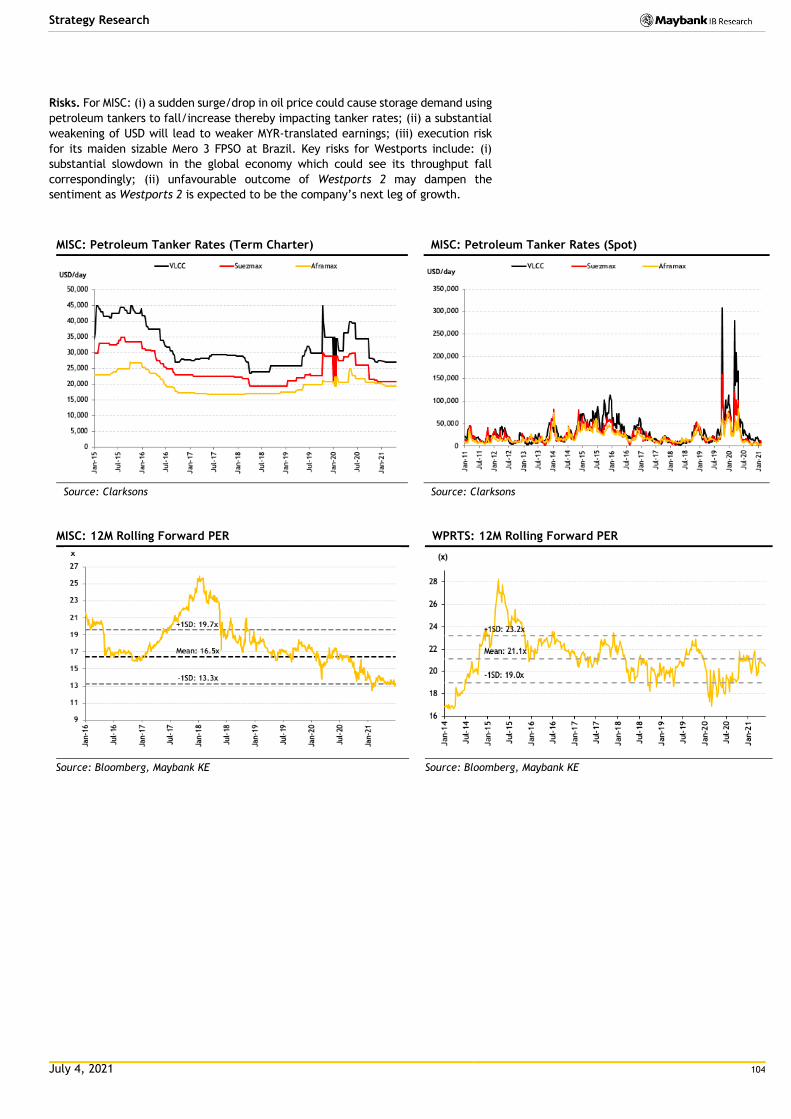
July 4, 2021 104
Strategy Research
Risks. For MISC: (i) a sudden surge/drop in oil price could cause storage demand using
petroleum tankers to fall/increase thereby impacting tanker rates; (ii) a substantial
weakening of USD will lead to weaker MYR-translated earnings; (iii) execution risk
for its maiden sizable Mero 3 FPSO at Brazil. Key risks for Westports include: (i)
substantial slowdown in the global economy which could see its throughput fall
correspondingly; (ii) unfavourable outcome of Westports 2 may dampen the
sentiment as Westports 2 is expected to be the company’s next leg of growth.
MISC: Petroleum Tanker Rates (Term Charter) MISC: Petroleum Tanker Rates (Spot)
Source: Clarksons Source: Clarksons
MISC: 12M Rolling Forward PER WPRTS: 12M Rolling Forward PER
Source: Bloomberg, Maybank KE Source: Bloomberg, Maybank KE
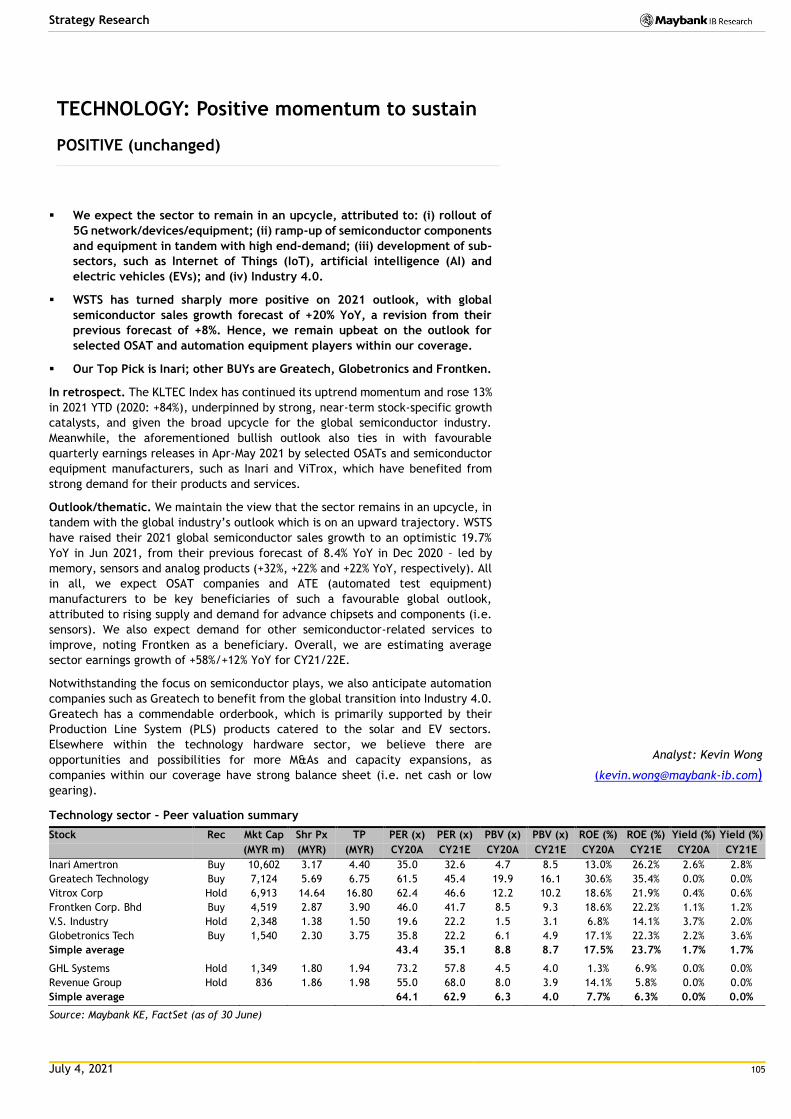
July 4, 2021 105
Strategy Research
TECHNOLOGY: Positive momentum to sustain
POSITIVE (unchanged)
We expect the sector to remain in an upcycle, attributed to: (i) rollout of
5G network/devices/equipment; (ii) ramp-up of semiconductor components
and equipment in tandem with high end-demand; (iii) development of sub-
sectors, such as Internet of Things (IoT), artificial intelligence (AI) and
electric vehicles (EVs); and (iv) Industry 4.0.
WSTS has turned sharply more positive on 2021 outlook, with global
semiconductor sales growth forecast of +20% YoY, a revision from their
previous forecast of +8%. Hence, we remain upbeat on the outlook for
selected OSAT and automation equipment players within our coverage.
Our Top Pick is Inari; other BUYs are Greatech, Globetronics and Frontken.
In retrospect. The KLTEC Index has continued its uptrend momentum and rose 13%
in 2021 YTD (2020: +84%), underpinned by strong, near-term stock-specific growth
catalysts, and given the broad upcycle for the global semiconductor industry.
Meanwhile, the aforementioned bullish outlook also ties in with favourable
quarterly earnings releases in Apr-May 2021 by selected OSATs and semiconductor
equipment manufacturers, such as Inari and ViTrox, which have benefited from
strong demand for their products and services.
Outlook/thematic. We maintain the view that the sector remains in an upcycle, in
tandem with the global industry’s outlook which is on an upward trajectory. WSTS
have raised their 2021 global semiconductor sales growth to an optimistic 19.7%
YoY in Jun 2021, from their previous forecast of 8.4% YoY in Dec 2020 – led by
memory, sensors and analog products (+32%, +22% and +22% YoY, respectively). All
in all, we expect OSAT companies and ATE (automated test equipment)
manufacturers to be key beneficiaries of such a favourable global outlook,
attributed to rising supply and demand for advance chipsets and components (i.e.
sensors). We also expect demand for other semiconductor-related services to
improve, noting Frontken as a beneficiary. Overall, we are estimating average
sector earnings growth of +58%/+12% YoY for CY21/22E.
Notwithstanding the focus on semiconductor plays, we also anticipate automation
companies such as Greatech to benefit from the global transition into Industry 4.0.
Greatech has a commendable orderbook, which is primarily supported by their
Production Line System (PLS) products catered to the solar and EV sectors.
Elsewhere within the technology hardware sector, we believe there are
opportunities and possibilities for more M&As and capacity expansions, as
companies within our coverage have strong balance sheet (i.e. net cash or low
gearing).
Technology sector – Peer valuation summary
Stock Rec Mkt Cap Shr Px TP PER (x) PER (x) PBV (x) PBV (x) ROE (%) ROE (%) Yield (%) Yield (%)
(MYR m) (MYR) (MYR) CY20A CY21E CY20A CY21E CY20A CY21E CY20A CY21E
Inari Amertron Buy 10,602 3.17 4.40 35.0 32.6 4.7 8.5 13.0% 26.2% 2.6% 2.8%
Greatech Technology Buy 7,124 5.69 6.75 61.5 45.4 19.9 16.1 30.6% 35.4% 0.0% 0.0%
Vitrox Corp Hold 6,913 14.64 16.80 62.4 46.6 12.2 10.2 18.6% 21.9% 0.4% 0.6%
Frontken Corp. Bhd Buy 4,519 2.87 3.90 46.0 41.7 8.5 9.3 18.6% 22.2% 1.1% 1.2%
V.S. Industry Hold 2,348 1.38 1.50 19.6 22.2 1.5 3.1 6.8% 14.1% 3.7% 2.0%
Globetronics Tech Buy 1,540 2.30 3.75 35.8 22.2 6.1 4.9 17.1% 22.3% 2.2% 3.6%
Simple average 43.4 35.1 8.8 8.7 17.5% 23.7% 1.7% 1.7%
GHL Systems Hold 1,349 1.80 1.94 73.2 57.8 4.5 4.0 1.3% 6.9% 0.0% 0.0%
Revenue Group Hold 836 1.86 1.98 55.0 68.0 8.0 3.9 14.1% 5.8% 0.0% 0.0%
Simple average 64.1 62.9 6.3 4.0 7.7% 6.3% 0.0% 0.0%
Source: Maybank KE, FactSet (as of 30 June)
Analyst: Kevin Wong
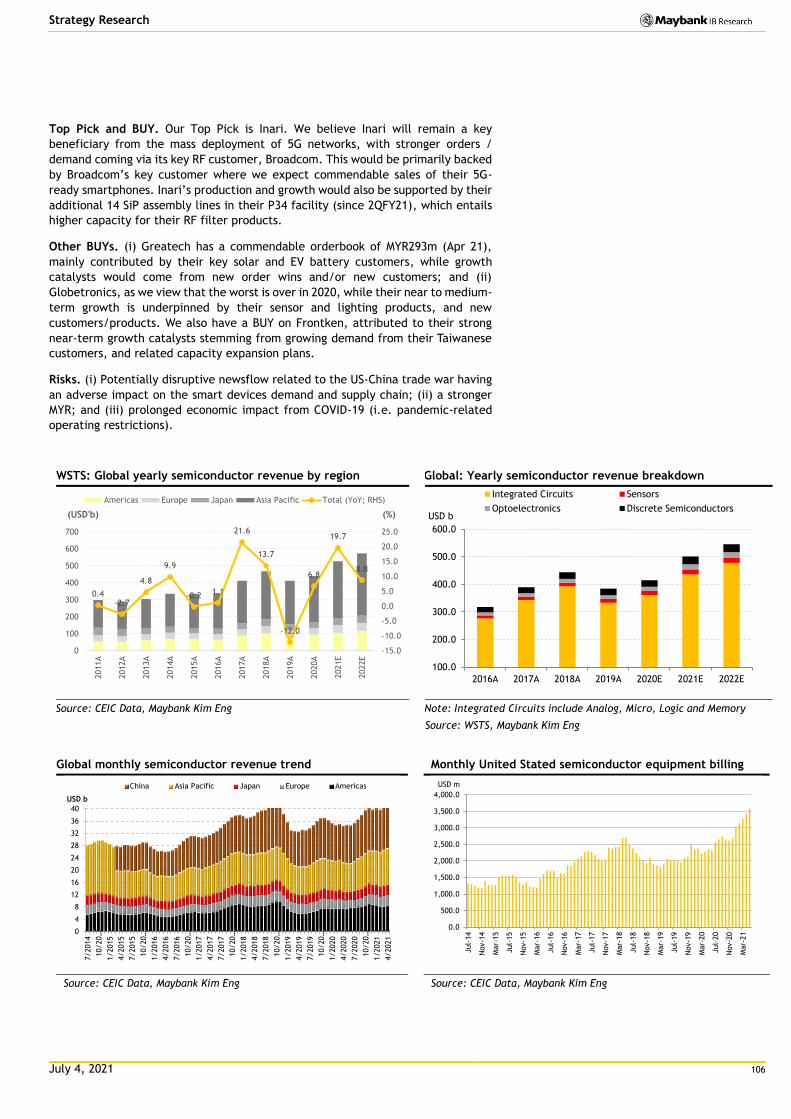
July 4, 2021 106
Strategy Research
Top Pick and BUY. Our Top Pick is Inari. We believe Inari will remain a key
beneficiary from the mass deployment of 5G networks, with stronger orders /
demand coming via its key RF customer, Broadcom. This would be primarily backed
by Broadcom’s key customer where we expect commendable sales of their 5G-
ready smartphones. Inari’s production and growth would also be supported by their
additional 14 SiP assembly lines in their P34 facility (since 2QFY21), which entails
higher capacity for their RF filter products.
Other BUYs. (i) Greatech has a commendable orderbook of MYR293m (Apr 21),
mainly contributed by their key solar and EV battery customers, while growth
catalysts would come from new order wins and/or new customers; and (ii)
Globetronics, as we view that the worst is over in 2020, while their near to medium-
term growth is underpinned by their sensor and lighting products, and new
customers/products. We also have a BUY on Frontken, attributed to their strong
near-term growth catalysts stemming from growing demand from their Taiwanese
customers, and related capacity expansion plans.
Risks. (i) Potentially disruptive newsflow related to the US-China trade war having
an adverse impact on the smart devices demand and supply chain; (ii) a stronger
MYR; and (iii) prolonged economic impact from COVID-19 (i.e. pandemic-related
operating restrictions).
WSTS: Global yearly semiconductor revenue by region Global: Yearly semiconductor revenue breakdown
Source: CEIC Data, Maybank Kim Eng Note: Integrated Circuits include Analog, Micro, Logic and Memory
Source: WSTS, Maybank Kim Eng
Global monthly semiconductor revenue trend Monthly United Stated semiconductor equipment billing
Source: CEIC Data, Maybank Kim Eng Source: CEIC Data, Maybank Kim Eng
0.4-2.7
4.8
9.9
-0.2 1.1
21.6
13.7
-12.0
6.8
19.7
8.8
-15.0
-10.0
-5.0
0.0
5.0
10.0
15.0
20.0
25.0
0
100
200
300
400
500
600
700
2011A
2012A
2013A
2014A
2015A
2016A
2017A
2018A
2019A
2020A
2021E
2022E
(%)(USD'b)
Americas Europe Japan Asia Pacific Total (YoY; RHS)
100.0
200.0
300.0
400.0
500.0
600.0
2016A 2017A 2018A 2019A 2020E 2021E 2022E
Integrated Circuits Sensors
Optoelectronics Discrete SemiconductorsUSD b
0
4
8
12
16
20
24
28
32
36
40
7/2014
10/20…
1/2015
4/2015
7/2015
10/20…
1/2016
4/2016
7/2016
10/20…
1/2017
4/2017
7/2017
10/20…
1/2018
4/2018
7/2018
10/20…
1/2019
4/2019
7/2019
10/20…
1/2020
4/2020
7/2020
10/20…
1/2021
4/2021
China Asia Pacific Japan Europe Americas
USD b
0.0
500.0
1,000.0
1,500.0
2,000.0
2,500.0
3,000.0
3,500.0
4,000.0
Jul-
14
Nov-1
4
Mar-
15
Jul-
15
Nov-1
5
Mar-
16
Jul-
16
Nov-1
6
Mar-
17
Jul-
17
Nov-1
7
Mar-
18
Jul-
18
Nov-1
8
Mar-
19
Jul-
19
Nov-1
9
Mar-
20
Jul-
20
Nov-2
0
Mar-
21
USD m
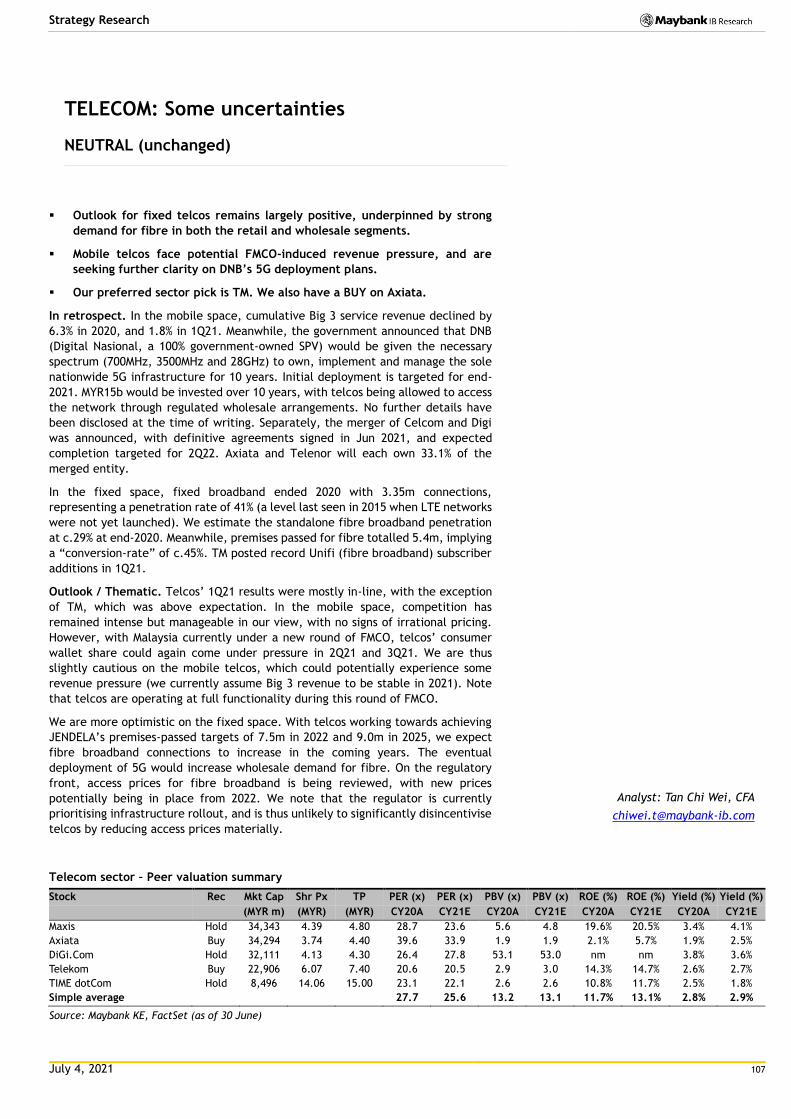
July 4, 2021 107
Strategy Research
TELECOM: Some uncertainties
NEUTRAL (unchanged)
Outlook for fixed telcos remains largely positive, underpinned by strong
demand for fibre in both the retail and wholesale segments.
Mobile telcos face potential FMCO-induced revenue pressure, and are
seeking further clarity on DNB’s 5G deployment plans.
Our preferred sector pick is TM. We also have a BUY on Axiata.
In retrospect. In the mobile space, cumulative Big 3 service revenue declined by
6.3% in 2020, and 1.8% in 1Q21. Meanwhile, the government announced that DNB
(Digital Nasional, a 100% government-owned SPV) would be given the necessary
spectrum (700MHz, 3500MHz and 28GHz) to own, implement and manage the sole
nationwide 5G infrastructure for 10 years. Initial deployment is targeted for end-
2021. MYR15b would be invested over 10 years, with telcos being allowed to access
the network through regulated wholesale arrangements. No further details have
been disclosed at the time of writing. Separately, the merger of Celcom and Digi
was announced, with definitive agreements signed in Jun 2021, and expected
completion targeted for 2Q22. Axiata and Telenor will each own 33.1% of the
merged entity.
In the fixed space, fixed broadband ended 2020 with 3.35m connections,
representing a penetration rate of 41% (a level last seen in 2015 when LTE networks
were not yet launched). We estimate the standalone fibre broadband penetration
at c.29% at end-2020. Meanwhile, premises passed for fibre totalled 5.4m, implying
a “conversion-rate” of c.45%. TM posted record Unifi (fibre broadband) subscriber
additions in 1Q21.
Outlook / Thematic. Telcos’ 1Q21 results were mostly in-line, with the exception
of TM, which was above expectation. In the mobile space, competition has
remained intense but manageable in our view, with no signs of irrational pricing.
However, with Malaysia currently under a new round of FMCO, telcos’ consumer
wallet share could again come under pressure in 2Q21 and 3Q21. We are thus
slightly cautious on the mobile telcos, which could potentially experience some
revenue pressure (we currently assume Big 3 revenue to be stable in 2021). Note
that telcos are operating at full functionality during this round of FMCO.
We are more optimistic on the fixed space. With telcos working towards achieving
JENDELA’s premises-passed targets of 7.5m in 2022 and 9.0m in 2025, we expect
fibre broadband connections to increase in the coming years. The eventual
deployment of 5G would increase wholesale demand for fibre. On the regulatory
front, access prices for fibre broadband is being reviewed, with new prices
potentially being in place from 2022. We note that the regulator is currently
prioritising infrastructure rollout, and is thus unlikely to significantly disincentivise
telcos by reducing access prices materially.
Telecom sector – Peer valuation summary
Stock Rec Mkt Cap Shr Px TP PER (x) PER (x) PBV (x) PBV (x) ROE (%) ROE (%) Yield (%) Yield (%)
(MYR m) (MYR) (MYR) CY20A CY21E CY20A CY21E CY20A CY21E CY20A CY21E
Maxis Hold 34,343 4.39 4.80 28.7 23.6 5.6 4.8 19.6% 20.5% 3.4% 4.1%
Axiata Buy 34,294 3.74 4.40 39.6 33.9 1.9 1.9 2.1% 5.7% 1.9% 2.5%
DiGi.Com Hold 32,111 4.13 4.30 26.4 27.8 53.1 53.0 nm nm 3.8% 3.6%
Telekom Buy 22,906 6.07 7.40 20.6 20.5 2.9 3.0 14.3% 14.7% 2.6% 2.7%
TIME dotCom Hold 8,496 14.06 15.00 23.1 22.1 2.6 2.6 10.8% 11.7% 2.5% 1.8%
Simple average 27.7 25.6 13.2 13.1 11.7% 13.1% 2.8% 2.9%
Source: Maybank KE, FactSet (as of 30 June)
Analyst: Tan Chi Wei, CFA
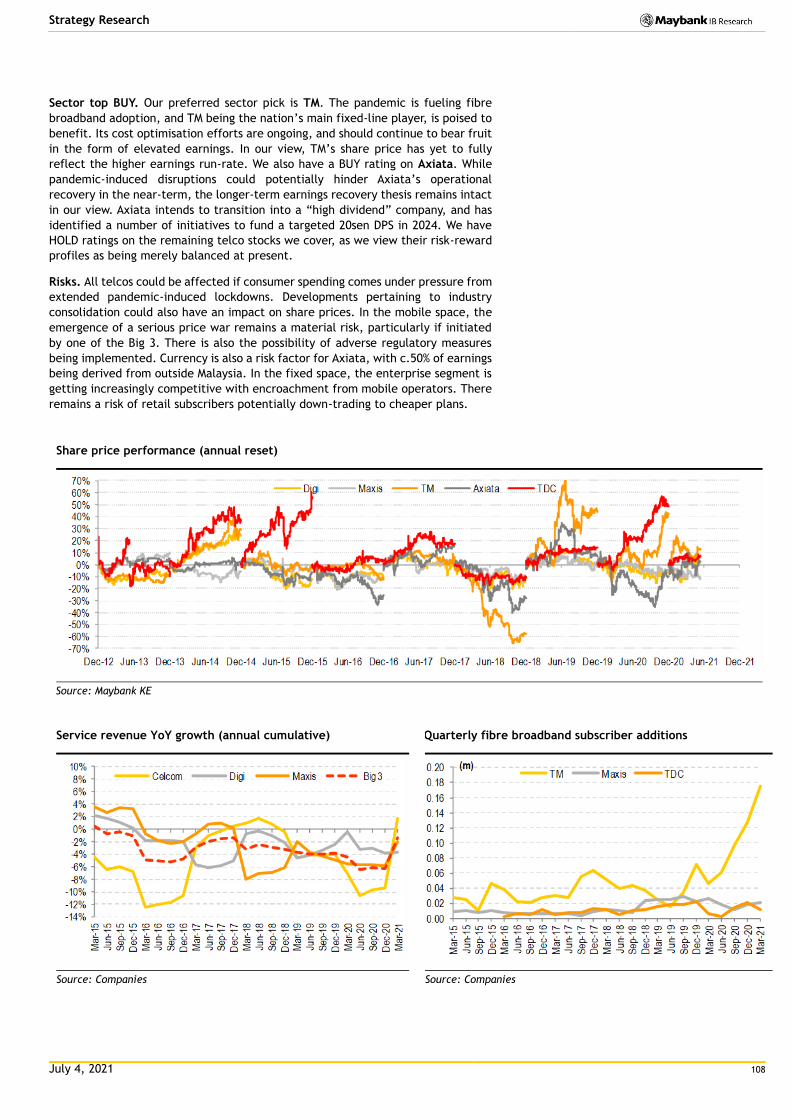
July 4, 2021 108
Strategy Research
Sector top BUY. Our preferred sector pick is TM. The pandemic is fueling fibre
broadband adoption, and TM being the nation’s main fixed-line player, is poised to
benefit. Its cost optimisation efforts are ongoing, and should continue to bear fruit
in the form of elevated earnings. In our view, TM’s share price has yet to fully
reflect the higher earnings run-rate. We also have a BUY rating on Axiata. While
pandemic-induced disruptions could potentially hinder Axiata’s operational
recovery in the near-term, the longer-term earnings recovery thesis remains intact
in our view. Axiata intends to transition into a “high dividend” company, and has
identified a number of initiatives to fund a targeted 20sen DPS in 2024. We have
HOLD ratings on the remaining telco stocks we cover, as we view their risk-reward
profiles as being merely balanced at present.
Risks. All telcos could be affected if consumer spending comes under pressure from
extended pandemic-induced lockdowns. Developments pertaining to industry
consolidation could also have an impact on share prices. In the mobile space, the
emergence of a serious price war remains a material risk, particularly if initiated
by one of the Big 3. There is also the possibility of adverse regulatory measures
being implemented. Currency is also a risk factor for Axiata, with c.50% of earnings
being derived from outside Malaysia. In the fixed space, the enterprise segment is
getting increasingly competitive with encroachment from mobile operators. There
remains a risk of retail subscribers potentially down-trading to cheaper plans.
Share price performance (annual reset)
Source: Maybank KE
Service revenue YoY growth (annual cumulative) Quarterly fibre broadband subscriber additions
Source: Companies Source: Companies
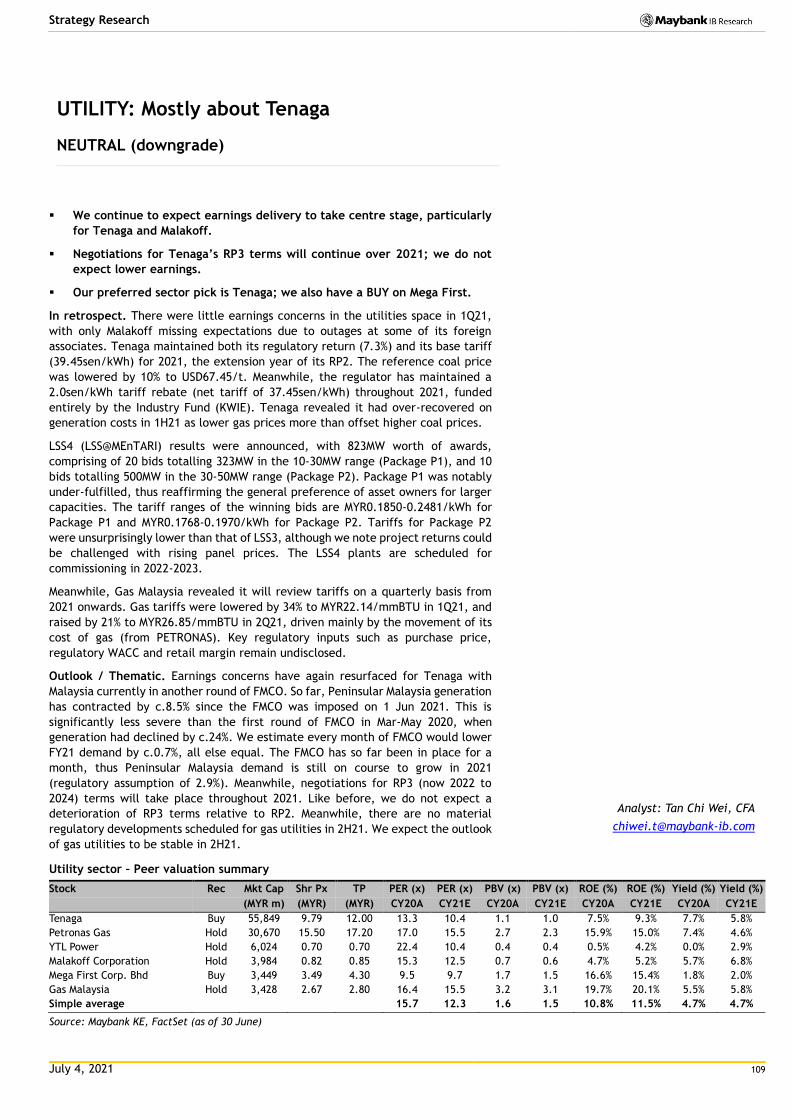
July 4, 2021 109
Strategy Research
UTILITY: Mostly about Tenaga
NEUTRAL (downgrade)
We continue to expect earnings delivery to take centre stage, particularly
for Tenaga and Malakoff.
Negotiations for Tenaga’s RP3 terms will continue over 2021; we do not
expect lower earnings.
Our preferred sector pick is Tenaga; we also have a BUY on Mega First.
In retrospect. There were little earnings concerns in the utilities space in 1Q21,
with only Malakoff missing expectations due to outages at some of its foreign
associates. Tenaga maintained both its regulatory return (7.3%) and its base tariff
(39.45sen/kWh) for 2021, the extension year of its RP2. The reference coal price
was lowered by 10% to USD67.45/t. Meanwhile, the regulator has maintained a
2.0sen/kWh tariff rebate (net tariff of 37.45sen/kWh) throughout 2021, funded
entirely by the Industry Fund (KWIE). Tenaga revealed it had over-recovered on
generation costs in 1H21 as lower gas prices more than offset higher coal prices.
LSS4 (LSS@MEnTARI) results were announced, with 823MW worth of awards,
comprising of 20 bids totalling 323MW in the 10-30MW range (Package P1), and 10
bids totalling 500MW in the 30-50MW range (Package P2). Package P1 was notably
under-fulfilled, thus reaffirming the general preference of asset owners for larger
capacities. The tariff ranges of the winning bids are MYR0.1850-0.2481/kWh for
Package P1 and MYR0.1768-0.1970/kWh for Package P2. Tariffs for Package P2
were unsurprisingly lower than that of LSS3, although we note project returns could
be challenged with rising panel prices. The LSS4 plants are scheduled for
commissioning in 2022-2023.
Meanwhile, Gas Malaysia revealed it will review tariffs on a quarterly basis from
2021 onwards. Gas tariffs were lowered by 34% to MYR22.14/mmBTU in 1Q21, and
raised by 21% to MYR26.85/mmBTU in 2Q21, driven mainly by the movement of its
cost of gas (from PETRONAS). Key regulatory inputs such as purchase price,
regulatory WACC and retail margin remain undisclosed.
Outlook / Thematic. Earnings concerns have again resurfaced for Tenaga with
Malaysia currently in another round of FMCO. So far, Peninsular Malaysia generation
has contracted by c.8.5% since the FMCO was imposed on 1 Jun 2021. This is
significantly less severe than the first round of FMCO in Mar-May 2020, when
generation had declined by c.24%. We estimate every month of FMCO would lower
FY21 demand by c.0.7%, all else equal. The FMCO has so far been in place for a
month, thus Peninsular Malaysia demand is still on course to grow in 2021
(regulatory assumption of 2.9%). Meanwhile, negotiations for RP3 (now 2022 to
2024) terms will take place throughout 2021. Like before, we do not expect a
deterioration of RP3 terms relative to RP2. Meanwhile, there are no material
regulatory developments scheduled for gas utilities in 2H21. We expect the outlook
of gas utilities to be stable in 2H21.
Utility sector – Peer valuation summary
Stock Rec Mkt Cap Shr Px TP PER (x) PER (x) PBV (x) PBV (x) ROE (%) ROE (%) Yield (%) Yield (%)
(MYR m) (MYR) (MYR) CY20A CY21E CY20A CY21E CY20A CY21E CY20A CY21E
Tenaga Buy 55,849 9.79 12.00 13.3 10.4 1.1 1.0 7.5% 9.3% 7.7% 5.8%
Petronas Gas Hold 30,670 15.50 17.20 17.0 15.5 2.7 2.3 15.9% 15.0% 7.4% 4.6%
YTL Power Hold 6,024 0.70 0.70 22.4 10.4 0.4 0.4 0.5% 4.2% 0.0% 2.9%
Malakoff Corporation Hold 3,984 0.82 0.85 15.3 12.5 0.7 0.6 4.7% 5.2% 5.7% 6.8%
Mega First Corp. Bhd Buy 3,449 3.49 4.30 9.5 9.7 1.7 1.5 16.6% 15.4% 1.8% 2.0%
Gas Malaysia Hold 3,428 2.67 2.80 16.4 15.5 3.2 3.1 19.7% 20.1% 5.5% 5.8%
Simple average 15.7 12.3 1.6 1.5 10.8% 11.5% 4.7% 4.7%
Source: Maybank KE, FactSet (as of 30 June)
Analyst: Tan Chi Wei, CFA
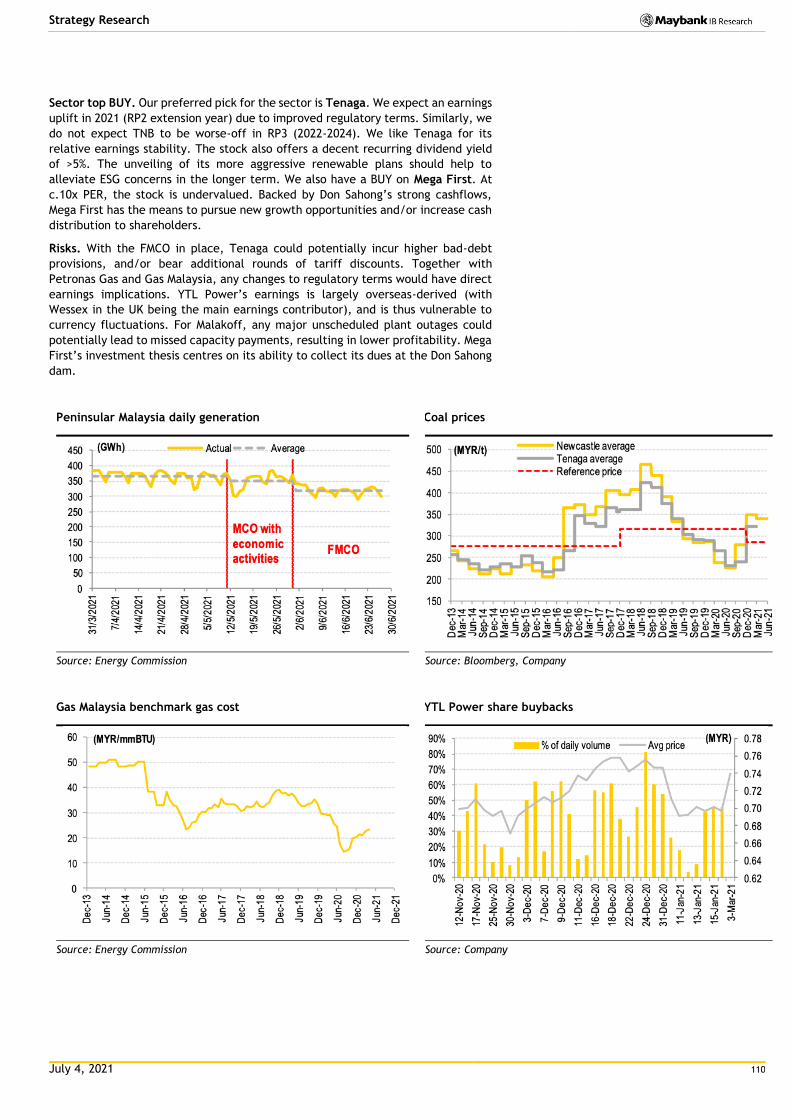
July 4, 2021 110
Strategy Research
Sector top BUY. Our preferred pick for the sector is Tenaga. We expect an earnings
uplift in 2021 (RP2 extension year) due to improved regulatory terms. Similarly, we
do not expect TNB to be worse-off in RP3 (2022-2024). We like Tenaga for its
relative earnings stability. The stock also offers a decent recurring dividend yield
of >5%. The unveiling of its more aggressive renewable plans should help to
alleviate ESG concerns in the longer term. We also have a BUY on Mega First. At
c.10x PER, the stock is undervalued. Backed by Don Sahong’s strong cashflows,
Mega First has the means to pursue new growth opportunities and/or increase cash
distribution to shareholders.
Risks. With the FMCO in place, Tenaga could potentially incur higher bad-debt
provisions, and/or bear additional rounds of tariff discounts. Together with
Petronas Gas and Gas Malaysia, any changes to regulatory terms would have direct
earnings implications. YTL Power’s earnings is largely overseas-derived (with
Wessex in the UK being the main earnings contributor), and is thus vulnerable to
currency fluctuations. For Malakoff, any major unscheduled plant outages could
potentially lead to missed capacity payments, resulting in lower profitability. Mega
First’s investment thesis centres on its ability to collect its dues at the Don Sahong
dam.
Peninsular Malaysia daily generation Coal prices
Source: Energy Commission Source: Bloomberg, Company
Gas Malaysia benchmark gas cost YTL Power share buybacks
Source: Energy Commission Source: Company
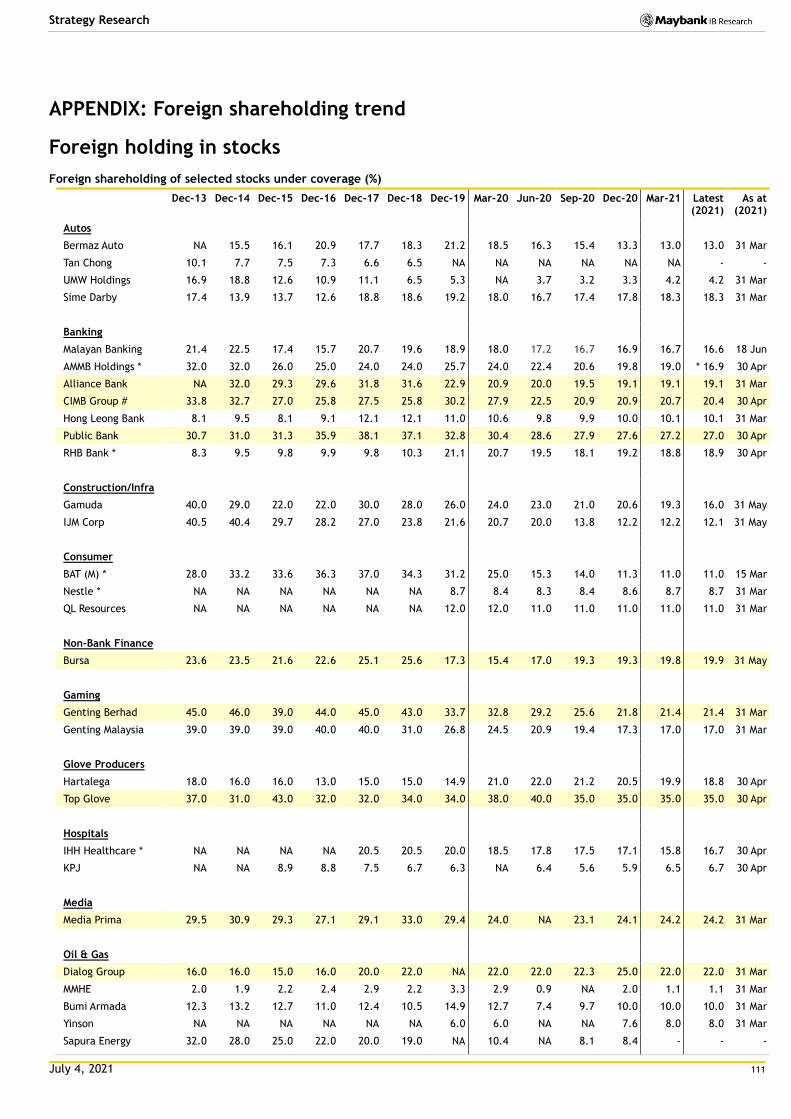
July 4, 2021 111
Strategy Research
APPENDIX: Foreign shareholding trend
Foreign holding in stocks
Foreign shareholding of selected stocks under coverage (%)
Dec-13 Dec-14 Dec-15 Dec-16 Dec-17 Dec-18 Dec-19 Mar-20 Jun-20 Sep-20 Dec-20 Mar-21 Latest (2021)
As at (2021)
Autos
Bermaz Auto NA 15.5 16.1 20.9 17.7 18.3 21.2 18.5 16.3 15.4 13.3 13.0 13.0 31 Mar
Tan Chong 10.1 7.7 7.5 7.3 6.6 6.5 NA NA NA NA NA NA - -
UMW Holdings 16.9 18.8 12.6 10.9 11.1 6.5 5.3 NA 3.7 3.2 3.3 4.2 4.2 31 Mar
Sime Darby 17.4 13.9 13.7 12.6 18.8 18.6 19.2 18.0 16.7 17.4 17.8 18.3 18.3 31 Mar
Banking
Malayan Banking 21.4 22.5 17.4 15.7 20.7 19.6 18.9 18.0 17.2 16.7 16.9 16.7 16.6 18 Jun
AMMB Holdings * 32.0 32.0 26.0 25.0 24.0 24.0 25.7 24.0 22.4 20.6 19.8 19.0 * 16.9 30 Apr
Alliance Bank NA 32.0 29.3 29.6 31.8 31.6 22.9 20.9 20.0 19.5 19.1 19.1 19.1 31 Mar
CIMB Group # 33.8 32.7 27.0 25.8 27.5 25.8 30.2 27.9 22.5 20.9 20.9 20.7 20.4 30 Apr
Hong Leong Bank 8.1 9.5 8.1 9.1 12.1 12.1 11.0 10.6 9.8 9.9 10.0 10.1 10.1 31 Mar
Public Bank 30.7 31.0 31.3 35.9 38.1 37.1 32.8 30.4 28.6 27.9 27.6 27.2 27.0 30 Apr
RHB Bank * 8.3 9.5 9.8 9.9 9.8 10.3 21.1 20.7 19.5 18.1 19.2 18.8 18.9 30 Apr
Construction/Infra
Gamuda 40.0 29.0 22.0 22.0 30.0 28.0 26.0 24.0 23.0 21.0 20.6 19.3 16.0 31 May
IJM Corp 40.5 40.4 29.7 28.2 27.0 23.8 21.6 20.7 20.0 13.8 12.2 12.2 12.1 31 May
Consumer
BAT (M) * 28.0 33.2 33.6 36.3 37.0 34.3 31.2 25.0 15.3 14.0 11.3 11.0 11.0 15 Mar
Nestle * NA NA NA NA NA NA 8.7 8.4 8.3 8.4 8.6 8.7 8.7 31 Mar
QL Resources NA NA NA NA NA NA 12.0 12.0 11.0 11.0 11.0 11.0 11.0 31 Mar
Non-Bank Finance
Bursa 23.6 23.5 21.6 22.6 25.1 25.6 17.3 15.4 17.0 19.3 19.3 19.8 19.9 31 May
Gaming
Genting Berhad 45.0 46.0 39.0 44.0 45.0 43.0 33.7 32.8 29.2 25.6 21.8 21.4 21.4 31 Mar
Genting Malaysia 39.0 39.0 39.0 40.0 40.0 31.0 26.8 24.5 20.9 19.4 17.3 17.0 17.0 31 Mar
Glove Producers
Hartalega 18.0 16.0 16.0 13.0 15.0 15.0 14.9 21.0 22.0 21.2 20.5 19.9 18.8 30 Apr
Top Glove 37.0 31.0 43.0 32.0 32.0 34.0 34.0 38.0 40.0 35.0 35.0 35.0 35.0 30 Apr
Hospitals
IHH Healthcare * NA NA NA NA 20.5 20.5 20.0 18.5 17.8 17.5 17.1 15.8 16.7 30 Apr
KPJ NA NA 8.9 8.8 7.5 6.7 6.3 NA 6.4 5.6 5.9 6.5 6.7 30 Apr
Media
Media Prima 29.5 30.9 29.3 27.1 29.1 33.0 29.4 24.0 NA 23.1 24.1 24.2 24.2 31 Mar
Oil & Gas
Dialog Group 16.0 16.0 15.0 16.0 20.0 22.0 NA 22.0 22.0 22.3 25.0 22.0 22.0 31 Mar
MMHE 2.0 1.9 2.2 2.4 2.9 2.2 3.3 2.9 0.9 NA 2.0 1.1 1.1 31 Mar
Bumi Armada 12.3 13.2 12.7 11.0 12.4 10.5 14.9 12.7 7.4 9.7 10.0 10.0 10.0 31 Mar
Yinson NA NA NA NA NA NA 6.0 6.0 NA NA 7.6 8.0 8.0 31 Mar
Sapura Energy 32.0 28.0 25.0 22.0 20.0 19.0 NA 10.4 NA 8.1 8.4 - - -
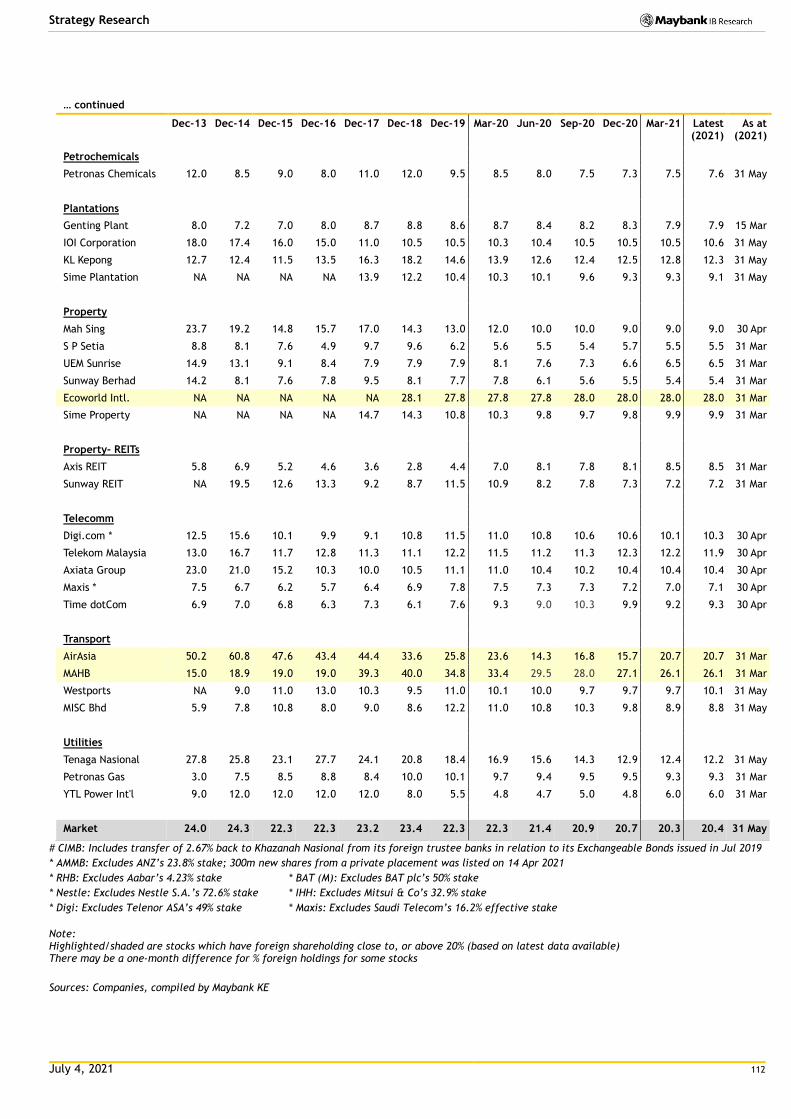
July 4, 2021 112
Strategy Research
… continued
Dec-13 Dec-14 Dec-15 Dec-16 Dec-17 Dec-18 Dec-19 Mar-20 Jun-20 Sep-20 Dec-20 Mar-21 Latest (2021)
As at (2021)
Petrochemicals
Petronas Chemicals 12.0 8.5 9.0 8.0 11.0 12.0 9.5 8.5 8.0 7.5 7.3 7.5 7.6 31 May
Plantations
Genting Plant 8.0 7.2 7.0 8.0 8.7 8.8 8.6 8.7 8.4 8.2 8.3 7.9 7.9 15 Mar
IOI Corporation 18.0 17.4 16.0 15.0 11.0 10.5 10.5 10.3 10.4 10.5 10.5 10.5 10.6 31 May
KL Kepong 12.7 12.4 11.5 13.5 16.3 18.2 14.6 13.9 12.6 12.4 12.5 12.8 12.3 31 May
Sime Plantation NA NA NA NA 13.9 12.2 10.4 10.3 10.1 9.6 9.3 9.3 9.1 31 May
Property
Mah Sing 23.7 19.2 14.8 15.7 17.0 14.3 13.0 12.0 10.0 10.0 9.0 9.0 9.0 30 Apr
S P Setia 8.8 8.1 7.6 4.9 9.7 9.6 6.2 5.6 5.5 5.4 5.7 5.5 5.5 31 Mar
UEM Sunrise 14.9 13.1 9.1 8.4 7.9 7.9 7.9 8.1 7.6 7.3 6.6 6.5 6.5 31 Mar
Sunway Berhad 14.2 8.1 7.6 7.8 9.5 8.1 7.7 7.8 6.1 5.6 5.5 5.4 5.4 31 Mar
Ecoworld Intl. NA NA NA NA NA 28.1 27.8 27.8 27.8 28.0 28.0 28.0 28.0 31 Mar
Sime Property NA NA NA NA 14.7 14.3 10.8 10.3 9.8 9.7 9.8 9.9 9.9 31 Mar
Property- REITs
Axis REIT 5.8 6.9 5.2 4.6 3.6 2.8 4.4 7.0 8.1 7.8 8.1 8.5 8.5 31 Mar
Sunway REIT NA 19.5 12.6 13.3 9.2 8.7 11.5 10.9 8.2 7.8 7.3 7.2 7.2 31 Mar
Telecomm
Digi.com * 12.5 15.6 10.1 9.9 9.1 10.8 11.5 11.0 10.8 10.6 10.6 10.1 10.3 30 Apr Telekom Malaysia 13.0 16.7 11.7 12.8 11.3 11.1 12.2 11.5 11.2 11.3 12.3 12.2 11.9 30 Apr Axiata Group 23.0 21.0 15.2 10.3 10.0 10.5 11.1 11.0 10.4 10.2 10.4 10.4 10.4 30 Apr Maxis * 7.5 6.7 6.2 5.7 6.4 6.9 7.8 7.5 7.3 7.3 7.2 7.0 7.1 30 Apr Time dotCom 6.9 7.0 6.8 6.3 7.3 6.1 7.6 9.3 9.0 10.3 9.9 9.2 9.3 30 Apr
Transport
AirAsia 50.2 60.8 47.6 43.4 44.4 33.6 25.8 23.6 14.3 16.8 15.7 20.7 20.7 31 Mar
MAHB 15.0 18.9 19.0 19.0 39.3 40.0 34.8 33.4 29.5 28.0 27.1 26.1 26.1 31 Mar
Westports NA 9.0 11.0 13.0 10.3 9.5 11.0 10.1 10.0 9.7 9.7 9.7 10.1 31 May
MISC Bhd 5.9 7.8 10.8 8.0 9.0 8.6 12.2 11.0 10.8 10.3 9.8 8.9 8.8 31 May
Utilities
Tenaga Nasional 27.8 25.8 23.1 27.7 24.1 20.8 18.4 16.9 15.6 14.3 12.9 12.4 12.2 31 May
Petronas Gas 3.0 7.5 8.5 8.8 8.4 10.0 10.1 9.7 9.4 9.5 9.5 9.3 9.3 31 Mar
YTL Power Int'l 9.0 12.0 12.0 12.0 12.0 8.0 5.5 4.8 4.7 5.0 4.8 6.0 6.0 31 Mar
Market 24.0 24.3 22.3 22.3 23.2 23.4 22.3 22.3 21.4 20.9 20.7 20.3 20.4 31 May
# CIMB: Includes transfer of 2.67% back to Khazanah Nasional from its foreign trustee banks in relation to its Exchangeable Bonds issued in Jul 2019
* AMMB: Excludes ANZ’s 23.8% stake; 300m new shares from a private placement was listed on 14 Apr 2021
* RHB: Excludes Aabar’s 4.23% stake * BAT (M): Excludes BAT plc’s 50% stake
* Nestle: Excludes Nestle S.A.’s 72.6% stake * IHH: Excludes Mitsui & Co’s 32.9% stake
* Digi: Excludes Telenor ASA’s 49% stake * Maxis: Excludes Saudi Telecom’s 16.2% effective stake
Note: Highlighted/shaded are stocks which have foreign shareholding close to, or above 20% (based on latest data available) There may be a one-month difference for % foreign holdings for some stocks
Sources: Companies, compiled by Maybank KE
July 4, 2021 113
Strategy Research
Research Offices
ECONOMICS
Suhaimi ILIAS Chief Economist Malaysia | Philippines | Global (603) 2297 8682 [email protected]
CHUA Hak Bin Regional Thematic Macroeconomist (65) 6231 5830 [email protected]
LEE Ju Ye Singapore | Thailand | Indonesia (65) 6231 5844 [email protected]
Linda LIU Singapore | Vietnam | Cambodia | Myanmar | Laos (65) 6231 5847 [email protected]
Dr Zamros DZULKAFLI (603) 2082 6818 [email protected]
Ramesh LANKANATHAN (603) 2297 8685 [email protected]
FX
Saktiandi SUPAAT Head of FX Research (65) 6320 1379 [email protected]
Christopher WONG (65) 6320 1347 [email protected]
TAN Yanxi (65) 6320 1378 [email protected]
Fiona LIM (65) 6320 1374 [email protected]
STRATEGY
Anand PATHMAKANTHAN
ASEAN (603) 2297 8783 [email protected]
FIXED INCOME
Winson PHOON, ACA (65) 6340 1079 [email protected]
SE THO Mun Yi (603) 2074 7606 [email protected]
REGIONAL EQUITIES
Anand PATHMAKANTHAN Head of Regional Equity Research (603) 2297 8783 [email protected]
WONG Chew Hann, CA Head of ASEAN Equity Research (603) 2297 8686 [email protected]
ONG Seng Yeow Research, Technology & Innovation (65) 6231 5839 [email protected]
MALAYSIA
Anand PATHMAKANTHAN Head of Research (603) 2297 8783 [email protected] • Strategy
WONG Chew Hann (603) 2297 8686
[email protected] • Non-Bank Financials (stock exchange) • Construction & Infrastructure
Desmond CH’NG, BFP, FCA (603) 2297 8680 [email protected] • Banking & Finance
LIAW Thong Jung (603) 2297 8688 [email protected] • Oil & Gas Services- Regional • Automotive
ONG Chee Ting, CA (603) 2297 8678 [email protected] • Plantations - Regional
YIN Shao Yang, CPA (603) 2297 8916 [email protected] • Gaming – Regional • Media • Aviation • Non-Bank Financials
TAN Chi Wei, CFA (603) 2297 8690 [email protected] • Power • Telcos
WONG Wei Sum, CFA (603) 2297 8679 [email protected] • Property • Glove
Kevin WONG (603) 2082 6824 [email protected] • REITs • Technology
Jade TAM (603) 2297 8687 [email protected] • Consumer Staples & Discretionary
Fahmi FARID (603) 2297 8676 [email protected] • Software
TEE Sze Chiah Head of Retail Research (603) 2082 6858 [email protected]
Nik Ihsan RAJA ABDULLAH, MSTA, CFTe (603) 2297 8694 [email protected] • Chartist
Amirah AZMI (603) 2082 8769 [email protected] • Retail Research
INDIA
Jigar SHAH Head of Research (91) 22 4223 2632 [email protected] • Strategy • Oil & Gas • Automobile • Cement
Neerav DALAL (91) 22 4223 2606 [email protected] • Software Technology • Telcos
Vikram RAMALINGAM (91) 22 4223 2607 [email protected] • Automobile • Media
SINGAPORE
Thilan WICKRAMASINGHE Head of Research (65) 6231 5840 [email protected] • Banking & Finance - Regional • Consumer
CHUA Su Tye (65) 6231 5842 [email protected] • REITs - Regional
LAI Gene Lih, CFA (65) 6231 5832 [email protected] • Technology • Healthcare
Kareen CHAN (65) 6231 5926 [email protected] • Transport • Telcos • Consumer
Eric ONG (65) 6231 5924 [email protected] • SMIDs
Matthew SHIM (65) 6231 5929 [email protected]
• Retail Research
PHILIPPINES
Jacqui de JESUS Head of Research (63) 2 8849 8840 [email protected] • Strategy • Conglomerates
Rachelleen RODRIGUEZ, CFA (63) 2 8849 8843 [email protected] • Banking & Finance • Transport • Telcos
Benedict CLEMENTE (63) 2 8849 8846 [email protected] • Utilities
Daphne SZE (63) 2 8849 8847 [email protected] • Consumer
VIETNAM
Quan Trong Thanh Head of Research (84 28) 44 555 888 ext 8184 [email protected] • Banks
Hoang Huy, CFA (84 28) 44 555 888 ext 8181 [email protected] • Strategy • Technology
Le Nguyen Nhat Chuyen (84 28) 44 555 888 ext 8082 [email protected] • Oil & Gas
Nguyen Thi Sony Tra Mi (84 28) 44 555 888 ext 8084 [email protected] • Consumer
Tyler Manh Dung Nguyen (84 28) 44 555 888 ext 8085 [email protected] • Utilities • Property
Tran Thi Thu Thao (84 28) 44 555 888 ext 8180 [email protected] • Industrials
Nguyen Thi Ngan Tuyen Head of Retail Research (84 28) 44 555 888 ext 8081 [email protected] • Retail Research
Nguyen Thanh Lam (84 28) 44 555 888 ext 8086 [email protected] • Technical Analysis
INDONESIA
Isnaputra ISKANDAR Head of Research (62) 21 8066 8680 [email protected] • Strategy • Metals & Mining • Cement • Autos • Consumer • Utility
Rahmi MARINA (62) 21 8066 8689 [email protected] • Banking & Finance
Willy GOUTAMA (62) 21 8066 8500 [email protected] • Consumer
Farah OKTAVIANI (62) 21 8066 8691 [email protected] • Construction
THAILAND
Maria LAPIZ Head of Institutional Research
Dir (66) 2257 0250 | (66) 2658 6300 ext 1399 [email protected] • Strategy • Consumer • Materials • Services
Jesada TECHAHUSDIN, CFA (66) 2658 6300 ext 1395 [email protected] • Banking & Finance
Kaushal LADHA, CFA (66) 2658 6300 ext 1392 [email protected] • Oil & Gas – Regional • Petrochemicals - Regional • Utilities
Vanida GEISLER, CPA (66) 2658 6300 ext 1394 [email protected] • Property • REITs
Yuwanee PROMMAPORN (66) 2658 6300 ext 1393 Yuwanee.P @maybank-ke.co.th • Services • Healthcare
Ekachai TARAPORNTIP Head of Retail Research (66) 2658 5000 ext 1530 [email protected]
Surachai PRAMUALCHAROENKIT (66) 2658 5000 ext 1470 [email protected] • Auto • Conmat • Contractor • Steel
Suttatip PEERASUB (66) 2658 5000 ext 1430 [email protected] • Food & Beverage • Commerce
Jaroonpan WATTANAWONG (66) 2658 5000 ext 1404 [email protected] • Transportation • Small cap
Thanatphat SUKSRICHAVALIT (66) 2658 5000 ext 1401 [email protected] • Media • Electronics
Wijit ARAYAPISIT (66) 2658 5000 ext 1450 [email protected] • Strategist
Theerasate PROMPONG
(66) 2658 5000 ext 1400 [email protected] • Equity Portfolio Strategist
Apiwat TAVESIRIVATE (66) 2658 5000 ext 1310 [email protected] • Chartist and TFEX
July 4, 2021 114
Strategy Research
APPENDIX I: TERMS FOR PROVISION OF REPORT, DISCLAIMERS AND DISCLOSURES
DISCLAIMERS This research report is prepared for general circulation and for information purposes only and under no circumstances should it be considered or intended as an offer to sell or a solicitation of an offer to buy the securities referred to herein. Investors should note that values of such securities, if any, may fluctuate and that each security’s price or value may rise or fall. Opinions or recommendations contained herein are in form of technical ratings and fundamental ratings. Technical ratings may differ from fundamental ratings as technical valuations apply different methodologies and are purely based on price and volume-related information extracted from the relevant jurisdiction’s stock exchange in the equity analysis. Accordingly, investors’ returns may be less than the original sum invested. Past performance is not necessarily a guide to future performance. This report is not intended to provide personal investment advice and does not take into account the specific investment objectives, the financial situation and the particular needs of persons who may receive or read this report. Investors should therefore seek financial, legal and other advice regarding the appropriateness of investing in any securities or the investment strategies discussed or recommended in this report.
The information contained herein has been obtained from sources believed to be reliable but such sources have not been independently verified by Maybank Investment Bank Berhad, its subsidiary and affiliates (collectively, “MKE”) and consequently no representation is made as to the accuracy or completeness of this report by MKE and it should not be relied upon as such. Accordingly, MKE and its officers, directors, associates, connected parties and/or employees (collectively, “Representatives”) shall not be liable for any direct, indirect or consequential losses or damages that may arise from the use or reliance of this report. Any information, opinions or recommendations contained herein are subject to change at any time, without prior notice.
This report may contain forward looking statements which are often but not always identified by the use of words such as “anticipate”, “believe”, “estimate”, “intend”, “plan”, “expect”, “forecast”, “predict” and “project” and statements that an event or result “may”, “will”, “can”, “should”, “could” or “might” occur or be achieved and other similar expressions. Such forward looking statements are based on assumptions made and information currently available to us and are subject to certain risks and uncertainties that could cause the actual results to differ materially from those expressed in any forward looking statements. Readers are cautioned not to place undue relevance on these forward-looking statements. MKE expressly disclaims any obligation to update or revise any such forward looking statements to reflect new information, events or circumstances af ter the date of this publication or to reflect the occurrence of unanticipated events.
MKE and its officers, directors and employees, including persons involved in the preparation or issuance of this report, may, to the extent permitted by law, from time to time participate or invest in financing transactions with the issuer(s) of the securities mentioned in this report, perform services for or solicit business from such issuers, and/or have a position or holding, or other material interest, or effect transactions, in such securities or options thereon, or other investments related there to. In addition, it may make markets in the securities mentioned in the material presented in this report. One or more directors, officers and/or employees of MKE may be a director of the issue rs of the securities mentioned in this report to the extent permitted by law.
This report is prepared for the use of MKE’s clients and may not be reproduced, altered in any way, transmitted to, copied or distributed to any other party in whole or in part in any form or manner without the prior express written consent of MKE and MKE and its Representatives accepts no liability whatsoever for the actions of third parties in this respect.
This report is not directed to or intended for distribution to or use by any person or entity who is a citizen or resident of or located in any locality, state, country or other jurisdiction where such distribution, publication, availability or use would be contrary to law or regulation. This report is for distribution only under such circumstances as may be permitted by applicable law. The securities described herein may not be eligible for sale in all jurisdictions or to certain categories of investors. Without prejudice to the foregoing, the reader is to note that additional disclaimers, warnings or qualifications may apply based on geographical location of the person or entity receiving this report.
Malaysia Opinions or recommendations contained herein are in the form of technical ratings and fundamental ratings. Technical ratings may differ from fundamental ratings as technical valuations apply different methodologies and are purely based on price and volume-related information extracted from Bursa Malaysia Securities Berhad in the equity analysis.
Singapore This report has been produced as of the date hereof and the information herein may be subject to change. Maybank Kim Eng Research Pte. Ltd. (“Maybank KERPL”) in Singapore has no obligation to update such information for any recipient. For distribution in Singapore, recipients of this report are to contact Maybank KERPL in Singapore in respect of any matters arising from, or in connection with, this report. If the recipient of this report is not an accredited investor, expert investor or i nstitutional investor (as defined under Section 4A of the Singapore Securities and Futures Act), Maybank KERPL shall be legally liable for the contents of this report, with such liability being limited to the extent (if any) as permitted by law.
Thailand Except as specifically permitted, no part of this presentation may be reproduced or distributed in any manner without the prior written permission of Maybank Kim Eng Securities (Thailand) Public Company Limited. Maybank Kim Eng Securities (Thailand) Public Company Limited (“MBKET”) accepts no liability whatsoever for the actions of third parties in this respect.
Due to different characteristics, objectives and strategies of institutional and retail investors, the research products of MBKET Institutional and Retail Research departments may differ in either recommendation or target price, or both. MBKET reserves the rights to disseminate MBKET Retail Research reports to institutional investors who have requested to receive it. If you are an authorised recipient, you hereby tacitly acknowledge that the research reports from MBKET Retail Research are first produced in Thai and there is a time lag in the release of the translated English version.
The disclosure of the survey result of the Thai Institute of Directors Association (“IOD”) regarding corporate governance is made pursuant to the policy of the Office of the Securities and Exchange Commission. The survey of the IOD is based on the information of a company listed on the Stock Exchange of Thailand and the market for Alternative Investment disclosed to the public and able to be accessed by a general public investor. The result, therefore, is from the perspective of a third party. It is not an evaluation of operation and is not based on inside information. The survey result is as of the date appearing in the Corporate Governance Report of Thai Listed Companies. As a result, the survey may be changed after that date. MBKET does not confirm nor certify the accuracy of such survey result.
The disclosure of the Anti-Corruption Progress Indicators of a listed company on the Stock Exchange of Thailand, which is assessed by Thaipat Institute, is made in order to comply with the policy and sustainable development plan for the listed companies of the Office of the Securities and Exchange Commission. Tha ipat Institute made this assessment based on the information received from the listed company, as stipulated in the form for the assessment of Anti-corruption which refers to the Annual Registration Statement (Form 56-1), Annual Report (Form 56-2), or other relevant documents or reports of such listed company. The assessment result is therefore made from the perspective of Thaipat Institute that is a third party. It is not an assessment of operation and is not based on any inside information. Since this assessment is only the assessment result as of the date appearing in the assessment result, it may be changed after that date or when there is any change to the relevant information. Nevertheless, MBKET does not confirm, verify, or certify the accuracy and completeness of the assessment result.
US This third-party research report is distributed in the United States (“US”) to Major US Institutional Investors (as defined in Rule 15a-6 under the Securities Exchange Act of 1934, as amended) only by Maybank Kim Eng Securities USA Inc (“Maybank KESUSA”), a broker-dealer registered in the US (registered under Section 15 of the Securities Exchange Act of 1934, as amended). All responsibility for the distribution of this report by Maybank KESUSA in the US shall be borne by Maybank KESUSA. This report is not directed at you if MKE is prohibited or restricted by any legislation or regulation in any jurisdiction from making it available to you. You should satisfy yourself before reading it that Maybank KESUSA is permitted to provide research material concerning investments to you under relevant legislation and regulations. All U.S. persons receiving and/or accessing this report and wishing to effect transactions in any security mentioned within must do so with: Maybank Kim Eng Securities USA Inc. 400 Park Avenue, 11th Floor, New York, New York 10022, 1-(212) 688-8886 and not with, the issuer of this report.
July 4, 2021 115
Strategy Research
Disclosure of Interest
Malaysia: MKE and its Representatives may from time to time have positions or be materially interested in the securities referred to herein and may further act as market maker or may have assumed an underwriting commitment or deal with such securities and may also perform or seek to perform investment banking services, advisory and other services for or relating to those companies. Singapore: As of 4 July 2021, Maybank KERPL and the covering analyst do not have any interest in any companies recommended in this research report. Thailand: MBKET may have a business relationship with or may possibly be an issuer of derivative warrants on the securities /companies mentioned in the research report. Therefore, Investors should exercise their own judgment before making any investment decisions. MBKET, its associates, directors, connected parties and/or employees may from time to time have interests and/or underwriting commitments in the securities mentioned in this report. Hong Kong: As of 4 July 2021, KESHK and the authoring analyst do not have any interest in any companies recommended in this research report. India: As of 4 July 2021, and at the end of the month immediately preceding the date of publication of the research report, KESI, authoring analyst or their associate / relative does not hold any financial interest or any actual or beneficial ownership in any shares or having any conflict of interest in the subject companies except as otherwise disclosed in the research report.
In the past twelve months KESI and authoring analyst or their associate did not receive any compensation or other benefits from the subject companies or third party in connection with the research report on any account what so ever except as otherwise disclosed in the research report.
MKE may have, within the last three years, served as manager or co-manager of a public offering of securities for, or currently may make a primary market in issues of, any or all of the entities mentioned in this report or may be providing, or have provided within the previous 12 months, significant advice or investment services in relation to the investment concerned or a related investment and may receive compensation for the services provided from the companies covered in this report.
OTHERS
Analyst Certification of Independence
The views expressed in this research report accurately reflect the analyst’s personal views about any and all of the subject securities or issuers; and no part of the research analyst’s compensation was, is or will be, directly or indirectly, related to the specific recommendations or views expressed in the report.
Reminder
Structured securities are complex instruments, typically involve a high degree of risk and are intended for sale only to soph isticated investors who are capable of understanding and assuming the risks involved. The market value of any structured security may be affected by changes in economic, financial and politic al factors (including, but not limited to, spot and forward interest and exchange rates), time to maturity, market conditions and volatility and the credit quality of any issuer or reference issuer. Any investor interested in purchasing a structured product should conduct its own analysis of the product and consult with its own professional advisers as to the risks involved in making such a purchase.
No part of this material may be copied, photocopied or duplicated in any form by any means or redistributed without the prior consent of MKE.
Definition of Ratings
Maybank Kim Eng Research uses the following rating system
BUY Return is expected to be above 10% in the next 12 months (including dividends)
HOLD Return is expected to be between 0% to 10% in the next 12 months (including dividends)
SELL Return is expected to be below 0% in the next 12 months (including dividends)
Applicability of Ratings
The respective analyst maintains a coverage universe of stocks, the list of which may be adjusted according to needs. Investment ratings are only applicable to the stocks which form part of the coverage universe. Reports on companies which are not part of the coverage do not carry investment ratings as we do not actively follow developments in these companies.
UK This document is being distributed by Maybank Kim Eng Securities (London) Ltd (“Maybank KESL”) which is authorized and regulated, by the Financial Conduct Authority and is for Informational Purposes only. This document is not intended for distribution to anyone defined as a Retail Client under the Financial Services and Markets Act 2000 within the UK. Any inclusion of a third party link is for the recipients convenience only, and that the firm does not take any responsibility for its comments or accuracy, and that access to such links is at the individuals own risk. Nothing in this report should be considered as constituting legal, accounting or tax advice, and that for accurate guidance recipients should consult with their own independent tax advisers.
DISCLOSURES
Legal Entities Disclosures Malaysia: This report is issued and distributed in Malaysia by Maybank Investment Bank Berhad (15938- H) which is a Participating Organization of Bursa Malaysia Berhad and a holder of Capital Markets and Services License issued by the Securities Commission in Malaysia. Singapore: This report is distributed in Singapore by Maybank KERPL (Co. Reg No 198700034E) which is regulated by the Monetary Authority of Singapore. Indonesia: PT Maybank Kim Eng Securities (“PTMKES”) (Reg. No. KEP-251/PM/1992) is a member of the Indonesia Stock Exchange and is regulated by the Financial Services Authority (Indonesia). Thailand: MBKET (Reg. No.0107545000314) is a member of the Stock Exchange of Thailand and is regulated by the Ministry of Finance and the Securities and Exchange Commission. Philippines: Maybank ATRKES (Reg. No.01-2004-00019) is a member of the Philippines Stock Exchange and is regulated by the Securities and Exchange Commission. Vietnam: Maybank Kim Eng Securities Limited (License Number: 117/GP-UBCK) is licensed under the State Securities Commission of Vietnam. Hong Kong: KESHK (Central Entity No AAD284) is regulated by the Securities and Futures Commission. India: Kim Eng Securities India Private Limited (“KESI”) is a participant of the National Stock Exchange of India Limited and the Bombay Stock Exchange and is regulated by Securities and Exchange Board of India (“SEBI”) (Reg. No. INZ000010538). KESI is also registered with SEBI as Category 1 Merchant Banker (Reg. No. INM 000011708) and as Research Analyst (Reg No: INH000000057) US: Maybank KESUSA is a member of/ and is authorized and regulated by the FINRA – Broker ID 27861. UK: Maybank KESL (Reg No 2377538) is authorized and regulated by the Financial Conduct Authority.
July 4, 2021 116
Strategy Research
Malaysia Maybank Investment Bank Berhad
(A Participating Organisation of
Bursa Malaysia Securities Berhad)
33rd Floor, Menara Maybank,
100 Jalan Tun Perak,
50050 Kuala Lumpur
Tel: (603) 2059 1888;
Fax: (603) 2078 4194
Singapore Maybank Kim Eng Securities Pte Ltd
Maybank Kim Eng Research Pte Ltd
50 North Canal Road
Singapore 059304
Tel: (65) 6336 9090
London Maybank Kim Eng Securities
(London) Ltd
PNB House
77 Queen Victoria Street
London EC4V 4AY, UK
Tel: (44) 20 7332 0221
Fax: (44) 20 7332 0302
New York Maybank Kim Eng Securities USA
Inc
400 Park Avenue, 11th Floor
New York, New York 10022,
U.S.A.
Tel: (212) 688 8886
Fax: (212) 688 3500
Stockbroking Business:
Level 8, Tower C, Dataran Maybank,
No.1, Jalan Maarof
59000 Kuala Lumpur
Tel: (603) 2297 8888
Fax: (603) 2282 5136
Hong Kong Kim Eng Securities (HK) Ltd
28/F, Lee Garden Three,
1 Sunning Road, Causeway Bay,
Hong Kong
Tel: (852) 2268 0800
Fax: (852) 2877 0104
Indonesia PT Maybank Kim Eng Securities
Sentral Senayan III, 22nd Floor
Jl. Asia Afrika No. 8
Gelora Bung Karno, Senayan
Jakarta 10270, Indonesia
Tel: (62) 21 2557 1188
Fax: (62) 21 2557 1189
India Kim Eng Securities India Pvt Ltd
1101, 11th floor, A Wing, Kanakia
Wall Street, Chakala, Andheri -
Kurla Road, Andheri East,
Mumbai City - 400 093, India
Tel: (91) 22 6623 2600
Fax: (91) 22 6623 2604
Philippines Maybank ATR Kim Eng Securities Inc.
17/F, Tower One & Exchange Plaza
Ayala Triangle, Ayala Avenue
Makati City, Philippines 1200
Tel: (63) 2 8849 8888
Fax: (63) 2 8848 5738
Thailand Maybank Kim Eng Securities
(Thailand) Public Company Limited
999/9 The Offices at Central World,
20th - 21st Floor,
Rama 1 Road Pathumwan,
Bangkok 10330, Thailand
Tel: (66) 2 658 6817 (sales)
Tel: (66) 2 658 6801 (research)
Vietnam Maybank Kim Eng Securities Limited
4A-15+16 Floor Vincom Center Dong
Khoi, 72 Le Thanh Ton St. District 1
Ho Chi Minh City, Vietnam
Tel : (84) 844 555 888
Fax : (84) 8 38 271 030
Saudi Arabia In association with
Anfaal Capital
Ground Floor, KANOO Building
No.1 - Al-Faisaliyah,Madina Road,
P.O.Box 126575 Jeddah 21352
Kingdom of Saudi Arabia
Tel: (966) 920023423
South Asia Sales Trading Kevin Foy
Regional Head Sales Trading
Tel: (65) 6636-3620
US Toll Free: 1-866-406-7447
North Asia Sales Trading Andrew Lee
Tel: (852) 2268 0283
US Toll Free: 1 877 837 7635
Indonesia Iwan Atmadjaja [email protected] (62) 21 8066 8555
London Greg Smith [email protected] Tel: (44) 207-332-0221
New York James Lynch [email protected] Tel: (212) 688 8886
India Sanjay Makhija [email protected] Tel: (91)-22-6623-2629
Philippines Keith Roy [email protected] Tel: (63) 2 848-5288
www.maybank-ke.com | www.maybank-keresearch.com