Embed Size (px)
Citation preview
SILICA IN LOW GRADE REFINERY SUGARS
MADHO S AND DAVIS SB
Sugar Milling Research Institute, c/o University of KwaZulu Natal, Durban, 4041, South Africa [email protected] [email protected]
Abstract Turbidity is an important quality parameter for industrial refined sugar customers, as it possesses the potential to hamper production rates and affect the quality of the end-product manufactured. Every effort is therefore usually made by sugar mills to produce low turbidity and well-filtering refined sugars to attract and maintain customers in a competitive marketplace. In recent years, two South African sugarcane back-end refineries that practise carbonatation and sulphitation intermittently produced sugars with a high turbidity without having experienced poor filter operations, and whilst processing raw sugar that conformed to the mills’ quality specifications. The subsequent investigations revealed that the turbidity had originated only from the third and fourth strikes. Further analyses of filter membranes arranged by the Sugar Milling Research Institute indicated that the turbidity was due to the presence of a precipitated silica gel with embedded fine silica rich flakes derived from crushed cells walls (or bagacillo). This paper discusses these investigations and examines a probable cause of the silica appearing in only the low grade refined sugars.Means of reducing the silica content of refinery liquors are also suggested. Keywords: silica, turbidity, precipitation, solubility, filtration, bagacillo
Introduction High turbidity refined sugars cannot be bagged and have to be re-processed to achieve the target specifications agreed upon by the refinery and its customers (South African industrial refined sugar users typically require an insoluble solids content of less than 10 ppm). The ensuing loss in refining capacity makes it crucial to urgently determine the root cause of the turbidity. However, the causes of high turbidity may not be immediately apparent, and this paper examines case histories where some investigation was required to understand the root of the problem.
The problem being experienced Having experienced turbid sugars, two South African sugarcane back-end carbonatation/sulphitation refineries, after consultation with the Sugar Milling Research Institute (SMRI), performed the SASTA insoluble solids test (Anon, 2009) on the various sugar strikes. During this period of difficulty, it was noted that the raw sugar quality conformed to the refiners’ usual quality specifications (i.e. colour and pol). The refinery filter
Madho S and Davis SB Proc S Afr Sug Technol Ass (2011) 84: 516 - 527
516
stations were also running normal cycles and were well operated with little or no carry-over of suspended solids. Nonetheless, dark residueswere found on the filter membranes from the insoluble solids tests of only the third and fourth sugars.In order to determine the nature of the residues, these filter membranes were then sent to the SMRI for examination and analysis using a Scanning Electron Microscope (SEM) with an auxiliary Energy Dispersive X-ray Spectroscopy system (EDAX).
SEM and EDAX analyses of residues A SEM with an auxiliary EDAX system provided the tools for studying the insoluble solids in the low grade refined sugars. This function was outsourced by the SMRI and the results interpreted in consultation with an expert on the technique. Both the methods used are well established analytical techniques and are not discussed in this paper. For more information on the methods see Goyneset al. (1998). Sample preparation and experiment procedure The filter membranes were kept in a freezer until required for analysis to avoid any fungal growth. As the samples were still wet, they were air dried on a roller towel before submission for SEM analyses.Selected portions cut from each filter were mounted on stubs with carbon tape for presentation to the Leo Scanning Electron Microscope at the University of KwaZulu-Natal. So that any sulphur present would be picked up by the EDAX analyses, the samples were not sputter-coated with gold. EDAX analyses were carried out at 20 kV under high vacuum.Thereafter, the samples were sputter-coated to reduce the charging effect of the electron beam when capturing secondary electron images, which illustrate the range of particle types, sizes and morphologies observed in the sample. The membranes were divided into three areas for further examination and in some instances flakes or deposits were further examined. Results and discussion of SEM and EDAX analyses From the SEM analyses it was observed that the insoluble solids on the filter membranes were characterised by: • a continuous matrix of precipitated silica gel with very fine embedded silica-rich flakes
(derived from crushed cane cell walls - bagacillo). • micro-crystals of dried molasses salts. • silicate mineral residues from the limestone feed. These features are illustrated in some of the selected SEM images in Appendix A as Figures A1 to A7. The results of the semi-quantitative EDAX analyses appear in Table 1 for Mills 1 and 2. Averaged results are shown for simplicity. From Table 1 it can be seen that, with the exception of the expected carbon and oxygen (the bulk of which is likely to be from residual sugars), the main element identified in the samples was silica (Si). The other inorganic components found include sodium, potassium, sulphur, chlorine, magnesium and calcium. Trace amounts of aluminium and iron were also found. These are elements which are commonly found in the more soluble molasses salts such as syngenite, potassium chloride and gypsum. The species in Table 1 are reported as elements as
Madho S and Davis SB Proc S Afr Sug Technol Ass (2011) 84: 516 - 527
517
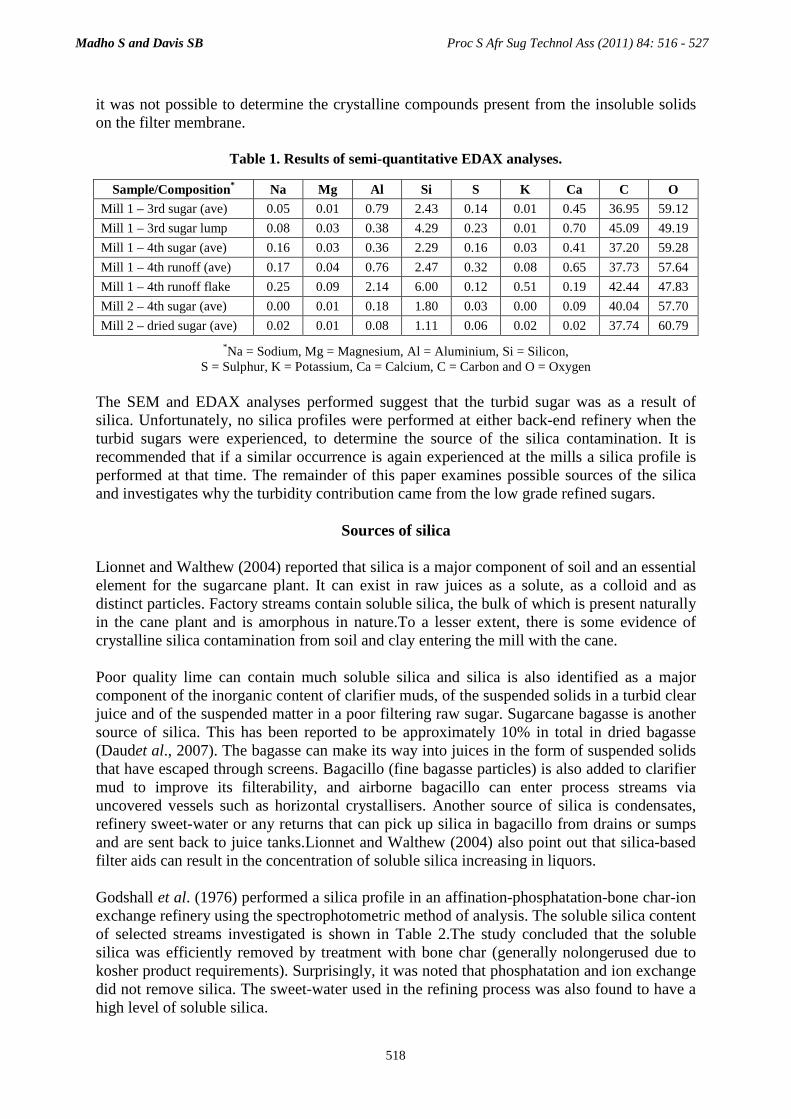
it was not possible to determine the crystalline compounds present from the insoluble solids on the filter membrane.
Table 1. Results of semi-quantitative EDAX analyses.
Sample/Composition* Na Mg Al Si S K Ca C O
Mill 1 – 3rd sugar (ave) 0.05 0.01 0.79 2.43 0.14 0.01 0.45 36.95 59.12
Mill 1 – 3rd sugar lump 0.08 0.03 0.38 4.29 0.23 0.01 0.70 45.09 49.19
Mill 1 – 4th sugar (ave) 0.16 0.03 0.36 2.29 0.16 0.03 0.41 37.20 59.28
Mill 1 – 4th runoff (ave) 0.17 0.04 0.76 2.47 0.32 0.08 0.65 37.73 57.64
Mill 1 – 4th runoff flake 0.25 0.09 2.14 6.00 0.12 0.51 0.19 42.44 47.83
Mill 2 – 4th sugar (ave) 0.00 0.01 0.18 1.80 0.03 0.00 0.09 40.04 57.70
Mill 2 – dried sugar (ave) 0.02 0.01 0.08 1.11 0.06 0.02 0.02 37.74 60.79
*Na = Sodium, Mg = Magnesium, Al = Aluminium, Si = Silicon, S = Sulphur, K = Potassium, Ca = Calcium, C = Carbon and O = Oxygen
The SEM and EDAX analyses performed suggest that the turbid sugar was as a result of silica. Unfortunately, no silica profiles were performed at either back-end refinery when the turbid sugars were experienced, to determine the source of the silica contamination. It is recommended that if a similar occurrence is again experienced at the mills a silica profile is performed at that time. The remainder of this paper examines possible sources of the silica and investigates why the turbidity contribution came from the low grade refined sugars.
Sources of silica
Lionnet and Walthew (2004) reported that silica is a major component of soil and an essential element for the sugarcane plant. It can exist in raw juices as a solute, as a colloid and as distinct particles. Factory streams contain soluble silica, the bulk of which is present naturally in the cane plant and is amorphous in nature.To a lesser extent, there is some evidence of crystalline silica contamination from soil and clay entering the mill with the cane. Poor quality lime can contain much soluble silica and silica is also identified as a major component of the inorganic content of clarifier muds, of the suspended solids in a turbid clear juice and of the suspended matter in a poor filtering raw sugar. Sugarcane bagasse is another source of silica. This has been reported to be approximately 10% in total in dried bagasse (Daudet al., 2007). The bagasse can make its way into juices in the form of suspended solids that have escaped through screens. Bagacillo (fine bagasse particles) is also added to clarifier mud to improve its filterability, and airborne bagacillo can enter process streams via uncovered vessels such as horizontal crystallisers. Another source of silica is condensates, refinery sweet-water or any returns that can pick up silica in bagacillo from drains or sumps and are sent back to juice tanks.Lionnet and Walthew (2004) also point out that silica-based filter aids can result in the concentration of soluble silica increasing in liquors. Godshall et al. (1976) performed a silica profile in an affination-phosphatation-bone char-ion exchange refinery using the spectrophotometric method of analysis. The soluble silica content of selected streams investigated is shown in Table 2.The study concluded that the soluble silica was efficiently removed by treatment with bone char (generally nolongerused due to kosher product requirements). Surprisingly, it was noted that phosphatation and ion exchange did not remove silica. The sweet-water used in the refining process was also found to have a high level of soluble silica.
Madho S and Davis SB Proc S Afr Sug Technol Ass (2011) 84: 516 - 527
518
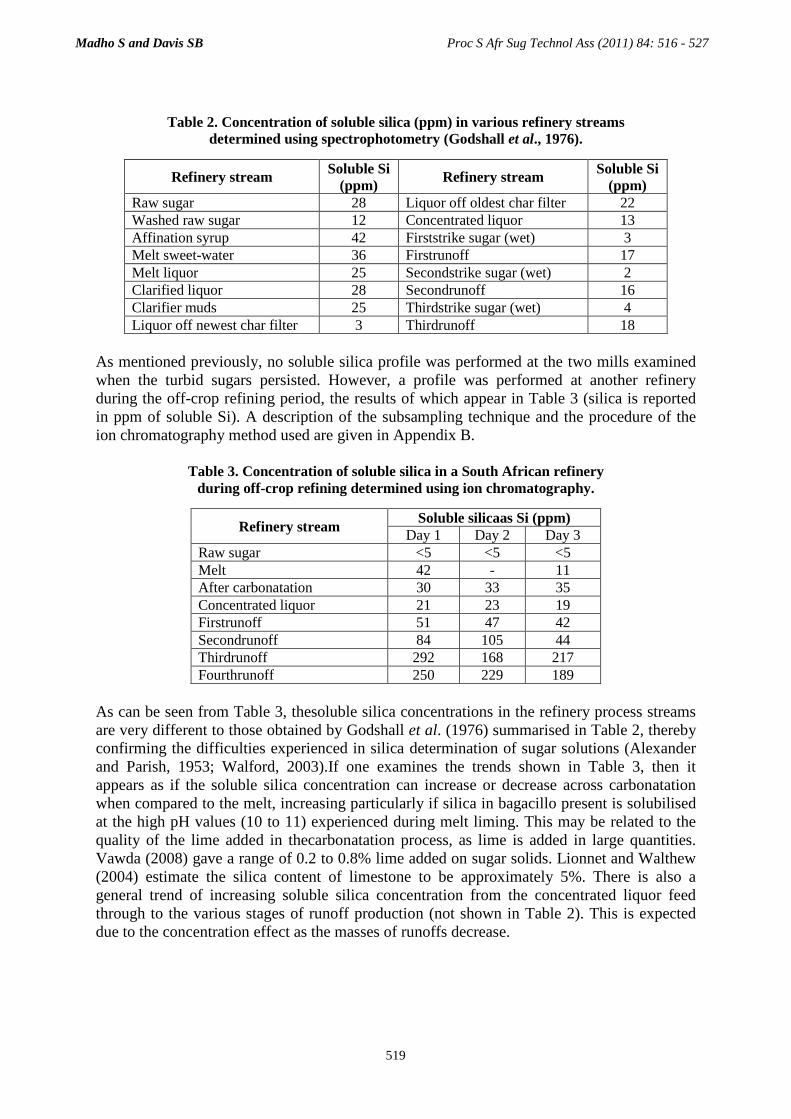
Table 2. Concentration of soluble silica (ppm) in various refinery streams
determined using spectrophotometry (Godshall et al., 1976).
Refinery stream Soluble Si (ppm) Refinery stream Soluble Si
(ppm) Raw sugar 28 Liquor off oldest char filter 22 Washed raw sugar 12 Concentrated liquor 13 Affination syrup 42 Firststrike sugar (wet) 3 Melt sweet-water 36 Firstrunoff 17 Melt liquor 25 Secondstrike sugar (wet) 2 Clarified liquor 28 Secondrunoff 16 Clarifier muds 25 Thirdstrike sugar (wet) 4 Liquor off newest char filter 3 Thirdrunoff 18
As mentioned previously, no soluble silica profile was performed at the two mills examined when the turbid sugars persisted. However, a profile was performed at another refinery during the off-crop refining period, the results of which appear in Table 3 (silica is reported in ppm of soluble Si). A description of the subsampling technique and the procedure of the ion chromatography method used are given in Appendix B.
Table 3. Concentration of soluble silica in a South African refinery during off-crop refining determined using ion chromatography.
Refinery stream Soluble silicaas Si (ppm)
Day 1 Day 2 Day 3 Raw sugar <5 <5 <5 Melt 42 - 11 After carbonatation 30 33 35 Concentrated liquor 21 23 19 Firstrunoff 51 47 42 Secondrunoff 84 105 44 Thirdrunoff 292 168 217 Fourthrunoff 250 229 189
As can be seen from Table 3, thesoluble silica concentrations in the refinery process streams are very different to those obtained by Godshall et al. (1976) summarised in Table 2, thereby confirming the difficulties experienced in silica determination of sugar solutions (Alexander and Parish, 1953; Walford, 2003).If one examines the trends shown in Table 3, then it appears as if the soluble silica concentration can increase or decrease across carbonatation when compared to the melt, increasing particularly if silica in bagacillo present is solubilised at the high pH values (10 to 11) experienced during melt liming. This may be related to the quality of the lime added in thecarbonatation process, as lime is added in large quantities. Vawda (2008) gave a range of 0.2 to 0.8% lime added on sugar solids. Lionnet and Walthew (2004) estimate the silica content of limestone to be approximately 5%. There is also a general trend of increasing soluble silica concentration from the concentrated liquor feed through to the various stages of runoff production (not shown in Table 2). This is expected due to the concentration effect as the masses of runoffs decrease.
Madho S and Davis SB Proc S Afr Sug Technol Ass (2011) 84: 516 - 527
519
Solubility of silica
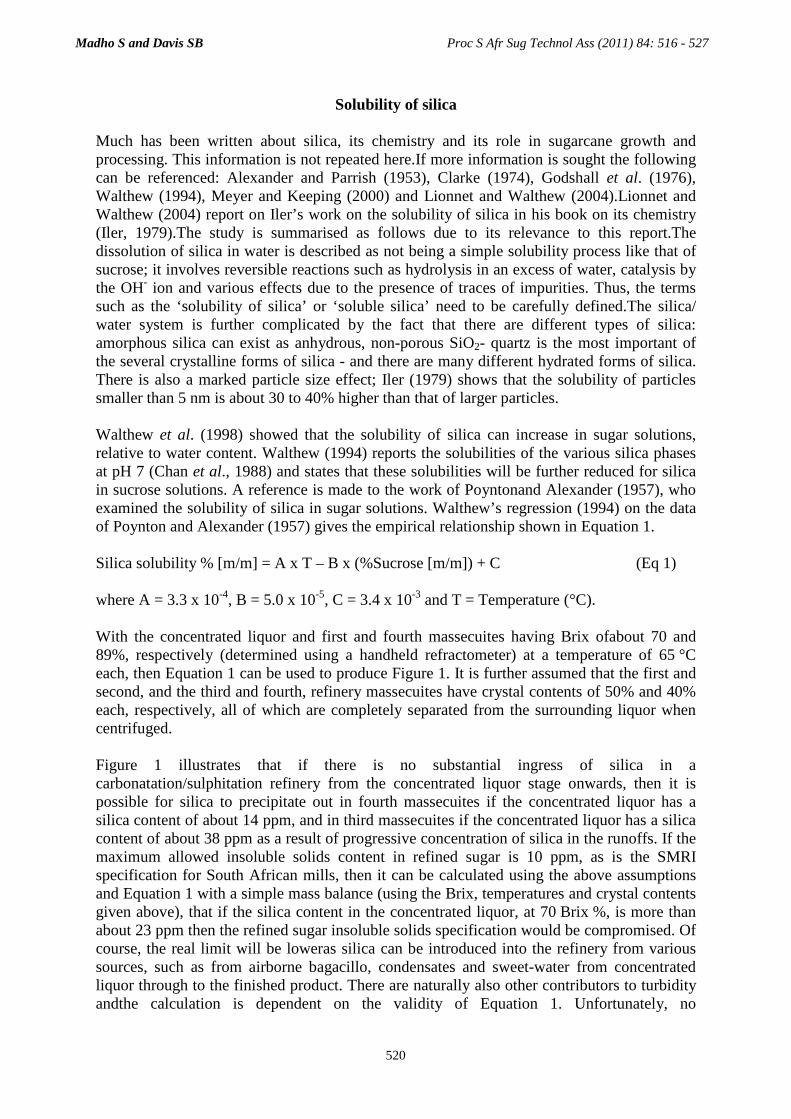
Much has been written about silica, its chemistry and its role in sugarcane growth and processing. This information is not repeated here.If more information is sought the following can be referenced: Alexander and Parrish (1953), Clarke (1974), Godshall et al. (1976), Walthew (1994), Meyer and Keeping (2000) and Lionnet and Walthew (2004).Lionnet and Walthew (2004) report on Iler’s work on the solubility of silica in his book on its chemistry (Iler, 1979).The study is summarised as follows due to its relevance to this report.The dissolution of silica in water is described as not being a simple solubility process like that of sucrose; it involves reversible reactions such as hydrolysis in an excess of water, catalysis by the OH- ion and various effects due to the presence of traces of impurities. Thus, the terms such as the ‘solubility of silica’ or ‘soluble silica’ need to be carefully defined.The silica/ water system is further complicated by the fact that there are different types of silica: amorphous silica can exist as anhydrous, non-porous SiO2- quartz is the most important of the several crystalline forms of silica - and there are many different hydrated forms of silica. There is also a marked particle size effect; Iler (1979) shows that the solubility of particles smaller than 5 nm is about 30 to 40% higher than that of larger particles. Walthew et al. (1998) showed that the solubility of silica can increase in sugar solutions, relative to water content. Walthew (1994) reports the solubilities of the various silica phases at pH 7 (Chan et al., 1988) and states that these solubilities will be further reduced for silica in sucrose solutions. A reference is made to the work of Poyntonand Alexander (1957), who examined the solubility of silica in sugar solutions. Walthew’s regression (1994) on the data of Poynton and Alexander (1957) gives the empirical relationship shown in Equation 1. Silica solubility % [m/m] = A x T – B x (%Sucrose [m/m]) + C (Eq 1) where A = 3.3 x 10⁻⁴, B = 5.0 x 10⁻⁵, C = 3.4 x 10⁻³ and T = Temperature (°C). With the concentrated liquor and first and fourth massecuites having Brix ofabout 70 and 89%, respectively (determined using a handheld refractometer) at a temperature of 65 °C each, then Equation 1 can be used to produce Figure 1. It is further assumed that the first and second, and the third and fourth, refinery massecuites have crystal contents of 50% and 40% each, respectively, all of which are completely separated from the surrounding liquor when centrifuged. Figure 1 illustrates that if there is no substantial ingress of silica in a carbonatation/sulphitation refinery from the concentrated liquor stage onwards, then it is possible for silica to precipitate out in fourth massecuites if the concentrated liquor has a silica content of about 14 ppm, and in third massecuites if the concentrated liquor has a silica content of about 38 ppm as a result of progressive concentration of silica in the runoffs. If the maximum allowed insoluble solids content in refined sugar is 10 ppm, as is the SMRI specification for South African mills, then it can be calculated using the above assumptions and Equation 1 with a simple mass balance (using the Brix, temperatures and crystal contents given above), that if the silica content in the concentrated liquor, at 70 Brix %, is more than about 23 ppm then the refined sugar insoluble solids specification would be compromised. Of course, the real limit will be loweras silica can be introduced into the refinery from various sources, such as from airborne bagacillo, condensates and sweet-water from concentrated liquor through to the finished product. There are naturally also other contributors to turbidity andthe calculation is dependent on the validity of Equation 1. Unfortunately, no
Madho S and Davis SB Proc S Afr Sug Technol Ass (2011) 84: 516 - 527
520
representative insoluble solids testing of the refined sugar produced during the days of samples was performed by the refinery to verify the above prediction.
Figure 1.Solubility of silica in refinery massecuites at 65 °C relative to the silica in the concentrated liquor at 70 Brix %.
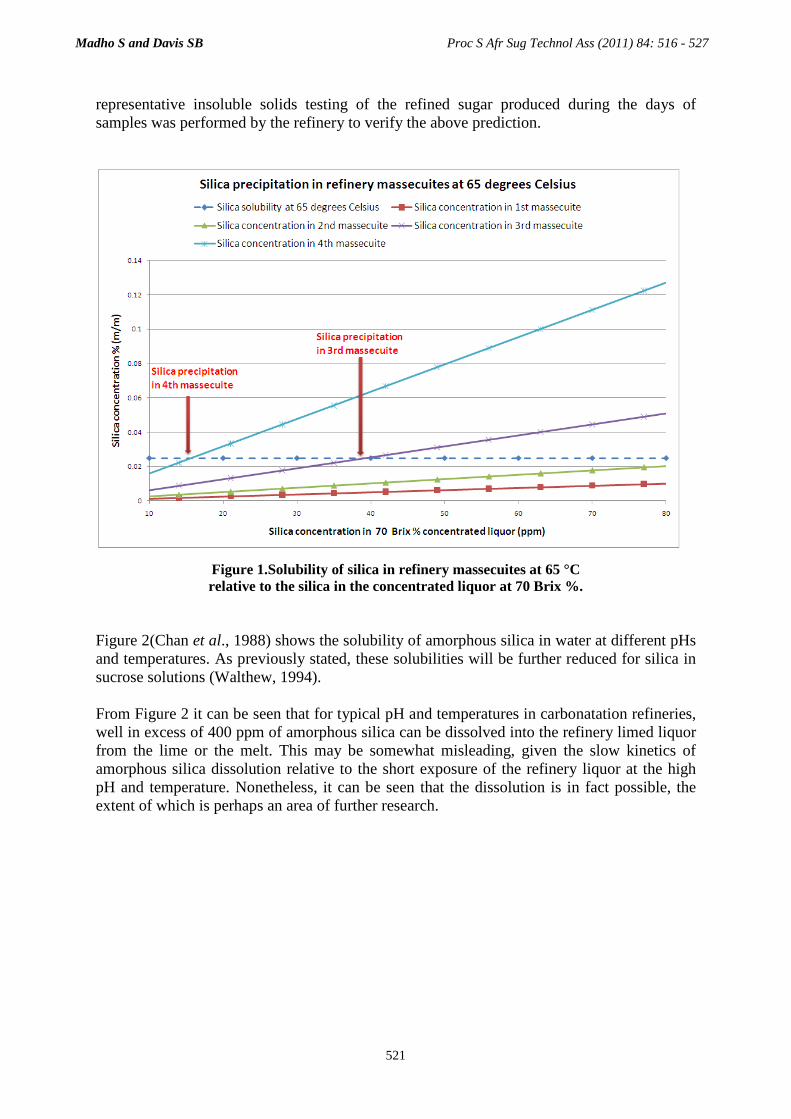
Figure 2(Chan et al., 1988) shows the solubility of amorphous silica in water at different pHs and temperatures. As previously stated, these solubilities will be further reduced for silica in sucrose solutions (Walthew, 1994). From Figure 2 it can be seen that for typical pH and temperatures in carbonatation refineries, well in excess of 400 ppm of amorphous silica can be dissolved into the refinery limed liquor from the lime or the melt. This may be somewhat misleading, given the slow kinetics of amorphous silica dissolution relative to the short exposure of the refinery liquor at the high pH and temperature. Nonetheless, it can be seen that the dissolution is in fact possible, the extent of which is perhaps an area of further research.
Madho S and Davis SB Proc S Afr Sug Technol Ass (2011) 84: 516 - 527
521
Figure 2.Solubility of amorphous silica in water at different pH and temperatures (Chan et al., 1988).
Control of bagacillo in back-end refineries
A primary source for the silica flakes in the low grade refined sugars has been identified to be bagacillo. Possible means of controlling the ingress of excess bagacillo into refinery process streams are given below. • Monitoring of degree of cane preparation. Over-preparing the cane would result in fine
fibres that may not be completely removed in the rawhouse, particularly during poor clarification. The SASTA Laboratory Manual (Anon, 2009) describes the Preparation Index (PI) and Displacement Rate Index (DRI) methods as tools for quantifying the degree of cane preparation. Rein (2007) gives a PI of about 90 aimed for by South African and Australian sugar plants, irrespective of whether they operate diffusers or milling tandems. Loubser and Gooch (2004) give a DRI value of 6.5 to 7.0 for well-prepared cane.
• Ensuring a steady flow of limed juice to rawhouse clarifiers to prevent carry-over of silica-bearing suspended solids such as bagacillo. This is particularly important with Short Retention Time (SRT) clarifiers which are more susceptible to juice surges. Changes to juice flow should be gradual to minimise turbulence in clarifiers.
• Eliminating the mud filter station or isolating it from the rest of the factory. Isolation can be achieved by the installation of plastic curtains as used by some South African factories around the filter station. Extraction fans may also be utilised to remove airborne particles that might end up in uncovered crystallisers. Particular attention would need to be paid to the area around the bagacillo inlet to the mud-mixer.
• The bagacillo quality to the mud filter station should be regularly monitored. It is generally accepted that at least 85% of the bagacillo collected should pass through a 14 mesh screen and not more than 5% should pass through a 36 mesh screen.
• Syrup clarifiers can be used to further aid in the removal of turbidity in rawhouses. • Filters should be installed into the vacuum breakers of both rawhouse and refinery pans to
prevent the intake of airborne bagacillo. • A-crystallisers as well as other open vessels or conveyors should be covered up so as not
to be exposed to airborne bagacillo.
pH
Sol
ubili
ty o
f am
orph
ous
SiO
2 (m
g/l)
Madho S and Davis SB Proc S Afr Sug Technol Ass (2011) 84: 516 - 527
522
• Condensate filters should be installed to remove suspended solids in centrifugal wash water and pan movement water.
• Regular monitoring of insoluble solids (Anon, 2009) in selected rawhouse and refinery process streams. This can be performed before and after filters as well.
• Isolation of the refinery and packaging plant from the rest of the plant. • Installation of additional turbidity removal mechanisms, e.g. clear juice/syrup/melt/fine
liquor screening or filtration, syrup clarification and ‘goalkeeper’ filters after refinery filtration process.
• Minimising the amount of sweet-water and sump contents returned to the melter. • Regular monitoring of limestone quality. • Possible use of polyaluminum coagulants and magnesium oxide for silica removal. • Implementation of bagacillo control measures at adjoining factories or sections of the
plant, e.g. watering down of bagasse stockpiles.
Conclusion
SEM and EDAX analyses of the filter membranes collected from two back-end carbonatation/sulphitationrefineries suggest that it is likely that a precipitated silica gel, embedded with very fine silica-rich flakes, is the cause of the turbidity in their low grade refined sugars. The silica appears to have originated from crushed cane cell walls or bagacillo. Also found on the membranes were trace amounts of silicate mineral residues from the limestone feed. Unfortunately no silica profiles were performed at either factory when the turbid sugars were being experienced. This would have helped to determine the source of the bagacillo contamination. It is recommended that, if a similar occurrence is again experienced at the mills, a silica profile is performed at the time of high turbidity. A soluble silica profile was performed during the off-crop period in another carbonatation refinery; however, the results obtained from the ion chromatography analyseswere very different to tests performed by others in an affination-phosphatation-bonechar-ion exchange refinery using a spectrophotometric method. It is certain that silica determination in sugar solutions remains an area that requires further research and it is suggested that use of ion chromatography is also explored in this work. A study on the solubility of silica revealed that it is possible for silica to be precipitated in only the low grade refinery sugars. The study also revealed that amorphous silica can be dissolved at high pH and temperature levels, as is experienced in carbonatation refineries (the kinetics of which is also recommended for further research). The dissolved silica would then not hamper filtration and would precipitate out in the low grade refined sugars due to its decrease in solubility as sucrose concentration increases and pH decreases.This then does suggest a probable cause for the experiences at the two back-end carbonatation/sulphitation refineries. Where the maximum allowed insoluble solids content in refined sugar is 10 ppm, it can be calculated that if the silica in the concentrated liquor is more than approximately 23 ppm at 70 Brix% then the refined sugar insoluble solids specification would be compromised in a carbonatation/sulphitation refinery (depending on the validity of Poynton and Alexander’s work, 1957).
Madho S and Davis SB Proc S Afr Sug Technol Ass (2011) 84: 516 - 527
523

Acknowledgements Lesley Turner for SEM and EDAX analyses and comments thereon.
REFERENCES Alexander JB and Parrish JR (1953).Silica in raw and clarified cane juices.S Afr Sug J 37(9): 573-579,
589.
Anon (2009). SASTA Laboratory Manual including the official methods. 5th edition.South African Sugar Technologists’ Association, Mount Edgecombe, South Africa, Method 8.9.
Chan SH, Rau H and Neusen KF (1988).Silica fouling of heat transfer equipment – experiments and model.Journal of Heat Transfer, Transactions ASME v 110, Nov 1988: 841-849.
Clarke MA (1974). Cane sugar and silicon compounds.Proc Cane Sug Refining Res 66-75.
Daud S, Salleh SS, Salleh MN, Kasim FH and Saad SA (2007).Analysis of chemical composition in sugarcane bagasse and rice straw for their suitability using (sic) in paper production.The International Conference of Sustainable Materials (ICoSM): 291-292.
Godshall MA, Clarke MA, Roberts EJ and Carpenter FG (1976). Soluble silicates in refinery processes.Sug Ind Technol 58-67.
Goynes WR, Ingber BF, Blanco RS, Clarke MA and Godshall MA (1998).Use of scanning electron microscope – Elemental analysis to identify sediments in sugar processing.Proc SPRI, Savannah: 308-317.
Iler RK (1979). The Chemistry of Silica.John Wiley and Sons, New York, USA.
Lionnet GRE and Walthew DC (2004). Aspects of the effects of silica during cane sugar processing. Proc S Afr Sug Technol Ass 78: 55-63.
Loubser RC and Gooch MA (2004). DRI – What is it? Proc S Afr Sug Technol Ass 78: 403-411.
Meyer JH and Keeping MG (2000). Review of research into the role of silicon for sugarcane production. Proc S Afr Sug Technol Ass 74: 29-40.
Poynton M and Alexander JB (1957). Some notes on the solubility of silica in sugar solutions. Proc S Afr Sug Technol Ass 41: 42-43.
Rein PW (2007). Cane Sugar Engineering. Bartens, Germany: p 82.
Vawda AS (2008).A comparative evaluation of carbonatation and phosphatation.Sug Ind Technol 78-93.
Walford SN (2003). A review of analytical procedures for the determination of silica. Sugar Milling Research Institute, Technical report No. 1925, 8pp.
Walthew DC (1994). Evaporator fouling: A literature review. Sugar Milling Research Institute, Communication No. 159, 87pp.
Walthew DC, Khan F and Whitelaw R (1998). Some factors affecting the concentration of silica in cane juice evaporators. Proc S Afr SugTechnol Ass 72: 223-227.
Madho S and Davis SB Proc S Afr Sug Technol Ass (2011) 84: 516 - 527
524

APPENDIX A
Figure A1. SEM image of a blank filter membrane at
1000x magnification. Figure A2. SEM image (2230x magnification)
showing silica lumps in 3rd sugar – Mill 1.
Figure A3. SEM image (1650x magnification) showing
silica lumps in 4th sugar – Mill 1. Figure A4. SEM image (1500x magnification) showing
silica lumps in 4th runoff – Mill 1.
Madho S and D
avis SBP
roc S Afr Sug T
echnol Ass (2011) 84: 516 - 527
525
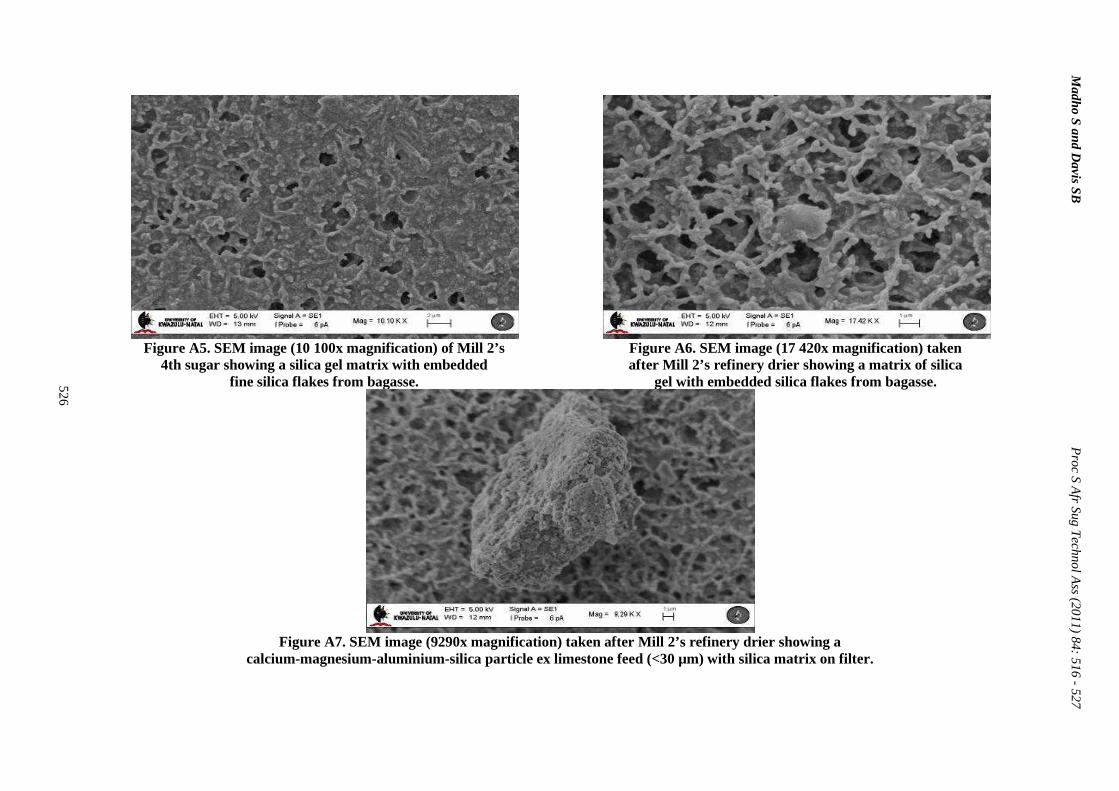
Figure A5. SEM image (10 100x magnification) of Mill 2’s
4th sugar showing a silica gel matrix with embedded fine silica flakes from bagasse.
Figure A6. SEM image (17 420x magnification) taken after Mill 2’s refinery drier showing a matrix of s ilica
gel with embedded silica flakes from bagasse.
Figure A7. SEM image (9290x magnification) taken after Mill 2’s refinery drier showing a
calcium-magnesium-aluminium-silica particle ex limestone feed (<30 µm) with silica matrix on filter.
Madho S and D
avis SBP
roc S Afr Sug T
echnol Ass (2011) 84: 516 - 527
526
APPENDIX B
Silica determination using ion chromatography Sampling and subsampling Each of the samples analysed was a subsample from the refinery’s daily composites. In order to analyse for dissolved silica only, any suspended or colloidal silica was removed by heating the sample to its individual refinery operating temperature, prefiltering and then filtering through 45µm membrane filters. Ion chromatography procedure A portion of the well-mixed sample was then made up to 100 mL (weight to volume) with an eluent. This was injected into a Hamilton PRP-X100 IC column with anionic resin after further filtration through 45µm membrane filters. The eluent used was a mixture of 0.5 mM of sodium carbonate and 3.2 mM of sodium hydroxide at a flow rate of 1.3 mL/minute. Detection of the silica was done by conductivity and standards of 5, 10 and 20 ppm silica dioxide (SiO2) in eluent (m/m) were prepared for the dissolved silica checks.
Madho S and Davis SB Proc S Afr Sug Technol Ass (2011) 84: 516 - 527
527