Embed Size (px)
Citation preview
1
Silent Talker: A New Computer-Based System for the Analysis of Facial Cues to
Deception
Silent Talker
Janet Rothwell, Zuhair Bandar, James O‟Shea, and David McLean
Department of Computing and Mathematics, Manchester Metropolitan University
Correspondence concerning this article should be addressed to: Zuhair Bandar,
Manchester Metropolitan University, Department of Computing and Mathematics,
John Dalton Building, Chester Street, Manchester M1 5GD, United Kingdom
email: [email protected]
telephone: 0161-247-1541
facsimile: 0161-247-1483
We thank those who kindly volunteered to participate in the study. We also thank
David McCormick for encouragement and support and Aldert Vrij, University of
Portsmouth, for helpful discussions and advice.
2
Summary
This paper presents the development of a computerised, non-invasive psychological
profiling system, „Silent Talker‟, for the analysis of nonverbal behaviour. Nonverbal
signals hold rich information about mental, behavioural and/or physical states.
Previous attempts to extract individual signals and to classify an overall behaviour
have been time-consuming, costly, biased, error-prone and complex. Silent Talker
overcomes these problems by the use of Artificial Neural Networks. The testing and
validation of the system was undertaken by detecting processes associated with
“deception” and “truth”. In a simulated theft scenario thirty-nine participants „stole‟
(or didn‟t) money, and were interviewed about its location. Silent Talker was able to
detect different behaviour patterns indicative of “deception” and “truth” significantly
above chance. For example, when 15 European men had no prior knowledge of the
exact questions, 74% of individual responses (p<.001) and 80% (p=.035) of
interviews were classified correctly.
3
Silent Talker:
A New Computer-Based System for the Analysis of Facial Cues to Deception.
There is a long history of research in the field of nonverbal behaviour.
Nonverbal cues have, with some difficulty and extensive effort, been collected and
analysed by humans. In spite of the many problems this has posed, little work has
been carried out on the use of machines for the collection and analysis of these cues.
A system that is able to non-invasively, quickly and simultaneously analyse many
nonverbal cues and their interrelationships has long been needed. This paper describes
such a system and its implementation/testing. Silent Talker is an Artificial Neural
Network-based system that automatically collects and analyses nonverbal cues to
classify an overall behavioural/psychological state. It can be adapted to detect
different such states and tuned to particular situations, environments and applications.
In this paper the determination of a particular state is described as profiling.
Nonverbal behaviour consists of all the signs and signals--visual, audio, tactile
and chemical--used by human beings to express themselves, except speech or manual
sign language (Scherer and Ekman, 1982). These cues hold rich information about
mental, behavioural and/or physical states and are, at least in part, involuntary and
unintended. Physiological cues, such as EEG waveforms, also hold information, but
these generally require invasive contact. The work presented in this paper is limited to
visible nonverbal behaviour, but could easily be extended to include physiological
measurements, other nonverbal behaviour, e.g. voice pitch, and verbal behaviour such
as the number of self-references (Zuckerman and Driver, 1985).
We use the term channel to describe behaviour at a finer level of granularity
than is normally used in the deception literature. Each channel is an attribute being
measured, such as an eye contact event, gaze direction or body movement. The total
4
nonverbal behaviour exhibited is multichannel, many channels representing the
overall psychological state of a subject (Scherer and Ekman, 1982). A channel is
affected by level of control over that channel, level of arousal/felt, emotion and
cognitive processing demands (Zuckerman and Driver, 1985). People may try to
control their postures, movements and gestures to convey a message not in
accordance with their true feelings, but it is unlikely that nonverbal behaviour can be
faked completely, because of the probable lack of congruence between numbers of
channels (Pease, 1984).
A typical hallmark of much nonverbal analysis is a fine-grain temporal
analysis first expounded by Efron (1941). In this methodology, a judge observes and
codes channel data for each frame of a video. This may simply be a note of whether a
particular behaviour is taking place, a measure of duration over a number of frames,
or a subjective opinion (Scherer and Ekman, 1982). For multichannels, observation
and coding is performed a number of times, once for each channel. Coding may be
repeated by a number of judges to avoid bias by an individual judge. The
multichannel codes are analysed over multiple frame groupings.
It may take one hour to code (or extract) a particular channel from one minute
of videotape (Johnson, 1999). Once the coding of multichannels is complete, the
subsequent analysis over multiple frame groupings is often complex and time
consuming, due to the high dimensionality possible. Thus, important patterns in the
data may be missed and the result of the analysis may be costly, incomplete and too
late to be useful. Vrij, Evans, Akehurst, and Mann (2004) have shown that it is
possible for humans to use rapid judgements in assessing verbal and nonverbal
channels in order to detect processes related to truth and deceit. However, the judges
have to be trained, can concentrate upon only a limited number of channels at one
5
time and can be biased or make errors due to fatigue, for example. Also, relevant
channels and patterns between channels may be unwittingly ignored.
There are electronic machines able to measure physiological or behavioural
variables that may subsequently be interpreted as correlated with a psychological
state. Many require the additional subjective opinion of a judge and/or some base-line
measurements. Such machines are limited in scope because only one psychological
state is measured; they are also limited in ability because only a small number of fixed
channels are used for cost and analysis reasons, resulting in the possibility of
measuring behaviour other than that desired, or providing insufficient data for
classification. Also, it is more likely that a subject could control a small number of
channels in order to convey a message that is not in accordance with their true
feelings. Where a judge and base-line measures are introduced there is an element of
bias. A well-known machine of this type, designed to detect “deception”, is the
Polygraph. This machine has been the subject of many studies; relatively recent ones
include Lykken, 1998; Olsen, Harris, Capps and Ansley, 1997; Vrij, 2000. There are
two popular types of test, guilty-knowledge and control-question. The former can be
used in only limited circumstances whilst the latter involves base-line measures. For a
description of the tests and typical results, see Vrij, 2000. A trained judge uses the
channel data recorded by the Polygraph along with his or her own perceptions of the
subject in order to make a final assessment. The judge‟s assessment may have an
element of bias; further, the three Polygraph channels all measure arousal, and a
subject may have learnt to control the limited number of channels (Vrij, 2000;
Williams, 2001).
Research into manual, electronic and computer-based systems has also
concentrated upon the use of a small number of channels, a simple combination of
6
those channels, sometimes relying upon channels that monitor occasional, discrete
events such as microexpressions or false smiles. A microexpression is a short-lived,
unexpected expression and a false smile is one which does not involve eye movement
(Ekman, 1985). Pavidis, Eberhardt, and Levine (2002) use a computer to detect blood-
flow under the eyes (single channel) in order to determine “deception”. Bartlett et al
(1999) use a computer system to automatically recognise facial actions and thus detect
a fleeting microexpression and/or the presence of a false smile in order to determine
“deception”. Ekman (1988) combines false smiles (detected by a judge) and one vocal
measure to determine “deception”. Cohn and Katz (1998) combine facial muscle
movements (measured invasively) with four vocal measures to determine “negative”,
“neutral” and “positive” emotion.
Iwano, Sukegawa, Kasahara, and Shirai, (1995) use a larger number of
channels and look for closeness between a response pattern and a typical pattern. A
computer is used to extract a number of facial distances from a roughly stationary
head. These are combined with two vocal channels in an attempt to determine
“agreement”, “denial”, “unexpected”, “withhold”, and “dislike”. They calculate a
typical pattern for each of the behaviours by looking at each response from all the
participants. The patterns may be quite simple, e.g. a nod and raised pitch indicating
“agreement”. They compare each response pattern to the typical patterns testing only
people who had been used to create the typical patterns. For complex behaviours such
as deception, there may not be a single typical pattern but a number of patterns that
could represent a given behaviour.
The systems discussed above are costly, complex, time-consuming, and/or
error-prone. Some use too few channels, or a simple combination/analysis of
channels; some rely upon channels that monitor occasional discrete events or are
7
limited in scope and/or ability; others are not fully automatic and are biased where a
base-line or the subjective opinion of a judge is required.
The use of Artificial Neural Networks (Hassoun, 1995) offers a way of
overcoming these problems. An Artificial Neural Network (ANN) is a non-linear
statistical model. ANNs can be trained to perform tasks (such as classification of
inputs to the network), by presenting them with a training set of sample cases and the
desired classifications, represented in a numerical form. The learning takes place by
the modification of numerical weights on the connections between the artificial
neurons. ANNs learn features or principles of classification, and thus can classify
unseen cases.
ANNs have been used for many diverse applications. In this work „liars‟ and
„truth tellers‟ are video recorded. ANNs detect body movements in order to instantly
measure the occurrence of many specific behaviours, such as eye blinks and sideways
head movements. ANNs then classify the behavioural patterns as processes related to
“deception” and “truth”.
Detecting processes related to “deception” and “truth” is a difficult task
because non-verbal deceptive behaviour depends upon the participant, the
context/situation, the characteristics of the lie and the person trying to detect the lie
(Ekman, 1985). Thus, there are many variables to consider. These include motivation
(high, medium, low), planning (spontaneous, planned, practised), participant (gender,
ethnicity/culture, age) and interviewer (gender, culture, age, status, respect of,
common values with, familiarity, level of suspicion) (Bond, 1990; Burgoon, Buller,
Grandpre, and Kalbfleisch, 1998; Ekman, 1985; Ekman, 1988; Pavidis et al., 2002;
Porter, Woodworth, and Birt, 2000; Vrij, 1994; Vrij, 2000; Vrij and Semin, 1996;
Zuckerman and Driver, 1985). In addition, the same participant and same event may
8
produce a different set of responses at a different time due to the physical setting,
recent influences or experience by that participant. At any one time, a response may
not be fully deceptive or truthful, but some blend of truth and lie.
It is desirable that the responses analysed are of the types that occur in real-life
contexts. For example, a natural conversation, which draws out a participant‟s
description of an event, contains more information than a rigid set of closed questions
that elicits a “yes” or “no” response.
Method
Participants
In order to provide training and testing data for the system a number of
interviews were recorded. The interview collection strategy was adapted from Vrij,
(1994), where the detection of deception was the phenomenon under scrutiny. Thirty-
nine adult volunteers (age range 20 to 50) performed small tasks and were
interviewed about them. The participants were students, academic and other staff
from the University‟s Department of Computing and Mathematics. Approximately
half were male; two-thirds of both genders were of European origin. None had
specific knowledge of cues related to truth and deception.
The interviews took place over a number of days. Participants were instructed
not to convey details of the interviews to each other. In addition, participants well-
known to one another were filmed on the same day. There was no manipulation of the
lighting or of the participants‟ appearance or movements.
Data Collection
On arriving, each volunteer was issued with a random number and an
information sheet which included the reasons for the study and some information

9
designed to improve their motivation to lie, i.e. text informing them that deception
was often called upon for positive reasons and was a skill they might need to put into
practice in the workplace. This trial did not use a financial incentive. The participants
volunteered on the basis that they were making a useful contribution to scientific
knowledge.
On entering the interview room alone, the participant found an instruction
sheet. This asked the participant to take a box from under the chair and inspect its
contents. The box contained a pair of spectacles and a ten-pound note. If the
participant had an odd number, the participant was required to pocket the money (task
A). An even number required the participant to replace the money in the box (task B).
The box was to be put back under the chair. Participants read that they were about to
be interviewed about the location of the money and that they would be accused of
taking it. Participants having the money in their pocket were instructed not to admit
this. A few minutes later, the interviewer arrived. After a brief greeting, the
interviewer asked ten ordered questions in a consistent manner.
Q1 I know that you‟ve looked in the box. Please tell me what you saw.
Q2 How much money was in the box?
Q3 What did you do with the money?
Q4 Are you sure that you didn‟t take the money from the box?
Q5 Have you any pockets?
Q6 When did you last use your pockets?
Q7 Did you put the money in your pockets?
Q8 Please describe the contents of your pockets.
Q9 Are you telling the truth about the location of the money?
Q10 Have you lied in this interview?
10
During the interviews, the interviewer did not know whether a volunteer was
lying or telling the truth. Later, the interviewee performed the task that he/she had not
performed earlier, and a second interview was undertaken. Identical questions to the
first interview, in identical order, were asked. In a truthful interview all ten questions
produced truthful responses. In a deceptive interview many of the questions produced
deceptive responses. However, Q5 produced a truthful response because all the
participants had pockets, and Q1 and Q2 produced usually truthful responses because
most participants admitted that they had looked in the box. The mean interview
length, from the beginning of the response to Q1 to the end of the response to Q10,
was 59 seconds (SD=15 seconds).
For the purposes of this work we define an unplanned interview as one in
which the participant has been asked a set of questions for the first time and with no
prior indication of what is to be asked. A planned interview is one in which the
participant goes through an exact repetition of the unplanned interview a short time
afterwards. It is reasonable to believe that some of the questions and their order of
occurrence in an initial interview of this type would not be anticipated. Furthermore,
the second interviews do simulate real-world processes involving a series of
interviews over extended time in which questions are repeated to check for
consistency. Consequently, the trials do bear some similarity to real-world interviews.
For each interview, three cameras were used to record full body, head and
shoulders, and head and torso. For purely operational purposes an operator was
required to start and stop the cameras and establish synchronisation. For some people
the presence of the camera operator may have increased their duping delight or
embarrassment (Vrij, 2000). To control this, the operator entered the room just before
the interviewer, avoided eye contact throughout the interview and then left the room
11
just after the interviewer. In a fully-developed system there would not be any need for
a camera operator, the camera would be connected directly to the computer, and
camera data processed in real-time by the computer. However, for this initial work,
the interviews were recorded on to SVHS tapes, which were later digitised. This
allowed for the collection of ANN training data and for slightly different
training/testing scenarios.
After the two interviews, a de-briefing sheet was completed, asking for the
participant‟s consent for the videos to be used, and details about when and where they
deceived. The 39 people yielded 78 useable interviews each containing 10 questions.
These provided 774 individual responses; 6 responses were lost due to interviewer
error. Half of the interviews contained unplanned responses (1st interview) and half
contain planned responses (2nd
interview). Half of the interviews were deceptive and
contained some responses that were deceptive and some that were truthful. The other
interviews were truthful and contained only truthful responses.
The interviewee‟s head and shoulder images were used. Each video was
digitised into a 15 frames-per-second Audio–Video Interleaved (AVI) file. A response
was deemed to start one second before interviewees started talking and end two
seconds after they stopped talking. Using this criterion the mean response length was
6 seconds (SD=3 seconds). A response overlap sometimes occurred if the interviewer
asked a question in less than three seconds.
Head and Shoulder Video Choice
In the detection of “deception” both body and face leak deception cues
(Ekman, 1985; Ekman, O‟Sullivan, Friesen, and Scherer, 1991). It was decided to
concentrate initially upon images from the interviewee‟s head and shoulder videos. In
day-to-day encounters much non-verbal communication is expressed using the face,
12
with some or all of the lower part of the body hidden – for example, by posture.
Although the face can mislead the untrained eye because it is best equipped to lie, it
can also leak the most cues (Ekman, 1997). Whilst many can only detect deception to
chance levels (Zuckerman and Driver, 1985), some, who have difficulty in
understanding speech due to brain damage, have been able to detect deception to 73%
in silent head and shoulder videos (Etcoff, Ekman, Magee, and Frank, 2000).
Experiments using individual channels from head and shoulder videos have given
contradictory results (Zuckerman and Driver, 1985; Ekman, 1985) but, in light of the
results from brain damaged people, our hypothesis was that channel interrelationships,
rather than individual channels, would prove important.
Theme and Channel Choice
In many circumstances known data can help the detection process. Since there
are differences in non-verbal behaviours between men and women and persons of
different race (Bond, 1990; Vrij, 2000), those chosen in this study were gender, race
and planning, the last with reference to the planned/unplanned interviews.
In this work the head and shoulder images were used and channels were based
upon the face and head. An overview of previous work by Zuckerman and Driver
(1985) showed that researchers investigating deceptive behaviours considered a
number of visible channels based upon the face and head: pupil dilation, gaze,
blinking, smiling, facial segmentation and head movements. No single channel
emerged as the most sensitive source. In this work the four themes chosen were eye
gaze, eye closure, face/head movement and blushing/blanching. Each theme contains
a number of channel values. A fifth theme comprised the known data items gender,
race and planning, and for the purpose of simplicity, these are also referenced as
13
channels. In total 24 channels were used (Table 1). The rationale for theme/channel
choice is given below.
The eye gaze theme was considered because folk-wisdom says that a person
avoiding eye contact is embarrassed, hiding something or concentrating. However,
both liars and truthful people may control their gaze in an attempt to appear honest.
The eye closure theme was considered in order to monitor blinking, closing the eyes
for a longer period, and looking down. Blinking is mostly linked to arousal, but to a
lesser extent it may be controlled, or affected by cognitive processing events.
Cognitive processing due to concentration or daydreaming, for example, could delay a
blink as a person “stares into space”. A person looking down, or closing their eyes for
a short period, may also indicate cognitive processing or avoidance.
The head movement theme was considered because such movement may be
used to illustrate a point, or to indicate yes and no responses. Cognitive processing
automatically causes a decrease in movement (Vrij and Semin, 1996). Although gross
head movements may be controlled, small head movements are less likely to be
controlled, and strong emotions may cause sudden jerky or shaky movements. The
blushing and blanching theme was considered because these are likely to be affected
by the emotions, cognitive processing demands, or possibly control. Blushing and
blanching was one of two indicators suggested by Ekman (1985); the other was
downward gaze.
Pupil dilation was not considered in this work because small changes in light
levels affect the size of the pupil more than cognitive processing or arousal (Janisse,
1977). If the pupil size is to be valid data, the gaze direction must be limited or the
light levels at the position of gaze must be measured. The former would hinder the
natural movement of the subject. The latter would require the interview area to be
14
restrictive and contain much specialised measurement equipment. The smile was not
considered because of mouth movement entailed in answering. Nonetheless, smile,
mouth movement and facial segmentation could be the subject of further study.
The System
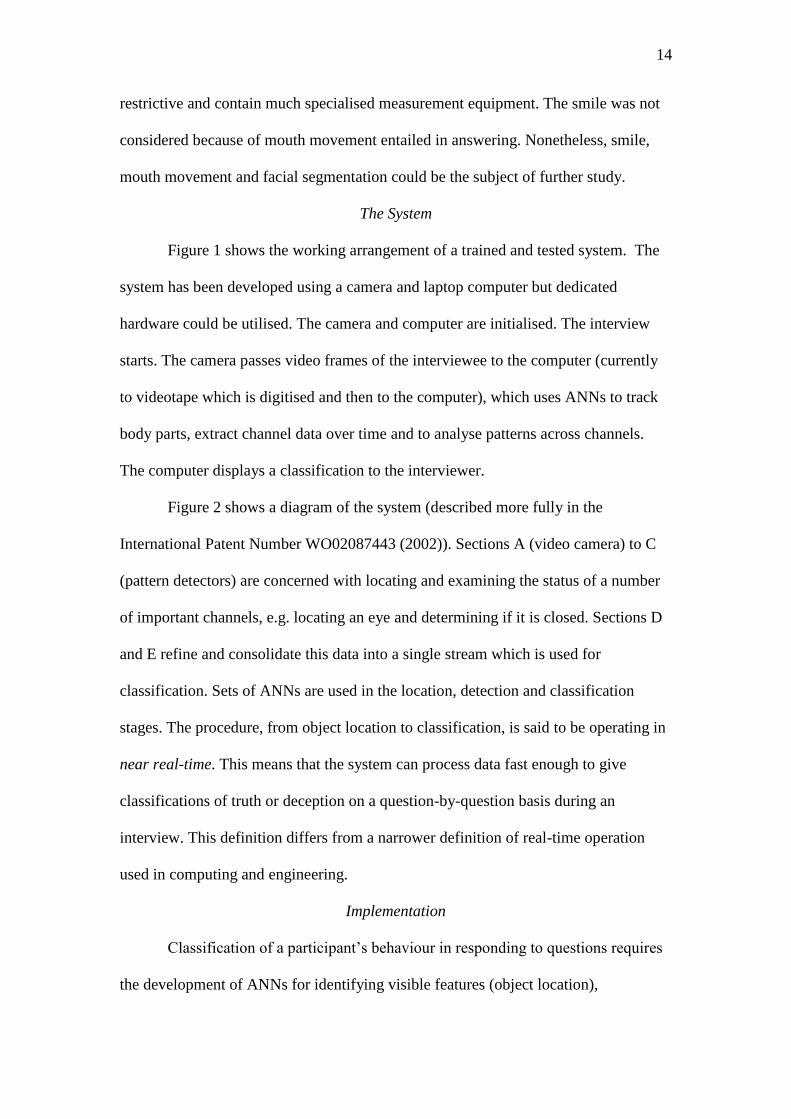
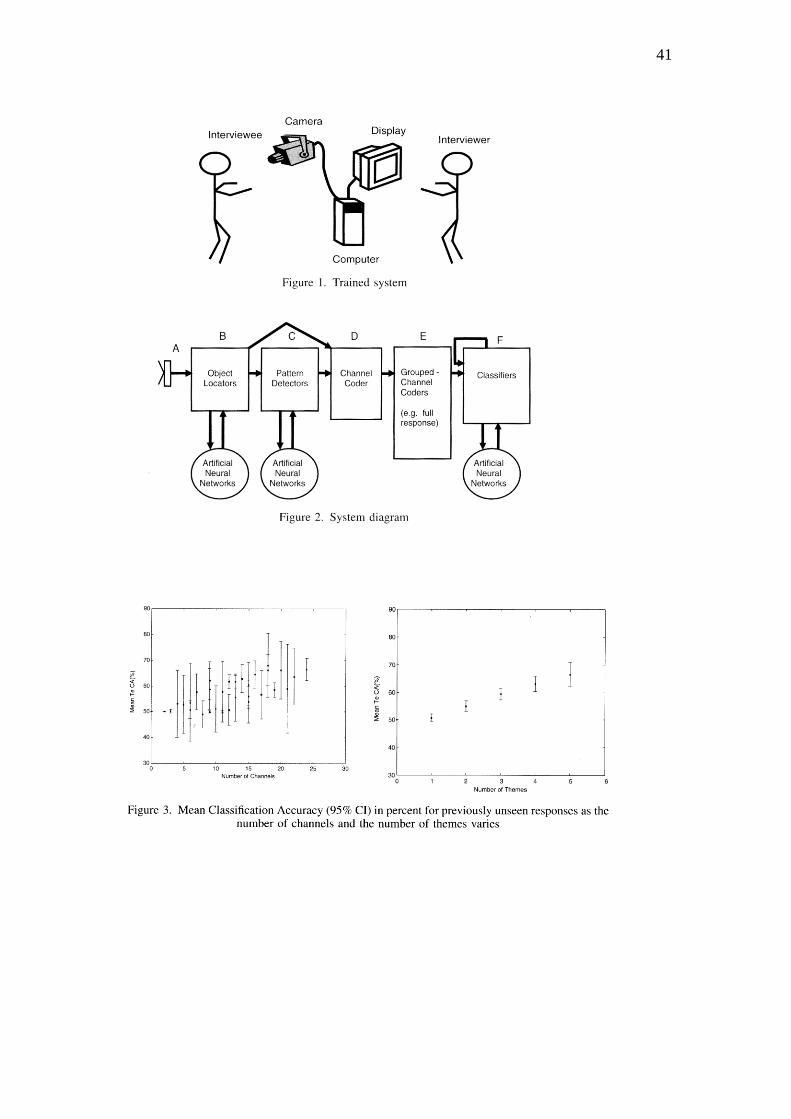
Figure 1 shows the working arrangement of a trained and tested system. The
system has been developed using a camera and laptop computer but dedicated
hardware could be utilised. The camera and computer are initialised. The interview
starts. The camera passes video frames of the interviewee to the computer (currently
to videotape which is digitised and then to the computer), which uses ANNs to track
body parts, extract channel data over time and to analyse patterns across channels.
The computer displays a classification to the interviewer.
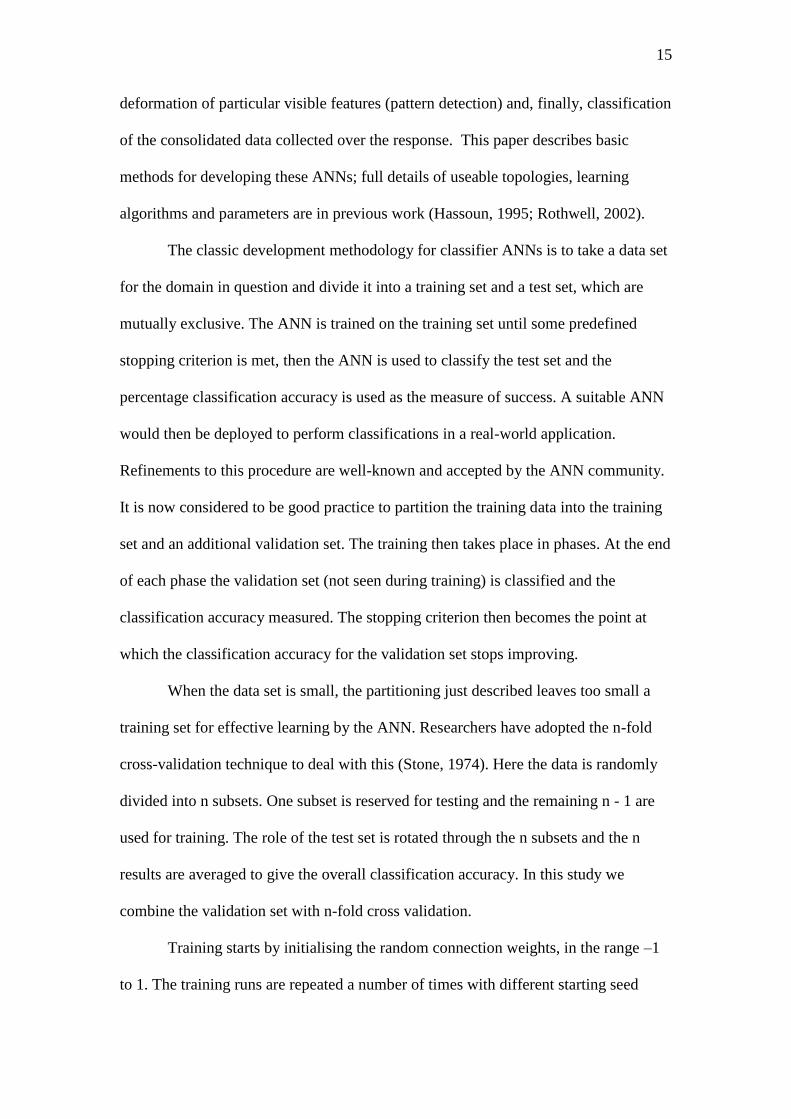
Figure 2 shows a diagram of the system (described more fully in the
International Patent Number WO02087443 (2002)). Sections A (video camera) to C
(pattern detectors) are concerned with locating and examining the status of a number
of important channels, e.g. locating an eye and determining if it is closed. Sections D
and E refine and consolidate this data into a single stream which is used for
classification. Sets of ANNs are used in the location, detection and classification
stages. The procedure, from object location to classification, is said to be operating in
near real-time. This means that the system can process data fast enough to give
classifications of truth or deception on a question-by-question basis during an
interview. This definition differs from a narrower definition of real-time operation
used in computing and engineering.
Implementation
Classification of a participant‟s behaviour in responding to questions requires
the development of ANNs for identifying visible features (object location),
15
deformation of particular visible features (pattern detection) and, finally, classification
of the consolidated data collected over the response. This paper describes basic
methods for developing these ANNs; full details of useable topologies, learning
algorithms and parameters are in previous work (Hassoun, 1995; Rothwell, 2002).
The classic development methodology for classifier ANNs is to take a data set
for the domain in question and divide it into a training set and a test set, which are
mutually exclusive. The ANN is trained on the training set until some predefined
stopping criterion is met, then the ANN is used to classify the test set and the
percentage classification accuracy is used as the measure of success. A suitable ANN
would then be deployed to perform classifications in a real-world application.
Refinements to this procedure are well-known and accepted by the ANN community.
It is now considered to be good practice to partition the training data into the training
set and an additional validation set. The training then takes place in phases. At the end
of each phase the validation set (not seen during training) is classified and the
classification accuracy measured. The stopping criterion then becomes the point at
which the classification accuracy for the validation set stops improving.
When the data set is small, the partitioning just described leaves too small a
training set for effective learning by the ANN. Researchers have adopted the n-fold
cross-validation technique to deal with this (Stone, 1974). Here the data is randomly
divided into n subsets. One subset is reserved for testing and the remaining n - 1 are
used for training. The role of the test set is rotated through the n subsets and the n
results are averaged to give the overall classification accuracy. In this study we
combine the validation set with n-fold cross validation.
Training starts by initialising the random connection weights, in the range –1
to 1. The training runs are repeated a number of times with different starting seed
16
values. This avoids the training of the ANN being stalled at a sub-optimal level of
performance (Hassoun, 1985). Classification accuracy of the validation set is also
used to choose a single ANN from a set of ANNs having different seeds (different
random starting weights).
Object locator ANNs
Each object locator specialises in a visible feature such as a face, eye, eyebrow
or nose. The development of the face locator provides a good representation of the
object locators as a whole. In this study, face and non-face images were collected
from the training video frames. The face images were cropped to the eye and nose
area; non-face images were collected randomly from appropriate areas of the frame.
The images were standardised using a set of well-known techniques (Kung, Fang,
Chui, and Taur, 1995; Lin, Kung, and Lin, 1997; Rae and Ritter, 1998; Rothwell,
2002; Swets and Weng, 1996). The result was a numeric pattern (vector) suitable for
input to an ANN. The ANNs can learn to cope with distractions such as makeup,
glasses, and facial hair.
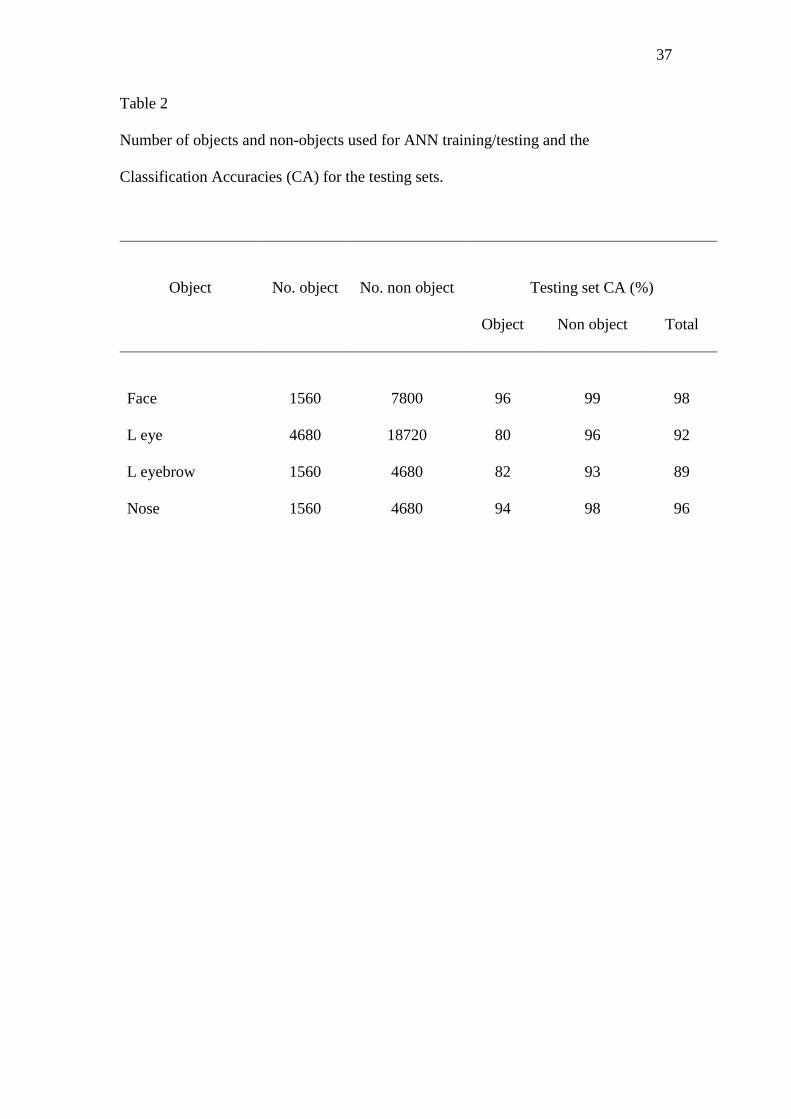
Table 2 contains training and testing details for each object locator -face, left
eye, left eyebrow and nose: the right-handed features being treated as mirror-images
of their left-hand equivalents. In each case, half of the objects and non-objects were
used for training, and the others used for testing purposes. For each test image the
ANN output was compared to a manual classification. The Classification Accuracies
are the percentage of objects classified correctly by the ANN, the percentage of non-
objects images classified correctly and the overall total percentage of object and non-
object images classified correctly.
Pattern detector ANNs
17
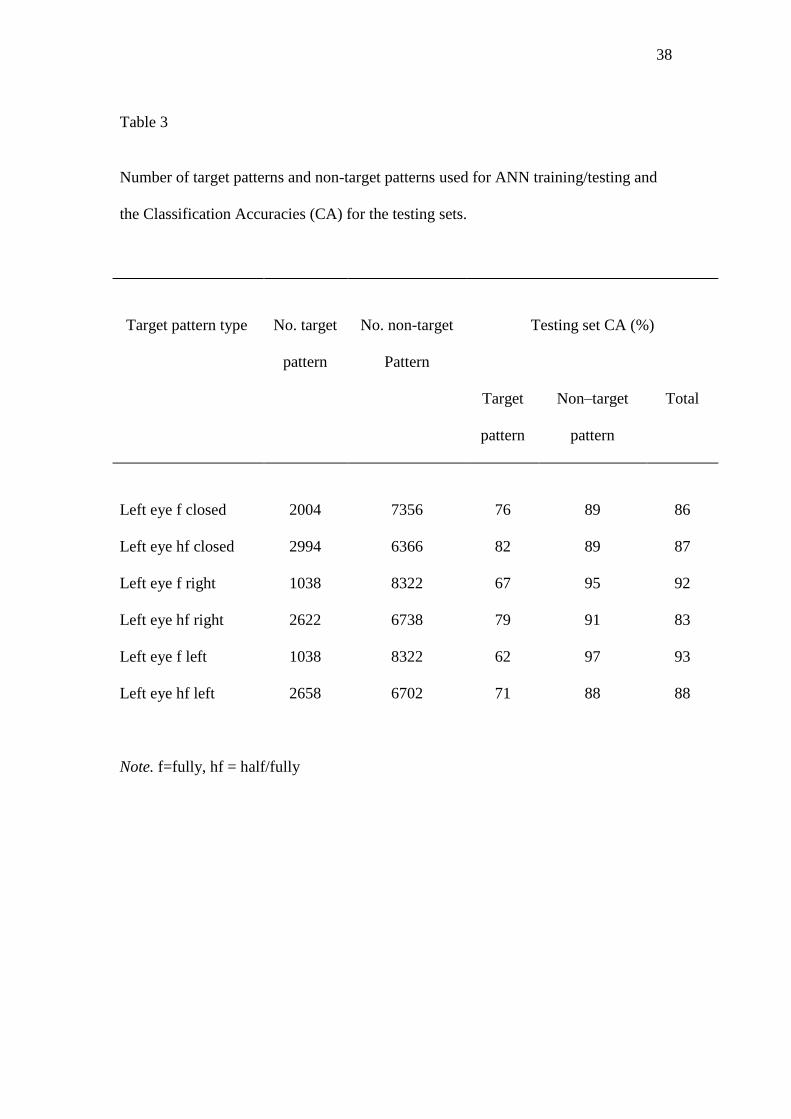
A similar procedure was adopted for the pattern detectors, which detect
changes in state of the objects. Training and testing details for these are given in Table
3. For example, images of the left eye were collected from the training data video
frames. These were labelled as one of two classes – the first being the eye fully closed
(target pattern), the second being all other states of openness of the eye (non-target
patterns). This data was then partitioned into training and test sets for the eye closed
classifier ANN.
Channel coding
Three of the channels are static attributes of the participant. The remaining 21
are derived from the video frames. The data from these 21 channels is consolidated
over a certain time period and concatenated to the first 3 to form the input of the ANN
which acts as the behaviour classifier. The inputs to the ANN are real-valued in the
range –1 to 1. Of the 774 useful individual responses to questions, 688 produced
valid channel data when passed through the object location and pattern detection
stages. The remaining responses were rejected due to the channel outputs being
invalid. This may have occurred, for example, because a particular object was not
located for the requisite time (at least 90% of the response time).
Training and Testing Results
Half of the interviews were truthful and contained 10 truthful (tt) responses.
The other interviews were deceptive and contained 7 deceptive (dd) and 3 truthful (td)
responses. In real-life situations it is likely that someone deceiving will tell the truth
some of the time. People telling the truth in a deceptive interview may exhibit a
deceptive behaviour because their general intention is to deceive. The behaviour may
thus be ambiguous. In these trials the classification for tt responses was always truth
18
and the classification for dd responses was always deception. However, in some trials
we treated td responses as truthful responses and in other trials as deceptive
responses.
We define: DA as the „deception accuracy‟, the percentage of deceptive
responses classified correctly; TA as the „truth accuracy‟, the percentage of truthful
responses classified correctly; and CA is the overall „classification accuracy‟, the
combined percentage of truthful and deceptive responses classified correctly in their
respective categories.
A number of trials were carried out. In each trial the data vectors were split
into Training (Tr), Validation (Val) and Testing (Te) sets. Tr was used for ANN
weight adjustments and the selection of other neural network parameters. Val was
used as a stopping condition and for choosing one ANN from a set of trained ANNs
that had different starting seeds. Te was used for final testing. Neither Val nor Te was
used to adjust the ANN parameters. .
A correct classification of dd as deception corresponds to DA; a correct
classification of tt as truth corresponds to TA; if a td is treated as truth a correct
classification corresponds to TA; if a td is treated as deception a correct classification
corresponds to DA.
Trials A, B and C are initial trials that investigated whether the system could
detect deception (A), the effect of classification accuracy as channel numbers were
increased (B) and the effect of gender and race (C). Trials D concentrated upon
between-subject analyses for one sub-group of participants, European men, for both
unplanned and planned responses in order to obtain approximate classification
accuracies for previously unseen interviewees.
Trial A: Using Randomised Vectors
19
In this first type of trial the 688 channel measurement data vectors were
randomised into eight training, validation, and testing sets (Tr:Val:Te =6:1:1). Cross-
validation was employed to make best use of the data. For each trial, one eighth of the
data was retained for testing purposes. The trial was repeated 128 times, each ANN
having a different starting seed (8), Tr:Val:Te set (8) and psychological classification
(2). When the td responses were set to truth, the mean DA, TA and CA values for the
8 Te sets were 72%, 61%, and 66% (SD = 6%). When the td responses were set to
deception, the mean DA, TA and CA values were 80%, 78%, and 79% (SD = 5%).
The results are for randomised vectors. ANN training has used examples of each
person‟s responses. Vectors in Te are different responses but are for the same group
of people.
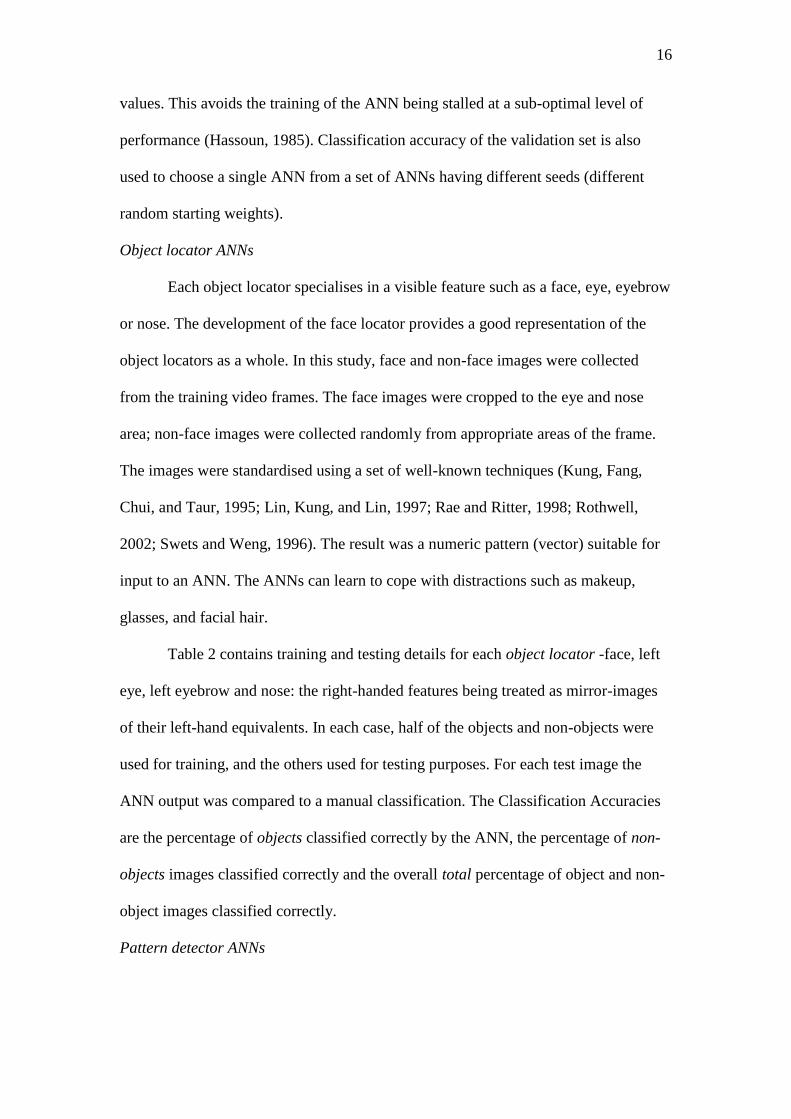
Trial B: Varying the Number of Channels
In this trial the number of channels was varied. The 688 channel measurement
data vectors were repartitioned into three training, validation, and testing sets (
Tr:Val:Te=1:1:1). The td responses were set to truth. The trial was repeated 744
times, each ANN having a different theme combination (31), starting seed (8) and
Tr:Val:Te set (3). Each theme was used on its own (5), two themes were used (10
possible combinations), three themes (10 possible combinations), four themes (5
possible combinations) and five themes together (1).
Figure 3 shows the mean Te CA values. Where there are large 95% CI error
bars this is because the results are based upon just 3 ANNs chosen by the validation
sets. The figure shows that using more channels or data themes causes an increase in
CA. Each theme or channel, on its own, gives results close to chance levels. The
result that eye gaze alone is a poor indicator of truth/deception, concurs with results
reported previously (Baker, Goldstein, and Stern, 1992). Eye closure, head movement
20
and blushing/blanching, and known data on their own, also give results close to
chance levels. However, using more channels or data themes causes an increase in
CA, showing that each channel appears to be highly relevant when presented with
other channel data. Thus, for this set of channels it is the relationships between the
channels that are important and not the individual channels themselves.
Vectors in the testing set are different responses but are for the same group of
people. This may be suitable in certain applications. However, in most real-world
situations it is desirable that processes related to deception and truth are detected in
previously unseen people and that no „base-line‟ measurements or feedback are
required. Therefore, in subsequent trials, Testing contained persons not seen in either
Training or Validation.
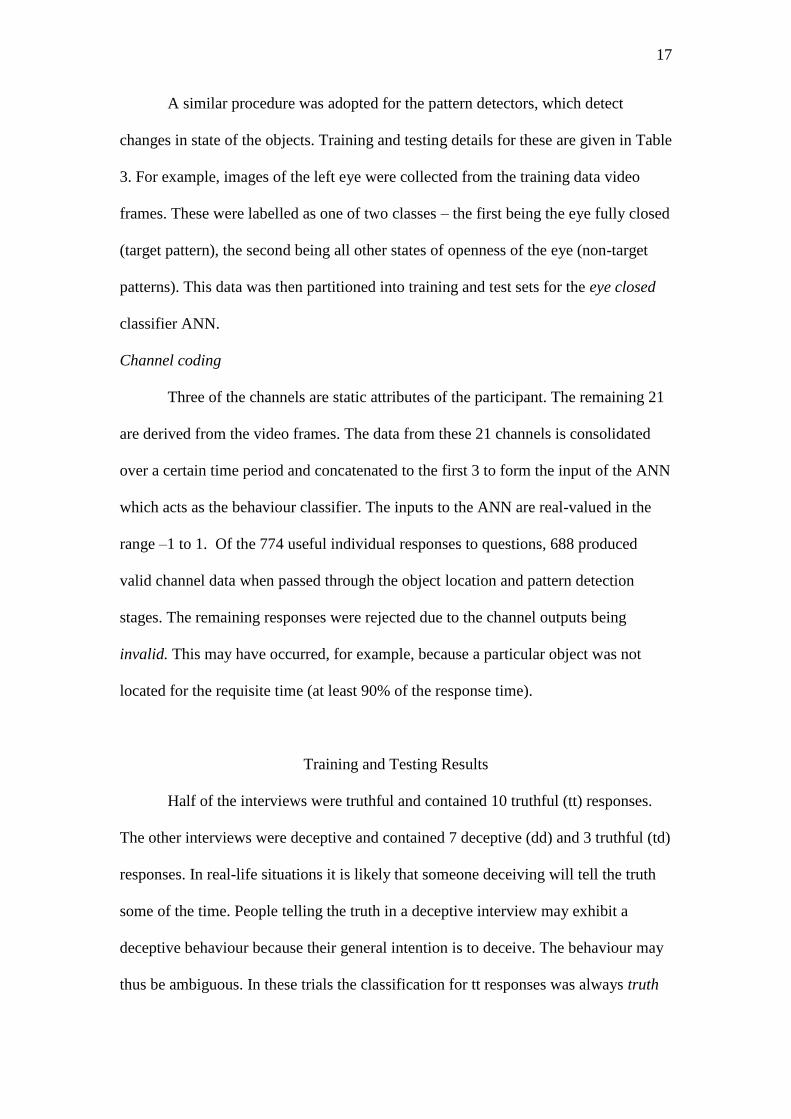
Trial C: Investigating Gender and Ethnic/ Cultural Differences
This trial investigated the influence of gender and ethnicity/culture in varying
deceptive behaviour. Eight Tr:Val:Te sets were initially constructed. There were 15
European men in the data set. For each set Tr/Val contained the responses from 13
European men and different European men (2) were retained for testing. A further
three testing sets Te1, Te2 and Te3 were constructed, these containing European
women (14), non-European men (5) and non-European women (5). As far as the ANN
was concerned each person was a European man. This was done by a manual
adjustment of the „known data‟ part of each response input pattern. There were
approximately 20 responses per person. The td responses were set to truth. The trial
was repeated 64 times, each ANN having a different starting seed (8) and Tr:Val:Te
set (8). The final set of trained ANNs were tested with Te, Te1, Te2 and Te3.
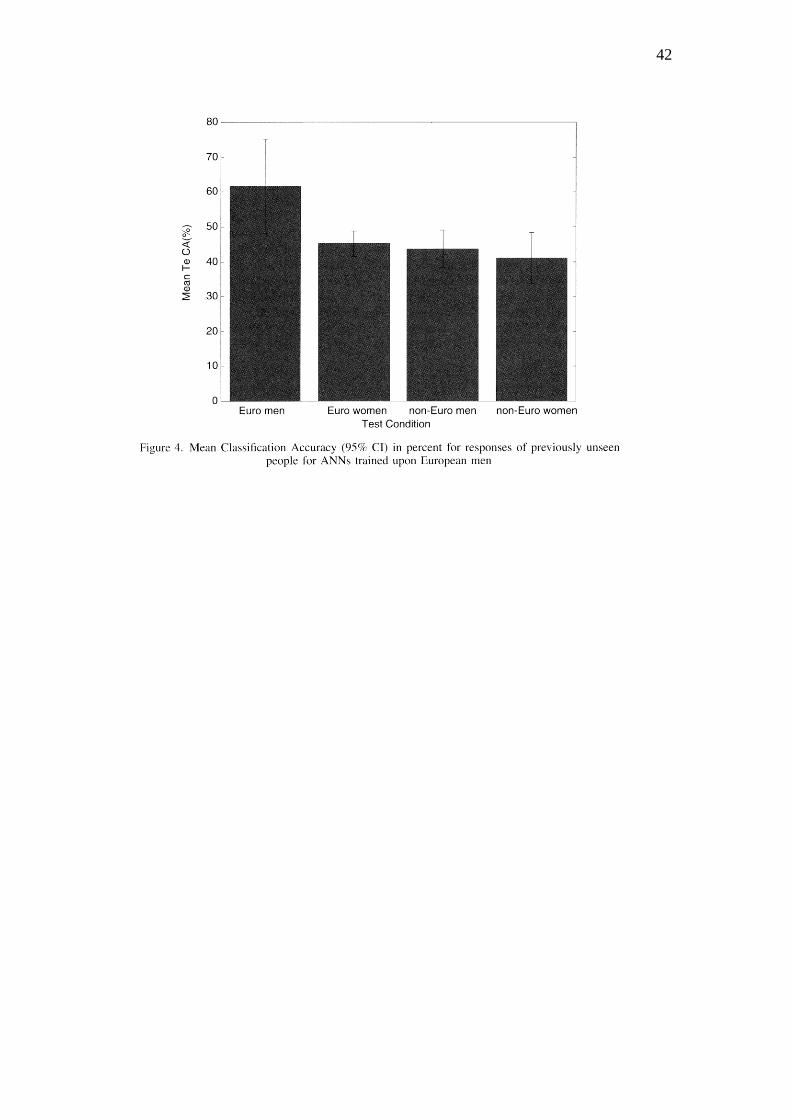
The mean Te, Te1, Te2 and Te3 CA values are shown in figure 4. The CA for
European men is higher than for person types not trained upon. These persons may
21
exhibit slightly different patterns of behaviour compared to European men. This
concurs with literature, which indicates that there are differences between the
behaviours of men and women and people of different culture (Bond, 1990; Vrij,
2000). On examining the actual ANN outputs it was found that, in each case, the fall
in CA was due to a fall in the number of deceptive responses detected. The system has
a truthful bias and is less able at detecting patterns that indicate deception when used
with person types it has not been trained upon.
Trial D: Unplanned and Planned Responses of European men
Trial D concentrated upon analyses for unseen European men, for both
unplanned and planned responses in order to obtain approximate classification
accuracies and to determine whether the results were significantly above chance
levels. We used an alpha level of .05 for all statistical tests. Te contained persons not
seen in either Tr or Val. The classification of td responses was varied between the
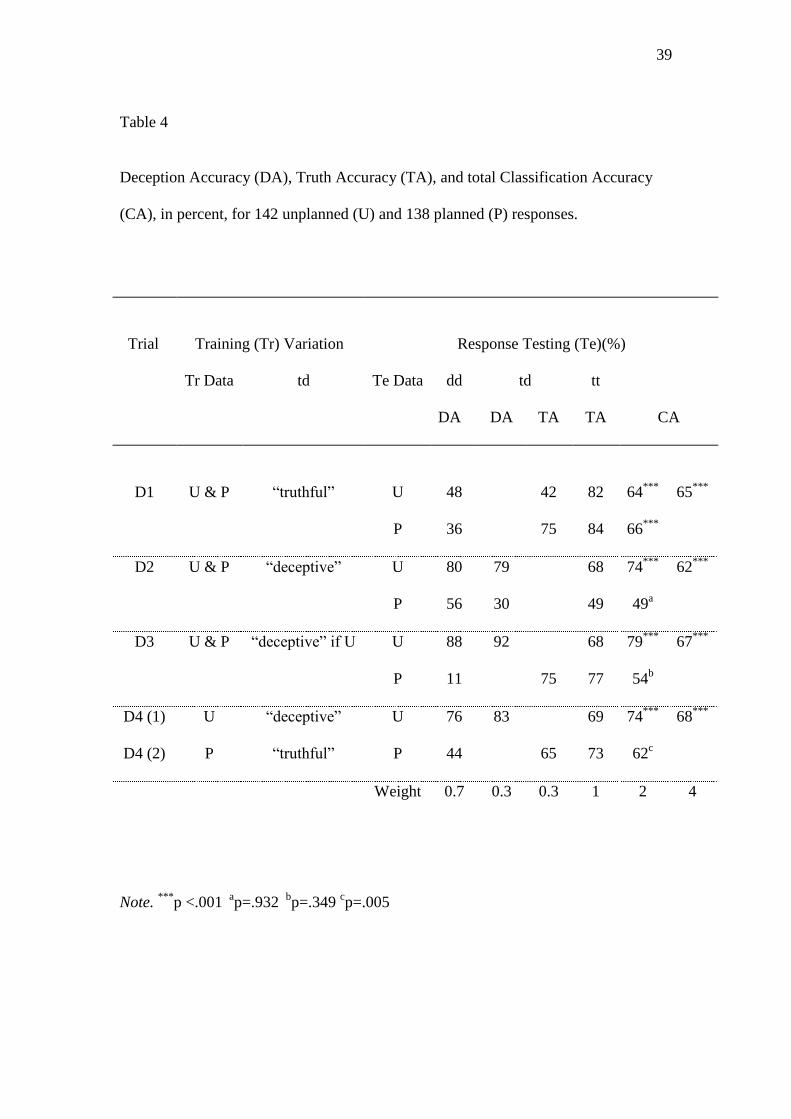
sub-trials D1 to D4. Table 4 shows the Deception Accuracy (DA), Truth Accuracy
(TA) and the Classification Accuracies (CA) of responses for trials D1 to D4.
European men Trial D1: td Response set to “truth”
Fifteen Tr:Val:Te sets were constructed such that Tr:Val contained the
randomised vectors of 14 European men, Te contained the responses from the
remaining European man. The trial was repeated 120 times each ANN having a
different Tr:Val:Te set (15) and seed (8). The training and testing was such that
truthful responses from a deceptive interview, td responses, were classified as “truth”.
The testing results in Table 4 for planned interviews show that the
classification of truthful (td) responses is similar to truthful (tt) responses. The
participant is exhibiting a truthful behaviour for both td and tt responses. For
unplanned interviews the classification for truthful (tt) responses is better than truthful
22
(td) responses. The results suggest that the pattern of behaviour exhibited during the
td responses of an unplanned interview may be slightly deceptive even though the
actual verbal content is truthful. The participant may leak a deceptive pattern of
behaviour when they are telling the truth because a participant knows that he or she
has just deceived or will have to deceive soon. For the planned interviews the
participant knew the questions and question order. The td result indicates less or no
leakage.
In training and testing it was assumed that the td patterns were “truth” but the
results indicate that in the unplanned interview the td patterns indicate a deceptive
behaviour not a truthful behaviour as was expected. The inclusion of such responses
in the training set damages the ability of the ANN to learn the patterns that represent a
deceptive behaviour because the ANN is incorrectly being told that a deceptive
pattern of behaviour is a truthful pattern of behaviour. Therefore the results for
deceptive responses are sub-optimal.
European men Trial D2: td Response set to “deception”
The only difference between the trials D1 and D2 was how the truthful
responses from a deceptive interview (td responses) were handled during training and
testing. In this trial the td responses were set to “deception”. The testing results in
Table 4 for unplanned interviews show that the classification of deceptive (td)
responses is similar to deceptive (dd) responses. The participant is exhibiting a
deceptive behaviour for both td and dd responses. The results confirm that the pattern
of behaviour exhibited during the td responses of an unplanned interview may be
slightly deceptive even though the actual verbal content is truthful. For planned
interviews the classification for deceptive (dd) responses is better than deceptive (td)
responses. It is likely that the td responses from planned interviews thus exhibit a
23
truthful pattern of behaviour, which again, confirms the results from trial D1. As with
trial D1, the results for deceptive responses are sub-optimal because of the inclusion
of such responses in the training set. Trial D3 attempts to remedy this problem.
European men Trial D3: td Response set to “deception” in only Unplanned
Interviews
This trial was a repeat of D1 and D2 but the classification was such that a td
response was set to “deception” when it occurred in an unplanned interview and
“truth” when it occurred in a planned interview. The testing results in Table 4 for
unplanned interviews show that the classification of deceptive (td) responses is
similar to deceptive (dd) responses and that for planned interviews the classification
of truthful (td) responses is similar to truthful (tt) responses. The slight increase in CA
for unplanned interviews is due to the more correct classification of the td responses.
Again, this confirms that in an unplanned deceptive interview a response with a
truthful content may offer a deceptive pattern of behaviour.
For planned interviews the overall results are only to chance levels. The
planned deceptive (dd) responses appear to be different to the unplanned deceptive
(dd) responses because the DA values are very different. One hypothesis that might
explain the results would be that the ANN has biased itself towards learning responses
from the unplanned interviews. This was addressed in trial D4.
European men Trial D4: Training upon only Unplanned or only Planned Responses
In trial D3 training was upon both planned and unplanned responses. In the
first part of trial D4 only the unplanned responses were used for both training and
testing. In the second part of trial D4 only the planned responses were used for both
training and testing. The treatment of the td responses was as per trial D3, that is
24
“deception” for unplanned responses and “truth” for planned responses. The data set
used in each part of the trial was approximately one half that used in trial D3.
The testing results in table 4 show that for the first part of this trial, the CA for
responses from unplanned interviews (74%) is slightly lower than trial D3 (79%) but
this may be because the data set is smaller. For the second part of the trial, the CA for
responses from planned interviews is slightly higher (62%) than trial D3 (54%). This
is still lower than that for unplanned interviews due to the poor classification of
deceptive responses (44%). The poor result may be due to a number of reasons. First,
only 35% of the responses of the planned data set are deceptive giving the ANN fewer
examples to learn. Second, the planned deceptive responses may be more difficult to
learn. Trial D2 indicated that planned and unplanned deceptive responses might be
different. In unplanned interviews, deceptive participants may be more impulsive and
provide similar behaviours to one another. In planned interviews the participant may
bring into use strategies learnt over a life-time, such strategies resulting in a greater
range of participant behaviour. Third, because a planned truthful interview followed
an earlier unplanned deceptive interview there may be some carry-over, e.g. an
attempt to conceal previous deception .Thus, it is likely that the differences between
planned truthful and planned deceptive responses are less distinct. A larger number of
participants used in training will probably provide improved results. Also, a planned
truthful interview should not follow an earlier interview where the participant was
being deceptive.
European men: Accuracy of Response Classification
Trial D4 is the „fairest‟ trial because unplanned and planned responses are
slightly different and thus training and testing should be done separately. CA for
unplanned responses is 74% and for planned responses 62%. The results are likely to
25
improve with a larger data set, as suggested by the results for unplanned interviews in
trial D3.
European men: Accuracy of Interview Classification
For some purposes an interviewer may find a simple, coarse classification of
the interview to be sufficient. Specifically, to know if a participant‟s overall behaviour
was truthful or deceptive during the interview. In this work an interview is deemed to
be deceptive if three or more responses are deceptive. This criterion and the results
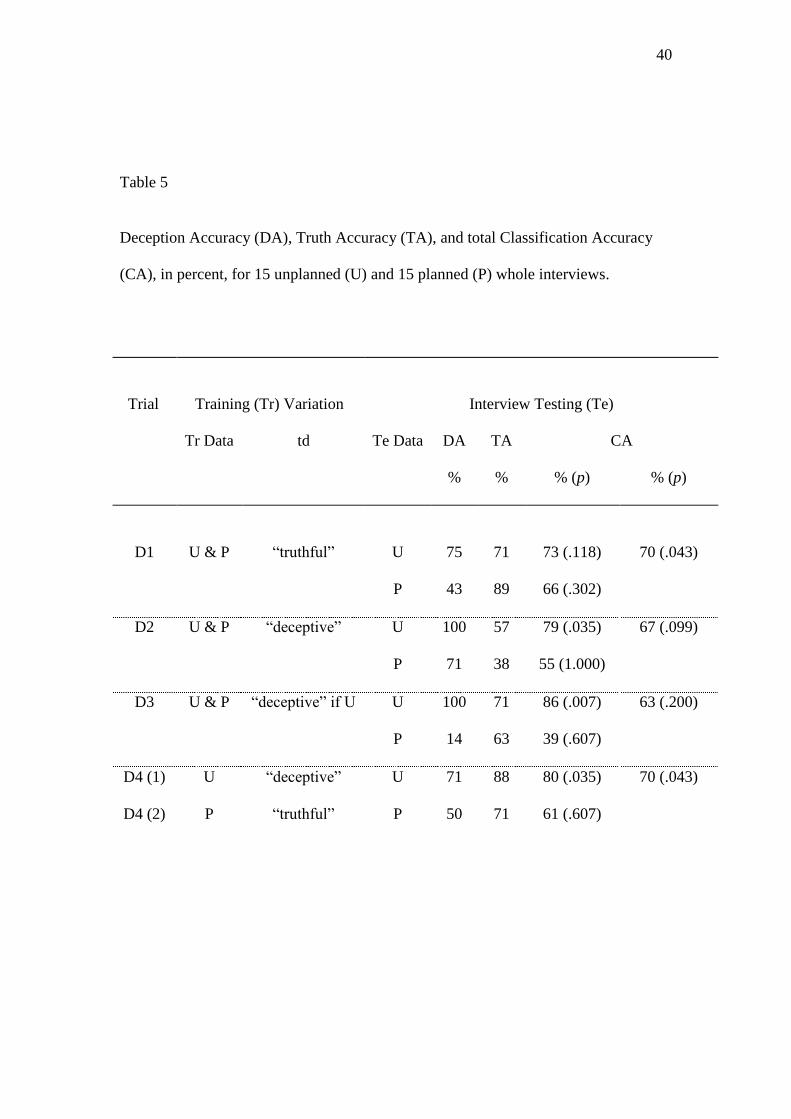
determined in D1, D2, D3 and D4 produces the DA, TA and CA values in Table 5. In
trial D4 the CA for unplanned interviews is 80% and for planned interviews 61%.
Previous Trials A, B and C
The results from trial D show that the behaviour of participants differs
depending upon whether an interview is planned or unplanned. Also, in an unplanned
interview the td responses, although having a truthful content, may provide a
deceptive behaviour pattern. Thus the training and testing strategies used in trials A, B
and C provide CA values that are sub-optimal. The data still supports the hypothesis
that as the number of channels increases so does the CA and also that men and women
and people of different ethnicity/culture exhibit different patterns of behaviour.
Changes to trial A, a within-participant/interview designed trial, such that unplanned
interviews from European men are used and the td responses are set to „deception‟
gives CA=87% (p<0.001). This compares to CA=74% (p<0.001) when classifying
different European men. The classification rate for the same men but responses from a
different unplanned interview is likely to be between 74% and 87%.
Discussion
Multichannel Approach
26
Telling lies involves control, arousal/felt emotion and cognitive
processing(Ekman,1985).Many different channels may indicate deception; no single
channel is the best or most sensitive source and some are more controllable than
others (Zuckerman and Driver,1985). In this work Silent Talker uses a multichannel
approach to detect patterns between the channels. The relationship between channels
is particularly important, for example in indicating incongruence. Silent Talker can
detect behaviours associated with “deception” and as the number of channels
increases (Trial B) so does the classification accuracy. The multichannel approach is
needed to obtain reasonable accuracy levels and a robust system.
Specialist multichannel pattern classifiers, such as “Unplanned Response
European Female classifier” can be created fairly easily. This is useful because
different scenarios, interviewer and interviewee types provide different channel
patterns (Bond, 1990; Feldman and Rime, 1991; Vrij, 2000). The choice of classifier
can be made automatically in-use by the use of artificial intelligence.
Vrij and Mann (2004) suggest that high hit rates could be achieved by
employing an objective and systematic lie detection method. Silent Talker satisfies
both of these requirements. Further, it does not suffer from fatigue and can rapidly
record and analyse many more cues than a human. The authors also state that it “may
well be the case that, when controlling their behaviour, liars may „over-control‟ their
behaviour and may exhibit patterns of behaving that will appear planned, rehearsed,
and lacking in spontaneity”. Silent Talker is an ideal method of detecting such
patterns.
Classification Accuracy
With Silent Talker, the classification accuracies were obtained non-invasively,
in near real-time, used many channels, and did not require a base-line test or a highly
27
trained „expert‟. The classification accuracies depend upon the situation, the people in
the data set (number and type) and the channels used (number and type). In most
interview situations the responses will be unplanned. In trial D4, where training was
upon unplanned interviews of European men, and testing was upon unplanned
interviews of different European men, 74% (p<.001) of responses and 80% of
interviews (12 out of 15, p=.035) were classified correctly. The results are
significantly above chance levels (p<.05).
. The human interviewers classified 6 of the 14 participants, to chance levels
(p=.791). (The other participant, by choice of language, made it obvious which
interview was deceptive.) It may be suggested that the participants in this work were
particularly poor liars. The experimental methodology was designed to prevent this.
It is also possible that the interviewers were particularly poor at detecting lies.
However, they did achieve the levels of detection normally expected (Zuckerman and
Driver, 1985). Their mean classification accuracy across all interview pairs was 46%,
this being consistent with chance levels (p = .736).
Comparison of Classification Accuracy
The analysis by Zuckerman and Driver (1985) of previous deception studies
showed that the accuracy of lie detection was between 45% and 60%. Using the same
interview procedure as in this work police officers attained 60% accuracy when
viewing only hand movements but also given information and feedback (Vrij , 1994).
From ten other studies, the best accuracy attained was 70% by students (Vrij, 2000).
Police officers also attained 76% (Porter et al. 2000) given information and feedback,
but the same speakers may have been used for pre and post training. The accuracies
are for interviews not individual responses. The results from the current work
28
compare favourably with these manual and often-laborious methods that require a
trained „expert‟.
Ekman et al. (1991) reports 86% accuracy when analysing participants‟ smile
type and voice pitch when describing a scene truthfully or deceptively. Participants
had to describe both horrific and beautiful scenes as being serene. The accuracy
quoted is related to the complete unplanned description, not an individual response.
The Silent Talker system was almost able to match these results, obtaining 80% for
unplanned interviews (86% in trial D3 ). t would be with the scenario presented in the
current study. Despite the limitations placed on detection systems by the use of only
two channels, particularly when one, voice pitch, requires a valid baseline test, the use
of smile type and voice pitch is of interest to the current study; both channels could be
added to Silent Talker, increasing its potential to detect incongruences.
A summary of laboratory-based Polygraph tests reviewed by Vrij (2000) gives
the accuracy close to 70%. The results rely upon a valid base-line test. The Polygraph
uses only a small number of channels that are indicators of arousal. Given knowledge
of the Polygraph, subjects can control their responses. Voice analysis devices also rely
upon a valid base-line test and tend to measure arousal. Cestaro and Dollins(1994)
gives the accuracy of these devices as close to chance levels. The results from the
current work compare favourably with both of these approaches. In this paper, results
are reported for full responses and for whole interviews. Classifying short time
periods in isolation is more difficult than classifying a whole interview, which can
result from a single instance of deception. Accuracies reported in the literature are
typically for a whole interview of unspecified length When undertaking comparisons
it is important to consider whether the accuracy is for a short time-period (and what
that time is) or for a whole interview.
29
Limitations and Future Work
Each participant was assigned to perform both a deceptive and truthful
interview. Greater realism might have been obtained if the participants had free
choice as to which to perform. Motivation levels were low, so we attempted to raise
the stakes in the laboratory experiment by introducing lying as an important skill.
Nevertheless, we accept that the behaviours being displayed are more comparable to
everyday lies than high stake ones. Silent Talker may well be more accurate when
trained and validated in high stake situations because deception in such situations is
easier to detect (Vrij 2000) . .
The channels that we measured have been investigated by other researchers
(Zuckerman and Driver, 1985; Ekman, 1985). Individually they provided only chance
level accuracy. We were required to use multiple channels to obtain reasonable
accuracy levels. We hypothesised that this was because the channel interrelationships
were important not the individual channels.
. The inclusion of channels that offer more indicative behaviours, such as
finger movements (Vrij, 1994; Vrij, 2000), is likely to further improve the accuracy
rates .However, the over-reliance on any given channel could prove to be counter-
productive. As with the Polygraph, a subject could learn how to manipulate(or hide) a
particular channel that is known to be important.
Regarding data collection, a truthful interview may be biased by prior
behaviour if it follows a deceptive interview; a subject might appear deceptive
because they are covering up the fact that they lied in the previous interview.
Consequently, planned truthful interviews need to be handled differently, for example
by having two truthful interviews.
30
The starting point for future work, is the collection of a larger data set. As
more examples of behaviours are seen by the system, the classification upon
previously unseen participants is improved. Specialist multichannel pattern classifiers,
for example „European Female Classifier‟, may also offer improved accuracies. For
practical applications, real-life video data will need to be collected for training and
testing purposes along with the known ground truth as determined by other means.
Interviewer, stakes and physical setting could be varied in order to examine exhibited
behaviours in these different scenarios.
The addition of more channels (Vrij, 1994; Vrij, 2000), will probably improve
the classification accuracy. Channels could be nonverbal and auditory cues (e.g.
finger/hand, foot, torso movement, voice pitch), speech content related (e.g. number
of „self references‟) or some other cue, such as brain wave activity.
A person‟s nonverbal behaviour can alter significantly over a full response.
Initial trials using short fixed time-period data suggest the possibility of “charting” a
person‟s behaviour over an interview. Multiple cameras can also facilitate channel
extraction from a number of people at once, so that individual behaviours and
interactions between people can be analysed. A possible application of this would be
monitoring behaviour at airport check-ins. Using a machine questioner in the training,
testing and in-use phases would permit the system to be automated.. This would allow
staff to concentrate on those passengers more likely to be of concern. Data is
currently being collected for a possible medical application and applications in
business and education. Obviously, to use Silent Talker in such applications, the data
needs to be processed directly from the camera, i.e. „on the fly‟.
Conclusion
31
This paper presents a new ANN-based psychological profiling system, Silent
Talker. The system was tested by attempting to detect behaviours related to deception,
however, many other applications are apparent. The advantages of Silent Talker are
that the system is non-invasive, operates in real-time, does not rely upon a small
number of channels/cues and, as an ANN-based system, provides the long-sought-
after objectivity required in profiling. The system allows for the exchange and/or
addition of channels. For each application, many output classifications and situational
variants can be examined. Different classifiers can be trained for different groups of
people and different situations in order to fine tune the system. Machines that rely
upon one, two, three or a limited number of channels can easily be affected by some
factor other than the one being measured or by the subject‟s conscious control of
those channels. Because Silent Talker operates upon multiple channels of nonverbal
behaviour it is likely to be a better detector of the psychology of a subject
32
References
Baker, L., Goldstein, R., Stern, J. A. (1992). Saccadic eye movements in deception.
(Report No. DoDPI92-R-0003). Fort McClellan, AL: Department of Defense
Polygraph Institute. (DTIC Document Reproduction Service No.
ADA304658)
Bandar, Z., McLean, D.A., O‟Shea, J.D., Rothwell, J.A.. (2002) International Patent
Number WO02087443. Geneva, Switzerland: World Intellectual Property
Organization.
Bartlett, M.S., Donato, G., Movellan, J.R., Hager, J.C., Ekman, P., Sejnowski, T.J.
(1999). Face image analysis for expression measurement and detection of
deceit. Proceedings of the 6th
Annual Joint Symposium on Neural
Computation. San Diego, CA: The Institute For Neural Computation,
University of California.
Bond. C. F. (1990). Lie Detection Across Cultures. Journal of Nonverbal Behavior,
14, 189-204.
Burgoon, J.K., Buller, D.B., Grandpre, J.R., Kalbfleisch, P. (1998). Sex differences in
presenting and detecting deceptive messages. In D.J. Canary & K. Dindia
(Eds.), Sex differences and similarities in communication: Critical essays and
empirical investigations of sex and gender in interaction (351-372). Mahwal,
NJ: Lawrence Erlbaum Associates.
Cestaro, V. L., Dollins, A. B. (1994). An analysis of voice responses for the detection
of deception. (Report No. DoDPI94-R-0001). Fort McClellan, AL:
Department of Defense Polygraph Institute. (DTIC Document Reproduction
Service No. ADA298417)
33
Cohn, J.F., Katz, G.S. (1998, September). Bimodal expression of emotion by face and
voice. Proceedings of the Sixth ACM international conference on Multimedia:
Workshop on Face/gesture recognition and their applications (41-44). NY:
ACM Press.
Efron, D. (1941). Gesture and environment. NY: King‟s Crown.
Ekman, P. (1985). Telling lies: Clues to deceit in the marketplace, politics and
marriage. NY: W.W. Norton and Company.
Ekman, P. (1988). Lying and nonverbal behavior: Theoretical issues and new
findings. Journal of Nonverbal Behavior, 12, 163-175.
Ekman, P. (1997). What the face reveals: Basic and applied studies of spontaneous
expression using the facial action coding system, Oxford University Press.
Ekman, P., O‟Sullivan, M., Friesen, W.V., Scherer, K.R. (1991). Invited Article:
Face, voice and body in detecting deceit. Journal of Nonverbal Behavior, 15,
125-135.
Etcoff, N.L., Ekman, P., Magee,J.J., Frank, M.G. (2000) Lie detection and language
comprehension. Nature 405, 139
Feldman, R.S., Rime, B. (1991). Fundamentals of non-verbal behavior. Cambridge,
England: Cambridge University Press.
Hassoun, M.H. (1995). Fundamentals of neural networks. Cambridge, MA: MIT
Press.
Iwano, Y., Sukegawa, H., Kasahara, Y., Shirai, K. (1995). Extraction of speaker‟s
feeling using facial image and speech. IEEE International Workshop on Robot
and Human Communication, 101-106.
Janisse, M.P. (1977). Pupillometry: The psychology of the pupillary response ( 64-
67). NY: Wiley, Series in clinical and community psychology.
34
Johnson, R. C. (1999, April 12). Computer Program Recognizes Facial Expressions,
Electronic Engineering Times.
http://www.eetimes.com/at/news/OEG19990405S0017 [1 December 2001]
Kung, S.Y., Fang, M., Chui, M.Y., Taur, J.S. (1995). Decision-based neural network
for face recognition system. Proceedings of the IEEE International
Conference in Image Processing, Washington D.C., 3, 430-433.
Lin, S., Kung, S., Lin, L. (1997). Face recognition/detection by probabilistic decision–
based neural networks. IEEE Transactions on Neural Networks, 8, 114-132.
Lykken, Prof D. T. (1998). A tremor in the blood: Uses and abuses of the lie detector.
Boulder, CO: Perseus Publishing.
Olsen, D.E., Harris, J.C., Capps, M.H., Ansley, N. (1997). Computerized Polygraph
scoring system. Journal of Forensic Sciences, 42, 61-70.
Pavidis, I., Eberhardt, N.L., Levine, J.A. (2002). Human behavior: Seeing through the
face of deception [Brief communication]. Nature, 425, 35.
Pease, A. (1984). Body Language: How to read others’ thoughts by their gestures.
London: Sheldon Press.
Porter S., Woodworth, M., Birt, A.R. (2000). Truth, lies and videotape: An
investigation of the ability of federal parole officers to detect deception. Law
and Human Behavior, 24 (6), 643-658.
Rae, R., Ritter, H.J. (1998). Recognition of human head orientation based on artificial
neural networks. IEEE Transactions on Neural Networks, 9, 357-265.
Rothwell, J.A. (2002). Artificial neural networks for psychological profiling using
multichannels of nonverbal behavior. Unpublished doctoral dissertation,
Manchester Metropolitan University, Manchester, England.
35
Scherer, K.R., & Ekman, P. (Eds.). (1982). Handbook of methods in nonverbal
behavior research. Cambridge: Cambridge University Press
Stone, M. (1974). Cross-validatory choice and assessment of statistical predictions.
Journal of the Royal Statistical Society, Series B, 36, 111-147.
Swets, D.L., Weng, J. (1996). Using discriminant eigenfeatures for image retrieval.
IEEE Transactions on Pattern Analysis and Machine Intelligence, 18, 831-836
Vrij, A. (1994). The impact of information and setting on detection of deception by
police detectives. Journal of Nonverbal Behavior, 18, 117-136
Vrij, A. (2000). Detecting lies and deceit: The psychology of lying and the
implications for professional practice. NY: Wiley, DOI: 10.1002/acp.743
Vrij, A., Evans, H., Akehurst, L., Mann, S. (2004). Rapid judgments in assessing
verbal and nonverbal cues: Their potential for deception researchers and lie
detection. Applied Cognitive Psychology, 18 (3), 283-296, DOI:
10.1002/acp.964
Vrij, A., Mann, S. (2004). Detecting deception: The benefit of looking at a
combination of behavioral, auditory and speech content related cues in a
systematic Manner. Group Decision and Negotiation, 13 (1), 61-79, DOI:
10.1023/B:GRUP.0000011946.74290.bc
Vrij, A., Semin, G.R. (1996). Lie experts‟ beliefs about nonverbal indicators of
deception. Journal of Nonverbal Behavior, 20, 65-80
Williams, D. (2001). How to sting the Polygraph. P.O. Box 720568, Norman, OK,
U.S.A: Sting Publications.
Zuckerman, M., Driver, R.E. (1985). Telling lies: Verbal and nonverbal correlates of
deception. In A.W. Siegman, & S. Feldstein (Eds.), Multichannel integrations
of nonverbal behavior. Hillside, NJ: L Erlbaum Associates.

36
Table 1
Channel Descriptions
Theme
Channel description
Known data female/male, European/Non-European, unplanned/planned (3)
Face/head
Movement
movement upwards, movement downwards, vertical movement,
movement left, movement right, horizontal movement,
scale (forward/back), movement forwards, movement backwards (9)
Eye gaze left eye looking to the left, to the right, moving side to side
right eye looking to the left, to the right, moving side to side (6)
Eye closure left eye closed, left eye blink, right eye closed, right eye blink (4)
Blushing/
Blanching
increase in face redness, decrease in face redness (2)
37
Table 2
Number of objects and non-objects used for ANN training/testing and the
Classification Accuracies (CA) for the testing sets.
Object
No. object
No. non object
Testing set CA (%)
Object Non object Total
Face 1560 7800 96 99 98
L eye 4680 18720 80 96 92
L eyebrow 1560 4680 82 93 89
Nose 1560 4680 94 98 96
38
Table 3
Number of target patterns and non-target patterns used for ANN training/testing and
the Classification Accuracies (CA) for the testing sets.
Target pattern type
No. target
pattern
No. non-target
Pattern
Testing set CA (%)
Target
pattern
Non–target
pattern
Total
Left eye f closed 2004 7356 76 89 86
Left eye hf closed 2994 6366 82 89 87
Left eye f right 1038 8322 67 95 92
Left eye hf right 2622 6738 79 91 83
Left eye f left 1038 8322 62 97 93
Left eye hf left 2658 6702 71 88 88
Note. f=fully, hf = half/fully
39
Table 4
Deception Accuracy (DA), Truth Accuracy (TA), and total Classification Accuracy
(CA), in percent, for 142 unplanned (U) and 138 planned (P) responses.
Trial
Training (Tr) Variation
Response Testing (Te)(%)
Tr Data td Te Data dd td tt
DA DA TA TA CA
D1 U & P “truthful” U 48 42 82 64***
65***
P 36 75 84 66***
D2 U & P “deceptive” U 80 79 68 74***
62***
P 56 30 49 49a
D3 U & P “deceptive” if U U 88 92 68 79***
67***
P 11 75 77 54b
D4 (1) U “deceptive” U 76 83 69 74***
68***
D4 (2) P “truthful” P 44 65 73 62c
Weight 0.7 0.3 0.3 1 2 4
Note. ***
p <.001 ap=.932
bp=.349
cp=.005
40
Table 5
Deception Accuracy (DA), Truth Accuracy (TA), and total Classification Accuracy
(CA), in percent, for 15 unplanned (U) and 15 planned (P) whole interviews.
Trial
Training (Tr) Variation
Interview Testing (Te)
Tr Data td Te Data DA TA CA
% % % (p) % (p)
D1 U & P “truthful” U 75 71 73 (.118) 70 (.043)
P 43 89 66 (.302)
D2 U & P “deceptive” U 100 57 79 (.035) 67 (.099)
P 71 38 55 (1.000)
D3 U & P “deceptive” if U U 100 71 86 (.007) 63 (.200)
P 14 63 39 (.607)
D4 (1) U “deceptive” U 71 88 80 (.035) 70 (.043)
D4 (2) P “truthful” P 50 71 61 (.607)
41
42