Embed Size (px)
Citation preview

Silence is Golden.
Suggested Donations in Voluntary Contribution Games
Donald J. Dale
Muhlenberg College
John Morgan
University of California, Berkeley
July 19, 2010
Abstract
We report on the results of laboratory experiments of voluntary giving with sug-
gested donations. Asking subjects to give the socially optimal amount reduces giving
compared to no suggestion. Asking subjects not to give also depresses giving. However,
moderate suggested donations produce modest positive e¤ects. We o¤er a model us-
ing the fairness equilibrium framework of Rabin (1993) that is capable of rationalizing
some of these results.
Keywords: Voluntary contributions, suggested donations, fairness
1

1 Introduction
In addition to being one of the greatest art museums in the world, New York�s Metropolitan
Museum of Art is also an exceptional value. Admission to the museum is free. Visitors
are, however, asked to make a �suggested donation�of $20, an amount that was increased
recently from its previous $15 level. Many visitors pay the suggested donation amount and,
indeed, the museum derives considerable income from this source, over $29 million in 2009.1
Suggested donations are a key tool in the arsenal of strategies used by various charities
in fund-raising. Considerable thought and debate goes into selecting the right amount to
suggest in fund-raising solicitations.
Given their widespread use, it stands to reason that suggested donations must be an
e¤ective means of increasing giving. However, there is scant evidence for this. Warwick
(2005) o¤ers examples based on his experiences where a lower suggested donation amount
produced more giving. Smith and Weyant (2006) conduct �eld experiments and observe a
similar e¤ect. Karlan and List (2007) conduct �eld experiments which include suggested
donation treatments but report no signi�cant e¤ects. Unlike the Metropolitan Museum,
suggested donations in their treatments referenced previous giving rather than specifying an
exact amount. Marks, Schansberg, and Croson (2003) conduct laboratory experiments and
�nd some positive e¤ect from suggested donations when contributors have di¤ering payo¤s
from giving. In their study, the charity (credibly) commits to a provision point mechanism
whereby, if it did not raise su¢ cient funds up to a speci�ed level, it would return all donations
to contributors. Such mechanisms are unusual in practice.
In light of this limited evidence, one might turn to theory as a guide for how suggested
donations could possibly help. When individuals have purely pecuniary motives, voluntary
contributions su¤er from the familiar free-rider problem. Indeed, in the simplest possible
speci�cation, the problem is isomorphic to a prisoner�s dilemma. Adding �cheap talk�in the
form of a suggested donation on top of this game should, in theory, have no e¤ect whatsoever.
Of course, a vast number of studies have shown that individuals do contribute to public
goods despite these pecuniary incentives (see, e.g., Ledyard, 1995). This has led to a growing
1Metropolitan Museum of Art, 2009 Annual Report.
2

theoretical literature postulating models where non-pecuniary incentives play a key role. For
example, Rabin and Charness (2002) o¤er a simple model incorporating a variety of non-
pecuniary preferences that is capable of rationalizing many of the �puzzles� observed in
laboratory experiments. One version of that model has the e¤ect of transforming voluntary
giving into a coordination game whereby individuals reciprocate giving behavior and punish
non-giving behavior by also withholding contributions. In principle, a suggested donation
might make giving more focal and thereby improve contributions.2 Perhaps the suggested
donation serves as a priming e¤ect and thereby shapes subsequent choice behavior. There
is a vast literature in psychology establishing the importance of priming across a variety
of decisions (see, e.g., Wegner and Bargh, 1998). However, so far as we are aware, the
priming e¤ect (if any) of suggested donation amounts has not been examined. The nearest
antecedent is Seely, van Huyck, and Battalio (2005). They study non-binding �assignments�
in four person repeated public goods games, focusing on credible assignments� assignments
that are followed by subjects. They �nd that e¢ cient assignments are rarely credible.
In this paper, we use laboratory experiments to study the e¤ects of suggested donations
on giving. Our �rst set of experiments looks at standard voluntary contribution games and
compares various suggested donation amounts to a control where no amount is suggested. We
�nd that asking individuals to contribute the socially optimal amount is, at best, ine¤ective.
It produces no rise in initial giving and signi�cantly more �donor fatigue�over the course of
the experiment. In contrast, a more moderate suggested donation amount produces modest
gains compared to the control. However, long-run giving (i.e. giving at the end of the
experiment) is not improved.
In light of this perverse negative e¤ect of suggesting the socially optimal contribution
amount, we formulate a theory model based on Rabin�s (1993) notion of fairness equilibrium
and show that it is capable of rationalizing our �ndings. However, for tractability reasons,
the theory model departs in various ways from the setting of the experiment. Moreover,
it is merely a post hoc rationalization of our �ndings. For these reasons, we subsequently
conducted a second set of experiments where subjects were paired and played a 15 period
prisoner�s dilemma. The model predicts that suggesting that subjects should cooperate
2Van Huyck, Gillette, and Battalio (1992) �nd this e¤ect in laboratory experiments of coordination games.
3

should reduce cooperation, and this is exactly what we �nd. Compared to remaining silent,
suggesting cooperation reduces cooperative behavior by 11.1%.
The theory also o¤ers a highly counterintuitive prediction� suggesting that players not
cooperate should produce more cooperation than silence. The underlying idea is that, by set-
ting a low threshold for �nice�behavior, the non-cooperative suggestion maximizes the scope
for generous behavior which improves outcomes. The theory, however, performs extremely
poorly in this regard. Suggesting non-cooperation reduces cooperative behavior dramati-
cally. Now, only 29.7% of choices are cooperative compared to 39.8% when cooperation was
suggested and 50.9% when no suggestion was o¤ered.
Our results may be best summarized by the title of the paper, when it comes to giving,
at least in laboratory settings, silence is golden. At best, suggested donations can modestly
and temporarily raise giving if set correctly. At worst, they can depress giving signi�cantly.
Moreover, the intuitively appealing suggestion of contributing to maximize social surplus
turns out to always be worse than no suggestion whatsoever.
In terms of practice, our results o¤er a number of insights. First, consistent with the
common intuition, the suggestion does have an e¤ect on giving behavior though not always
in the expected direction. Second, an �aggressive� ask can depress giving, sometimes by
considerable amounts. Third, even seemingly sensible suggestions such as donating the
amount which maximizes social surplus can turn out to be too aggressive. On the other
hand, too low a suggestion can be harmful as well.
Perhaps the most important insight is that, often times making no suggestion is best.
Outside of the context of charitable giving, the Radiohead pricing experiment shares many
similarities with our silence is golden �nding. In releasing its album In Rainbows, the band
Radiohead engaged in an audacious pricing strategy. Rather than o¤ering the album for sale
at some �xed price, they made it available for download at their website and allowed users
to pay what they wished with no suggested payment amount.3 Radiohead sold more than 3
million copies of In Rainbows (in all formats), vastly more than their previous o¤erings and
3When a user placed the album in the checkout bin, there a question mark appeared where the price
would normally be. Clicking the question mark produced the dialog box �It�s up to you.�Clicking it a second
time produced the dialog box �It�s really up to you.�
4
made considerably more money as well. 4
The remainder of the paper proceeds as follows: Section 2 describes and reports the results
from our voluntary contributions experiments. Section 3 o¤ers a fairness-based theory that
rationalizes these results. Section 4 then tests the theory using repeated prisoner�s dilemma
experiments and reports the results. Section 5 highlights other aspects of giving including
demographics. Finally, section 6 concludes.
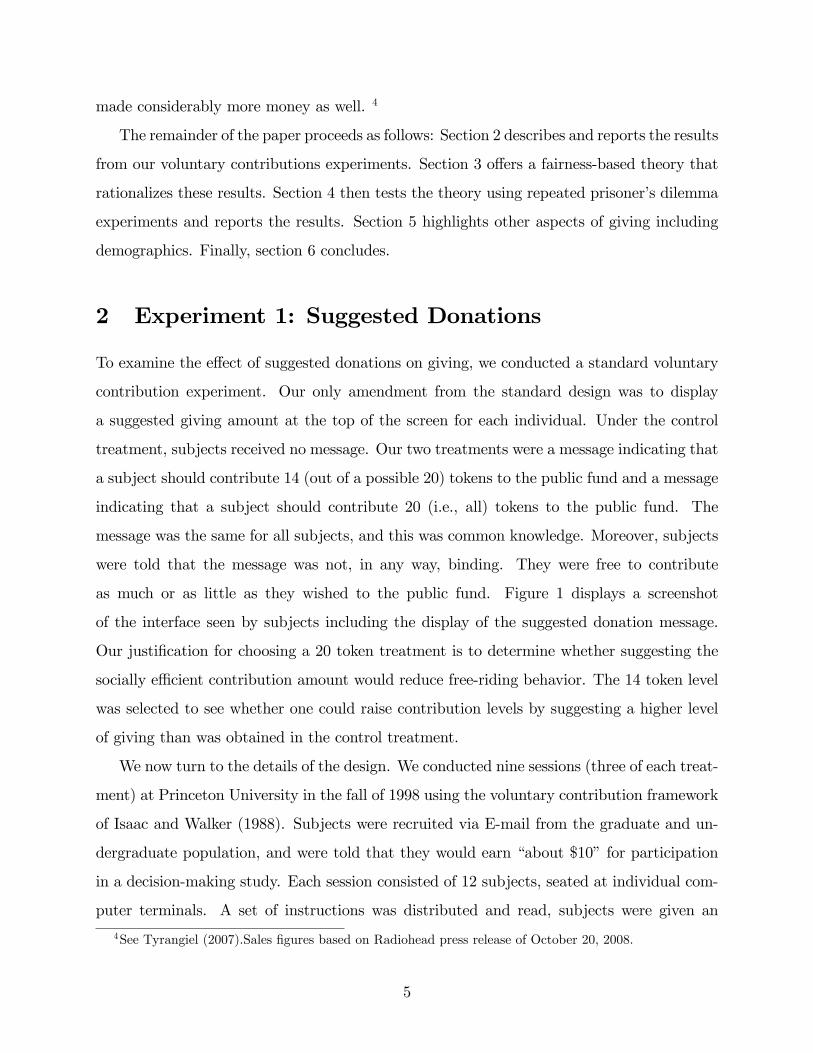
2 Experiment 1: Suggested Donations
To examine the e¤ect of suggested donations on giving, we conducted a standard voluntary
contribution experiment. Our only amendment from the standard design was to display
a suggested giving amount at the top of the screen for each individual. Under the control
treatment, subjects received no message. Our two treatments were a message indicating that
a subject should contribute 14 (out of a possible 20) tokens to the public fund and a message
indicating that a subject should contribute 20 (i.e., all) tokens to the public fund. The
message was the same for all subjects, and this was common knowledge. Moreover, subjects
were told that the message was not, in any way, binding. They were free to contribute
as much or as little as they wished to the public fund. Figure 1 displays a screenshot
of the interface seen by subjects including the display of the suggested donation message.
Our justi�cation for choosing a 20 token treatment is to determine whether suggesting the
socially e¢ cient contribution amount would reduce free-riding behavior. The 14 token level
was selected to see whether one could raise contribution levels by suggesting a higher level
of giving than was obtained in the control treatment.
We now turn to the details of the design. We conducted nine sessions (three of each treat-
ment) at Princeton University in the fall of 1998 using the voluntary contribution framework
of Isaac and Walker (1988). Subjects were recruited via E-mail from the graduate and un-
dergraduate population, and were told that they would earn �about $10�for participation
in a decision-making study. Each session consisted of 12 subjects, seated at individual com-
puter terminals. A set of instructions was distributed and read, subjects were given an
4See Tyrangiel (2007).Sales �gures based on Radiohead press release of October 20, 2008.
5

opportunity to ask questions, and then the decision-making component of the experiment
began. This portion of each session consisted of 20 rounds, during which communication
among the subjects was not allowed and during which all decision and payo¤ information
was transmitted and recorded via computer terminals.5 The �rst �ve rounds of each session
were designated as practice rounds, meaning that decisions made during these rounds would
not a¤ect earnings. Other than this special designation for the �rst �ve rounds, all rounds
of a particular session were identical.
At the beginning of each round, subjects were randomly divided into three groups of
4 individuals and each was endowed with 20 tokens. Subjects did not know which of the
other 11 participants were also in their group, and it was emphasized that group assignments
were random and changed from one round to the next.6 Each subject was asked to decide
how many tokens from his 20 token endowment to allocate to a group account, with any
remaining tokens allocated to a private account. Payo¤s were calculated as follows: each
token in the private account yielded 100 points to the subject, and each token in the group
account yielded 75 points to each individual in that subject�s group. After all subjects made
their choices, they were informed of the total number of tokens placed in their group account
and of the points gained from each account. During each round, each subject recorded his
decisions as he made them; subjects also kept a record of their point earnings, which were
calculated for them by the computer.
At the end of the session, a number from 6 to 20 was chosen randomly to designate the
round which determined earnings. Subjects were paid according to the total points gained
in this round at a rate of 3c/ for every 10 points earned, rounded up to the nearest multiple
of 25c/. All sessions were completed in under 90 minutes, and earnings averaged $11.50 per
subject.
5Code for the program was written in Microsoft Visual Basic 5.0 and is available from the authors.6In fact, the process generating the groups was generated using the same random number seed for each
session. Thus, all sessions used an identical algorithm for matching subjects into groups.
6

2.1 Results from Experiment 1
Table 1 summarizes the giving in the experiment. Pooling all sessions (excluding practice
rounds), subjects made 1,620 individual giving decisions divided equally among the three
treatments. As �gure 1 shows, average giving under the control treatment was 8.97 tokens
while average giving under the �14� treatment rose to 10.01. In contrast, average giving
under the �20� treatment fell to 9.21. Thus, the subjects appeared to be modestly in�u-
enced (upwards) by the suggestion. Further evidence of this in�uence may be seen in the
frequency with which subjects gave exactly the suggested amount. As the table shows, when
we suggested that subjects give 14 tokens, subjects took our �advice�11% of the time (com-
pared to other treatments where giving 14 tokens was chosen 1-2% of the time). Likewise,
suggesting to subjects that they give all of their tokens to the public goods produced this
level of giving about 20% of the time (compared to 12-14% of the time in other treatments).
It is common to observe a (downward) trend in giving over the course of the experiment.
Presumably, this is due to the fact that, as the endgame draws near, subjects are less
inclined to be generous in hopes that this spurs giving in the future. While Table 1 o¤ers
some evidence of a downward trend in giving, Figure 2, which displays �ve round moving
average giving for each treatment, highlights this pattern more clearly. As expected, the
control displays a modest downward trend. Under the �14� treatment, the tendency to
reduce giving over time seems to be more muted. In contrast, the �20�treatment displays
a distinctly di¤erent pattern. Here, giving falls steeply from initially high levels. It appears
that subjects su¤er more from �donor fatigue�in this treatment than the others. Of course,
both di¤erences in average giving and trends are merely suggestive. There is considerable
variability in individual behavior that is hidden from view in Table 1 and Figure 2. In the
remainder of this section, we o¤er a number of more formal results and provide statistical
support for each result.
One might expect that the main e¤ect of the suggested donation message would occur at
the beginning of the experiment. After all, at that point the message is novel and presumably
most salient. In fact, we �nd no statistical treatment e¤ect on giving in the �rst (real) round
of the experiment.
7

Result 1: Suggested donations have no e¤ect on initial giving.
Support for Result 1: Using a t-test with unequal variances against the null hypothesis
of no treatment e¤ect produces a test statistic of 0.35 when comparing the �14�treatment
to the control. Similarly, if we instead perform a Wilcoxon Rank-Sum test, we obtain a test
statistic of 0.23. In neither case are the results signi�cant at conventional levels. Likewise,
if we compare initial giving in the �20� treatment to the control, we obtain test scores of
1.46 and 1.51, which are signi�cant at the 15 and 13 percent, respectively. Thus, there is a
modest lift in giving under this treatment, but it does not rise to signi�cance at conventional
levels.
What e¤ect do suggested donations have on overall giving? Obviously, the strategy of
o¤ering a suggested donation is designed to raise giving, but, as we saw in Result 1, this had
only a modest e¤ect at least initially. What is the cumulative e¤ect of suggested donations?
Result 2 shows that an aggressive suggestion produces no lift in giving while moderate
suggestion can be e¤ective.
Result 2: A moderate suggested donation (14 tokens) increases overall giving
relative to the control. An aggressive suggested donation (20 tokens) does not.
Support for Result 2: We may straightforwardly compare giving under the various
treatments by using a t-test with unequal variances or a rank-sum test to compare giving
over all rounds. A test of average giving under the �14�treatment compared to the control
under the null hypothesis of no di¤erence in average giving yields test statistics of 2.44
and 2.32. Both of these statistics are signi�cant at the 1.5% level. Performing the same
comparison for the �20�treatment compared to the control yields statistics of 0.55 and 0.53,
respectively, neither of which comes close to statistical signi�cance. Of course, neither of
these tests accounts for subject interactions occurring throughout the experiment. Thus,
we also perform a simple random e¤ects regression of giving on treatment dummies using
robust standard errors which is reported in Column 1 of Table 2. This regression yields a
coe¢ cient estimate on the �14� treatment of 1.04 which is highly signi�cant. In contrast,
the coe¢ cient estimate for the �20�treatment is only 0.24 and not signi�cant.
Next, we turn to trends in giving. As we saw in Figure 2, the suggested treatments
seemed to have opposite e¤ects. The �14�treatment seemed to reduce �donor fatigue�while
8

the �20�treatment seemed to exacerbate it relative to the control. Result 3 formalizes these
observations.
Result 3: An aggressive suggested donation (20 tokens) causes more donor
fatigue while a moderate suggested donation (14 tokens) causes less donor fatigue
compared to the control.
Support for Result 3: To examine this question, we regress giving in each round on
the interaction between time and treatment as well as each variable separately. To account
for possible heteroskedasticity and autocorrelation of the regressors, we use robust standard
errors. Column 2 of Table 2 displays the results of this speci�cation.7 As the table reveals,
donor fatigue is considerably greater under the �20�treatment as compared to the control�
the coe¢ cient estimate indicates that this treatment led to an additional reduction of 0.30
tokens per round. In contrast, the �14� treatment reveals a reduction in donor fatigue.
Relative to the control, the coe¢ cient estimate indicates that giving increases by 0.06 tokens
per round though it cannot be statistically distinguished from a zero e¤ect. Thus, the main
e¤ect of an aggressive suggested donation is to reduce giving (considerably) in later rounds.
Finally, we turn to the �long-run�e¤ects of various suggested donation strategies. We
treat giving in the last round as a proxy for the long run.
Result 4: An aggressive suggested donation (20 tokens) depresses long-run
giving compared to the control. A moderate suggested donation (14 tokens) has
no long-run e¤ect.
Support for Result 4: Again, using t-tests and rank sum tests to compare last round
giving, we �nd test statistics of 0.48 and 0.48, respectively, neither of which rises to statis-
tical signi�cance at conventional levels, in comparing the �14�treatment to the control. In
contrast, comparing the �20�treatment to the control yields test statistics of 2.01 (p-value
= 0.05) and 1.90 (p-value = 0.06), respectively.
To summarize, suggested donations have an e¤ect on giving, but not always in the ex-
pected direction. Overall, o¤ering a modest suggested donation seems to have a modest
positive e¤ect on giving. It has no e¤ect on donor fatigue, raises giving levels somewhat,
7We also ran several nonlinear speci�cations for the time trend and found that these performed similarly
to the more parsimonious linear model.
9

but is of little consequence in terms of long-term giving. In contrast, making an aggressive
suggestion has the perverse e¤ect of reducing voluntary giving. It o¤ers no initial lift in
giving, increases donor fatigue and depresses long-run giving levels. Standard theory would,
of course, predict that merely o¤ering a non-binding suggestion should produce no change
in behavior. After all, it remains a dominant strategy to contribute nothing regardless of
the suggested donation amounts if subjects only have pecuniary concerns. In the next sec-
tion, we o¤er a model where we introduce the possibility of fairness considerations that can
rationalize some aspects of the data.
3 Theory
We consider a simple model of voluntary giving where there are two types of individuals: non-
psychological types, who care only about monetary payo¤s obtained during the game, and
psychological types, who care both about monetary and psychological compensation. We use
the framework of Rabin (1993) to model psychological types, and extend his notion of fairness
equilibria to our dynamic game of incomplete information. It is widely believed, in light of
the evidence contradicting payo¤ maximizing predictions in voluntary contribution games,
that factors other than monetary payo¤s must a¤ect giving behavior. A variety of models
have been o¤ered to help explain these observations (see Ledyard, 1995 for an overview).
Most of these explanations enrich the standard model of voluntary giving by introducing a
variety of psychological motives such as kindness, warm glow, caring about social surplus,
and reciprocity into the utility functions of individuals being modeled. We view Rabin�s
framework as a step toward weaving together these various psychological strands into a
tractable model; hence, we adopt it here. To facilitate comparison, we adopt the notation of
Rabin exactly.
Players and Preferences Two players participate in a T period voluntary contribution
game. In each period, players must simultaneously decide how much to contribute zi 2 f0; 1g
to the public good. The monetary payo¤ player i receives in a given round is given by
� (zi; zj) = 1� zi + � (zi + zj)
10

where � is the return to each player from contributions to the public good. We assume that
there is a free-rider problem and the public good is socially desirable, that is 12< � < 1:
Throughout, we shall consider the mixed extension of this game, and, slightly abuse notation
by letting � (ai; aj) denote the expected monetary payo¤to player i when playing the strategy
ai 2 � when her co-player chooses strategy aj 2 � in a given period. In addition, player i
holds belief bj strategy employed by her opponent in a given period. Finally, player i holds
the belief ci about j�s beliefs regarding i�s strategy for the given round.
Player i can be one of two types: economic (� = 0) or psychological (� = 1). Let p
denote the common prior probability that an individual is a psychological type; however, an
individual�s type is private information. An individual of type � earns per period expected
utility of
Ui = � (ai; aj) + ���fj (bj; ci) (1 + fi (ai; bj))
�where f i (ai; bj) measures how kind i is to j and �fj (bj; ci) measures how kind i perceives j
is being to him.
Rabin de�nes the kindness function fi (ai; bj) to be
fi (ai; bj) �� (bj; ai)� �e (bj)�h (bj)� �min (bj)
where �e (bj) is a reference payo¤ when bj is chosen, �h (bj) is the highest Pareto optimal
payo¤ that j can obtain when selecting bj and �min (bj) is the minimum payo¤ j can be held
to by selecting bj: In our case, it is straightforward to verify that
�h (bj) = 1� bj + � (bj + 1)
and
�min (bj) = 1� bj + �bj:
The value for �e (bj) depends upon shared perceptions as to what the reference payo¤ is.
We shall assume that the use of suggested donation amounts on the part of public goods
providers is an attempt to in�uence this perception. For simplicity, we restrict attention to
the case where
�e (bj) = 1� bj + � (bj + e) :
11

Here, e 2 [0; 1] denotes the reference level of giving by player i: The function �fj is de�ned
similarly. Thus, we have
fi (ai; bj) = ai � e
and
�fj (bj; ci) = bj � e:
The interested reader should consult Rabin for details.
Finally, we assume that there is no discounting, so that payo¤s over the whole game are
simply the sum of the per round payo¤s.
Thus, a (possibly mixed) strategy for player i, ai (�i; h) maps player i�s type and the
history of moves, h; into the unit simplex, likewise for bj and ci: Also, let player i�s beliefs
about j�s type be given by Pi (h) � Pr (�j = 1jh) :
Solution Concept We extend the notion of a fairness equilibrium to dynamic games of
incomplete information. Speci�cally, in a Perfect Bayesian Fairness Equilibrium (PBFE),
1. Contributions must maximize expected payo¤s given beliefs at each decision node.
2. Beliefs must be formed using Bayes�rule wherever possible
3. Beliefs about strategies must be correct along the equilibrium path.
3.1 Equilibrium Analysis
We do not characterize the set of equilibria. Rather we study properties of several equilibria
that may arise in this game. We begin by demonstrating the existence of equilibrium.
Proposition 1 A complete free-riding equilibrium exists.
Proof. Suppose that in all periods, players of all types choose to give zero and that beliefs are
consistent with this fact for every history. Further, for all histories and all players Pi (h) = p:
It is routine to verify that there are no pro�table deviations for economic types.
12

Next, notice that deviations by psychological types have no e¤ect on continuation payo¤s;
thus, we need only show that deviations be psychological types do not bene�t them in a given
round. By choosing a strategy ai in period t a psychological type earns
1� ai + �ai � e (1 + ai � e) + (T � (t+ 1)) (1� e (1� e)) :
Since this is a decreasing function of ai; it is then immediate that choosing ai = 0 maximizes
the above expression; hence there are no pro�table deviations for psychological types either.
Now we examine equilibria that entail cooperation. We begin by o¤ering su¢ cient con-
ditions guaranteeing the existence of an equilibrium that maximizes expected contributions
to the group account in the set of all equilibria. First, notice that in the last period of the
game, regardless of beliefs, it is a dominant strategy for economic types to free-ride. Under
the following conditions, this is the only circumstance in which any type of player will free
ride.
Proposition 2 Suppose that � > e and p � max�1 + e� �; 1��
�
�; then there exists an
equilibrium where all types contribute 1 in every period save the last, where economic types
free-ride and psychological types still contribute 1.
Proof. Consider the case where equilibrium strategies call for full cooperation up until
the �nal period and free-riding by economic types. In the event of any deviation, play the
equilibrium contained in Proposition 1 for the remaining subgame.
Suppose that there was full cooperation up until the last period of the game and that
the equilibrium calls for psychological types to cooperate completely in the last period. This
strategy is optimal for psychological types provided that
� (1 + p) + (p� e) (2� e) � 1 + �p+ (p� e) (1� e) :
Or equivalently,
p � 1 + e� �:
It is straightforward to show that if � > e; then deviations are not pro�table for psychological
types in any earlier period.
13

Next, we show that cooperation in the penultimate period by economic types is optimal.
Contributing in the penultimate period is incentive compatible provided that:
2� + 1 + �p � 2 + �
p � 1� ��
Similarly, since economic types cooperate in the penultimate period, then deviations are
never pro�table.
Notice that as the reference point increases it becomes increasingly di¢ cult to sustain
full cooperation. In contrast, as the public good becomes more valuable (� increases) the
conditions given in the Proposition become easier to satisfy.
Finally, we examine a reciprocating equilibrium.
Proposition 3 Suppose � > e and p < min�1 + e� �; 1��
�
�: Then for T su¢ ciently large,
there exists a PBFE such that
a) For all t � T; �i = 1 types contribute 1 in t provided no free-riding has occurred in
any preceding period.
b) For t 6= T; k; �i = 0 types contribute 1 in t provided no free-riding has occurred in any
preceding period.
c) For t = T; �i = 0 types free-ride.
d) For t = k; �i = 0 types randomize between contributing and free-riding.
e) For all t and for all �i; if free-riding has occurred in any preceding period, revert to
the equilibrium in Proposition 1.
Proof. Suppose that t > k: Consider any history h where there has been no free-riding
in any preceding period. Let the posterior beliefs of a player following any such history be
denoted by � = P (h) :
First, consider any history h0 where free-riding has occurred in some preceding period.
Following any such history, the strategies of both types of players conform to Proposition
1 and hence are incentive compatible. The rest of the proof concerns itself with showing
incentive compatibility of strategies absent any earlier free-riding.
14

We establish that if �i = 1; the above strategies are incentive compatible. In period T;
by an argument analogous to Proposition 2, cooperation is incentive compatible provided
� � 1� � + e:
In all periods t < T; it is straightforward to show that cooperation is incentive compatible
provided � > e:
Next, we establish that if �i = 0; then above strategies are incentive compatible. The
case where t = T is obvious. Suppose t 2 f1; 2; :::; k � 1; k + 1; :::; T � 1gthen analogous to
the proof of Proposition 2, it is straightforward to show that conforming is optimal provided
� � 1� ��
Finally, choose � such that if t = k then a �i = 0 type is indi¤erent between cooperating
and free-riding. This yields the expression
�� =p (T � k) (2� � 1)1� � (1 + p) : (1)
Note that if k = T then �� = 0 and the �� is a decreasing function of k: Finally, for a �xed k;
as T increases �� increases. De�ne �T to be the smallest integer such that
p��T�(2� � 1)
1� � (1 + p) � 1:
Then if T � �T ; there exists �� and k satisfying:
max
�1� ��
; 1� � + e�� �� � 1
which ensures that all of the su¢ cient conditions for incentive compatibility hold.
From equation (1) two comparative statics are noteworthy. First, as e increases, �� in-
creases; hence the incidence of free-riding increases. As T decreases, k decreases and hence
the incidence of free-riding also increases. Thus we see that increases in the reference point
or decreases in the duration of the game adversely a¤ect contributions. We test these impli-
cations experimentally.
Notice that the equilibrium identi�ed in Proposition 3 has several properties consistent
with existing experimental data.
15

� Giving behavior decreases over time. To see this, notice that expected contributions
in periods after k are lower than in earlier periods.
� Giving behavior drops dramatically in the last period of the game. Expected contri-
butions in period T are lower than in any other period.
Perhaps more importantly, the model implies that
� Choosing too high a suggested donation level reduces giving.
The reason is that, if the suggested donation level acts as a reference for what constitutes
generous behavior, then setting too high a threshold makes it impossible for an individual
to distinguish herself by being generous. Thus, even fairness-minded players do not bene�t
from giving generously. Since economic types only give to imitate these fairness-minded
types, giving collapses completely for a su¢ ciently high reference point.
The model also o¤ers a counterintuitive prediction:
Remark 1 All else equal, a lower suggested giving level (i.e. e smaller) is more likely to
produce giving by economic and psychological types.
The main implication of this remark is that, by suggesting non-cooperation, one should
see at least as much giving as making no suggestion and strictly more giving than when
cooperation is suggested. In the �rst set of experiments, there was no treatment where we
intentionally suggested a low level of giving. Thus, a test of this remark represents an out
of sample prediction of the model.
Of course, the model departs from the experiment in signi�cant ways. First, the model
consists of only two players and two strategies. Second, and more importantly, the model
postulates repeated interaction among the same individuals and relies on this to sustain
giving. Clearly, this was not the case in Experiment 1 where subjects were rematched after
each round. Finally, the theory also relies on the fact that, somehow, the subjects view the
suggestion as a legitimate reference point. While this may be plausible in some cases, we
have no direct way to test the reference point directly.
16

4 Experiment 2: Prisoner�s Dilemmas with Sugges-
tions
With these limitations in mind, we embarked on an additional set of experiments designed
to match the theory more closely. Speci�cally, we ran standard 2 � 2 repeated prisoners�
dilemma games with matched pairs. Under the control, we made no suggestion. Under the
�cooperate� treatment, we suggested the obvious �that subjects should cooperate. (Ac-
tually, to remove context as much as possible, we suggested that they choose Bin A, which
corresponds to cooperation). This treatment is actually quite similar to the 20 token rec-
ommendation in Experiment 1, since in each we are recommending the maximum amount
of cooperation, which is also the socially e¢ cient level. However, it is also analogous to
�paradox of obvious�type treatments in the stag hunt game where the explicit suggestion
that we maximize social surplus seems to have an e¤ect. Under the �defect� treatment,
we recommended that participants choose Bin B; that is, we recommended that they not
cooperate. Figure 3 displays a screenshot of the interface seen by subjects including the
display of the suggested donation message.
These experiments were conducted at Muhlenberg College during the Fall 2004, Fall
2009, and Spring 2010 semesters. Participants were recruited via email and posting on
the campus website and told that they would "earn some money" for participating in a
decision-making study. We conducted 12 sessions, with a number of participants ranging
from 2 to 22. Whether a particular session was control, Treatment A or Treatment B was
determined randomly. A set of instructions was distributed and read, subjects were given
an opportunity to ask questions, and then the decision-making component of the experiment
began. This portion of each session consisted of 20 rounds, during which communication
among the subjects was not allowed and during which all decision and payo¤ information
was transmitted and recorded via computer terminals.8 The �rst �ve rounds of each session
were designated as practice rounds, meaning that decisions made during these rounds would
not a¤ect earnings. Other than this special designation for the �rst �ve rounds, all rounds
of a particular session were identical. Participants were matched with a partner at the
8Code for the program was written in Microsoft Visual Basic 6.0 and is available from the authors.
17
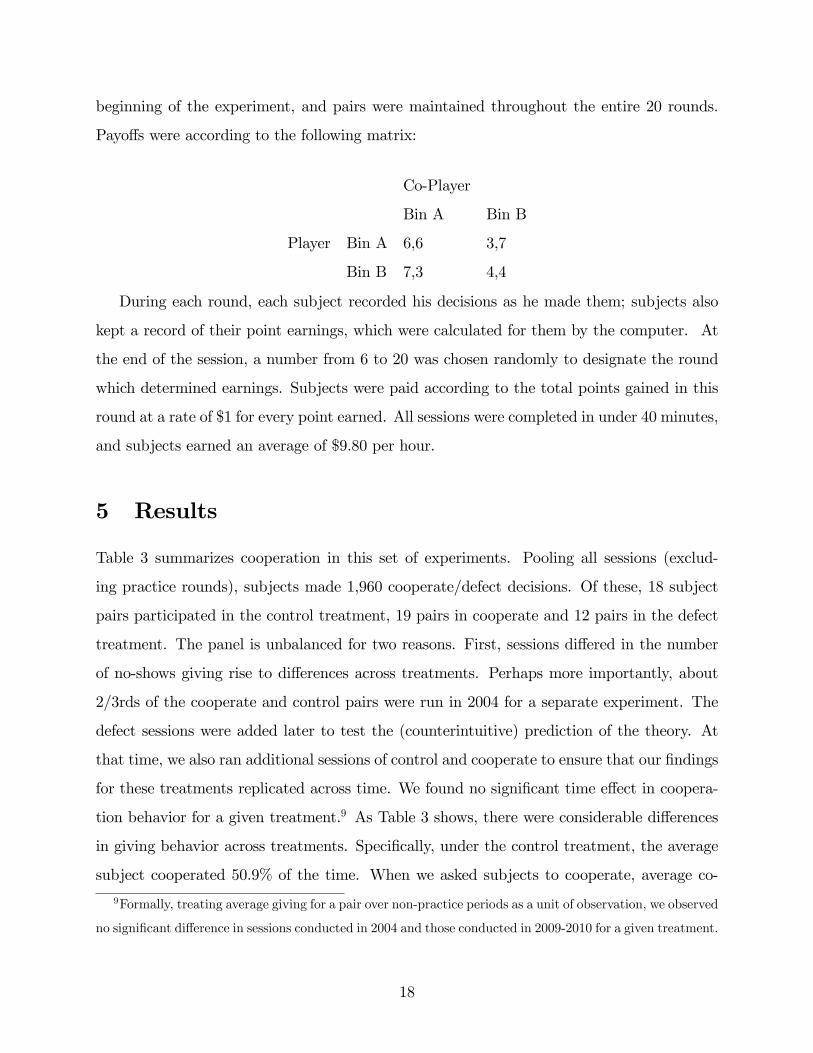
beginning of the experiment, and pairs were maintained throughout the entire 20 rounds.
Payo¤s were according to the following matrix:
Co-Player
Bin A Bin B
Player Bin A 6,6 3,7
Bin B 7,3 4,4
During each round, each subject recorded his decisions as he made them; subjects also
kept a record of their point earnings, which were calculated for them by the computer. At
the end of the session, a number from 6 to 20 was chosen randomly to designate the round
which determined earnings. Subjects were paid according to the total points gained in this
round at a rate of $1 for every point earned. All sessions were completed in under 40 minutes,
and subjects earned an average of $9.80 per hour.
5 Results
Table 3 summarizes cooperation in this set of experiments. Pooling all sessions (exclud-
ing practice rounds), subjects made 1,960 cooperate/defect decisions. Of these, 18 subject
pairs participated in the control treatment, 19 pairs in cooperate and 12 pairs in the defect
treatment. The panel is unbalanced for two reasons. First, sessions di¤ered in the number
of no-shows giving rise to di¤erences across treatments. Perhaps more importantly, about
2/3rds of the cooperate and control pairs were run in 2004 for a separate experiment. The
defect sessions were added later to test the (counterintuitive) prediction of the theory. At
that time, we also ran additional sessions of control and cooperate to ensure that our �ndings
for these treatments replicated across time. We found no signi�cant time e¤ect in coopera-
tion behavior for a given treatment.9 As Table 3 shows, there were considerable di¤erences
in giving behavior across treatments. Speci�cally, under the control treatment, the average
subject cooperated 50.9% of the time. When we asked subjects to cooperate, average co-
9Formally, treating average giving for a pair over non-practice periods as a unit of observation, we observed
no signi�cant di¤erence in sessions conducted in 2004 and those conducted in 2009-2010 for a given treatment.
18

operation fell to 39.8%. Finally, when we asked subjects not to cooperate, they were very
obliging� on average, a subject cooperated only 29.7% of the time.
These di¤erences are even more starkly illustrated Figure 4, which graphs �ve-round
moving average cooperation for each treatment. As the �gure shows, average giving is
consistently higher in control than under either of the suggestion treatments. Suggesting
cooperation reduces giving, though not by as much as suggesting non-cooperation. Unlike
Figure 2, there is less evidence of donor fatigue in these experiments. All of the treatments
exhibit a modest reduction in giving in later rounds, but it is not noticeably more pronounced
under �cooperate�than either of the other treatments. Of course, both Table 3 and Figure 4
obscure variation in individual behavior giving rise to these average results. The remainder
of this section examines giving patterns more formally, taking account of this variation.
As with the �rst set of experiments (and much of the priming literature), we would
expect that the strongest e¤ect of our experimental treatment would occur at the start of
the experiment when the message is most salient. Here, we �nd an e¤ect, though not in the
intuitive direction.
Result 5: Suggesting anything reduces initial giving.
Support for Result 5: We examine cooperation in the �rst (non-practice) round of
the experiment. Using a t-test with unequal variances against the null hypothesis of no
treatment e¤ect produces a test statistic of 1.92 when comparing the �cooperate�treatment
to the control. A Wilcoxon Rank-Sum test produces a test statistic of 1.88. Under either
statistical test, we can reject the null hypothesis of no treatment e¤ect in favor of a two-
sided alternative at the 6% level. Similarly, a t-test produces a test statistic equal to 3.46
comparing �defect�to control. A Wilcoxon Rank-Sum test yields a statistic of 3.14. Both
are signi�cant at the 1% level.
The theory model predicts a sharp decrease in giving in the �nal round of the experiment.
While in Experiment 1, we interpreted this as the �long run,�here, owing to the repeated
interaction, the last period is better interpreted as the �endgame�. In contrast to theory
and results from Experiment 1, here we �nd that an aggressive suggested donation has no
e¤ect on last round giving.
Result 6: Suggestions have no e¤ect on �nal round giving.
19
Support for Result 6: Again, we use t-tests and Wilcoxon Rank-Sum tests to compare
last round giving. Comparing �cooperate�to control yields test statistics of 0.65 and 0.65,
respectively. Neither is signi�cant at conventional levels. Comparing �defect� to control
yields test statistics of 1.53 and 1.46, respectively. This di¤erence is signi�cant at the 15%
level.
Along the same lines, we show that donor fatigue is less severe when partners repeatedly
interact than it was under random rematching of players.
Result 7: Suggestions have no e¤ect on donor fatigue.
Support for Result 7: To examine this question, we perform a probit regression taking
cooperation in each round as our dependent variable and regressing it on the interaction
between time and treatment as well as each variable separately. Since subjects repeatedly
interacted with a single partner, we cluster by subject pair. Table 4 reports the results of this
analysis. Notice that the coe¢ cients on the interaction terms are both modest in magnitude
and not close to statistical signi�cance. Thus, while giving trends downward over the course
of the experiment, these trends do not di¤er with the treatment.
Now we come to the heart of the matter� what e¤ect do suggested donation levels have
on cooperation? Recall that the theory model predicted that the cooperate treatment should
reduce giving while the defect treatment should increase it.
Result 8: Suggestions reduce overall giving. Suggesting non-cooperation pro-
duces the lowest level of giving.
Support for Result 8: Returning to Table 4, since the interaction terms are not signif-
icant, the mean e¤ect of each treatment is given by the coe¢ cient on each of the treatment
dummies. As the table shows, suggesting that subjects cooperate reduces cooperation by
22.2% while suggesting that subjects defect reduces cooperation by 41.6% relative to the
control.10 As the table shows, these e¤ects are signi�cant at around the 5% level.
To summarize, when we amend the experiments to tie more closely to the model, the
qualitative e¤ects of suggestions are similar to our �rst set of experiments� suggestions
do not produce more giving regardless of whether we suggest that subjects cooperate or
10To arrive at these �gures, we evaluated the regression coe¢ cients at the average round (7.5) and them
computed percentage di¤erences.
20

the opposite. While the former is consistent with the theory, the latter is not (though it
is consistent with common sense.) Our main conclusion is that, by and large, silence is
golden� the most consistently e¤ective �treatment�is to make no suggestion whatsoever.
6 Other E¤ects
We now turn to several other aspects of the data: path dependence of giving and demo-
graphics of giving. While these were not our main concern in the experimental design, they
hold some interest in relation to the broader literature on giving. It is important to note
that our demographic data is con�ned to sessions run in 2009-2010. Prior to this, we did
not collect demographic information and, since these experiments were anonymized, have no
basis to recover this information retrospectively. Thus, one should think of these results as
more suggestive than de�nitive.
Path Dependence
We saw previously that suggesting either cooperation or defection reduced initial giving.
That is, it reduced the possibility that subject pairs got o¤ to a �good start�in cooperating
with one another. The theory predicts that getting o¤to a good start is critical for sustaining
cooperation later in the game. To examine this question, we examine giving after the �rst
round and create a binary variable labeled �good start.�Good start equals 1 if a subject
pair managed to mutually cooperate in the �rst round and equals zero otherwise. We then
run a probit regression of giving in later rounds on good start, clustering by subject pair. To
control for the possibility that some subjects are inherently �nice�and others not so nice, we
add individual �xed e¤ects, thus eliminating an individual�s mean giving from consideration.
Since the e¤ects of good start as well as individual e¤ects likely di¤er by treatment, we run
separate regressions for each treatment with the exception of the �defect�treatment, which
we omit.11 The results of this analysis are shown in Table 5 (suppressing the individual �xed
e¤ects coe¢ cients). Notice that the coe¢ cient on good start is highly signi�cant and large
11This treatment is omitted since the e¤ect of getting a good start cannot be identi�ed. Only one subject
pair got o¤ to a good start and subsequent behavior did not vary over time. Thus, the regressor good start
washes out of any regression with individual �xed e¤ects.
21

under the control and the cooperate treatment. Getting o¤ on the right foot is strongly
predictive of later cooperation. This implies a transmission mechanism for the suggested
donation to continue to matter later in the experiment even if the suggestion itself is largely
ignored by subjects. By undermining initial cooperation, the e¤ect of the suggestion may
persist through path dependence.
Demographics
Many studies report gender di¤erences in giving behavior.12 Here, we examine the e¤ects
of gender and other demographic characteristics on giving. Since our treatments were not
balanced by gender, we regress giving on gender separately for each treatment. Since giving
declines over time, we include a time trend. Finally, we cluster by subject pairs to account for
correlation e¤ects on the error terms. The results of these three regressions are reported in
Table 6. Consistent with previous �ndings, women are signi�cantly more likely to cooperate
than men under the control. However, making any suggestion whatsoever seems to eliminate
this predilection towards cooperation. The coe¢ cient estimates for these regressions fall by
a factor of 5 and are nowhere close to signi�cance. To summarize, once any suggestion is
made for how to behave, women and men behave similarly.
Several studies report di¤erences in sel�shness depending on training in economics or
allied �elds.13 Since we have the self-reported majors of our subjects, we can examine di¤er-
ences in cooperativeness in the data. More importantly, we can examine whether training in
economic thinking a¤ects how subjects respond to various suggestions. We replicate the re-
gressions in Table 7, replacing gender with a dummy variable which equals one if a subject�s
self-reported major is accounting, business, economics, or �nance. In all of these majors,
subjects are exposed to one or more microeconomics courses. As the table shows, under
the control treatment economics training has no e¤ect on giving behavior nor does it have
any e¤ect under the defect treatment. However, when we suggested cooperation, subjects
trained in economics were systematically less likely to cooperate than those not so trained.
Evaluated at the mean value for the data, a subject trained in economics was 28% less likely
12See Oortman and Tichy (1999).
13See, for example, Marwell & Ames (1981) and Frank et al. (1996).
22
to cooperate than a subject whose major was not accounting, business, economics, or �nance.
Thus, training seems to lead to skepticism with respect to suggestions but not di¤erences in
mean giving absent such suggestions.
Perhaps intellective di¤erences are driving giving behavior. Our summary data indicate
that women in the sample have signi�cantly lower math SAT scores than their male coun-
terparts while verbal SAT scores are about the same.14 Students whose self-reported majors
are accounting, business, economics, and �nance do not di¤er in their math and verbal SAT
scores compared to those in other majors. To examine whether gender is merely a proxy for
di¤erences in this dimension, we replicate Table 6 adding quadratic terms for the math and
verbal SAT scores of each subject. These results are reported in Table 8. As that table shows,
under the control, women are still more likely to cooperate. Higher math SAT scores lead
to more cooperation initially with cooperation peaking at 680, the median math SAT score
in the data. Thereafter, cooperation falls modestly. On the other hand, higher verbal SAT
scores are associated with less cooperation. The lowest level of cooperation is achieved at a
verbal SAT score of 680, well above the median verbal SAT score in the data (640). Thus,
higher verbal skills (as measured by SAT) seem to coincide with less cooperative behavior.
Of course, these regressions merely represent correlations between giving and demographic
variables rather than representing causality.
Turning to the cooperate treatment, gender remains insigni�cant while higher math SAT
scores now lead to lower levels of cooperation. Indeed, for the bulk of the sample, higher math
or verbal SAT scores are associated with less giving. Finally, under the defect treatment,
cooperation is su¢ ciently rare that none of the demographic variables is signi�cant. Thus,
as we saw for the case of economics training, greater �sophistication�(as measured by SAT
score) seems to lead to a greater level of distrust of the suggestion and lower levels of
cooperation.
14A t-test comparing scores by gender with unequal variances results in a di¤erence in math SAT scores
that is signi�cant at the 9% level and no statistical di¤erence in verbal SAT scores.
23

7 Conclusions
In charitable fund-raising, using a suggested donation amount to in�uence giving is ubiqui-
tous. In this paper, we ask what would seem the most important question: Do suggestions
actually work to increase giving? Using laboratory experiments, we investigated the e¤ects
of di¤erent suggested donation amounts, as well as no suggestion, on giving. We found that
suggested donations do indeed in�uence giving, but not always in the expected direction.
Suggesting that individuals contribute the socially optimal amount reduced giving relative
to no suggestion. Suggesting that individual not give also reduced giving. However, sug-
gesting a moderate contribution amount produced modest gains in giving. We showed that
a fairness-based theory model is capable of explaining some of these �ndings.
Our �ndings suggest that suggested donations can increase giving, but not as much and
not as well as one might have expected. Indeed, getting the suggested donation amount wrong
can be extremely costly. In many instances, silence is golden� the best suggestion may be
no suggestion at all. In terms of practice, we would conjecture, based on our results, that
fund-raisers would be better served by having fewer and lower suggested donation amounts.
While our results are directly applicable for charities seeking to raise money by enticing
undergraduates to play games in a computer lab, our study su¤ers from the usual concerns
about external validity common to laboratory experiments. There are, however, several
aspects of the study that suggest its applicability more broadly. First, our study is consistent
with �eld experiments and practice in terms of the phenomenon of getting more by asking
for less. Second, despite di¤erences in the subject pool (Princeton versus Muhlenberg),
time (1998 versus 2009), and interaction (random rematching versus partners), responses to
suggested donations amounts were quite similar. Third, previous studies, such as Rondeau
and List (2008) note many similarities in giving behavior exhibited in the lab and in the �eld.
Thus, there are some reasons to be optimistic in the applicability of our �ndings outside the
lab.
Regardless, our study should mainly be viewed as a �rst step toward understanding the
e¤ects of suggested donations on giving. Much remains to be investigated. An important next
step would be to conduct �eld experiments comparing not only various suggested donation
24

amounts but also including a �silence� treatment, i.e. no suggested donation. An aspect
emphasized in practice but missing from our experiment is the need to match the suggested
donation amount with the income of the potential donor. Introducing heterogeneity in
endowments of various subjects could, in principle, shed light on this aspect. Still another
aspect arising in practice for public goods that are �consumed�like a visit to the Metropolitan
Museum is that the suggested donation might be viewed as a signal of the quality of the
good. The Metropolitan�s decision to raise its suggested donation amount was, at least in
part, driven by the fact that the rival MOMA was now charging a $20 entry fee.
25

References
[1] Charness, Gary and Rabin, Matthew. Understanding Social Preferences with Simple
Tests. Quarterly Journal of Economics 117(3), August 2002, pp. 817-869.
[2] Frank, Robert H., Gilovich, Thomas D, and Regan, Dennis T. Do Economists Make
Bad Citizens? Journal of Economic Perspectives 10(1), December 1996, pp. 187-192.
[3] Isaac, R. Mark, and Walker, James M. Group Size E¤ects in Public Goods Provision:
The Voluntary Contributions Mechanism. Quarterly Journal of Economics 103(1), Feb-
ruary 1988, pp. 179-99.
[4] Karlan, Dean and List, John A. Does Price Matter in Charitable Giving? Evidence from
a Large-Scale Natural Field Experiment. American Economic Review 97(5), December
2007, pp. 1774-1793.
[5] Ledyard, John O. Public Goods: A Survey of Experimental Research. The Handbook
of Experimental Economics. Princeton: Princeton University Press, 1995, pp. 111-94.
[6] Marks, Melanie, Schansburg, D. Eric, and Croson, Rachel T.A. Using Suggested Con-
tributions in Fundraising for Public Good. Nonpro�t Management and Leadership 9(4),
July 2003, pp. 369-384.
[7] Marwell, Gerald, and Ames, Ruth. Economists free ride, does anyone else?: Experiments
in the provision of public goods, IV. Journal of Public Economics 15(3), June 1981, pp.
295-310.
[8] Morgan, John, and Sefton, Martin. Funding Public Goods with Lotteries: Experimental
Evidence. Review of Economic Studies. 67, 2000, pp. 785-810.
[9] Oortman, Andreas, and Tichy, Matthew. Gender Di¤erences in the laboratory: Evi-
dence from Prisoner�s Dilemma Games. Journal of Economic Behavior and Organization
39(3), July 1999, pp. 327-339.
[10] Rabin, Matthew. Incorporating Fairness into Game Theory and Economics. American
Economic Review 83(5), December 1993, pp. 1281-1302.
26

[11] Rondeau, Daniel and List, John A. Matching and Challenge Gifts to Charity: Evidence
from Laboratory and Natural Field Experiments. Experimental Economics 11, February
2008, pp. 253-267.
[12] Seely, Beth, van Huyck, John, and Battalio Ray. Credible Assignments Can Improve Ef-
�ciency in Laboratory Public Goods Games. Journal of Public Economics 89(8), August
2005, pp. 1437-1455.
[13] Smith, Stephen L. and Weyant, James M. Getting More by Asking for Less: The E¤ects
of Request Size on Donations of Charity. Journal of Applied Social Psychology 17(4),
2006, pp. 392-400
[14] Tryangiel, Josh. Radiohead Says: Pay What You Want. Time. October , 2007.
[15] Van Huyck, John, Gillette, Ann B., and Battalio, Ray. Credible Assignments in Coor-
dination Games. Games and Economic Behavior 4(4), October 1992, pp. 606-626.
[16] Warwick, Mal. Testing, Testing 1, 2, 3: Raise More Money with Direct Mail Tests. New
York: Jossey-Bass, 2003
[17] Wegner, D. M., & Bargh, J. A.: Control and automaticity in social life. In D. Gilbert,
S. Fiske, & G. Lindzey (Eds.), Handbook of social psychology (4/e). Boston: McGraw-
Hill, 1998.
27

Figure 1: Screenshot of Experiment 1

0
2
4
6
8
10
12
10 12 14 16 18 20
Giving
Round
Figure 2: Five Round moving average of giving, by treatment
Control
14 Recommendation
20 Recommendation

Figure 3: Screenshot of Experiment 2

0
0.1
0.2
0.3
0.4
0.5
0.6
10 12 14 16 18 20
Percentage cooperation
Round
Figure 4: Five Round moving average of cooperation, by treatment
Control
Recommend giving
Recommend no giving

Variable Control Treatment 14 Treatment 20
Giving 8.97 10.01 9.21
Standard Deviation 6.84 7.16 7.49
Fraction of observations where
subjects gave exactly 14 tokens 1.25% 10.97% 2.08%
Fraction of observations where
subjects gave exactly 20 tokens 11.67% 13.47% 20.56%
Number of observations 540 540 540
Table 1: Experiment 1 Summary Statistics

Variable
Constant 8.97 *** 10.61 ***
(0.29) (0.62)
Treatment 14 1.04 ** 0.60
(0.43) (0.89)
Treatment 20 0.24 2.62 **
(0.44) (0.89)
Round ‐0.21 **
(0.07)
Round*Treatment 14 0.06
(0.10)
Round*Treatment 20 ‐0.30 **
(0.10)
Number of Observations 1620 1620.00
Linear regression of giving, with robust standard errors.
** denotes statistical significance at 5% level.
*** denotes statistical significance at 1% level.
Table 2: Regression results, Experiment 1
Coefficient (standard error)
Simple model With time trend

Treatment Control
Recommend
cooperation
Recommend non‐
cooperation
Sessions 4 5 4
Participants 36 38 24
Average cooperation 50.9% 39.8% 29.7%
Cooperation in Round 6 66.70% 44.74% 25%
Cooperation in Round 20 38.89% 31.58% 20.83%
Female 12.50% 60% 54.17%
Major in accounting, business,
economics or finance 50% 10% 37.50%
Mean Verbal SAT 641 673 628
Mean Math SAT 681 644 652
Table 3: Experiment 2 Summary Statistics

Variable
Treatment: Suggest cooperation ‐0.15 *
(0.08)
Treatment: Suggest non‐cooperation ‐0.23 **
(0.09)
Round ‐0.008 **
(0.003)
Round*Suggest cooperation 0.005
(0.004)
Round*Suggest non‐cooperation 0.004
(0.007)
Number of Observations 1470
* denotes statistical significance at 10% level.
** denotes statistical significance at 5% level.
Table 4: Regression results, Experiment 2
Estimates from probit regression of cooperation, clustering on subject pair.
Coefficients are marginal effects.
Coefficient (standard error)

Variable
Good start 1.000 *** 0.428 ***
(0.000) (0.006)
Round ‐0.011 ‐0.002
(0.007) (0.006)
Number of Observations 406 532
*** denotes statistical significance at 1% level.
Estimates from probit regression of cooperation with individual fixed effects. Coefficients are
marginal effects. Result from treatment with suggested non‐cooperation omitted due to lack of
identification.
Table 5: Regression results, Experiment 2 ‐‐ effect of initial cooperation
Coefficient (standard error)
Suggest cooperationControl

Variable
Female 0.322 ** 0.062 0.067
(0.200) (0.126) (0.157)
Round ‐0.008 ‐0.006 * ‐0.004
(0.006) (0.003) (0.005)
Number of Observations 120 150 360
* denotes statistical significance at 10% level.
** denotes statistical significance at 5% level.
Table 6: Regression results, Experiment 2 ‐‐ gender effects
Coefficient (standard error)
Estimates from probit regression of cooperation, clustering on subject pair. Coefficients are
marginal effects.
Control Suggest cooperation
Suggest non‐
cooperation

Variable
Major in Accounting, Business,
Economics or Finance 0.034 ‐0.283 ** ‐0.001
(0.069) (0.100) (0.145)
Round ‐0.009 ‐0.006 * ‐0.004
(0.006) (0.003) (0.005)
Number of Observations 120 150 360
* denotes statistical significance at 10% level.
** denotes statistical significance at 5% level.
Table 7: Regression results, Experiment 2 ‐‐ major effects
Coefficient (standard error)
Estimates from probit regression of cooperation, clustering on subject pair. Coefficients are marginal
effects.
Control Suggest cooperation
Suggest non‐
cooperation

Variable
Math SAT/1000 32.03 * ‐17.05 8.88
(16.130) (62.540) (17.040)
Math SAT squared ‐23.72 ** 10.86 ‐6.16
(11.390) (50.230) (12.680)
Verbal SAT/1000 ‐165.65 *** ‐42.86 ** 14.92
(13.690) (15.750) (23.010)
Verbal SAT squared 125.04 *** 29.55 ** ‐12.69
(9.790) (10.990) (18.300)
Female 0.52 *** 0.013 0.06
(0.030) (0.119) (0.139)
Round ‐0.014 ‐0.008 * ‐0.005
(0.011) (0.004) (0.005)
Number of Observations 120 135 330
* denotes statistical significance at 10% level.
** denotes statistical significance at 5% level.
*** denotes statistical significance at 1% level.
Estimates from probit regression of cooperation, clustering on subject pair. Coefficients
are marginal effects.
Table 8: Regression results, Experiment 2 ‐‐ SAT effects
Coefficient (standard error)
Control
Suggest
cooperation
Suggest non‐
cooperation