Embed Size (px)
Citation preview

GREG ROTH DEPARTMENT OF PLANT SCIENCE
Moving Forward with Silage Hybrid Evaluation
• Began evalutions in mid 1990’s
• Sabbatical leave at Miner Institute in 2000
• Revamped Penn State program in 2001
• Steady growth through the years
• Sabbatical in 2016 to visit other programs
Silage Hybrid testing at Penn State
Penn State testing program• Partner with Professional Dairy Managers of Pennsylvania– Provide input w/advisory team
– Solicit hybrids– Develop initiatives
Overall goals of our program• Test hybrids• Improve Characterization Methods
• Broaden Collaborations• Develop Funding for Assessments
• Provide Roadmap for the Future
Laboratory Partner
• Provides insights into analytical issues and trends in the industry
• Help to work toward some consistency in evaluation and interpretation
Leadership Team
• Provides insights into analytical issues and trends in the industry
• Helps to work toward some consistency in evaluation and interpretation
Chris Canale
Alex Hristov Jess Williamson
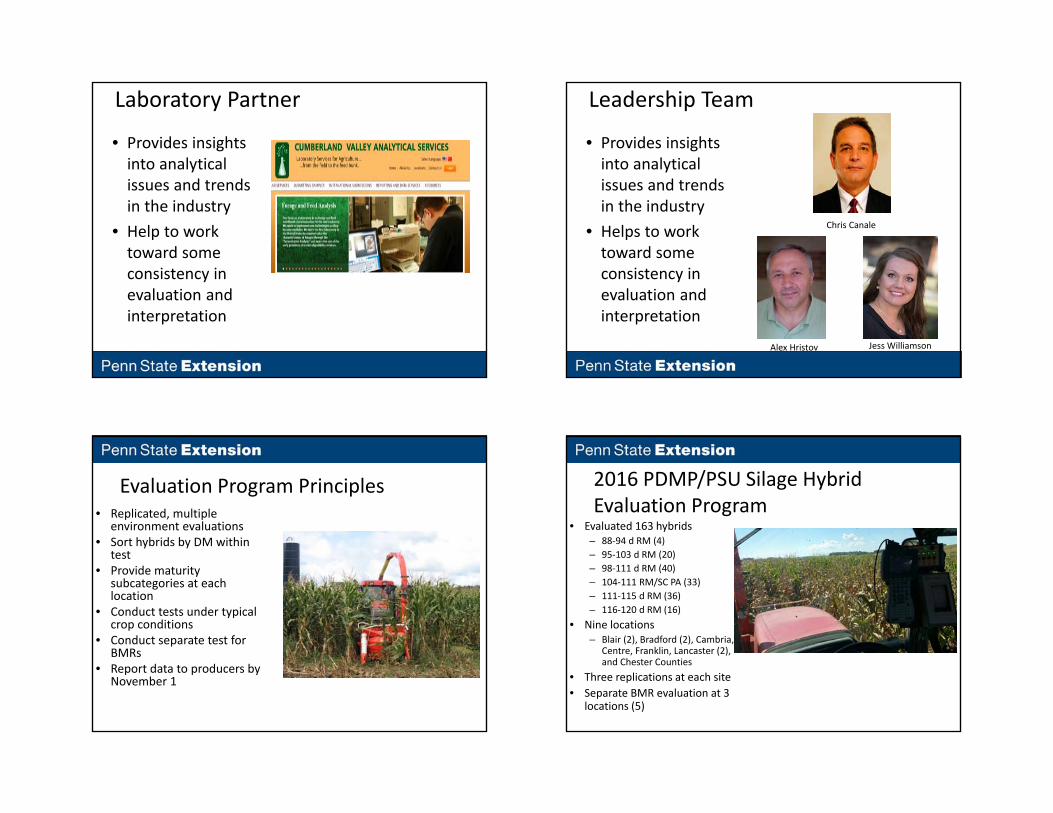
Evaluation Program Principles• Replicated, multiple
environment evaluations• Sort hybrids by DM within
test• Provide maturity
subcategories at each location
• Conduct tests under typical crop conditions
• Conduct separate test for BMRs
• Report data to producers by November 1
2016 PDMP/PSU Silage Hybrid Evaluation Program
• Evaluated 163 hybrids– 88‐94 d RM (4)– 95‐103 d RM (20)– 98‐111 d RM (40)– 104‐111 RM/SC PA (33)– 111‐115 d RM (36)– 116‐120 d RM (16)
• Nine locations– Blair (2), Bradford (2), Cambria,
Centre, Franklin, Lancaster (2), and Chester Counties
• Three replications at each site• Separate BMR evaluation at 3
locations (5)

PSU Data Presentationcan be found at: http://cornandsoybeans.psu.edu/
Table
Advisory Board Inputs
• Do hybrids vary in starch digestibility?
• Should we be evaluating fiber digestibility in more detail such as uNDF?
• Are there alternatives to Milk 2006?
Production Details / Plot Background

Sabbatical II‐2015/16
• Visited other silage testing programs across US
• Discussed current procedures and issues
• In NY, visited Miner and Cornell
• Cornell was rebooting their program
Collaboration with Cornell• Strive for similar field and analytic procedures
• Work on incorporation of advanced fiber measurements
• Evaluate starch digestibility• Develop alternative interpretation system
• Work with UVM and WNY Crop Mgmt Assn.
• Producer and Industry Support led to re‐establishing the Commercial Corn Silage Hybrid Testing Program
• Collaboration of – PRO‐DAIRY, Department of Animal Science, Cornell
University– Section of Plant Breeding & Genetics, Cornell University
• With support from– NYS Dairy Producers– Seed Corn Industry– NYS Agricultural Experiment Station– Cornell Cooperative Extension– NY Farm Viability Institute
A Special Thank YouTom OvertonMargaret SmithMike Van AmburghJerry CherneyBill Cox
2016 NYS Corn Silage Hybrid Trials
Allison LawtonSherrie NormanKeith PayneDan FisherJon GreenwoodPaul Stackowski
Joe Lawrence
Fiber assessment• uNDF 240 better describes indigestibility of the forage for use in cattle
• Improves prediction of energy from forages• Helps improve predictions of intake and rumen function, microbial production etc.
• Can help explain performance issues with fiber digestibility in some cases
• NIRS prediction available from CVAS
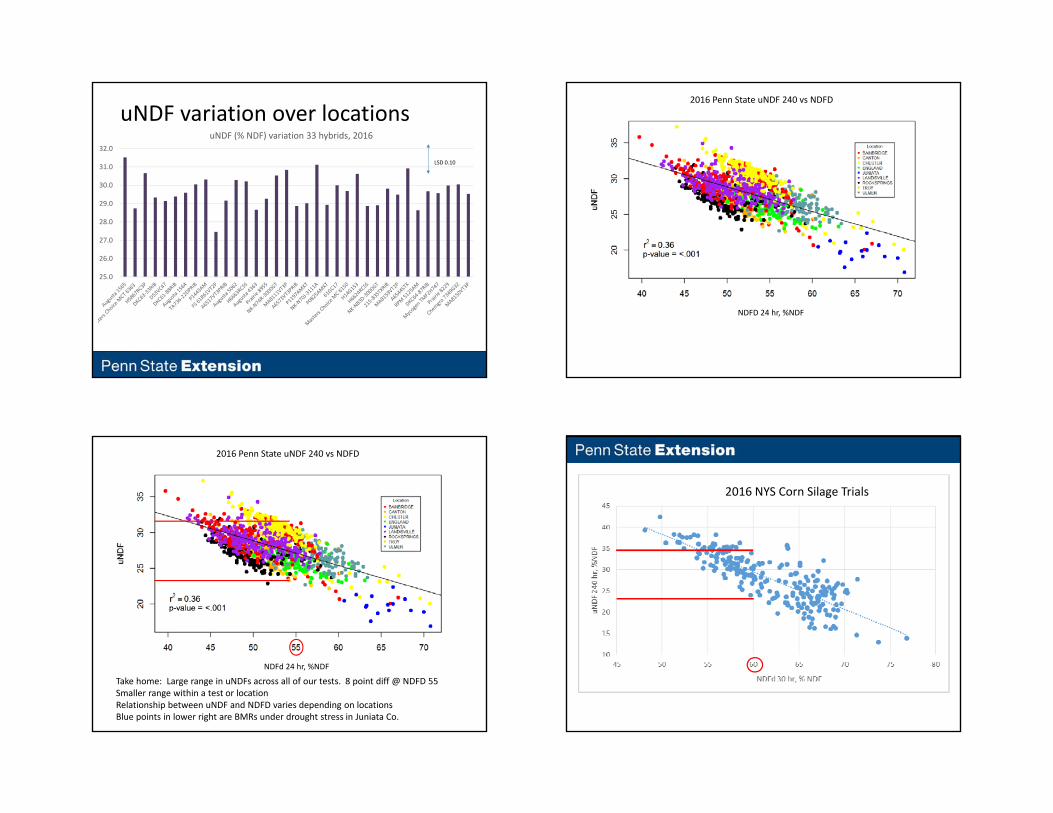
uNDF variation over locations
25.0
26.0
27.0
28.0
29.0
30.0
31.0
32.0
uNDF (% NDF) variation 33 hybrids, 2016
LSD 0.10
NDFD 24 hr, %NDF
2016 Penn State uNDF 240 vs NDFD
NDFd 24 hr, %NDF
2016 Penn State uNDF 240 vs NDFD
Take home: Large range in uNDFs across all of our tests. 8 point diff @ NDFD 55Smaller range within a test or locationRelationship between uNDF and NDFD varies depending on locationsBlue points in lower right are BMRs under drought stress in Juniata Co.
2016 NYS Corn Silage Trials

Slide Credit: Dr. Randy Shaver
MADRID
AURORA
Fiber Conclusions• Continue with the development of uNDF240 as a routine measurement for silage assessment.
• Standardize our reporting as %NDF• Change NDFD 24 hour to NDFD 30 at Penn State to be consistent with Cornell to facilitate comparisons.
• Add NDFD 120 and NDFD240 to reports
Starch Digestibility
• Hybrids with more floury endosperm are being marketed with the potential to improve starch digestibility
• How can differences be best assessed?
• How do differences interact with other factors such as particle size and time of ensiling?

Starch Digestibility Assessment Study
• Objective: characterize starch digestibility of hybrids over time.
• 6 hybrids – Check: TA 780, H5609– Test: HHG 7412, HHG 864, H5811,
H5505
• 2 locations x 3 replicates x 5 time• Time = 0, 60, 120, 180, 240d• Grind: 4 and 1mm• CVAS: 7h IVSD wet chemistry
Starch digestibility over ensiling time
In situ vs. In vitro In situ vs. NIR
55.0
60.0
65.0
70.0
75.0
80.0
85.0
90.0
95.0
100.0
0 30 60 120 150
Days Ensiled
Digestib
ility, %
Starch
In situ starchdeg. 8 h, %starch (Lab 4)
In situ solublestarch, %starch (Lab 4)
In vitro starchdig. 7 h, %starch (Lab 3)
In vitro starchdig. 7 h, %starch (Lab1)
55.0
60.0
65.0
70.0
75.0
80.0
85.0
90.0
95.0
100.0
0 30 60 120 150
Days Ensiled
Digestib
ility, %
Starch
In situ starchdeg. 8 h, %starch (Lab 4)
NIR starchdig. 7 h, %starch (Lab 1)
NIR starchdig. 7 h, %starch (Lab 2)
In situ solublestarch, %starch (Lab 4)
Starch digestibility by hybrid variety
In situ vs. In vitro In situ vs. NIR
60.0
65.0
70.0
75.0
80.0
85.0
90.0
95.0
42HF
C15
H522
2RC3
P
H533
3RC3
P
H619
1RCSS
MC 52
50
Hybrid
Digestib
ility, %
Starch In vitro starch dig. 7
h, % starch (Lab1)
In vitro starch dig. 7h, % starch (Lab 3)
In situ starch deg. 8h, % starch (Lab 4)
In situ solublestarch, % starch (Lab4)
ba
c c c
60.0
65.0
70.0
75.0
80.0
85.0
90.0
95.0
42HF
C15
H522
2RC3
P
H533
3RC3
P
H619
1RCSS
MC 52
50
Hybrid
Digestib
ility, %
Starch
NIR starch dig. 7 h, %starch (Lab 1)
NIR starch dig. 7 h, %starch (Lab 2)
In situ starch deg. 8 h,% starch (Lab 4)
In situ soluble starch,% starch (Lab 4)
a
cc
y
bc
x
y y y
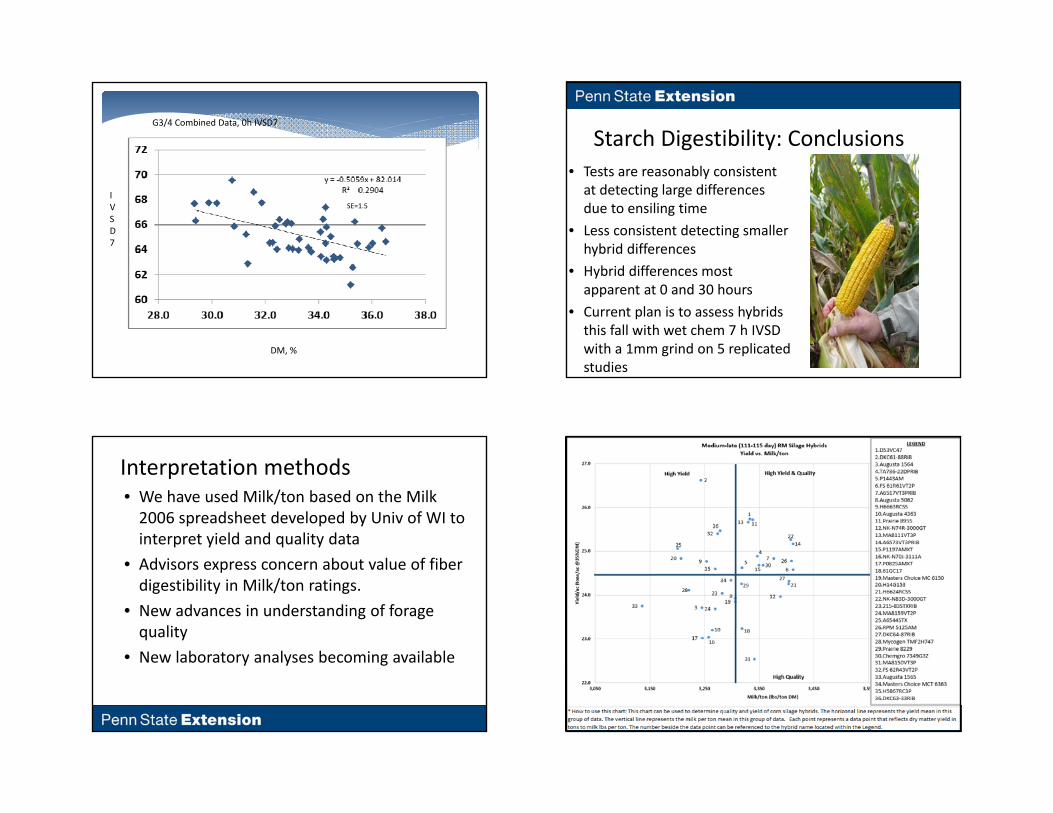
G3/4 Combined Data, 0h IVSD7
DM, %
IVSD7
SE=1.5
Starch Digestibility: Conclusions• Tests are reasonably consistent at detecting large differences due to ensiling time
• Less consistent detecting smaller hybrid differences
• Hybrid differences most apparent at 0 and 30 hours
• Current plan is to assess hybrids this fall with wet chem 7 h IVSD with a 1mm grind on 5 replicated studies
Interpretation methods• We have used Milk/ton based on the Milk 2006 spreadsheet developed by Univ of WI to interpret yield and quality data
• Advisors express concern about value of fiber digestibility in Milk/ton ratings.
• New advances in understanding of forage quality
• New laboratory analyses becoming available
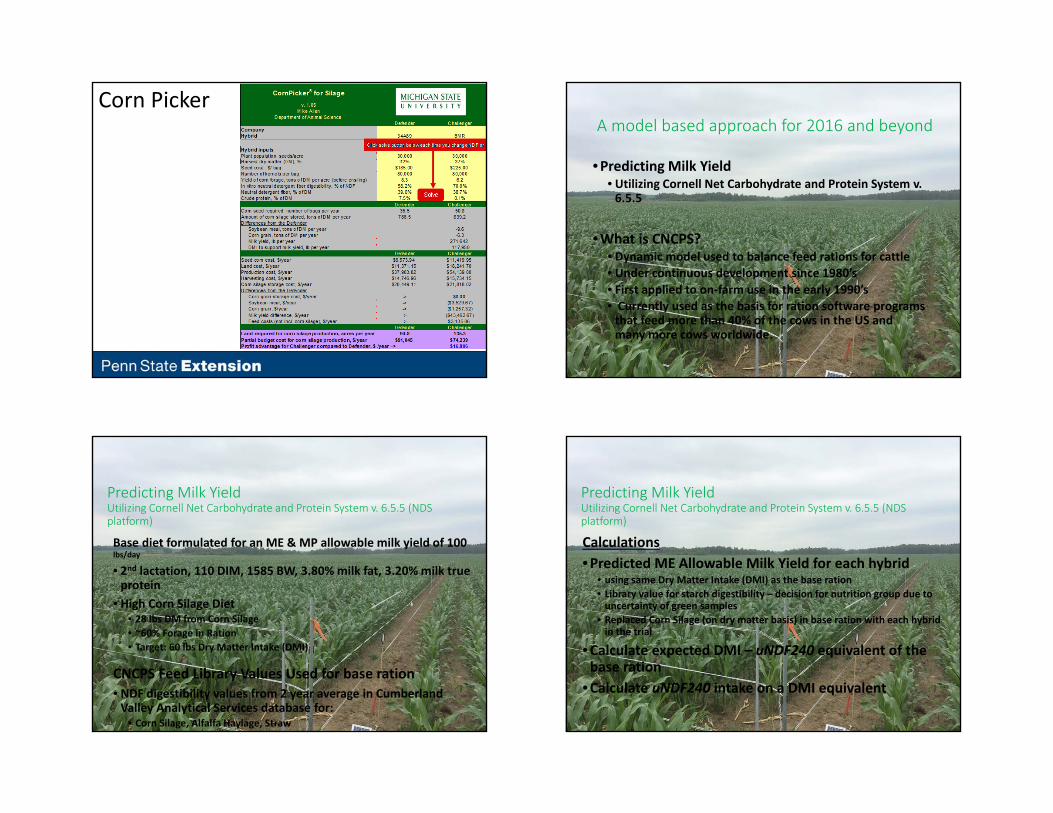
Corn PickerA model based approach for 2016 and beyond
•Predicting Milk Yield• Utilizing Cornell Net Carbohydrate and Protein System v. 6.5.5
•What is CNCPS?• Dynamic model used to balance feed rations for cattle• Under continuous development since 1980’s• First applied to on‐farm use in the early 1990’s• Currently used as the basis for ration software programs that feed more than 40% of the cows in the US and many more cows worldwide.
Predicting Milk YieldUtilizing Cornell Net Carbohydrate and Protein System v. 6.5.5 (NDS platform)
Base diet formulated for an ME & MP allowable milk yield of 100 lbs/day
• 2nd lactation, 110 DIM, 1585 BW, 3.80% milk fat, 3.20% milk true protein
• High Corn Silage Diet• 28 lbs DM from Corn Silage• ~60% Forage in Ration• Target: 60 lbs Dry Matter Intake (DMI)
CNCPS Feed Library Values Used for base ration• NDF digestibility values from 2 year average in Cumberland Valley Analytical Services database for:
• Corn Silage, Alfalfa Haylage, Straw
Predicting Milk YieldUtilizing Cornell Net Carbohydrate and Protein System v. 6.5.5 (NDS platform)
Calculations•Predicted ME Allowable Milk Yield for each hybrid
• using same Dry Matter Intake (DMI) as the base ration• Library value for starch digestibility – decision for nutrition group due to uncertainty of green samples
• Replaced Corn Silage (on dry matter basis) in base ration with each hybrid in the trial
•Calculate expected DMI – uNDF240 equivalent of the base ration
•Calculate uNDF240 intake on a DMI equivalent
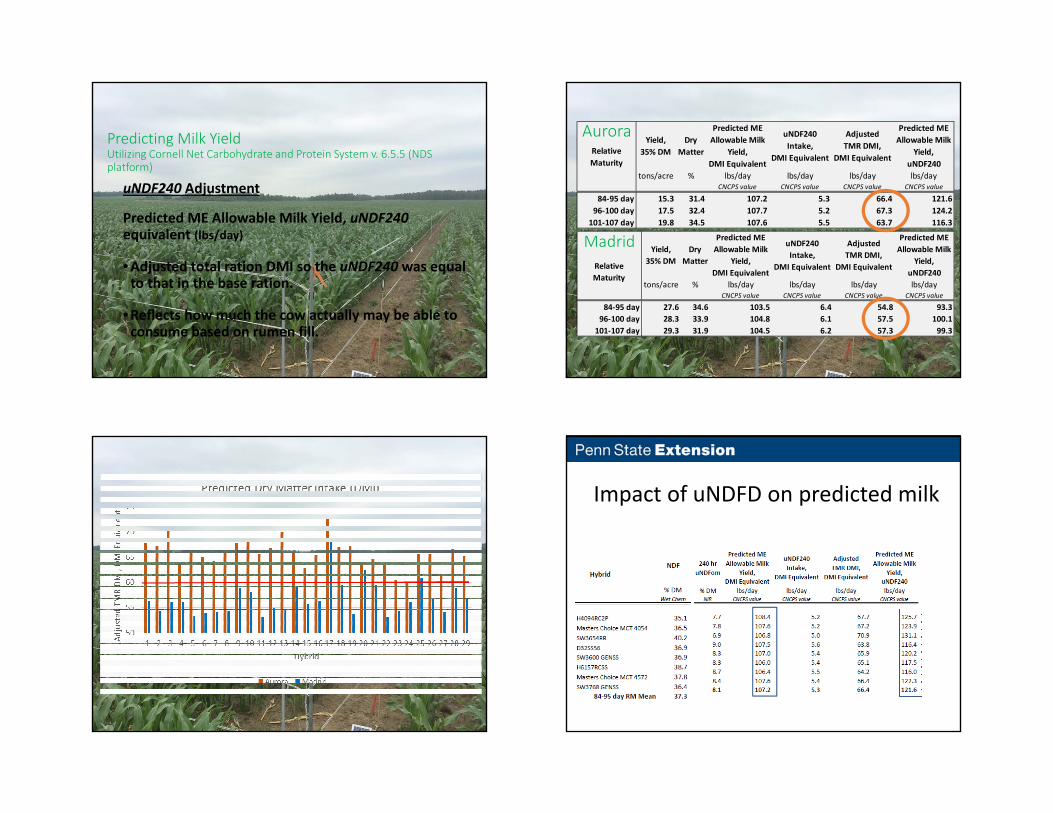
Predicting Milk YieldUtilizing Cornell Net Carbohydrate and Protein System v. 6.5.5 (NDS platform)
uNDF240 Adjustment
Predicted ME Allowable Milk Yield, uNDF240equivalent (lbs/day)
•Adjusted total ration DMI so the uNDF240 was equal to that in the base ration.
•Reflects how much the cow actually may be able to consume based on rumen fill.
Yield, 35% DM
Dry Matter
Predicted ME Allowable Milk
Yield, DMI Equivalent
uNDF240 Intake,
DMI Equivalent
Adjusted TMR DMI,
DMI Equivalent
Predicted ME Allowable Milk
Yield, uNDF240
tons/acre % lbs/day lbs/day lbs/day lbs/dayCNCPS value CNCPS value CNCPS value CNCPS value
84‐95 day 15.3 31.4 107.2 5.3 66.4 121.696‐100 day 17.5 32.4 107.7 5.2 67.3 124.2101‐107 day 19.8 34.5 107.6 5.5 63.7 116.3
Relative Maturity
Aurora
Yield, 35% DM
Dry Matter
Predicted ME Allowable Milk
Yield, DMI Equivalent
uNDF240 Intake,
DMI Equivalent
Adjusted TMR DMI,
DMI Equivalent
Predicted ME Allowable Milk
Yield, uNDF240
tons/acre % lbs/day lbs/day lbs/day lbs/dayCNCPS value CNCPS value CNCPS value CNCPS value
84‐95 day 27.6 34.6 103.5 6.4 54.8 93.396‐100 day 28.3 33.9 104.8 6.1 57.5 100.1101‐107 day 29.3 31.9 104.5 6.2 57.3 99.3
Relative Maturity
Madrid
Impact of uNDFD on predicted milk

Interpretation: Conclusions• Model based approach has merit and can incorporate more advanced measurements
• Need to do more validation of intake and milk differences with animal data
• Need a method to adapt to more of a spreadsheet format to facilitate data processing
40
45
50
55
60
65
70
75
Chester Lancaster Juniata
BMR10B27RA
P1180XR
BMR12B75
P1449AMX
BMR14B96
BMR Study: NDFD
NDF
d24
hou
r %
15
17
19
21
23
25
27
29
Chester Lancaster Juniata
BMR10B27RAP1180XRBMR12B75P1449AMXBMR14B96
BMR Study: uNDF
High NDFD, Low uNDF
High NDFD, Medium uNDF
Summary• There is a need for some updating in our assessment of hybrids to reflect current issues in dairy nutrition
• Some development of approaches is necessary and underway
• Working together we hope to develop some consistency and better collaboration
• Testing programs can be more than just hybrid evaluation