Embed Size (px)
Citation preview
Significant Industries A Report to the Workforce Development System
The New York State Department of Labor is an Equal Opportunity Employer/Program. Auxiliary aids and services are available upon request to individuals with disabilities.
Western New York | 2015
9/15
1
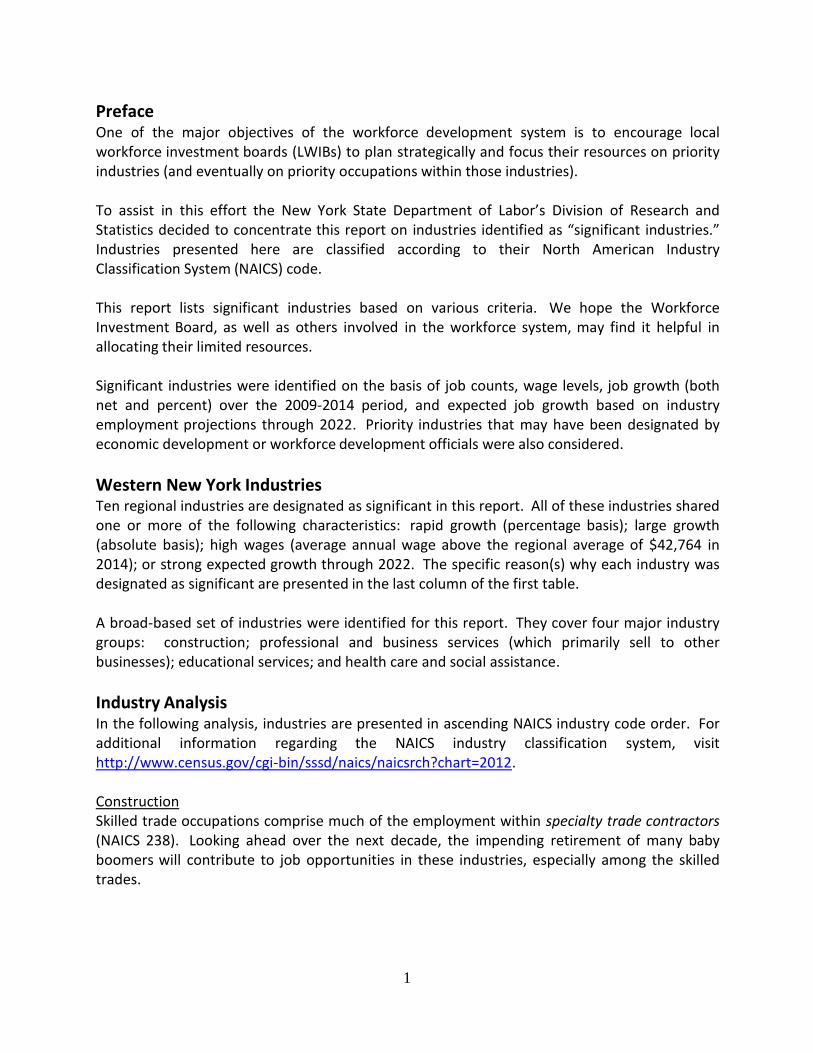
Preface One of the major objectives of the workforce development system is to encourage local workforce investment boards (LWIBs) to plan strategically and focus their resources on priority industries (and eventually on priority occupations within those industries).
To assist in this effort the New York State Department of Labor’s Division of Research and Statistics decided to concentrate this report on industries identified as “significant industries.” Industries presented here are classified according to their North American Industry Classification System (NAICS) code.
This report lists significant industries based on various criteria. We hope the Workforce Investment Board, as well as others involved in the workforce system, may find it helpful in allocating their limited resources. Significant industries were identified on the basis of job counts, wage levels, job growth (both net and percent) over the 2009-2014 period, and expected job growth based on industry employment projections through 2022. Priority industries that may have been designated by economic development or workforce development officials were also considered.
Western New York Industries Ten regional industries are designated as significant in this report. All of these industries shared one or more of the following characteristics: rapid growth (percentage basis); large growth (absolute basis); high wages (average annual wage above the regional average of $42,764 in 2014); or strong expected growth through 2022. The specific reason(s) why each industry was designated as significant are presented in the last column of the first table.
A broad-based set of industries were identified for this report. They cover four major industry groups: construction; professional and business services (which primarily sell to other businesses); educational services; and health care and social assistance.
Industry Analysis In the following analysis, industries are presented in ascending NAICS industry code order. For additional information regarding the NAICS industry classification system, visit http://www.census.gov/cgi-bin/sssd/naics/naicsrch?chart=2012. Construction Skilled trade occupations comprise much of the employment within specialty trade contractors (NAICS 238). Looking ahead over the next decade, the impending retirement of many baby boomers will contribute to job opportunities in these industries, especially among the skilled trades.
2
Leisure and Hospitality (Tourism) The leisure and hospitality services sector has three representatives on the significant industries list. They are: food services and drinking places (NAICS 722); accommodation (NAICS 721); and amusements, gambling and recreation industries (NAICS 713). All three were among the top ten industries adding jobs in the region over the past five years. This trend will continue as major investments are taking place throughout the region like HarborCenter, Canalside and RiverWorks. Along with these entertainment venues, almost 20 new hotels will be opening over the next few years. Manufacturing Three manufacturing industries made the list. Transportation equipment manufacturing (NAICS Industry 336) and machinery manufacturing (NAICS Industry 333) have both rebounded from the recession adding a combined 1,800 jobs from 2009 to 2014. As with construction, the aging of the baby boomers will lead to a significant number of openings, particularly among skilled trade workers due to retirements. Computer and electronic product manufacturing (NAICS Industry 334) remained unchanged from 2009 to 2014; but the opening of the SolarCity photovoltaic panel facility will almost double the number of local jobs in computer and electronic product manufacturing over the next few years.
Health Care Growth in health care industry employment is driven more by demographics than by overall economic conditions. Almost all health care occupations are expected to be in demand over the next decade as the population continues to age. The health care sector consists of three main components. Each appears on the significant industry list.
Ambulatory health care services (NAICS 621) Hospitals (NAICS 622)
Nursing and residential care facilities (NAICS 623)
For Further Information It is hoped that the members of the workforce system find the information in this report useful. The New York State Department of Labor’s Western New York labor market analyst, John Slenker, is available for consultation. He can be reached via email at [email protected] or by phone at (716) 851-2740.
The statewide report entitled “Significant Industries in New York: A Report to the Workforce Development System” may be found athttp://www.labor.ny.gov/stats/Significant-Industries.shtm.

3
Significant Industries, Western New York Region, 2015
NAICS Industry Code
Industry Name Job Count Net Change
in Jobs, 2009-2014
% Change in Jobs,
2009-2014
Average Annual Wage,
2014
Projected % Change in
Jobs, 2012-2022
Why Industry is
Significant** 2009* 2014*
Total, all industries (all ownerships) 613,100 622,500 9,300 1.5% $42,764 7.5% NA
238 Specialty Trade Contractors 14,800 15,700 900 6.1% $50,619 18.2% G,P, W, J
333 Machinery Manufacturing 8,300 9,400 1,100 13.3% $63,672 -3.2% W, G, J
334 Computer and Electronic Manufacturing 3,400 3,400 0 0.0% $55,962 -4.5% W
336 Transportation Equipment Manufacturing 4,600 5,300 700 15.2% $75,929 -19.4% W, G
621 Ambulatory Health Care Services 27,500 29,400 1,900 6.9% $50,838 24.3% G, W, J, P
622 Hospitals 27,900 26,200 -1,700 -6.1% $54,342 -1.4% J, W
623 Nursing and Residential Care Facilities 26,500 25,300 -1,200 -4.5% $27,623 17.8% J, P
713 Amusements, gambling, and recreation 9,400 10,200 800 8.5% $15,786 32.7% J, G, P
721 Accommodation 5,100 6,100 1,000 19.6% $18,283 8.6% G,P
722 Food services and drinking places 46,300 52,000 5,700 12.3% $15,646 20.2% G,P,J
NA – Not Applicable *Represents both private and public sector jobs
**Key: G: Industry experienced above-average job growth; can be net or percentage growth.
J: Industry employs a significant number of jobs (>8,000).
P: Above-average growth projected for 2012-2022. W: Industry pays above-average wages.
4
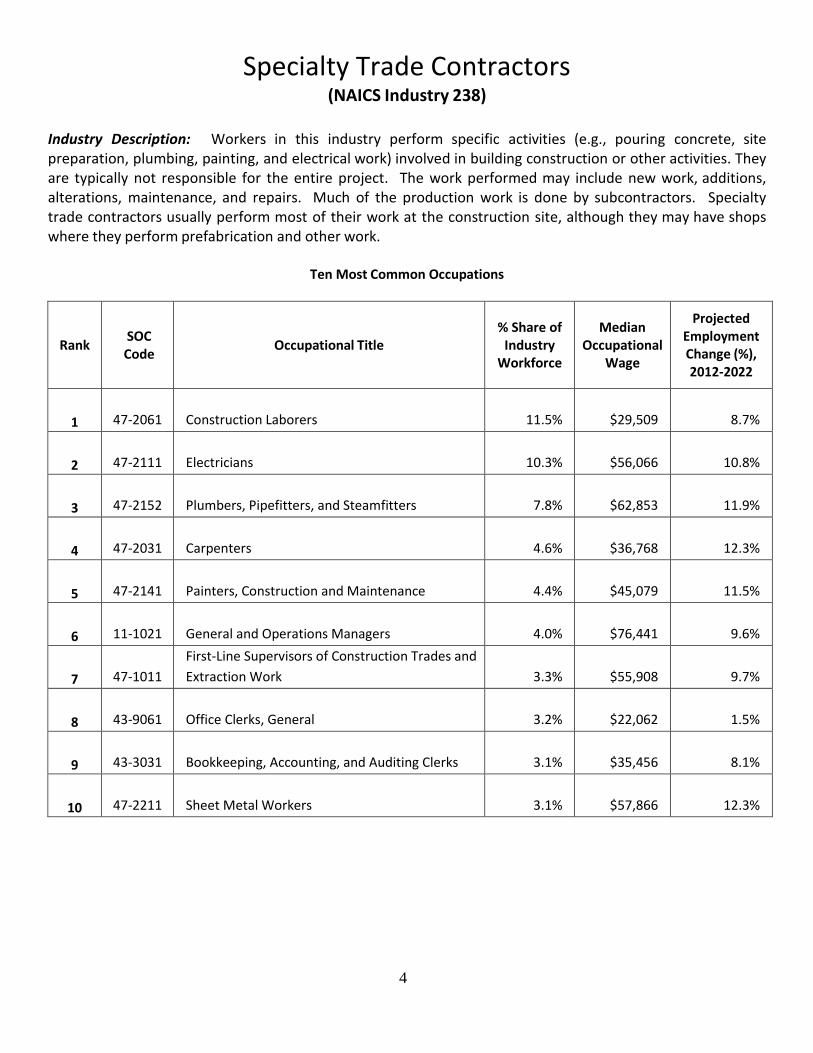
Specialty Trade Contractors (NAICS Industry 238)
Industry Description: Workers in this industry perform specific activities (e.g., pouring concrete, site preparation, plumbing, painting, and electrical work) involved in building construction or other activities. They are typically not responsible for the entire project. The work performed may include new work, additions, alterations, maintenance, and repairs. Much of the production work is done by subcontractors. Specialty trade contractors usually perform most of their work at the construction site, although they may have shops where they perform prefabrication and other work.
Ten Most Common Occupations
Rank SOC Code
Occupational Title % Share of
Industry Workforce
Median Occupational
Wage
Projected Employment Change (%), 2012-2022
1 47-2061 Construction Laborers 11.5% $29,509 8.7%
2 47-2111 Electricians 10.3% $56,066 10.8%
3 47-2152 Plumbers, Pipefitters, and Steamfitters 7.8% $62,853 11.9%
4 47-2031 Carpenters 4.6% $36,768 12.3%
5 47-2141 Painters, Construction and Maintenance 4.4% $45,079 11.5%
6 11-1021 General and Operations Managers 4.0% $76,441 9.6%
7 47-1011
First-Line Supervisors of Construction Trades and
Extraction Work 3.3% $55,908 9.7%
8 43-9061 Office Clerks, General 3.2% $22,062 1.5%
9 43-3031 Bookkeeping, Accounting, and Auditing Clerks 3.1% $35,456 8.1%
10 47-2211 Sheet Metal Workers 3.1% $57,866 12.3%
5
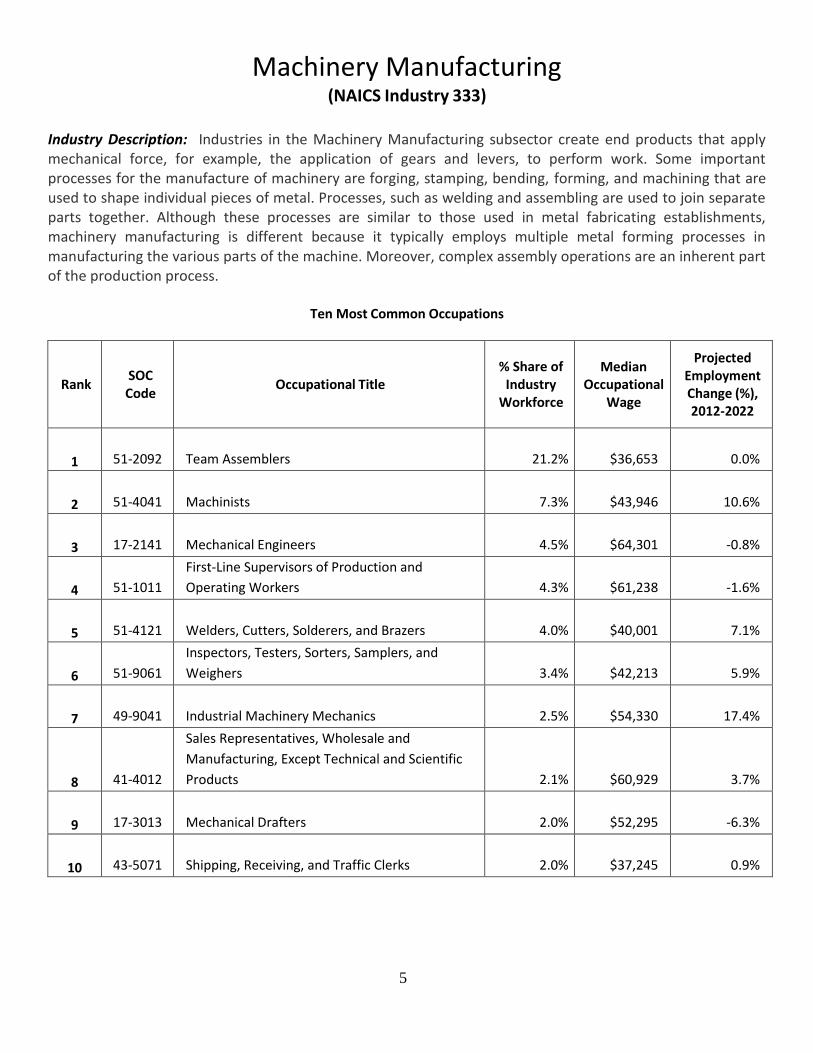
Machinery Manufacturing (NAICS Industry 333)
Industry Description: Industries in the Machinery Manufacturing subsector create end products that apply mechanical force, for example, the application of gears and levers, to perform work. Some important processes for the manufacture of machinery are forging, stamping, bending, forming, and machining that are used to shape individual pieces of metal. Processes, such as welding and assembling are used to join separate parts together. Although these processes are similar to those used in metal fabricating establishments, machinery manufacturing is different because it typically employs multiple metal forming processes in manufacturing the various parts of the machine. Moreover, complex assembly operations are an inherent part of the production process.
Ten Most Common Occupations
Rank SOC Code
Occupational Title % Share of
Industry Workforce
Median Occupational
Wage
Projected Employment Change (%), 2012-2022
1 51-2092 Team Assemblers 21.2% $36,653 0.0%
2 51-4041 Machinists 7.3% $43,946 10.6%
3 17-2141 Mechanical Engineers 4.5% $64,301 -0.8%
4 51-1011
First-Line Supervisors of Production and
Operating Workers 4.3% $61,238 -1.6%
5 51-4121 Welders, Cutters, Solderers, and Brazers 4.0% $40,001 7.1%
6 51-9061
Inspectors, Testers, Sorters, Samplers, and
Weighers 3.4% $42,213 5.9%
7 49-9041 Industrial Machinery Mechanics 2.5% $54,330 17.4%
8 41-4012
Sales Representatives, Wholesale and
Manufacturing, Except Technical and Scientific
Products 2.1% $60,929 3.7%
9 17-3013 Mechanical Drafters 2.0% $52,295 -6.3%
10 43-5071 Shipping, Receiving, and Traffic Clerks 2.0% $37,245 0.9%

6
Computer and Electronic Product Manufacturing (NAICS Industry 334)
Industry Description: Industries in the Computer and Electronic Product Manufacturing subsector group establishments that manufacture computers, computer peripherals, communications equipment, and similar electronic products, and establishments that manufacture components for such products. Their rapid growth suggests that they will become even more important to the economies of all three North American countries in the future, and in addition their manufacturing processes are fundamentally different from the manufacturing processes of other machinery and equipment. The design and use of integrated circuits and the application of highly specialized miniaturization technologies are common elements in the production technologies of the computer and electronic subsector. Convergence of technology motivates this NAICS subsector. Digitalization of sound recording, for example, causes both the medium (the compact disc) and the equipment to resemble the technologies for recording, storing, transmitting, and manipulating data. Communications technology and equipment have been converging with computer technology.
Ten Most Common Occupations
Rank SOC Code
Occupational Title % Share of
Industry Workforce
Median Occupational
Wage
Projected Employment Change (%), 2012-2022
1 51-2022 Electrical and Electronic Equipment Assemblers 14.4% $29,377 -1.9%
2 51-2092 Team Assemblers 10.8% $25,228 0.0%
3 51-2023 Electromechanical Equipment Assemblers 6.0% $42,018 -11.8%
4 51-4041 Machinists 5.7% $38,115 10.6%
5 51-9061
Inspectors, Testers, Sorters, Samplers, and
Weighers 3.6% $32,131 5.9%
6 51-1011
First-Line Supervisors of Production and
Operating Workers 3.3% $57,276 -1.6%
7 51-4011
Computer-Controlled Machine Tool Operators,
Metal and Plastic 3.3% $30,420 18.1%
8 17-2071 Electrical Engineers 3.0% $74,791 3.3%
9 17-3023 Electrical and Electronics Engineering Technicians 2.7% $38,680 2.1%
10 11-1021 General and Operations Managers 2.1% $116,265 9.6%
7
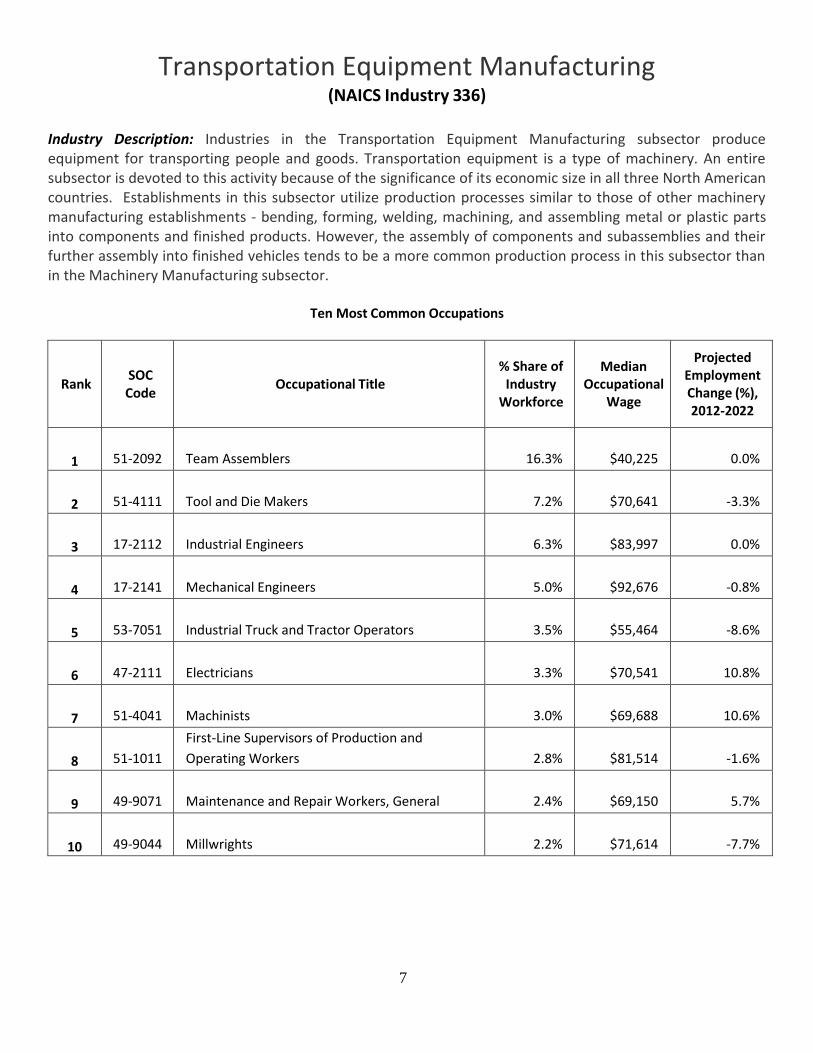
Transportation Equipment Manufacturing (NAICS Industry 336)
Industry Description: Industries in the Transportation Equipment Manufacturing subsector produce equipment for transporting people and goods. Transportation equipment is a type of machinery. An entire subsector is devoted to this activity because of the significance of its economic size in all three North American countries. Establishments in this subsector utilize production processes similar to those of other machinery manufacturing establishments - bending, forming, welding, machining, and assembling metal or plastic parts into components and finished products. However, the assembly of components and subassemblies and their further assembly into finished vehicles tends to be a more common production process in this subsector than in the Machinery Manufacturing subsector.
Ten Most Common Occupations
Rank SOC Code
Occupational Title % Share of
Industry Workforce
Median Occupational
Wage
Projected Employment Change (%), 2012-2022
1 51-2092 Team Assemblers 16.3% $40,225 0.0%
2 51-4111 Tool and Die Makers 7.2% $70,641 -3.3%
3 17-2112 Industrial Engineers 6.3% $83,997 0.0%
4 17-2141 Mechanical Engineers 5.0% $92,676 -0.8%
5 53-7051 Industrial Truck and Tractor Operators 3.5% $55,464 -8.6%
6 47-2111 Electricians 3.3% $70,541 10.8%
7 51-4041 Machinists 3.0% $69,688 10.6%
8 51-1011
First-Line Supervisors of Production and
Operating Workers 2.8% $81,514 -1.6%
9 49-9071 Maintenance and Repair Workers, General 2.4% $69,150 5.7%
10 49-9044 Millwrights 2.2% $71,614 -7.7%
8
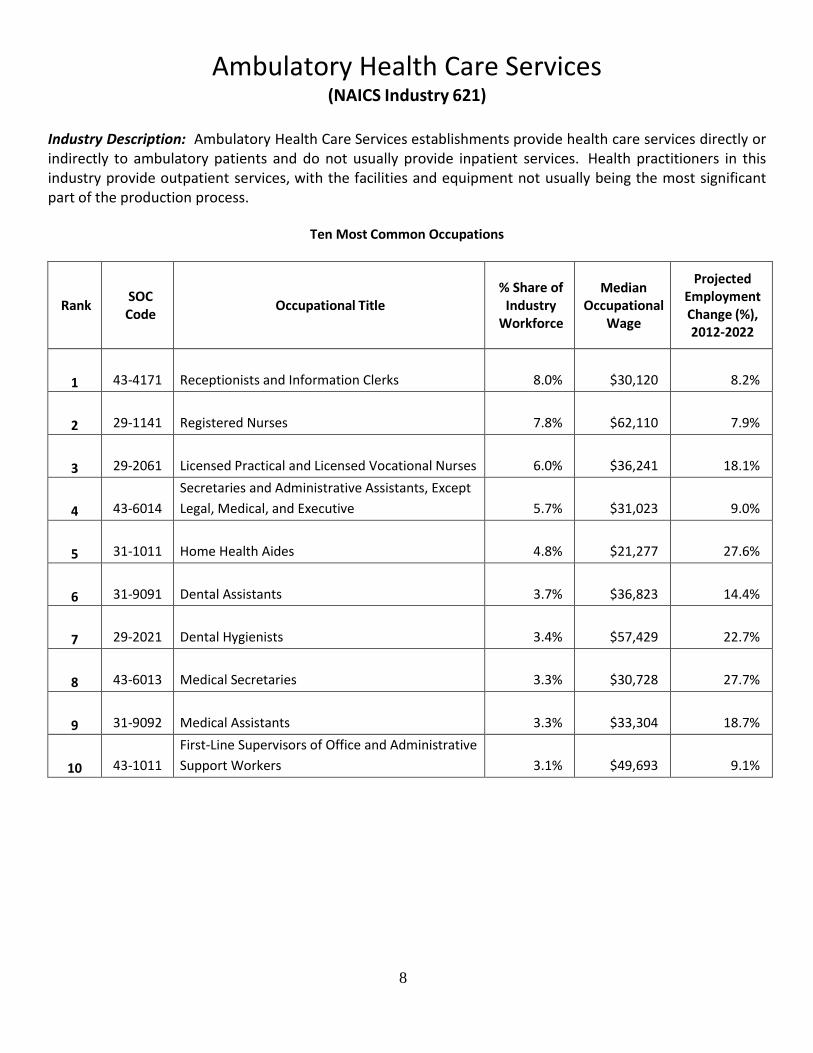
Ambulatory Health Care Services (NAICS Industry 621)
Industry Description: Ambulatory Health Care Services establishments provide health care services directly or indirectly to ambulatory patients and do not usually provide inpatient services. Health practitioners in this industry provide outpatient services, with the facilities and equipment not usually being the most significant part of the production process.
Ten Most Common Occupations
Rank SOC Code
Occupational Title % Share of
Industry Workforce
Median Occupational
Wage
Projected Employment Change (%), 2012-2022
1 43-4171 Receptionists and Information Clerks 8.0% $30,120 8.2%
2 29-1141 Registered Nurses 7.8% $62,110 7.9%
3 29-2061 Licensed Practical and Licensed Vocational Nurses 6.0% $36,241 18.1%
4 43-6014
Secretaries and Administrative Assistants, Except
Legal, Medical, and Executive 5.7% $31,023 9.0%
5 31-1011 Home Health Aides 4.8% $21,277 27.6%
6 31-9091 Dental Assistants 3.7% $36,823 14.4%
7 29-2021 Dental Hygienists 3.4% $57,429 22.7%
8 43-6013 Medical Secretaries 3.3% $30,728 27.7%
9 31-9092 Medical Assistants 3.3% $33,304 18.7%
10 43-1011
First-Line Supervisors of Office and Administrative
Support Workers 3.1% $49,693 9.1%
9
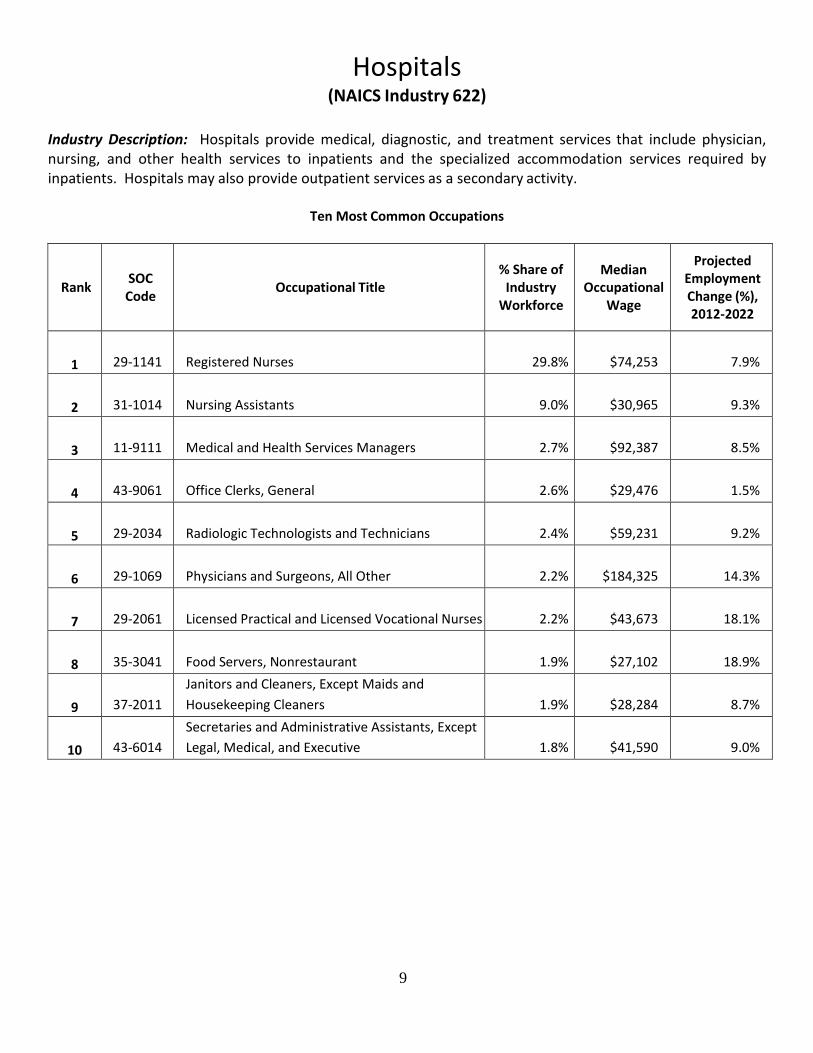
Hospitals (NAICS Industry 622)
Industry Description: Hospitals provide medical, diagnostic, and treatment services that include physician, nursing, and other health services to inpatients and the specialized accommodation services required by inpatients. Hospitals may also provide outpatient services as a secondary activity.
Ten Most Common Occupations
Rank SOC Code
Occupational Title % Share of
Industry Workforce
Median Occupational
Wage
Projected Employment Change (%), 2012-2022
1 29-1141 Registered Nurses 29.8% $74,253 7.9%
2 31-1014 Nursing Assistants 9.0% $30,965 9.3%
3 11-9111 Medical and Health Services Managers 2.7% $92,387 8.5%
4 43-9061 Office Clerks, General 2.6% $29,476 1.5%
5 29-2034 Radiologic Technologists and Technicians 2.4% $59,231 9.2%
6 29-1069 Physicians and Surgeons, All Other 2.2% $184,325 14.3%
7 29-2061 Licensed Practical and Licensed Vocational Nurses 2.2% $43,673 18.1%
8 35-3041 Food Servers, Nonrestaurant 1.9% $27,102 18.9%
9 37-2011
Janitors and Cleaners, Except Maids and
Housekeeping Cleaners 1.9% $28,284 8.7%
10 43-6014
Secretaries and Administrative Assistants, Except
Legal, Medical, and Executive 1.8% $41,590 9.0%

10
Nursing and Residential Care Facilities (NAICS Industry 623)
Industry Description: Nursing and Residential Care Facilities provide residential care combined with either nursing, supervisory, or other types of care as required by the residents. Here, the facilities are a significant part of the production process and the care provided is a mix of health and social services with the health services being largely some level of nursing services.
Ten Most Common Occupations
Rank SOC Code
Occupational Title % Share of
Industry Workforce
Median Occupational
Wage
Projected Employment Change (%), 2012-2022
1 31-1014 Nursing Assistants 17.7% $27,101 9.3%
2 39-9021 Personal Care Aides 13.9% $23,216 28.0%
3 31-1011 Home Health Aides 12.6% $22,825 27.6%
4 29-2061 Licensed Practical and Licensed Vocational Nurses 8.5% $38,765 18.1%
5 29-1141 Registered Nurses 5.3% $58,651 7.9%
6 37-2012 Maids and Housekeeping Cleaners 3.7% $21,450 9.6%
7 35-3041 Food Servers, Nonrestaurant 3.2% $20,505 18.9%
8 39-9032 Recreation Workers 1.7% $23,220 11.5%
9 35-2012 Cooks, Institution and Cafeteria 1.5% $24,572 9.8%
10 35-2021 Food Preparation Workers 1.5% $20,530 8.0%
11
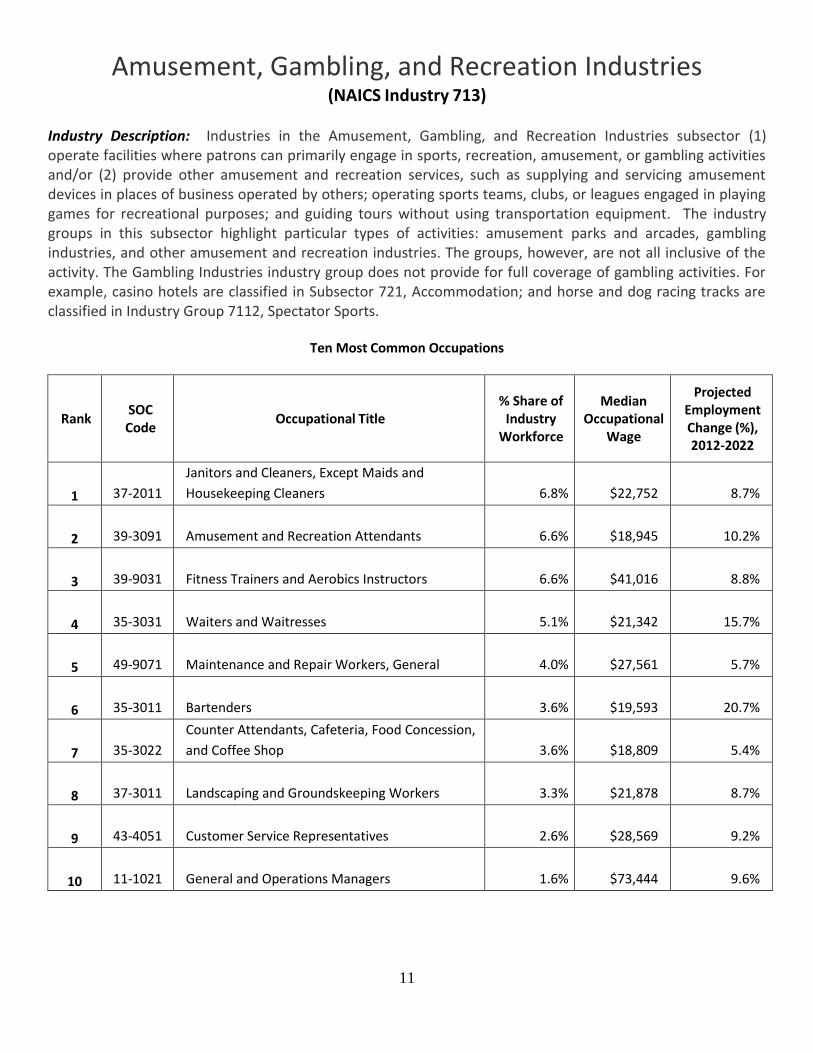
Amusement, Gambling, and Recreation Industries (NAICS Industry 713)
Industry Description: Industries in the Amusement, Gambling, and Recreation Industries subsector (1) operate facilities where patrons can primarily engage in sports, recreation, amusement, or gambling activities and/or (2) provide other amusement and recreation services, such as supplying and servicing amusement devices in places of business operated by others; operating sports teams, clubs, or leagues engaged in playing games for recreational purposes; and guiding tours without using transportation equipment. The industry groups in this subsector highlight particular types of activities: amusement parks and arcades, gambling industries, and other amusement and recreation industries. The groups, however, are not all inclusive of the activity. The Gambling Industries industry group does not provide for full coverage of gambling activities. For example, casino hotels are classified in Subsector 721, Accommodation; and horse and dog racing tracks are classified in Industry Group 7112, Spectator Sports.
Ten Most Common Occupations
Rank SOC Code
Occupational Title % Share of
Industry Workforce
Median Occupational
Wage
Projected Employment Change (%), 2012-2022
1 37-2011
Janitors and Cleaners, Except Maids and
Housekeeping Cleaners 6.8% $22,752 8.7%
2 39-3091 Amusement and Recreation Attendants 6.6% $18,945 10.2%
3 39-9031 Fitness Trainers and Aerobics Instructors 6.6% $41,016 8.8%
4 35-3031 Waiters and Waitresses 5.1% $21,342 15.7%
5 49-9071 Maintenance and Repair Workers, General 4.0% $27,561 5.7%
6 35-3011 Bartenders 3.6% $19,593 20.7%
7 35-3022
Counter Attendants, Cafeteria, Food Concession,
and Coffee Shop 3.6% $18,809 5.4%
8 37-3011 Landscaping and Groundskeeping Workers 3.3% $21,878 8.7%
9 43-4051 Customer Service Representatives 2.6% $28,569 9.2%
10 11-1021 General and Operations Managers 1.6% $73,444 9.6%

12
Accommodation (NAICS Industry 721)
Industry Description: Industries in the Accommodation subsector provide lodging or short-term accommodations for travelers, vacationers, and others. There is a wide range of establishments in these industries. Some provide lodging only; while others provide meals, laundry services, and recreational facilities, as well as lodging. Lodging establishments are classified in this subsector even if the provision of complementary services generates more revenue. The types of complementary services provided vary from establishment to establishment.
Ten Most Common Occupations
Rank SOC Code
Occupational Title % Share of
Industry Workforce
Median Occupational
Wage
Projected Employment Change (%), 2012-2022
1 37-2012 Maids and Housekeeping Cleaners 23.0% $18,967 9.6%
2 43-4081 Hotel, Motel, and Resort Desk Clerks 12.4% $19,040 12.8%
3 35-3031 Waiters and Waitresses 8.7% $19,452 15.7%
4 35-2014 Cooks, Restaurant 3.6% $23,503 26.3%
5 49-9071 Maintenance and Repair Workers, General 3.0% $26,959 5.7%
6 35-9021 Dishwashers 2.7% $18,763 15.1%
7 37-2011
Janitors and Cleaners, Except Maids and
Housekeeping Cleaners 2.6% $19,716 8.7%
8 43-1011
First-Line Supervisors of Office and Administrative
Support Workers 2.6% $31,099 9.1%
9 37-1011
First-Line Supervisors of Housekeeping and
Janitorial Workers 2.3% $33,019 8.8%
10 35-3021
Combined Food Preparation and Serving Workers,
Including Fast Food 2.0% $18,661 22.8%

13
Food Services and Drinking Places (NAICS Industry 722)
Industry Description: Industries in the Food Services and Drinking Places subsector prepare meals, snacks, and
beverages to customer order for immediate on-premises and off-premises consumption. There is a wide range
of establishments in these industries. Some provide food and drink only; while others provide various
combinations of seating space, waiter/waitress services and incidental amenities, such as limited
entertainment. The industries in the subsector are grouped based on the type and level of services provided.
The industry groups are special food services, such as food service contractors, caterers, and mobile food
services; drinking places; and restaurants and other eating places.
Ten Most Common Occupations
Rank SOC Code
Occupational Title % Share of
Industry Workforce
Median Occupational
Wage
Projected Employment Change (%), 2012-2022
1 35-3021
Combined Food Preparation and Serving Workers,
Including Fast Food 21.8% $18,773 22.8%
2 35-3031 Waiters and Waitresses 19.7% $19,091 15.7%
3 35-2014 Cooks, Restaurant 7.9% $23,795 26.3%
4 35-3011 Bartenders 6.3% $18,936 20.7%
5 35-2011 Cooks, Fast Food 5.9% $20,069 9.9%
6 35-1012
First-Line Supervisors of Food Preparation and
Serving Workers 5.4% $29,138 22.1%
7 35-9021 Dishwashers 5.3% $19,384 15.1%
8 35-2021 Food Preparation Workers 4.2% $20,061 8.0%
9 35-3022
Counter Attendants, Cafeteria, Food Concession,
and Coffee Shop 3.5% $19,301 5.4%
10 35-9031
Hosts and Hostesses, Restaurant, Lounge, and
Coffee Shop 2.8% $19,077 16.8%
This workforce product was funded by a grant awarded by the U.S. Department of Labor's
Employment and Training Administration. The product was created by the recipient and does
not necessarily reflect the official position of the U.S. Department of Labor. The Department of
Labor makes no guarantees, warranties, or assurances of any kind, express or implied, with
respect to such information, including any information on linked sites and including, but not
limited to, accuracy of the information or its completeness, timeliness, usefulness, adequacy,
continued availability, or ownership. This product is copyrighted by the institution that created
it. Internal use by an organization and/or personal use by an individual for non-commercial
purposes is permissible. All other uses require the prior authorization of the copyright owner.