Embed Size (px)
Citation preview
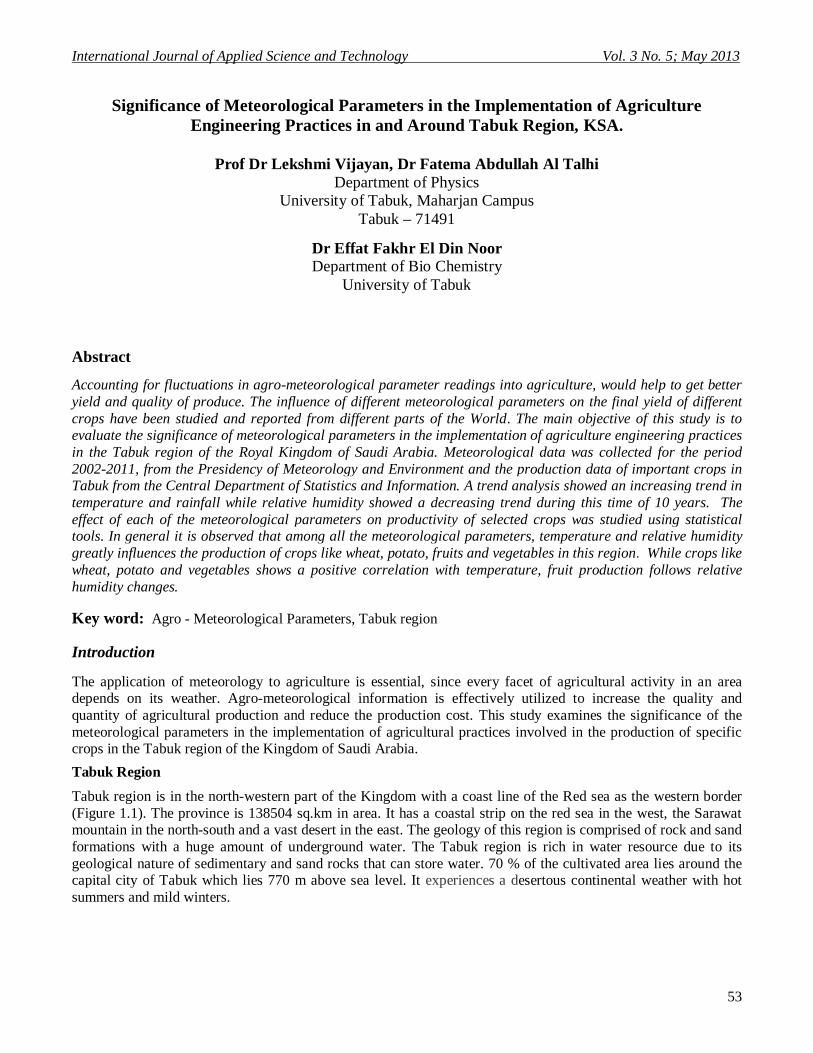
International Journal of Applied Science and Technology Vol. 3 No. 5; May 2013
53
Significance of Meteorological Parameters in the Implementation of Agriculture Engineering Practices in and Around Tabuk Region, KSA.
Prof Dr Lekshmi Vijayan, Dr Fatema Abdullah Al Talhi
Department of Physics University of Tabuk, Maharjan Campus
Tabuk – 71491
Dr Effat Fakhr El Din Noor Department of Bio Chemistry
University of Tabuk
Abstract Accounting for fluctuations in agro-meteorological parameter readings into agriculture, would help to get better yield and quality of produce. The influence of different meteorological parameters on the final yield of different crops have been studied and reported from different parts of the World. The main objective of this study is to evaluate the significance of meteorological parameters in the implementation of agriculture engineering practices in the Tabuk region of the Royal Kingdom of Saudi Arabia. Meteorological data was collected for the period 2002-2011, from the Presidency of Meteorology and Environment and the production data of important crops in Tabuk from the Central Department of Statistics and Information. A trend analysis showed an increasing trend in temperature and rainfall while relative humidity showed a decreasing trend during this time of 10 years. The effect of each of the meteorological parameters on productivity of selected crops was studied using statistical tools. In general it is observed that among all the meteorological parameters, temperature and relative humidity greatly influences the production of crops like wheat, potato, fruits and vegetables in this region. While crops like wheat, potato and vegetables shows a positive correlation with temperature, fruit production follows relative humidity changes. Key word: Agro - Meteorological Parameters, Tabuk region Introduction The application of meteorology to agriculture is essential, since every facet of agricultural activity in an area depends on its weather. Agro-meteorological information is effectively utilized to increase the quality and quantity of agricultural production and reduce the production cost. This study examines the significance of the meteorological parameters in the implementation of agricultural practices involved in the production of specific crops in the Tabuk region of the Kingdom of Saudi Arabia.
Tabuk Region
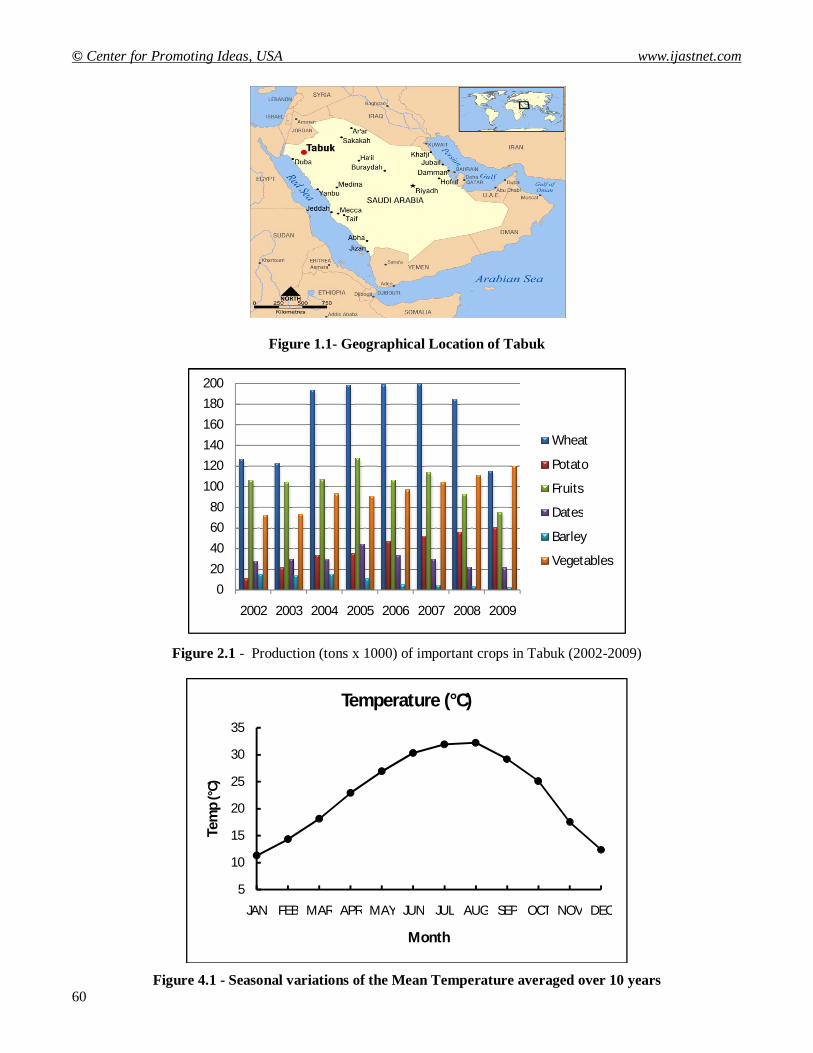
Tabuk region is in the north-western part of the Kingdom with a coast line of the Red sea as the western border (Figure 1.1). The province is 138504 sq.km in area. It has a coastal strip on the red sea in the west, the Sarawat mountain in the north-south and a vast desert in the east. The geology of this region is comprised of rock and sand formations with a huge amount of underground water. The Tabuk region is rich in water resource due to its geological nature of sedimentary and sand rocks that can store water. 70 % of the cultivated area lies around the capital city of Tabuk which lies 770 m above sea level. It experiences a desertous continental weather with hot summers and mild winters.
© Center for Promoting Ideas, USA www.ijastnet.com
54
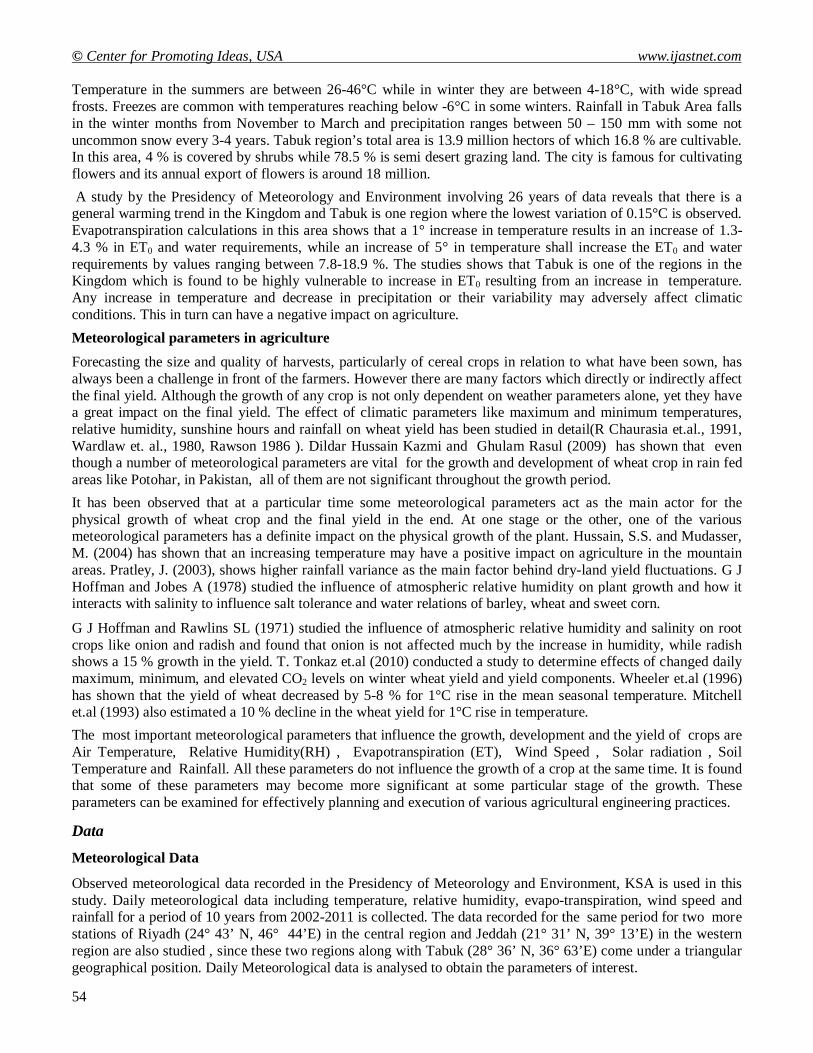
Temperature in the summers are between 26-46°C while in winter they are between 4-18°C, with wide spread frosts. Freezes are common with temperatures reaching below -6°C in some winters. Rainfall in Tabuk Area falls in the winter months from November to March and precipitation ranges between 50 – 150 mm with some not uncommon snow every 3-4 years. Tabuk region’s total area is 13.9 million hectors of which 16.8 % are cultivable. In this area, 4 % is covered by shrubs while 78.5 % is semi desert grazing land. The city is famous for cultivating flowers and its annual export of flowers is around 18 million.
A study by the Presidency of Meteorology and Environment involving 26 years of data reveals that there is a general warming trend in the Kingdom and Tabuk is one region where the lowest variation of 0.15°C is observed. Evapotranspiration calculations in this area shows that a 1° increase in temperature results in an increase of 1.3-4.3 % in ET0 and water requirements, while an increase of 5° in temperature shall increase the ET0 and water requirements by values ranging between 7.8-18.9 %. The studies shows that Tabuk is one of the regions in the Kingdom which is found to be highly vulnerable to increase in ET0 resulting from an increase in temperature. Any increase in temperature and decrease in precipitation or their variability may adversely affect climatic conditions. This in turn can have a negative impact on agriculture.
Meteorological parameters in agriculture
Forecasting the size and quality of harvests, particularly of cereal crops in relation to what have been sown, has always been a challenge in front of the farmers. However there are many factors which directly or indirectly affect the final yield. Although the growth of any crop is not only dependent on weather parameters alone, yet they have a great impact on the final yield. The effect of climatic parameters like maximum and minimum temperatures, relative humidity, sunshine hours and rainfall on wheat yield has been studied in detail(R Chaurasia et.al., 1991, Wardlaw et. al., 1980, Rawson 1986 ). Dildar Hussain Kazmi and Ghulam Rasul (2009) has shown that even though a number of meteorological parameters are vital for the growth and development of wheat crop in rain fed areas like Potohar, in Pakistan, all of them are not significant throughout the growth period.
It has been observed that at a particular time some meteorological parameters act as the main actor for the physical growth of wheat crop and the final yield in the end. At one stage or the other, one of the various meteorological parameters has a definite impact on the physical growth of the plant. Hussain, S.S. and Mudasser, M. (2004) has shown that an increasing temperature may have a positive impact on agriculture in the mountain areas. Pratley, J. (2003), shows higher rainfall variance as the main factor behind dry-land yield fluctuations. G J Hoffman and Jobes A (1978) studied the influence of atmospheric relative humidity on plant growth and how it interacts with salinity to influence salt tolerance and water relations of barley, wheat and sweet corn.
G J Hoffman and Rawlins SL (1971) studied the influence of atmospheric relative humidity and salinity on root crops like onion and radish and found that onion is not affected much by the increase in humidity, while radish shows a 15 % growth in the yield. T. Tonkaz et.al (2010) conducted a study to determine effects of changed daily maximum, minimum, and elevated CO2 levels on winter wheat yield and yield components. Wheeler et.al (1996) has shown that the yield of wheat decreased by 5-8 % for 1°C rise in the mean seasonal temperature. Mitchell et.al (1993) also estimated a 10 % decline in the wheat yield for 1°C rise in temperature.
The most important meteorological parameters that influence the growth, development and the yield of crops are Air Temperature, Relative Humidity(RH) , Evapotranspiration (ET), Wind Speed , Solar radiation , Soil Temperature and Rainfall. All these parameters do not influence the growth of a crop at the same time. It is found that some of these parameters may become more significant at some particular stage of the growth. These parameters can be examined for effectively planning and execution of various agricultural engineering practices.
Data
Meteorological Data
Observed meteorological data recorded in the Presidency of Meteorology and Environment, KSA is used in this study. Daily meteorological data including temperature, relative humidity, evapo-transpiration, wind speed and rainfall for a period of 10 years from 2002-2011 is collected. The data recorded for the same period for two more stations of Riyadh (24° 43’ N, 46° 44’E) in the central region and Jeddah (21° 31’ N, 39° 13’E) in the western region are also studied , since these two regions along with Tabuk (28° 36’ N, 36° 63’E) come under a triangular geographical position. Daily Meteorological data is analysed to obtain the parameters of interest.
International Journal of Applied Science and Technology Vol. 3 No. 5; May 2013
55
From the daily data, the monthly averages showing the seasonal variations for surface meteorological parameters like temperature (C°), relative humidity (%), wind speed (m/s) and precipitation (mm) and the annual mean indicating the yearly variations are calculated. For temperature and relative humidity, the temporal trends show significant spatial dependence. This is been observed in the comparison of data between the three stations of Tabuk, Riyadh and Jeddah.
Yield Data
The yield data which is used in this study is collected from the Central Department of Statistics and Information, KSA. Wheat is the leading crop in this region. Other produces include Barley, Potato, tomatoes and other vegetables, dates and various fruits like grapes, Fig, Pomegranate, apple, peach etc. Figure 2.1 shows the production of the important crops in Tons, in the Tabuk region for the years 2002- 2009.
Data Analysis
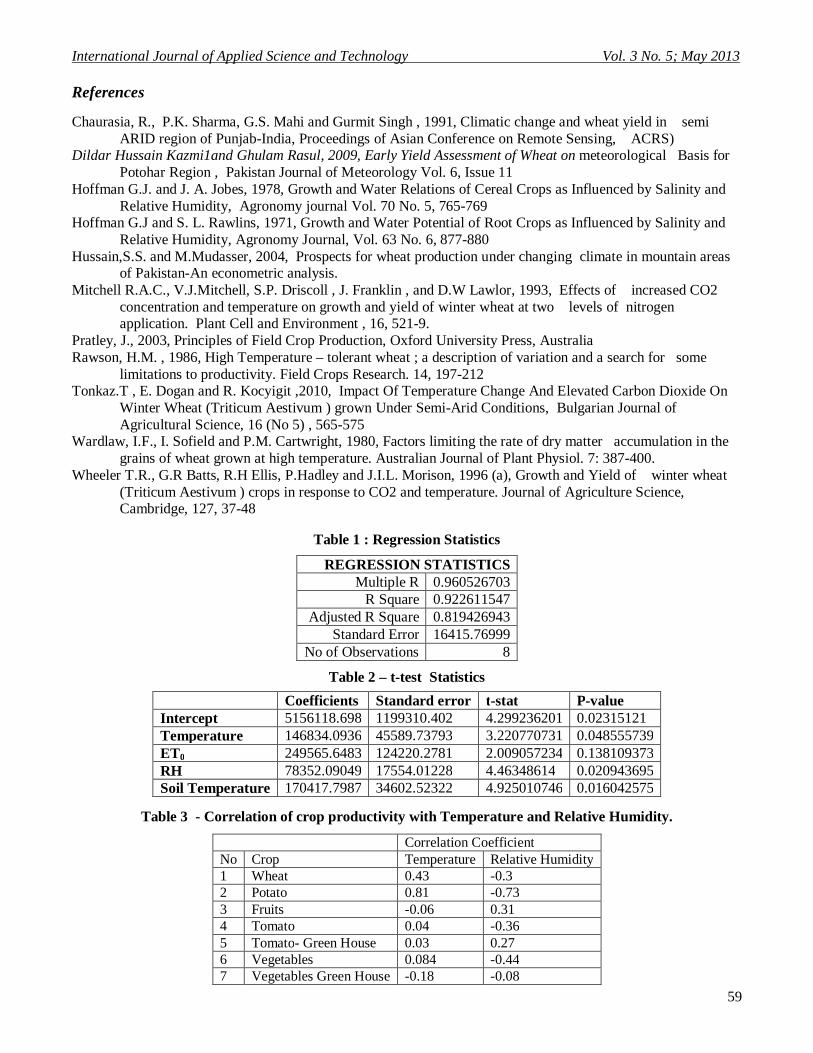
The approach used in this study is mainly statistical. Using the climate parameters as the independent variable and production as the dependent variable, regression analysis was done in order to find out the meteorological parameters that are significant enough to affect the crop production. Two significant levels of 5 % and 1 % are selected for a t-test. Even though 1 % significant level with a confidence level of 99 % is desirable, a 5 % significant level is selected since in agriculture we usually cannot have 99% accuracy with data. Table 1 and Table 2 give the statistical details.
From the above given t-test results it can be interpreted that relative humidity, air temperature, soil temperature together explains 81% of fluctuations in crop production in Tabuk region. This was further confirmed by correlation analysis between the production of specific crops and meteorological parameters. This finding is important as such mediating variables are to be carefully monitored for crop growth and quality. The same is being explained per crop in the coming discussions.
Results
Seasonal Variations of Meteorological Parameters
The temperature data was analysed to obtain the monthly absolute maximum, minimum and mean temperatures. The standard deviations of the monthly mean values from the average of the monthly mean for the 10 years were also computed. The standard deviation gives the year to year variations in the monthly mean. The highest value of the maximum temperature was observed in the month of August (39.6°C) with a standard deviation of 0.8°, which means that the maximum temperature varies between 40.4°C and 38.8°C over the 10 years of data used. The lowest value of maximum temperature was observed during January (18.5 °C). The lowest minimum temperature was observed during January (4.4°C) with a variation of ±1.5 °C over the 10 years while the highest value for minimum temperature was during August (24.6 °C) with a standard deviation of ±1.1°.
Figure 4.1 shows the seasonal variation of mean temperature in Tabuk for the time period of 10 years (2002-2011). The maximum mean temperature is observed during the month of August (32.2 °C) and the variation in the 10 years was within ±1° and the minimum temperature during January (11.3 °C) was within ±1.8°. Normally surface air temperature and precipitation are commonly used for climate change studies. In a country like Saudi Arabia, where the desert plants and trees mainly depend on atmospheric humidity for their survival, the studies on its variations and trends is very important.
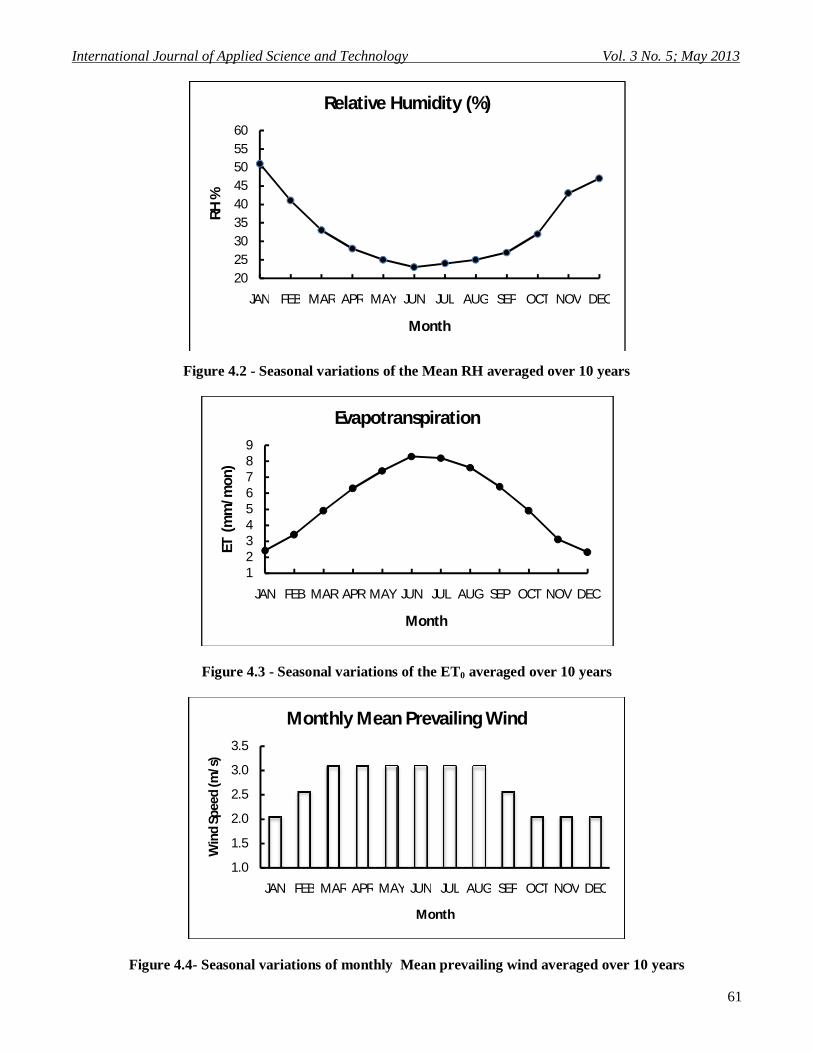
An analysis of the relative humidity shows that the highest value was observed during the months of lowest temperatures i.e., December and January, while the lowest values match with the months of highest temperatures (June-August). Figure 4.2 shows the seasonal variation of relative humidity in Tabuk. The month of January is the month of highest humidity with a peak value of (51 ± 7.6) %. There after it decreases to the minimum value of (23± 5.1) % during the month of June.
Seasonal variation of ET0 within a climatic region normally follows the seasonal trend of solar radiation and air temperature. Minimum ET rates occur during coldest months and maximum during summer. Figure 4.3 shows the seasonal variation of evaporation over the period under consideration. The maximum values are seen during the months of June and July, with a minimum value during the winter months of December and January.
© Center for Promoting Ideas, USA www.ijastnet.com
56
The prevailing wind speed (Figure 4.4) peaks in the month of March (3.1 m/s) which is the transition month from winter to summer and continues to be almost constant till the end of August. Again there is a change towards the lower side during the month of October which is the transition time from summer to winter. Almost 65 % of the year, the winds are blowing in the North-westerly direction.
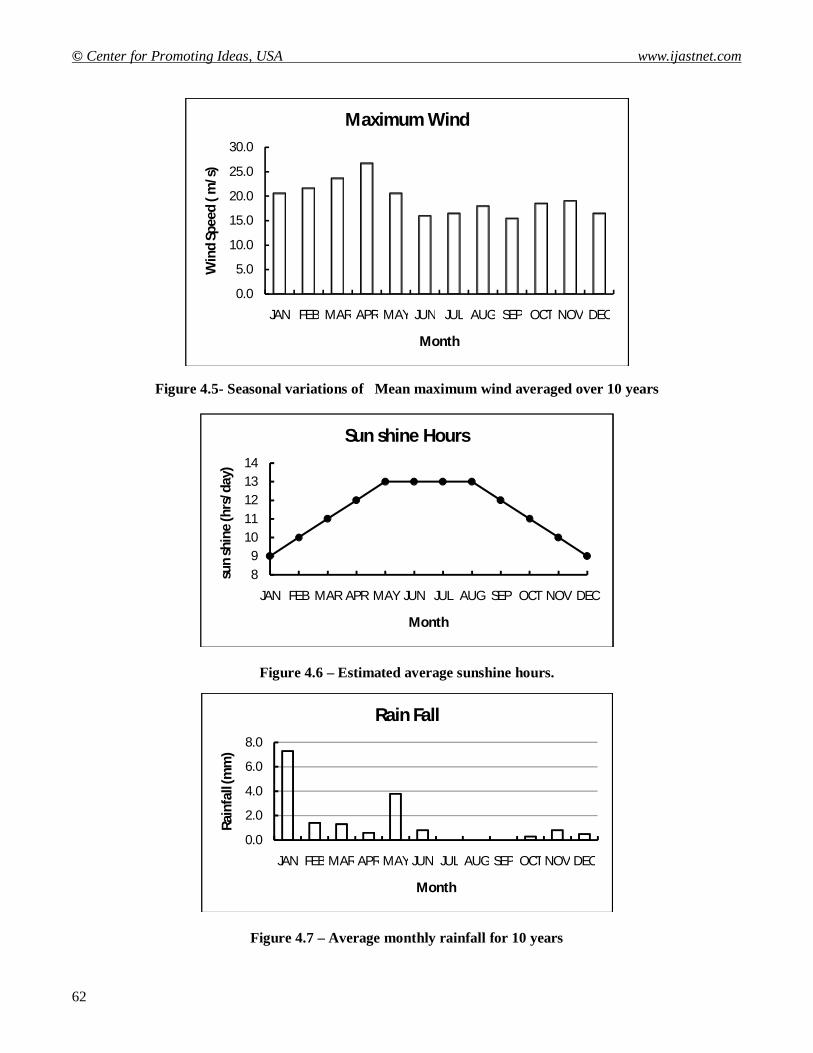
Figure 4.5 shows the mean monthly maximum wind speed. The highest mean maximum wind speed was observed during the month of April and was about 26.72 m/s. Solar radiation passing through the atmosphere is depleted by the scattering, reflection and absorption by the aerosols, water vapour, clouds and the ozone layer. The reflection of solar radiation is mainly by clouds and this reduces the density of the radiation reaching the surface of the earth. These variations in the intensity of solar radiation lead to the variation in the number of sunshine hours and its intensity at the surface.
Sun shine hours represent the average number of hours in the daytime that the sun is visible and not obscured by clouds, i.e. the average number of hours the sun is actually out and shining. It is one of the parameters used in estimating the solar radiation. Figure 4.6 shows the average sunshine hours/day in Tabuk estimated from forecast data over the years. Rainfall in Tabuk is found to occur mostly during the winter months, the peak average rainfall occurring in the month of January (7 mm) with a second peak in May (3.8mm). Figure 4.7 shows the average monthly rainfall for 10 years.
Trends in Annual Mean Of Meteorological Parameters
Trend of Temperature
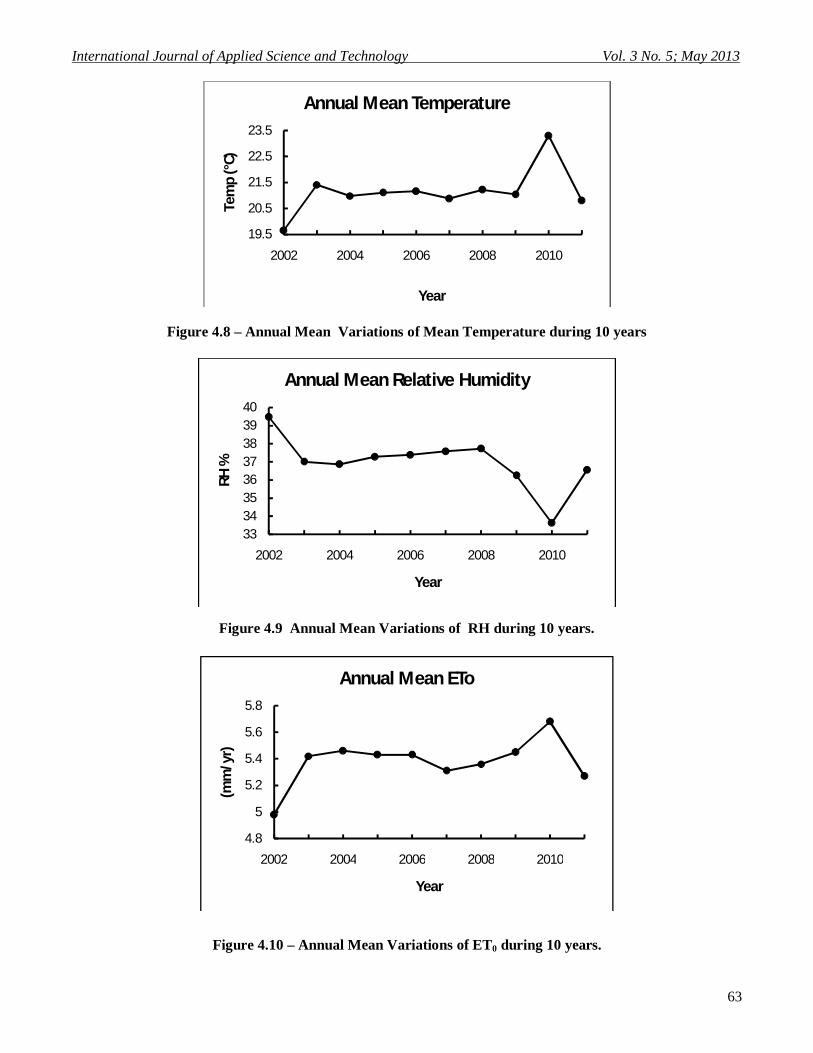
Data on temperature from 2002 to 2009 shows an overall increasing trend with a minimum of 19.7 ° C recorded in 2002 and a maximum of 23.3 ° C during 2010. Figure 4.8 depicts the annual variations of the mean temperature during the 10 years. The coefficient of correlation of temperature and time is 0.50 implying that temperature has a significant positive relationship with time. Therefore temperature changes has to be taken as a significant parameter in determining the agriculture outputs in future. The variations in temperature are rather smooth with time as can be seen from the figure, except during 2002-2003 and 2009-2010 where a steep increase was observed. The NOAA Climatological Data centre also has identified 2010 as the warmest of all the years since 2000 globally.
Trend in Relative Humidity
Relative Humidity records from Tabuk between 2002 and 2011 shows a decreasing trend with the highest value of 39.48 % recorded in 2002 and minimum value of 33.63 % in 2010. Figure 4.9 shows the annual mean of relative humidity during the 10 years. RH also exhibits a slow variability with time. The coefficient of correlation also shows a negative value (-0.64) indicating that there is a decrease in RH with time.
Trend in Evapo Transpiration
Figure 4.10 shows the yearly mean of ETO rate. ETO normally follows the temperature variations. Here also it shows an increasing trend with time with a correlation coefficient of 0.42. The peak value of 5.68 mm/yr was observed during 2010.
Trend in Rainfall
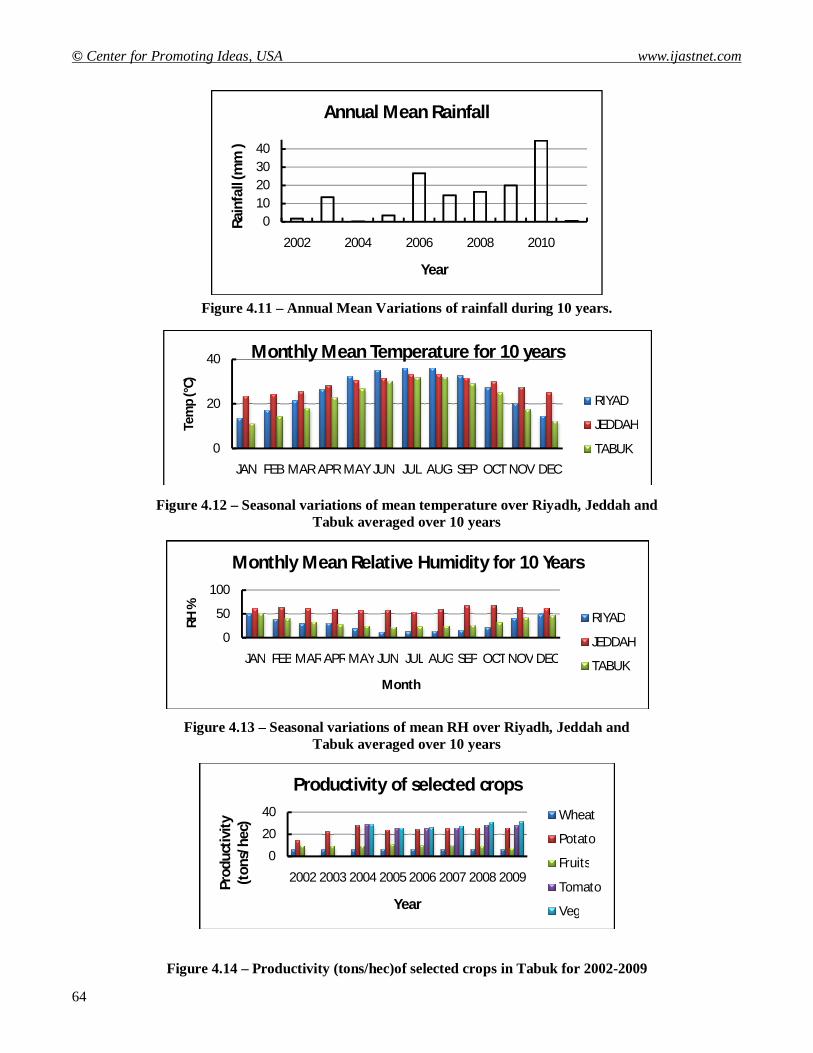
Statistical record of rainfall in Tabuk region shows an increasing trend with time with a positive correlation coefficient of 0.43. The annual mean rainfall shows a peak in the year 2010 with an average of 44.4 mm followed by the year 2006 with 26.6 mm. Extreme rainfall (24 hour) was observed during 2010 (38.8 mm), followed by 22.2 mm and 8 mm in 2 days in 2009. Figure 4.11 shows the variations in the annual mean rainfall in Tabuk.
Spatial Distribution of Meteorological Parameters
It has been seen that apart from the temporal variations, the meteorological parameters are showing a spatial variation also, especially in temperature and relative humidity.
Temperature - A comparison between the 3 stations Riyadh (24° 55’ N, 46° 43’ E), Jeddah (21°42’N, 39° 11’E) and Tabuk (28°22’ N, 36°36’E) is presented in Figure 4.12.The warm period is usually from April –September in all the 3 stations. The variations in the monthly mean temperature is found to be more in the interior region of Riyadh than along the coastal regions. July-August remains to be the months of highest temperature.
International Journal of Applied Science and Technology Vol. 3 No. 5; May 2013
57
During the summer months of May-September, the inland city of Riyadh shows maximum temperatures, while during other months, the coastal city of Jeddah shows peak values in temperature among the three.
Relative Humidity - Figure 4.13 shows the seasonal variation of relative humidity in the 3 stations. RH in general is maximum during the month of January in winter and minimum during the summer month of July. RH exhibits a maximum seasonal variation in the inland region of Riyadh, in comparison with the coastal city of Jeddah where it remains high all round the year. These differences in temperature and RH can be explained by the very dry nature of Riyadh and humid nature of Jeddah.
Productivity of selected crop
From the production data, the productivity i.e., production per unit area of selected crops are calculated and shown in Figure 4.14.
Discussion
The effect of variations in the meteorological parameters in the production of some specific crops in Tabuk is examined. Tabuk being a region of low rainfall in general, relative humidity become one of the important factors affecting the growth and yield of various crops. RH, soil temperature and then air temperature show significance among all the other meteorological parameters being measured (t-test statistics). This also notifies us to closely observe the relationship between these 3 parameters in production/productivity more than other parameters. The same observations apply for all the crops though its magnitude differs. Table 3 shows the correlation coefficient of different crops with temperature and relative humidity during the period under consideration.
Wheat
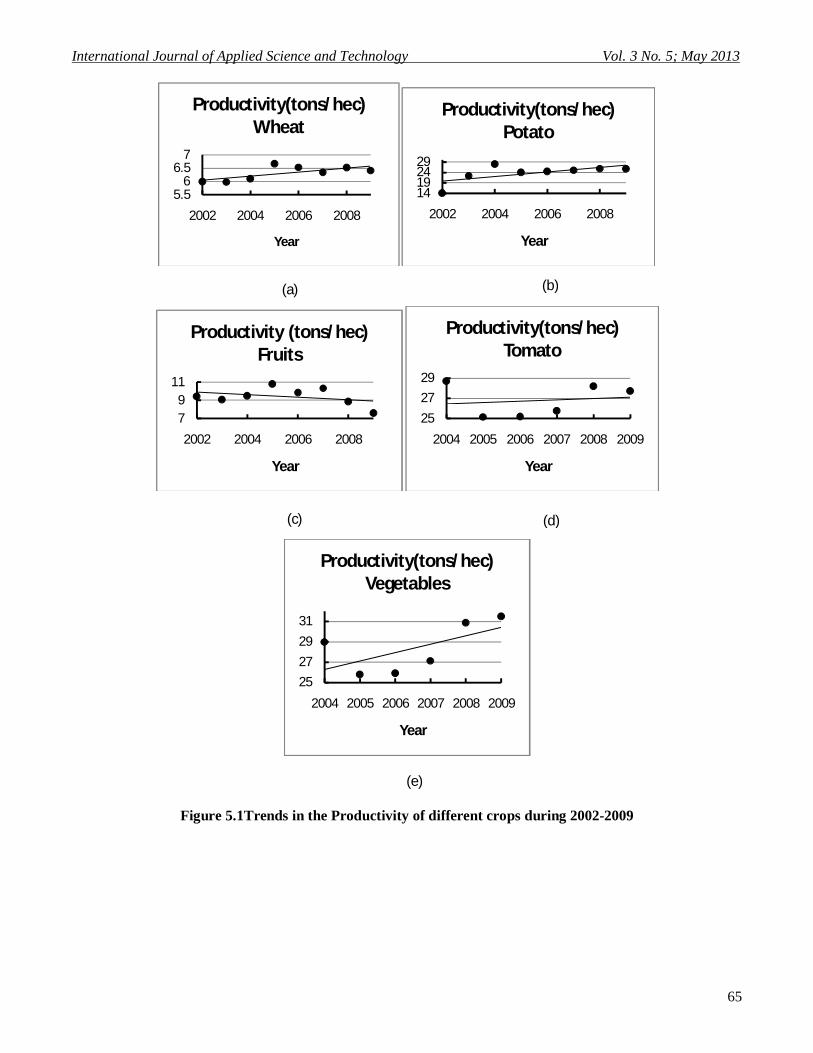
In general, the productivity of wheat was found to increase with time (Figure 5.1 a). A linear correlation between the productivity of wheat and annual mean temperature as well as relative humidity, shows that a positive correlation exists between productivity and temperature, while that with relative humidity shows a negative value. The productivity of Wheat has been nearly consistent over the years. Especially for a temperature sensitive crop like wheat, as has been reported in general, measures of temperature and the factors influencing the variations in temperature like relative humidity and rainfall play an important role. Though relative humidity can be seen nearly consistent, one can see that rainfall has been increasing discretely over the years. Therefore, farmers have to concentrate more on effectively controlling these parameters for enhanced productivity.
Potato
Being a steady vegetable by nature and with its semi-perishable character, potato would look easy for cultivation, but the facts are far from the truth. Potato is the most sensitive crop to moisture and temperature. However temperature variations are found to show a strong positive correlation (0.81) with the production of potato, while it is negatively correlated to RH variations. The importance of these environmental parameters on the crop is to be understood and applied on in order to get improved productivity. Productivity of potato also shows an increasing trend with time (Figure 5.1 b).
Tomato
Tomato, being a sensitive crop to moisture and heat burns, is often grown in greenhouses. However, it isn’t a sufficient enough reason to overlook the open lands under tomato cultivation. Since this crop is by nature sensitive, relative humidity and air temperature are two of the most important environmental parameters to be focused on by growers/farmers. The productivity of Tomato also shows an increasing trend over the years (Figure 5.1 d). The yield of tomato as an open field crop is found to show a weak positive correlation with the temperature variations, where as it shows a negative correlation with the relative humidity. However, tomatoes grown in green houses are found to follow the RH variations rather than temperature. RH is the most difficult of the green house conditions to control. The data supports the effect of this parameter on crop production and productivity and hence its significance in contributing to enhanced productivity and prosperity for the farmers.
Vegetables & Fruits
Apart from potato, fruits and vegetables are the most susceptible of horticulture crops in the world. Along with needing extreme care in the field, it also requires excellent postharvest care, all because of its high water content. This makes the crops easy prey to pests and diseases. Often the temperature and humidity parameters have to be closely monitored while adding water and other crop care measures.

© Center for Promoting Ideas, USA www.ijastnet.com
58
The productivity of fruits in the Tabuk region is found to have a decreasing trend with time, whereas vegetable production was showing an increasing trend (Figure 5.1 c &e). Through our study we have found relative humidity and temperature, both air and soil, to be very crucial for the crop growth. Fruit productivity is found to follow humidity changes where as vegetables are weakly correlated to temperature changes. However, along with temperature and RH, soil temperature also has to be monitored, which is often neglected after initial crop establishment.
Conclusions
This study is an initial attempt to understand the significance of meteorological parameters in implementing the different agricultural engineering practices and its influence on the productivity of different crops in and around Tabuk region. A statistical analysis of the meteorological parameters like temperature and rainfall over Tabuk show an increasing trend with little variation over time. However, the relative humidity was found to have a decreasing trend over the years. It was found that some of the meteorological parameters negatively affect the productivity of crops especially parameters like relative humidity and temperature. Air temperature is often taken into account while planning the crop but soil temperature is often overlooked as being compensated by adjustment in water supply and is neglected after initial crop establishment.
But this is not correct and soil temperature also has to be accounted for, while planning any agri. engineering practices. The most important point here is to understand the correlation between relative humidity and soil temperature and to find out how one influences the other. This aspect of study would have to be taken further to go deep into the moderating and mediation effects of these factors on productivity. A statistical significant relationship is found to exist between different meteorological parameters and crop yields. It can be concluded that meteorological parameters can affect the crop production either directly through their abnormal variations or indirectly through changes in soil quality, pests and other fungal diseases which is caused through the variations of parameters like temperature and relative humidity. This goes a long way showing up the importance climate to crop production.
Acknowledgements
The authors would like to thank the Deanship of Scientific Research, Tabuk University and his office for providing an opportunity and support to take up this research project. We acknowledge our gratitude to the office of the Presidency of Meteorology and Environment, Jeddah and Riyadh for providing the meteorological data and the Central Department of Statistics and Information, Jeddah for providing the agricultural yield data. We would like to mention special thanks to the Chamber of Commerce, Tabuk and Astra Farms for their contribution and support during the course of this research.
We appreciate the efforts and inputs given by Mr G Vijayan who is an agricultural consultant, for his valuable suggestions in critically analysing many areas of our research. We thank Ms Gowri Vijayan, who is doing her Doctoral Program in Agri Business Management with Universiti Putra Malaysia, for her valuable inputs in our research analysis. Last but not the least, the valuable support and interest shown by the agricultural farmers and farm-holdings in and around Tabuk region is an inspiration for any researcher who would like to take up further work in this field.
International Journal of Applied Science and Technology Vol. 3 No. 5; May 2013
59
References Chaurasia, R., P.K. Sharma, G.S. Mahi and Gurmit Singh , 1991, Climatic change and wheat yield in semi
ARID region of Punjab-India, Proceedings of Asian Conference on Remote Sensing, ACRS) Dildar Hussain Kazmi1and Ghulam Rasul, 2009, Early Yield Assessment of Wheat on meteorological Basis for
Potohar Region , Pakistan Journal of Meteorology Vol. 6, Issue 11 Hoffman G.J. and J. A. Jobes, 1978, Growth and Water Relations of Cereal Crops as Influenced by Salinity and
Relative Humidity, Agronomy journal Vol. 70 No. 5, 765-769 Hoffman G.J and S. L. Rawlins, 1971, Growth and Water Potential of Root Crops as Influenced by Salinity and
Relative Humidity, Agronomy Journal, Vol. 63 No. 6, 877-880 Hussain,S.S. and M.Mudasser, 2004, Prospects for wheat production under changing climate in mountain areas
of Pakistan-An econometric analysis. Mitchell R.A.C., V.J.Mitchell, S.P. Driscoll , J. Franklin , and D.W Lawlor, 1993, Effects of increased CO2
concentration and temperature on growth and yield of winter wheat at two levels of nitrogen application. Plant Cell and Environment , 16, 521-9.
Pratley, J., 2003, Principles of Field Crop Production, Oxford University Press, Australia Rawson, H.M. , 1986, High Temperature – tolerant wheat ; a description of variation and a search for some
limitations to productivity. Field Crops Research. 14, 197-212 Tonkaz.T , E. Dogan and R. Kocyigit ,2010, Impact Of Temperature Change And Elevated Carbon Dioxide On
Winter Wheat (Triticum Aestivum ) grown Under Semi-Arid Conditions, Bulgarian Journal of Agricultural Science, 16 (No 5) , 565-575
Wardlaw, I.F., I. Sofield and P.M. Cartwright, 1980, Factors limiting the rate of dry matter accumulation in the grains of wheat grown at high temperature. Australian Journal of Plant Physiol. 7: 387-400.
Wheeler T.R., G.R Batts, R.H Ellis, P.Hadley and J.I.L. Morison, 1996 (a), Growth and Yield of winter wheat (Triticum Aestivum ) crops in response to CO2 and temperature. Journal of Agriculture Science, Cambridge, 127, 37-48
Table 1 : Regression Statistics
REGRESSION STATISTICS Multiple R 0.960526703
R Square 0.922611547 Adjusted R Square 0.819426943
Standard Error 16415.76999 No of Observations 8
Table 2 – t-test Statistics
Coefficients Standard error t-stat P-value Intercept 5156118.698 1199310.402 4.299236201 0.02315121 Temperature 146834.0936 45589.73793 3.220770731 0.048555739 ET0 249565.6483 124220.2781 2.009057234 0.138109373 RH 78352.09049 17554.01228 4.46348614 0.020943695 Soil Temperature 170417.7987 34602.52322 4.925010746 0.016042575
Table 3 - Correlation of crop productivity with Temperature and Relative Humidity.
Correlation Coefficient No Crop Temperature Relative Humidity 1 Wheat 0.43 -0.3 2 Potato 0.81 -0.73 3 Fruits -0.06 0.31 4 Tomato 0.04 -0.36 5 Tomato- Green House 0.03 0.27 6 Vegetables 0.084 -0.44 7 Vegetables Green House -0.18 -0.08
© Center for Promoting Ideas, USA www.ijastnet.com
60
Figure 1.1- Geographical Location of Tabuk
Figure 2.1 - Production (tons x 1000) of important crops in Tabuk (2002-2009)
Figure 4.1 - Seasonal variations of the Mean Temperature averaged over 10 years
020406080
100120140160180200
2002 2003 2004 2005 2006 2007 2008 2009
Wheat
Potato
Fruits
Dates
Barley
Vegetables
5
10
15
20
25
30
35
JAN FEB MAR APR MAY JUN JUL AUG SEP OCT NOV DEC
Tem
p(°
C)
Month
Temperature (°C)
International Journal of Applied Science and Technology Vol. 3 No. 5; May 2013
61
Figure 4.2 - Seasonal variations of the Mean RH averaged over 10 years
Figure 4.3 - Seasonal variations of the ET0 averaged over 10 years
Figure 4.4- Seasonal variations of monthly Mean prevailing wind averaged over 10 years
202530354045505560
JAN FEB MAR APR MAY JUN JUL AUG SEP OCT NOV DEC
RH %
Month
Relative Humidity (%)
123456789
JAN FEB MAR APR MAY JUN JUL AUG SEP OCT NOV DEC
ET (
mm
/mon
)
Month
Evapotranspiration
1.0
1.5
2.0
2.5
3.0
3.5
JAN FEB MAR APR MAY JUN JUL AUG SEP OCT NOV DEC
Win
d Sp
eed
(m/s
)
Month
Monthly Mean Prevailing Wind
© Center for Promoting Ideas, USA www.ijastnet.com
62
Figure 4.5- Seasonal variations of Mean maximum wind averaged over 10 years
Figure 4.6 – Estimated average sunshine hours.
Figure 4.7 – Average monthly rainfall for 10 years
0.0
5.0
10.0
15.0
20.0
25.0
30.0
JAN FEB MAR APR MAY JUN JUL AUG SEP OCT NOV DEC
Win
d Sp
eed
( m/s
)
Month
Maximum Wind
89
1011121314
JAN FEB MAR APR MAY JUN JUL AUG SEP OCT NOV DEC
sun
shin
e (h
rs/d
ay)
Month
Sun shine Hours
0.0
2.0
4.0
6.0
8.0
JAN FEB MAR APR MAY JUN JUL AUG SEP OCT NOV DEC
Rain
fall
(mm
)
Month
Rain Fall
International Journal of Applied Science and Technology Vol. 3 No. 5; May 2013
63
Figure 4.8 – Annual Mean Variations of Mean Temperature during 10 years
Figure 4.9 Annual Mean Variations of RH during 10 years.
Figure 4.10 – Annual Mean Variations of ET0 during 10 years.
19.5
20.5
21.5
22.5
23.5
2002 2004 2006 2008 2010
Tem
p (°
C)
Year
Annual Mean Temperature
3334353637383940
2002 2004 2006 2008 2010
RH %
Year
Annual Mean Relative Humidity
4.8
5
5.2
5.4
5.6
5.8
2002 2004 2006 2008 2010
(mm
/yr)
Year
Annual Mean ETo
© Center for Promoting Ideas, USA www.ijastnet.com
64
Figure 4.11 – Annual Mean Variations of rainfall during 10 years.
Figure 4.12 – Seasonal variations of mean temperature over Riyadh, Jeddah and Tabuk averaged over 10 years
Figure 4.13 – Seasonal variations of mean RH over Riyadh, Jeddah and Tabuk averaged over 10 years
Figure 4.14 – Productivity (tons/hec)of selected crops in Tabuk for 2002-2009
010203040
2002 2004 2006 2008 2010Ra
infa
ll (m
m )
Year
Annual Mean Rainfall
0
20
40
JAN FEB MAR APR MAY JUN JUL AUG SEP OCT NOV DEC
Tem
p (°
C)
Monthly Mean Temperature for 10 years
RIYAD
JEDDAH
TABUK
0
50
100
JAN FEB MAR APR MAY JUN JUL AUG SEP OCT NOV DEC
RH %
Month
Monthly Mean Relative Humidity for 10 Years
RIYAD
JEDDAH
TABUK
0
20
40
2002 2003 2004 2005 2006 2007 2008 2009Prod
uctiv
ity
(ton
s/he
c)
Year
Productivity of selected crops Wheat
Potato
Fruits
Tomato
Veg
International Journal of Applied Science and Technology Vol. 3 No. 5; May 2013
65
Figure 5.1Trends in the Productivity of different crops during 2002-2009
5.56
6.57
2002 2004 2006 2008
Year
Productivity(tons/hec) Wheat
14192429
2002 2004 2006 2008
Year
Productivity(tons/hec) Potato
79
11
2002 2004 2006 2008
Year
Productivity (tons/hec) Fruits
252729
2004 2005 2006 2007 2008 2009
Year
Productivity(tons/hec) Tomato
25272931
2004 2005 2006 2007 2008 2009
Year
Productivity(tons/hec) Vegetables
(a) (b)
(d) (c)
(e)